CFD Simulation and Experimental Study of Working Process of Screw Refrigeration Compressor with R134a

1
School of Energy and Power Engineering, Xi’an Jiaotong University, Xi’an 710049, China
2
State Key Laboratory of Compressor Technology, Hefei 230001, China
*
Authors to whom correspondence should be addressed.
Energies 2019, 12(11), 2054; https://doi.org/10.3390/en12112054
Submission received: 2 April 2019
/
Revised: 6 May 2019
/
Accepted: 27 May 2019
/
Published: 29 May 2019
(This article belongs to the Special Issue Refrigeration Systems and Applications 2019)
Abstract
:Twin-screw refrigeration compressors have been widely used in many industry applications due to their unique advantages. The performance of twin-screw refrigeration compressors is generally predicted by one-dimensional numerical simulation or empirical methods; however, the above methods cannot obtain the distribution of the fluid pressure field and temperature field inside the compressor. In this paper, a three-dimensional model was established based on the experimental twin-screw refrigeration compressor. The internal flow field of the twin-screw compressor was simulated by computational fluid dynamics (CFD) software using structured dynamic grid technology. The flow and thermodynamic characteristics of the fluid inside the compressor were analyzed. The distribution of the internal pressure field, temperature field, and velocity field in the compressor were obtained. Comparing the P-θ indicator diagram and the performance parameters of the compressor with the experimental results, it was found that the results of the three-dimensional numerical simulation were consistent with the experimental data. The maximum error was up to 2.578% on the adiabatic efficiency at the partial load working condition. The accuracy of the 3D numerical simulation of the screw compressors was validated and a new method for predicting the performance of twin-screw refrigeration compressors was presented that will be helpful in their design.
1. Introduction
Compared with other kinds of compressors, twin-screw refrigeration compressors have the characteristics of a simple structure, less easily damaged parts, good running stability, and strong adaptability. They also occupy a large proportion of the market. At present, they are been widely used in central air conditioning systems for commercial buildings and residential buildings. The study of the thermodynamic performance of twin-screw refrigeration compressors is helpful in optimizing the performance of the compressor and finding out the optimum operating condition of the compressor unit. The rotor profile is the most important part in the design of the screw compressor. The working process of the twin-screw compressor is completed by the periodic meshing rotation of the helical tooth surface of the male and female rotors. The profile of the rotor determines the leakage characteristics and dynamic characteristics of the screw compressor. Good sealing and reasonable torque distribution are the basic principles of the rotor profile design. Contact line length, closed volume, inter-tooth area, and leaking triangle are the basic elements to measure the pros and cons of the profile design, and are also closely related to the airflow pulsation and thermal performance of the compressor [1].
Wu et al. [2] studied the effect of lubricating oil on the performance of twin-screw refrigeration compressors. Through mathematical models and experimental studies, it was found that the lubricating oil injection position, the oil injection flow rate, and the oil filling temperature all affected the performance of the compressor. The research provides theoretical support for optimizing lubricating oil distribution and improving the efficiency of twin-screw refrigeration compressors. Through the experimental study of rotor axial force under different operating conditions, Hou [3] proposed the mean pressure model and sector pressure model to calculate the axial force on the rotor end face. It was concluded that the sector pressure model was more accurate in predicting the axial force on the rotors in comparison with that of the mean pressure model. Moreover, the axial force on the rotor end face was found to have a larger influence than that on the rotor helical surface. Many scholars have proposed mathematical models for the working process of twin-screw refrigeration compressors [4,5]. These models fully consider the various leakage paths of the compressor, oil and gas heat transfer, power loss, etc., and can effectively predict the performance of the compressor. However, these mathematical models do not provide detailed information on the fluid flow inside the compressor.
With the rapid development of computer technology, CFD is widely used in the research of compressor performance, which can not only reduce expensive experiment costs, but also effectively reduce development time and shorten the development cycle. Due to the complex rotor shape of the twin-screw compressor, there is a very small gap in the machine, which makes the grid generation very difficult. Kovacevic et al. [6,7] introduced an advanced grid generation method and developed a completely original boundary adaptive program that can be applied to any rotor shape. This method can improve the accuracy of the simulation calculation, can better predict the performance of the compressor, and allows the design of such machinery to have a lower development cost. Rane et al. [8,9] proposed a new algebraic technique for generating a deformed grid of a screw compressor, which has the advantages of algebraic methods and differential methods. It introduced two control functions to regularize the initial algebraic distribution, which greatly improved the quality and distribution of the grid unit and improved the motion stability of the grid nodes.
Willie et al. [10] simulated the flow field of the compressor when studying the noise source of the oil-free screw compressor on the truck, but the simulation results had higher errors than the experimental results. The possible reason is that it does not perform grid independence verification or the number of numerical cells is insufficient.
Rane et al. [11] studied a twin-screw compressor and found that the refinement of the grid along the circumferential direction of the rotor profile directly affected the prediction of mass flow. Ding and Kim et al. [12,13] used different CFD software to simulate the effect of oil injection on compressor performance, which could effectively reduce the discharge temperature and improve the performance of the compressor. Rane et al. [14] applied CFD technology to the study of screw compressors with variable pitch and variable rotor end faces. By changing the shape of the rotor, it could improve the compression characteristics and achieve the internal pressure of the compressor’s rapid rise. At the same pressure ratio, the variable pitch and variable section rotors achieved a larger discharge area, and the variable pitch rotor could effectively reduce the length of the seal line in the high pressure region, thereby reducing leakage.
Byeon et al. [15] used overlapping grid technology to simulate the working process of an oil-free air compressor. The experiment obtained the adiabatic efficiency and volumetric efficiency of the compressor where the simulation results were very similar to the experimental results. Arjeneh [16] used the CFD method to study local pressure variation inside the suction plenum of the screw compressor, described the measurement method of related experiments, and verified the application of CFD technology in the research of screw machinery. Rane [17] studied the influence of CFD solvers on the performance prediction of a twin-screw compressor. The performance predictions obtained by calculations with these two CFD models were compared with measurements obtained on the test compressor. The study revealed differences between the results obtained by two different solvers and the experimental results and provides a reference for the choice of CFD solver.
This paper used CFD technology to simulate the working process of the twin-screw refrigeration compressor under different loads, analyze the flow characteristics of the compressor internal fluid, and obtain the pressure, velocity and temperature distribution. The simulation results were similar to the experimental data, which proved the model was correct. Studying the working characteristics of a twin-screw refrigeration compressor under partial load can provide a theoretical basis for its optimized design and avoid unnecessary power consumption.
2. Geometric Model Building and Meshing
The working process of the twin-screw compressor is very complicated. In order to facilitate the simulation and reflect the working process of the compressor, this study divided the fluid domain model into three parts: the suction port, the volumetric element, and the discharge port. The three parts needed to be connected in the calculation process, so that the data information could be exchanged. Figure 1 shows the control volume fluid domain of the compressor.
Since the shape of the suction and the discharge ports of the twin-screw refrigeration compressor is very irregular, structured hexahedral grids cannot be generated in ANSYS Mesh. Furthermore, the shape of the suction and the discharge ports does not change during the simulation. Therefore, the suction port and the discharge port were mesh blended by the tetrahedral grids and hexahedral grids as shown in Figure 2a,b. In order to ensure the accuracy of numerical interpolation during calculation, it was necessary to ensure that the mesh size of the interface between the suction port and the discharge port and the rotor cavity is the same. The mesh size of the interface was 1.25 mm, and the number of meshes of the suction port and the discharge port was 1,504,949. The mesh skewness was less than 0.81, and the quality met the calculation requirements.
Due to the complex geometry of the compressor’s working chamber, the internal fluid domain changed continuously with the rotation of the rotor, and the existence of a small clearance, which made the requirements of the grid extremely demanding. Therefore, high-quality, fast mesh generation tools are needed to satisfy the solver’s ability to accurately predict the boundary layer flow and flow within the clearance. This paper used TwinMesh to generate the fluid domain mesh in the working cavity. This is a mesh generation tool for the internal flow simulation of a positive displacement rotary compressor that can automatically generate a high quality hexahedral mesh according to the rotor profiles.
In TwinMesh, various parameters can be set to generate the grid. After grid independence verification, the number of circumferential nodes of the rotor profile was set to 720, and the maximum mesh size was set to 1 mm. It was necessary to draw a set of grids per degree, so a total of 72 sets of grids needed to be generated. When simulating, ANSYS-CFX can automatically select the corresponding grid for calculation. In order to make up for the oil’s sealing, which will reduce the leakage of refrigerant, the leakage clearance of the compressor was appropriately reduced when generating the cells in TwinMesh, as shown in Figure 2c. The minimum angle of the grid needed to be greater than 18° to meet the calculation requirements. The closer the grid angle is to 90°, the better the grid quality. Finally, the number of hexahedral meshes generated in the volumetric element fluid domain was 5,279,175, and the quality met the requirements.
3. Simulation Settings
3.1. Governing Equation
The flow and convective heat transfer of fluids are controlled by the laws of conservation of physics, which include the law of conservation of mass, the law of conservation of momentum, and the law of energy conservation. Since the flow is in a turbulent motion state, the system also needs to comply with the additional turbulent transport equation. The governing equations are mathematical descriptions of these conservation laws.
Any flow problem must satisfy the law of conservation of mass, and the mass added to the fluid microelement in unit time is equal to the net mass flowing into the microelement at the same time. According to this law, a general form of mass conservation equation can be obtained, which is applicable to compressible flow and incompressible flow. The source term can be any custom source term:
The law of conservation of momentum is also a law that must be satisfied by any flow system. The rate of change of the momentum of a fluid in a microelement to time is equal to the sum of the forces acting on the microelement:
A flow system containing heat exchange must also satisfy the law of conservation of energy; it is the necessary equation for obtaining the temperature field of the fluid. The increase rate of energy in the microelement is equal to the net heat flow into the microelement plus the work done by the volume force and surface force on the microelement. The essence of this law is the first law of thermodynamics:
Since the flow is in a turbulent motion state, the system also needs to comply with the additional turbulent transport equation to solve. This paper used the Shear Stress Transport model. The shear stress transport (SST) model is improved by the standard k-ω model, which has higher precision and reliability:
3.2. Boundary Condition Settings
The refrigerant in the compressor was a compressible fluid. The turbulence model in this paper was the SST k-ω model, which combines the advantages of the k-ω model in the near-wall region calculation and the advantages of the k-ε model in the far-field calculation. Considering the heat transfer caused by fluid flow, this paper used the total energy model to calculate the convection heat transfer and heat conduction, which was suitable for the heat transfer calculation of high-speed flow and compressible flow. The refrigerant was R134a, and its physical properties were given by the physical property data fitted by the Peng–Robinson equation in the database. As shown in Table 1, the inlet and outlet temperatures and pressures obtained from the experiment were used as the boundary conditions for CFD simulation. Since the discharge temperature of R134a is low, before entering into the compressor, the oil was not cooled in the experimental research, thus the cooling effect of the oil would be cut down greatly. Based on that the heat transfer of the oil was not considered in the CFD simulation. The rotor speed was 2960 rpm.
3.3. Grid Independence Verification
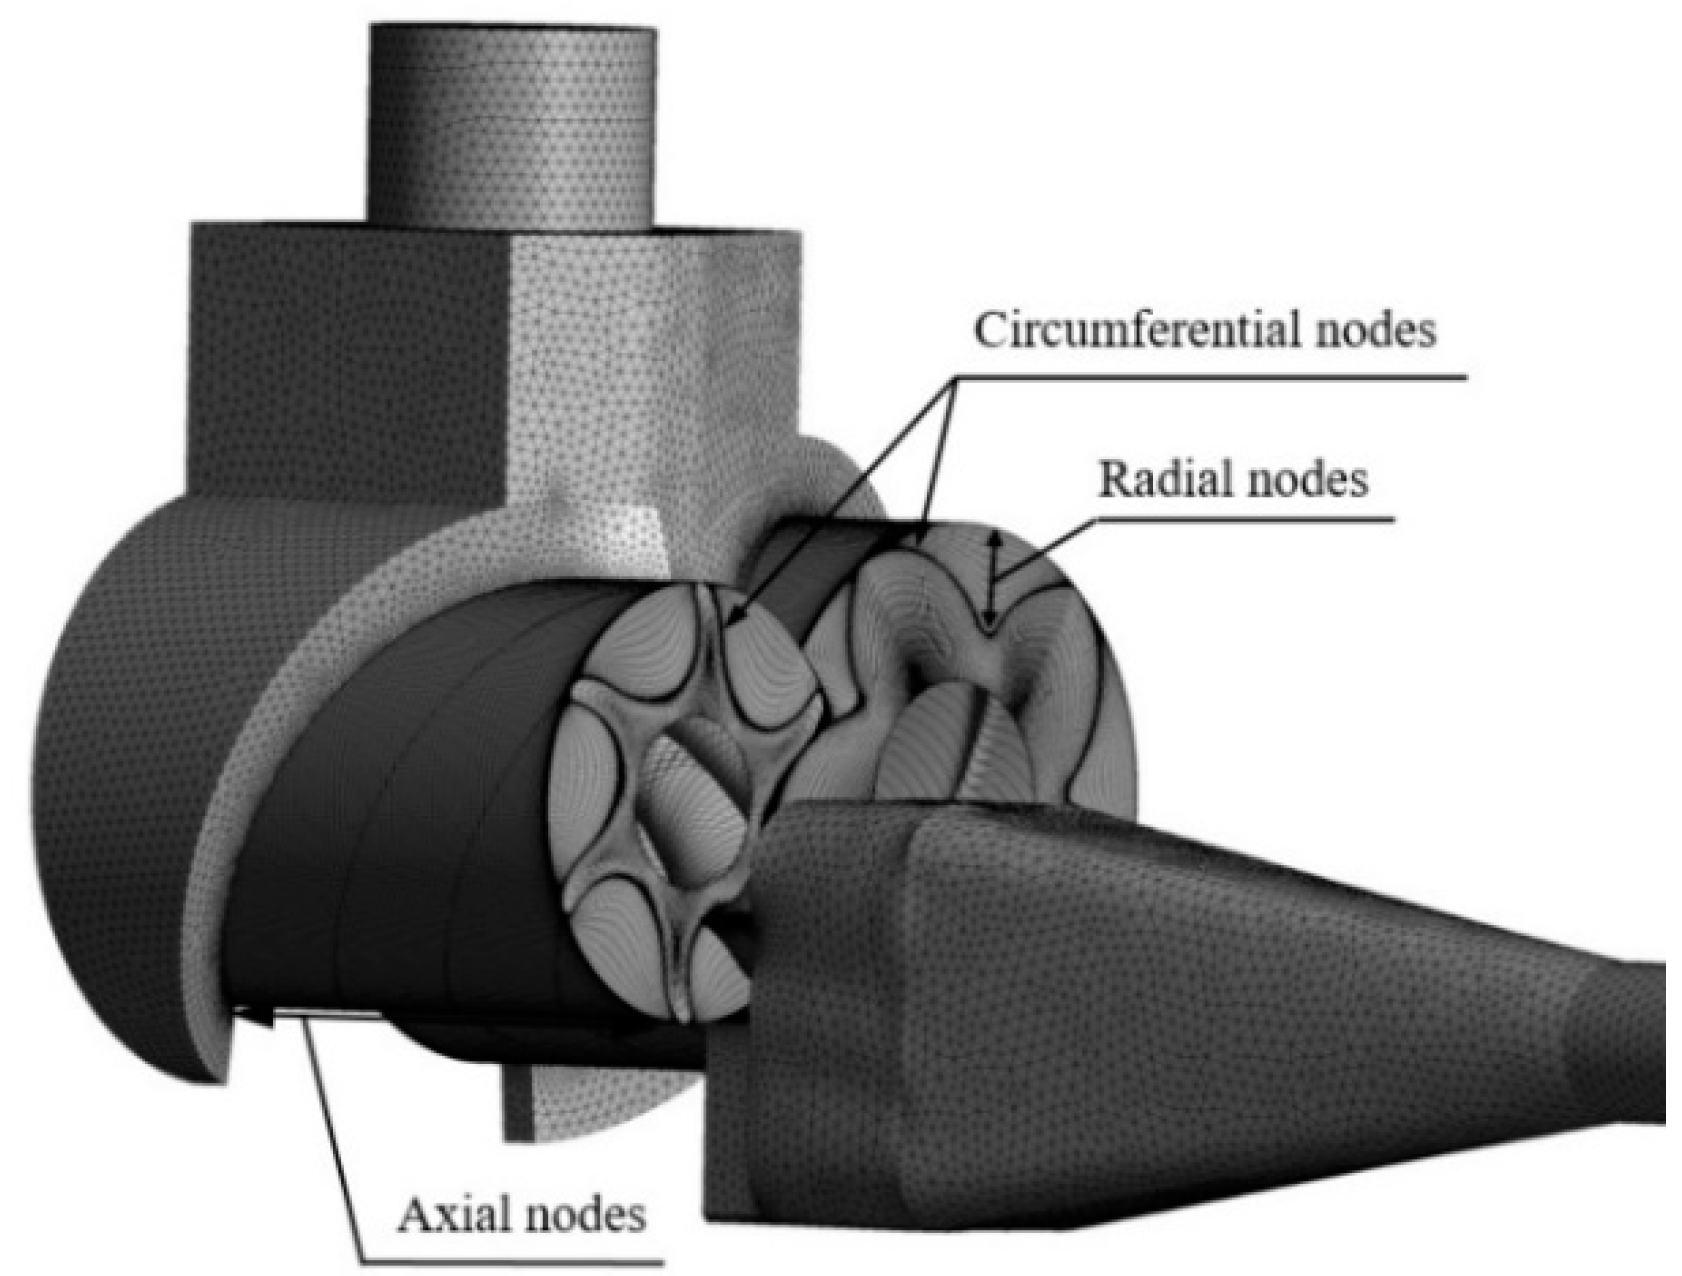
Since the number of cells will affect the simulation results, this paper used meshes of different parameter settings in TwinMesh for the simulation. Figure 3 shows the control volume cells of the experimental compressor. The simulation results under different parameters are shown in Table 2.
Figure 4a shows the cell numbers in different cases, Figure 4b shows the volume flow in different cases, Figure 4c shows the P-θ diagram in different cases, and Figure 4d shows the power in different cases. It can be seen from the figure that the number of circumferential nodes of the rotor profile and the number of axial nodes had a great influence on the compressor volume flow, and the number of radial nodes had little influence on the compressor volume flow. The number of cells had the greatest influence on the volume flow, and had little effect on the pressure and the indicated power, but the volume flow is one of the most important performance parameters of the compressor. Therefore, the volume flow should be used as the basis for the simulation results. Considering the cost of computing resources, this paper used the mesh of Case4 for the simulation calculations.
4. Experiment
In general, the volumetric flow of a twin-screw refrigeration compressor needs to be designed according to the maximum gas consumption. Due to various external climatic conditions, different applications, and other reasons, twin-screw refrigeration compressors have been under partial load conditions for a long time. Studying the working characteristics of a twin-screw refrigeration compressor under partial load can provide a theoretical basis for its optimized design and avoid unnecessary power consumption.
Based on the working characteristics of twin-screw refrigeration compressors, the slide valve adjusting device driven by hydraulic is commonly used to realize the capacity adjustment process. The body of the twin-screw refrigeration compressor is equipped with a slide valve with a radial discharge port. When there is a bypass port between the low-pressure end of the slide valve and the fixed block, the effective working length of the rotors is reduced, and the compressor is in a partial load state. In this paper, the 75% load condition refers to where the volume flow is 75% of the maximum volume flow, and the 100% load condition refers to when the volume flow is the maximum volume flow.
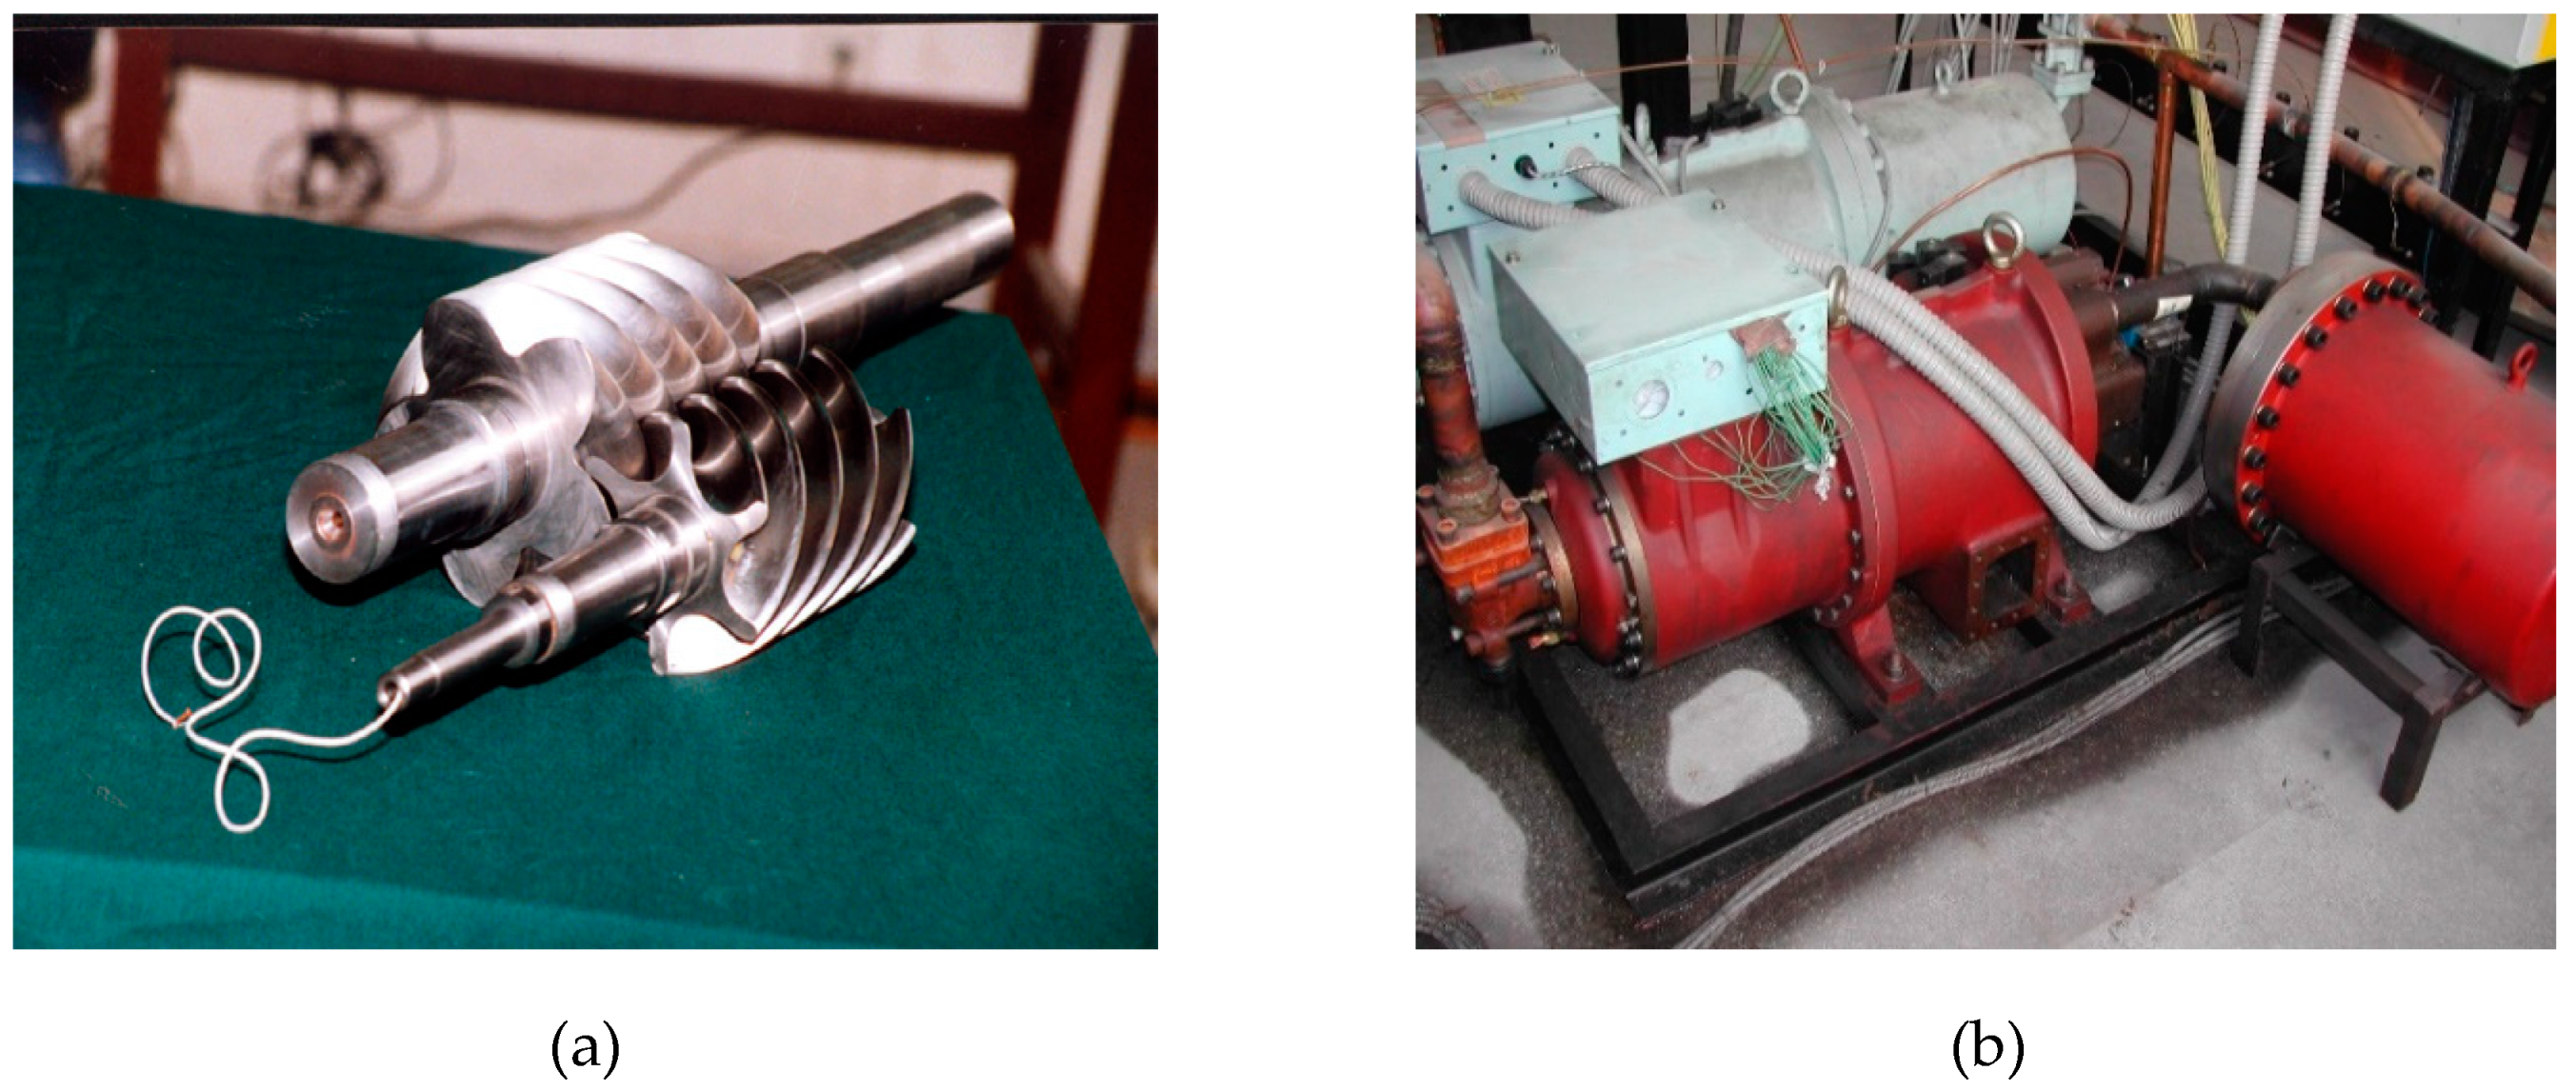
In order to verify the correctness of the CFD simulation, a micro pressure sensor was installed near the discharge end face in a tooth groove of the female rotor that could monitor the pressure signal in a working cycle, so that the P-θ diagram of the compressor in the working process could be obtained. The pressure sensor (XT-140-250A) used in this paper had the characteristics of non-linearity, repeatability, hysteresis not exceeding 5%, and high resolution. Its maximum working pressure was 3.5 MPa, its natural frequency was 700 Hz, and it could be effectively used in the temperature range of −50–205 °C. The modified female rotor is shown in Figure 5a where the micro pressure sensor installed in the female rotor tooth groove collected the pressure signal in the tooth groove. The pressure signal was transmitted through the signal line located in the female rotor axis. The signal was transmitted to the moving plate of the collecting ring. Next, the collecting ring converted the pressure signal to the static plate and sent it to the signal amplifier. The pressure signal was amplified by the signal amplifier and then entered the dynamic signal analyzer for data acquisition. A corner marking disc with a slit was fixed on the female rotor. When the disc rotated at a high speed, the photoelectric sensor periodically sensed the light transmitted from the slit and generated a pulse signal, and the pulse signal was used as the mark of the position of the female rotor. The pressure signal and the pulse signal entered the dynamic signal analyzer at the same time, and the P-θ diagram was obtained after being processed.
Figure 5b shows the experimental test compressor. In order to obtain the P-θ diagram of the screw compressor, it was necessary to modify the existing screw compressor to meet the requirements of the test. The experiment was carried out under partial load (75%) and full load.
Table 3 shows the detailed structural parameters of the twin screw refrigeration compressor used in the experiment. The ratio of the rotor length to the outside diameter of the male rotor (L/D) was 1.09742. The theoretical volume flow rate of the compressor was 3.797 m3·min−1.
5. Results and Discussion
The effect of the pressure distribution inside the compressor on the efficiency and performance of the compressor is a topic for engineers in the compressor field. The distribution of pressure in the compressor was calculated by the CFD software and the variation of gas pressure inside the flow channel was analyzed in detail.
As the pressure on the rotor surface represents the distribution of pressure in the working volume of the compressor, the pressure changes inside the compressor at different angles are shown in Figure 6. Since a 5-6 rotor profile was used in this simulation, the pressure changed periodically every 72°. Therefore, the pressure distribution at the rotation angles of 0° and 72° was identical, and the pressure distribution at 18° and 90° was also the same. The pressure gradually increased along the spiral surface of the rotor from the suction port to the discharge port, and the pressure of the discharge port reached the maximum.
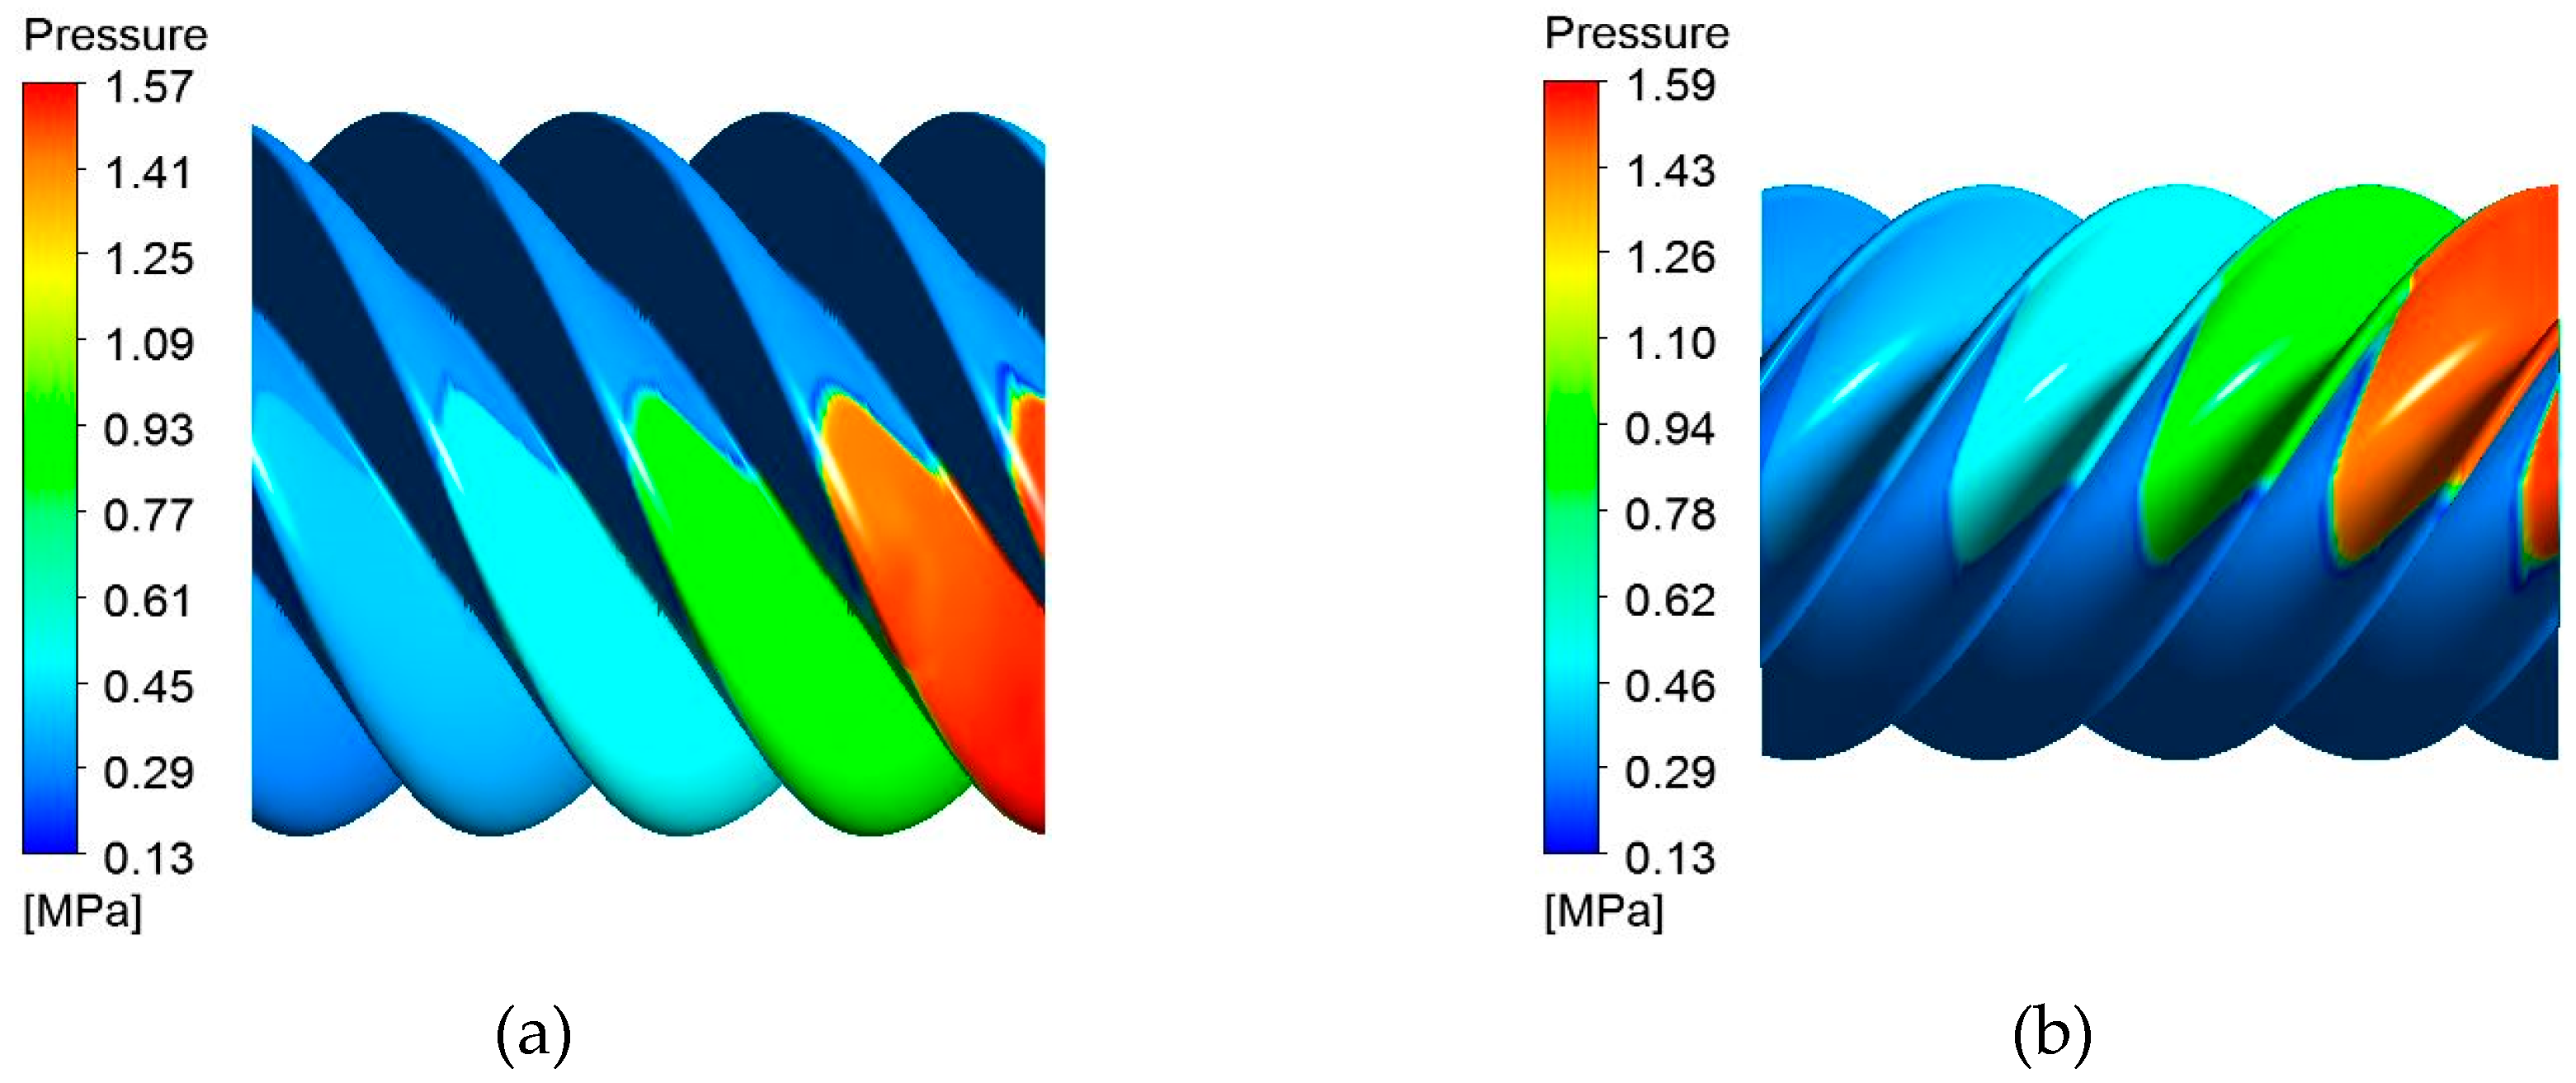
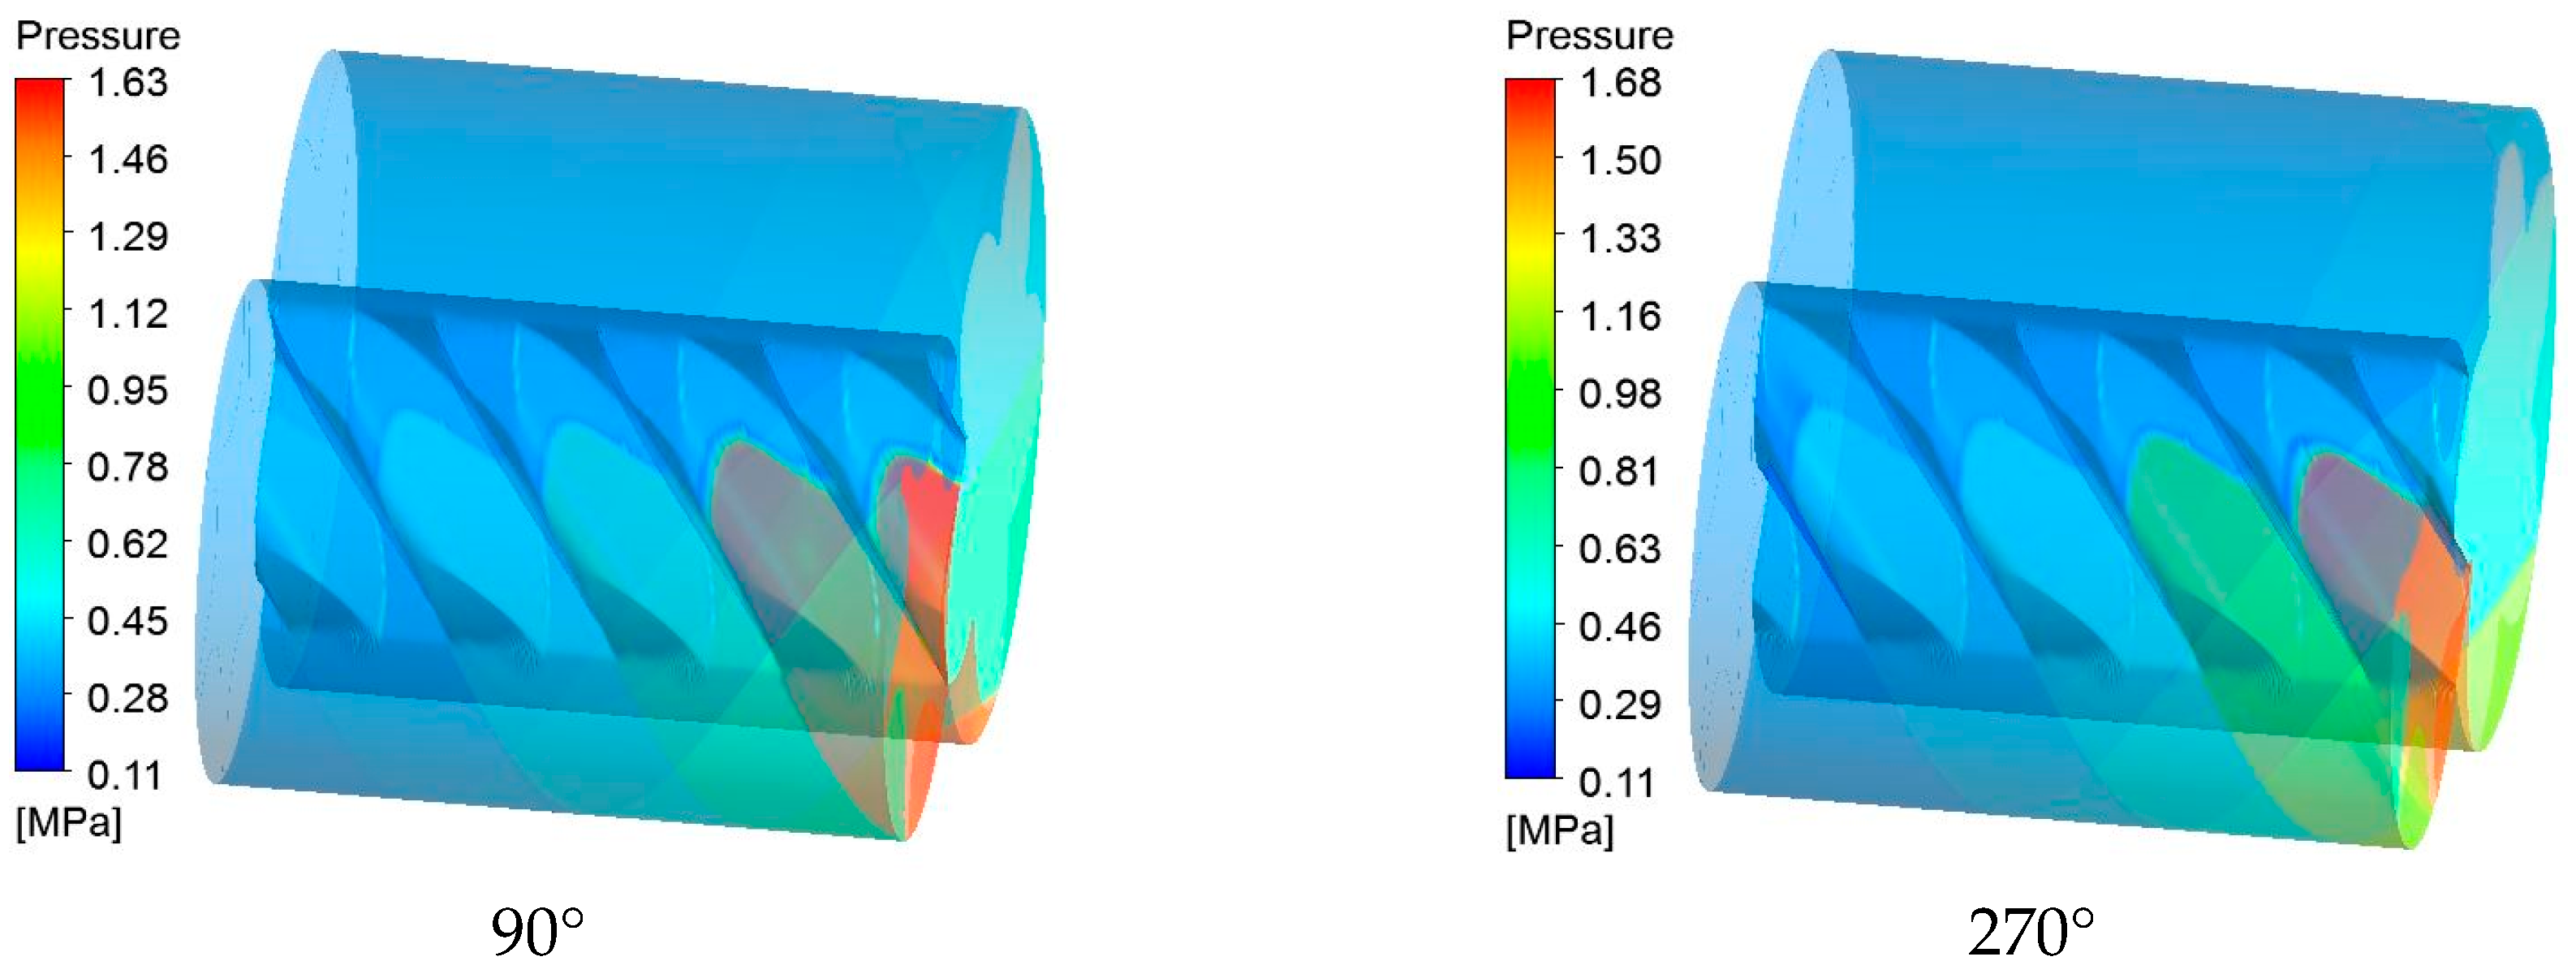
Figure 7 shows the distribution of pressure in the mesh area with the male rotor and female rotor. It can be seen from Figure 7 that the pressure on the rotor surface was obviously divided into two parts: the high pressure area and the low pressure area of the suction pressure, which was caused by the contact line between the rotors that meshed with each other. Figure 8 shows the pressure variation when the gas flows through the intermeshing clearance at different angles. There is an area in the low-pressure region close to the contact line that has a lower pressure than the suction pressure, and becomes more and more obvious along the suction end face to the discharge end face. This could be due to the fact that the intermeshing clearance between the rotors along the contact line is too small, resulting in an increasingly pronounced effect of throttling as the differential pressure increases.
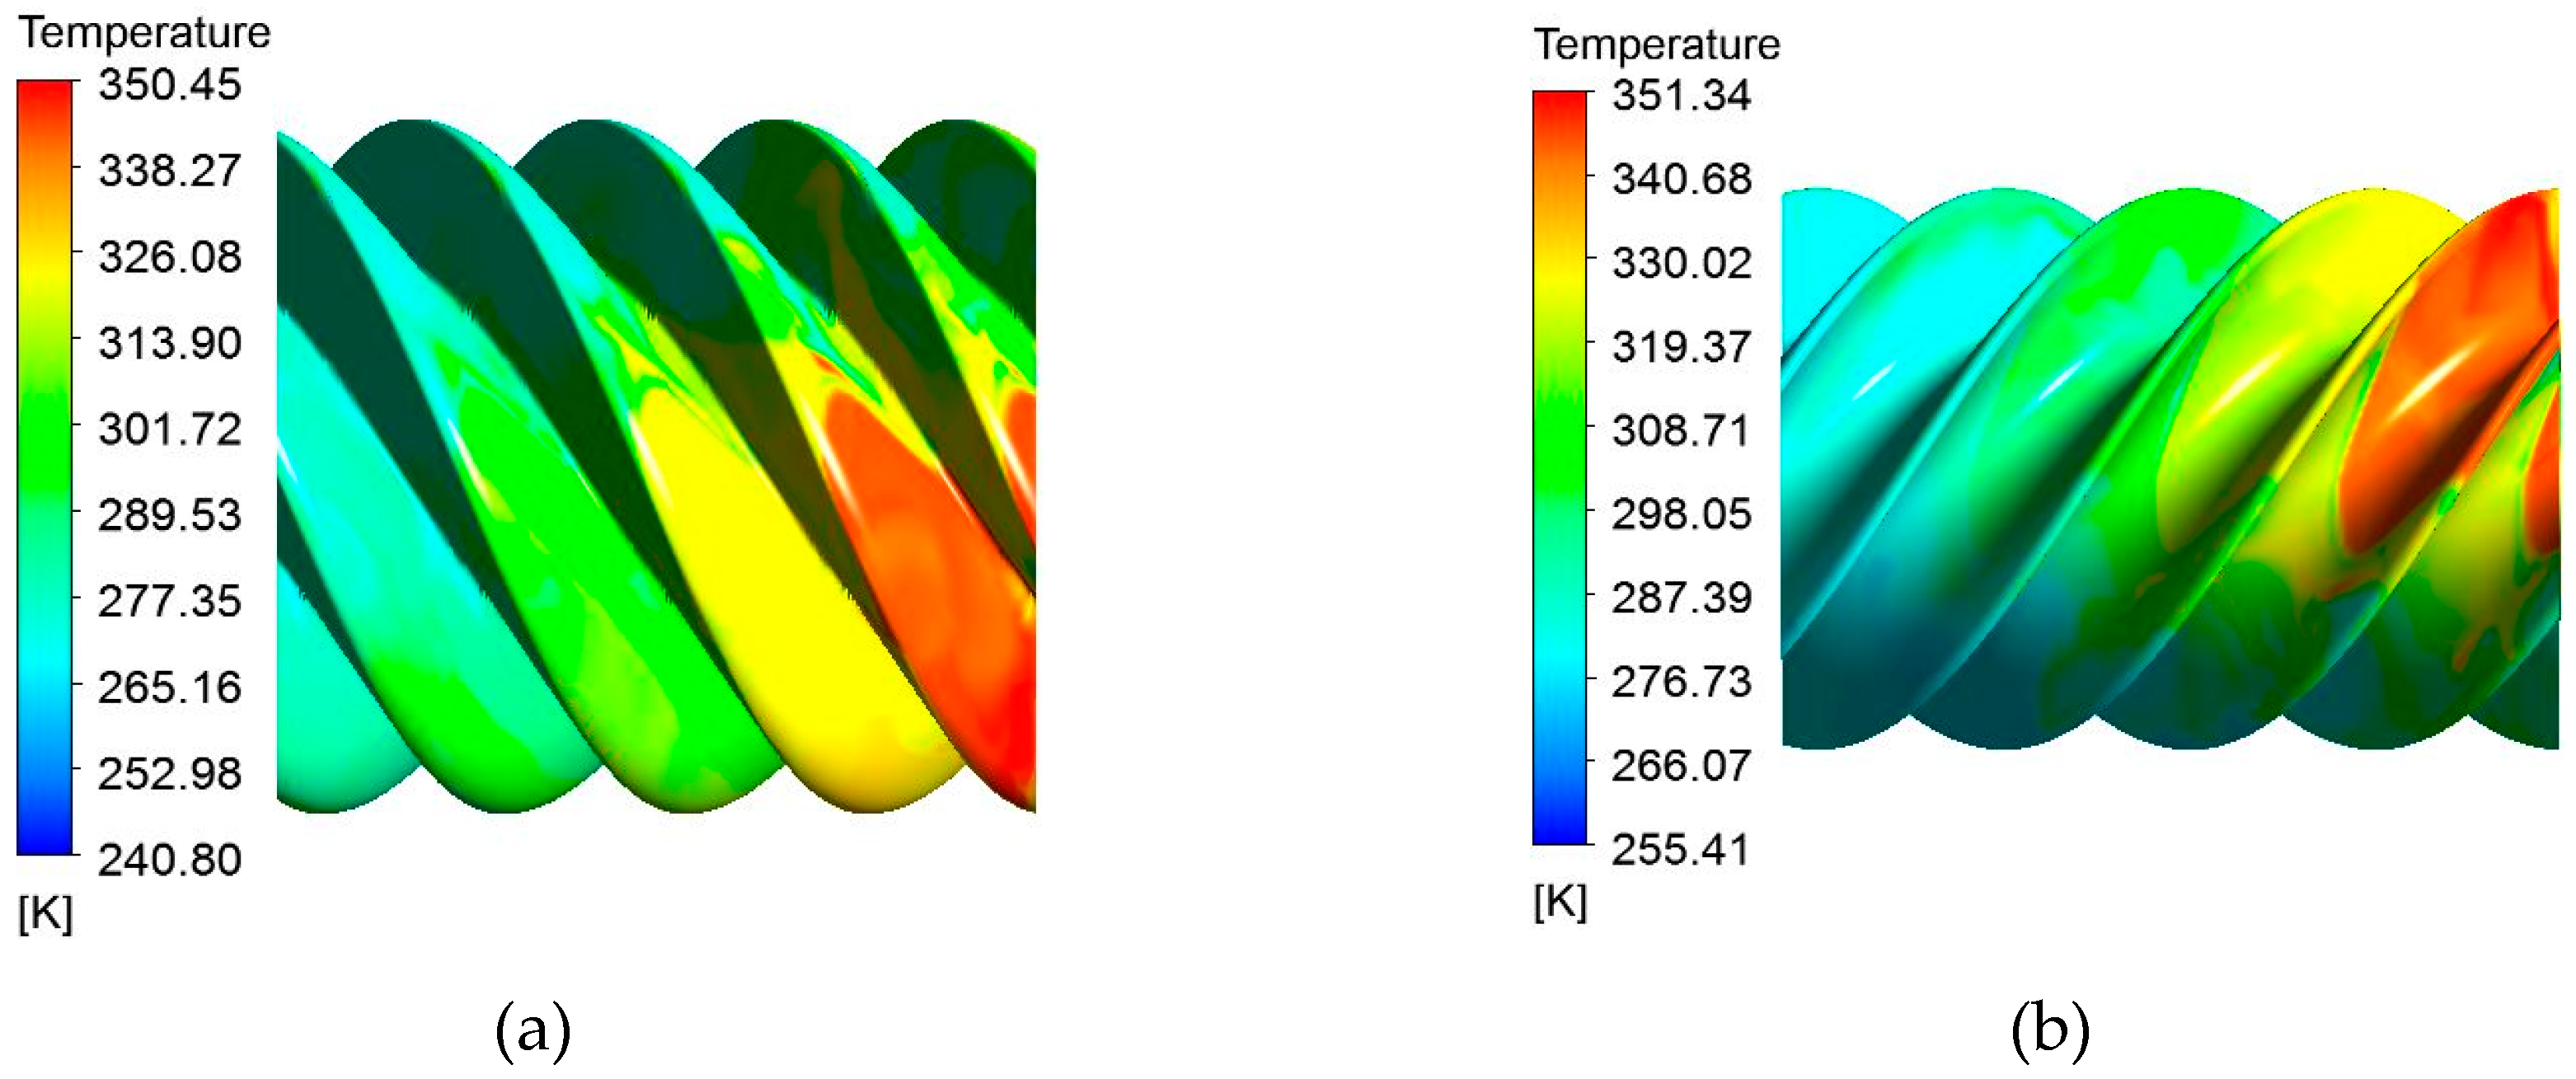
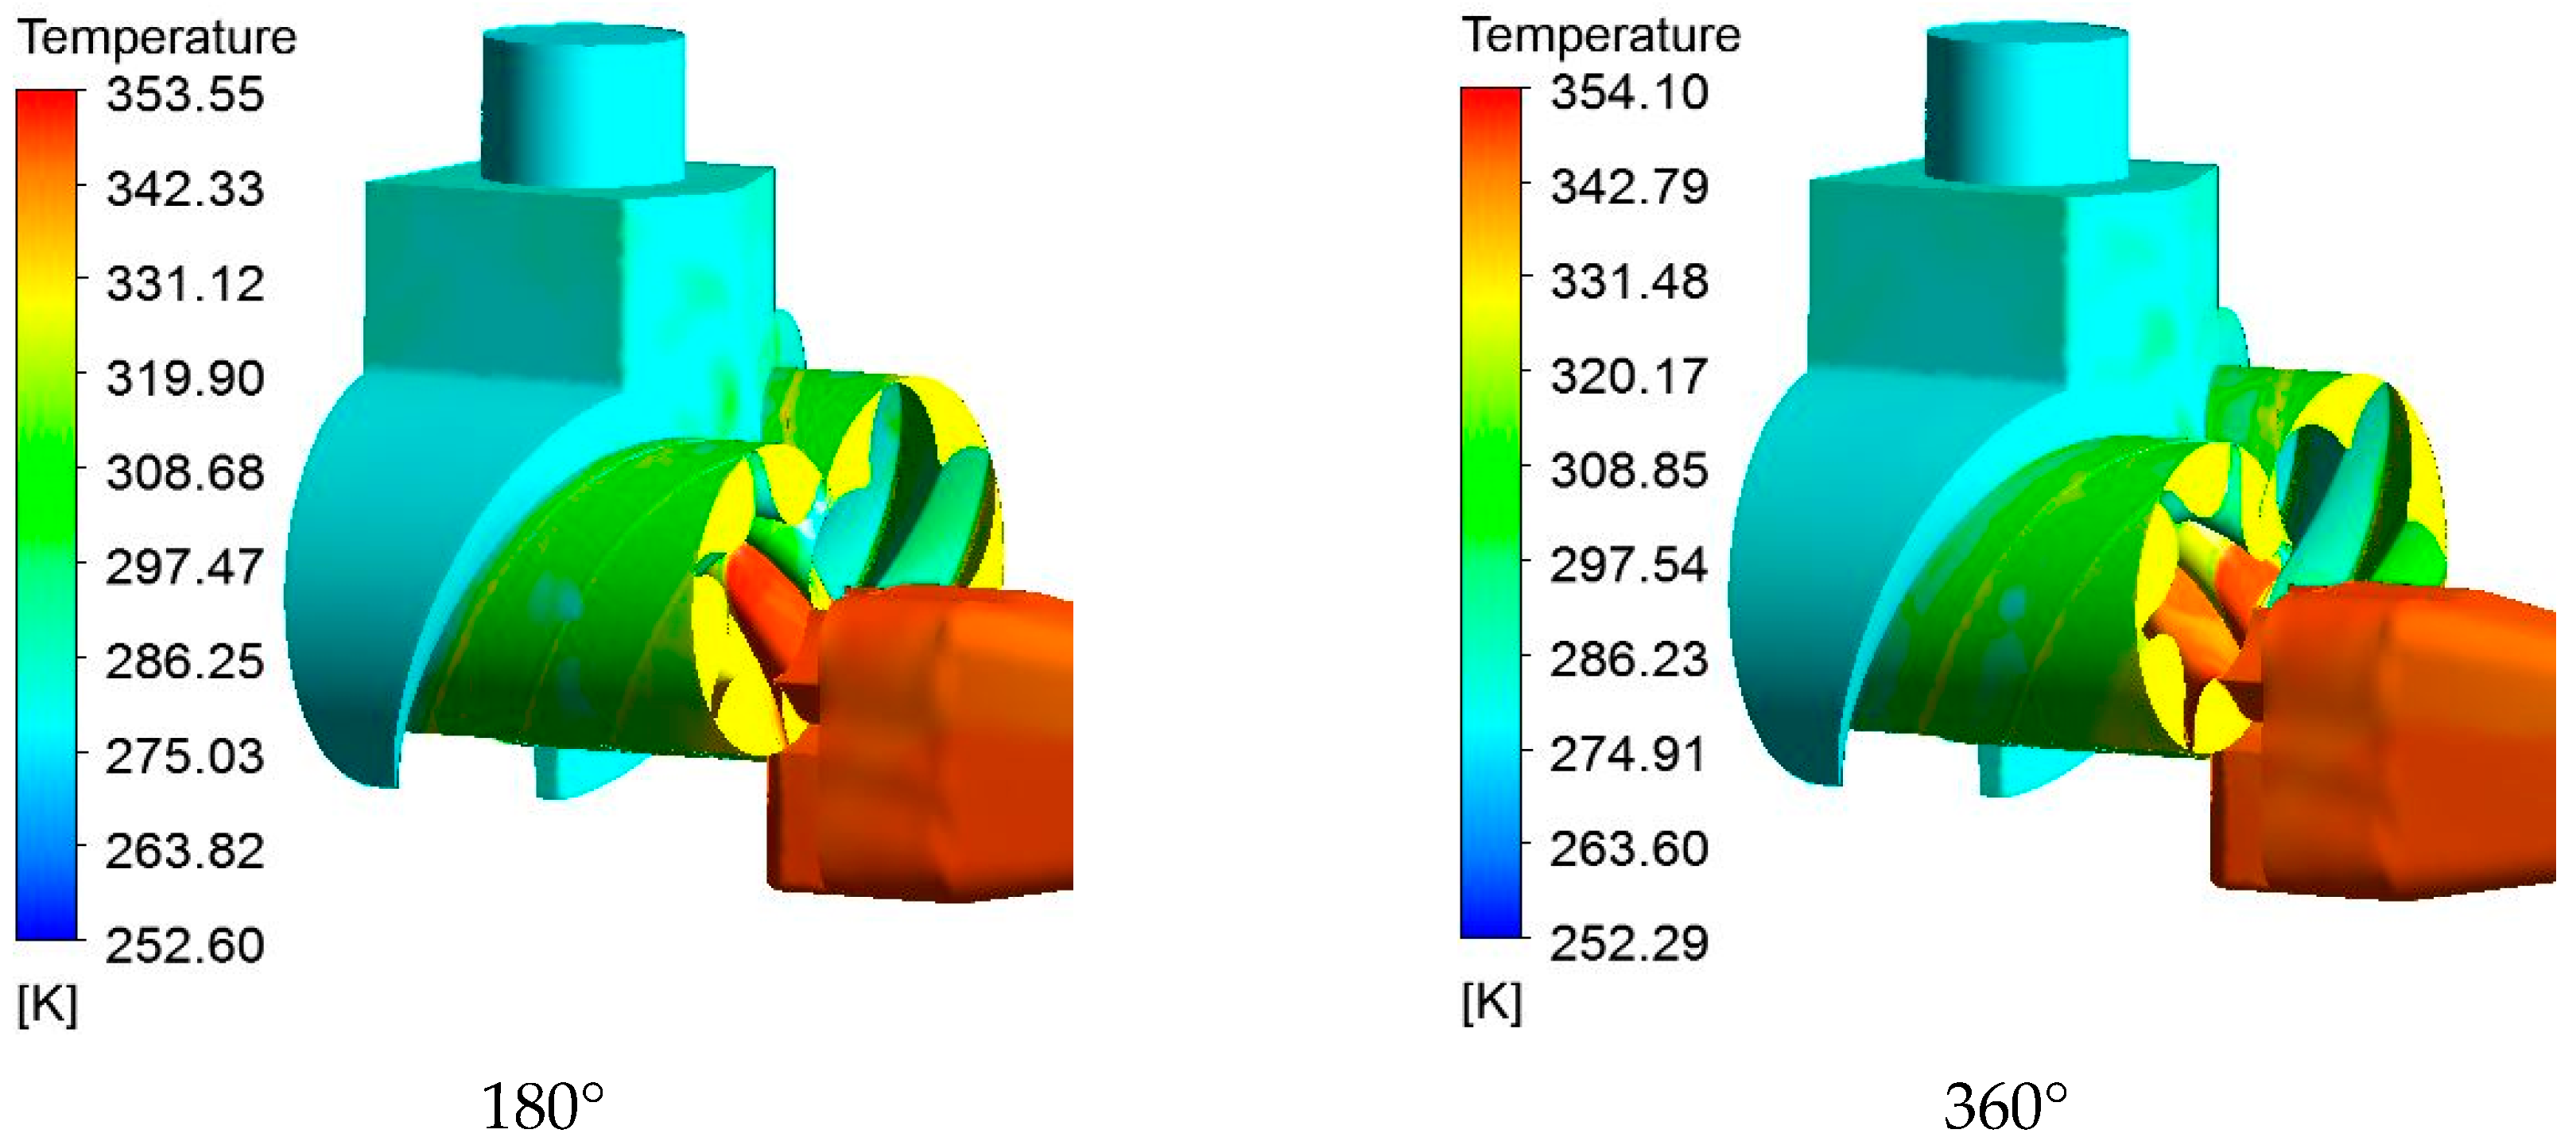
Inside the compressor, the temperature rise is mainly caused by the following parts: the heat generated by the friction between gas and casing, the heat generated by the compressed gas, and the flow loss and impact loss. Figure 9 shows the temperature distribution of the surface of the male and female rotors. Figure 10 shows the temperature distribution inside the compressor at different angles. It can be seen that the temperature gradually rose along the axial direction of the rotor, and the temperature near the discharge port was the highest. Additionally, the temperature at the discharge port was significantly larger than the suction port, which was in line with the actual situation. This part of the study can provide a reference for the location design of the oil injection port.
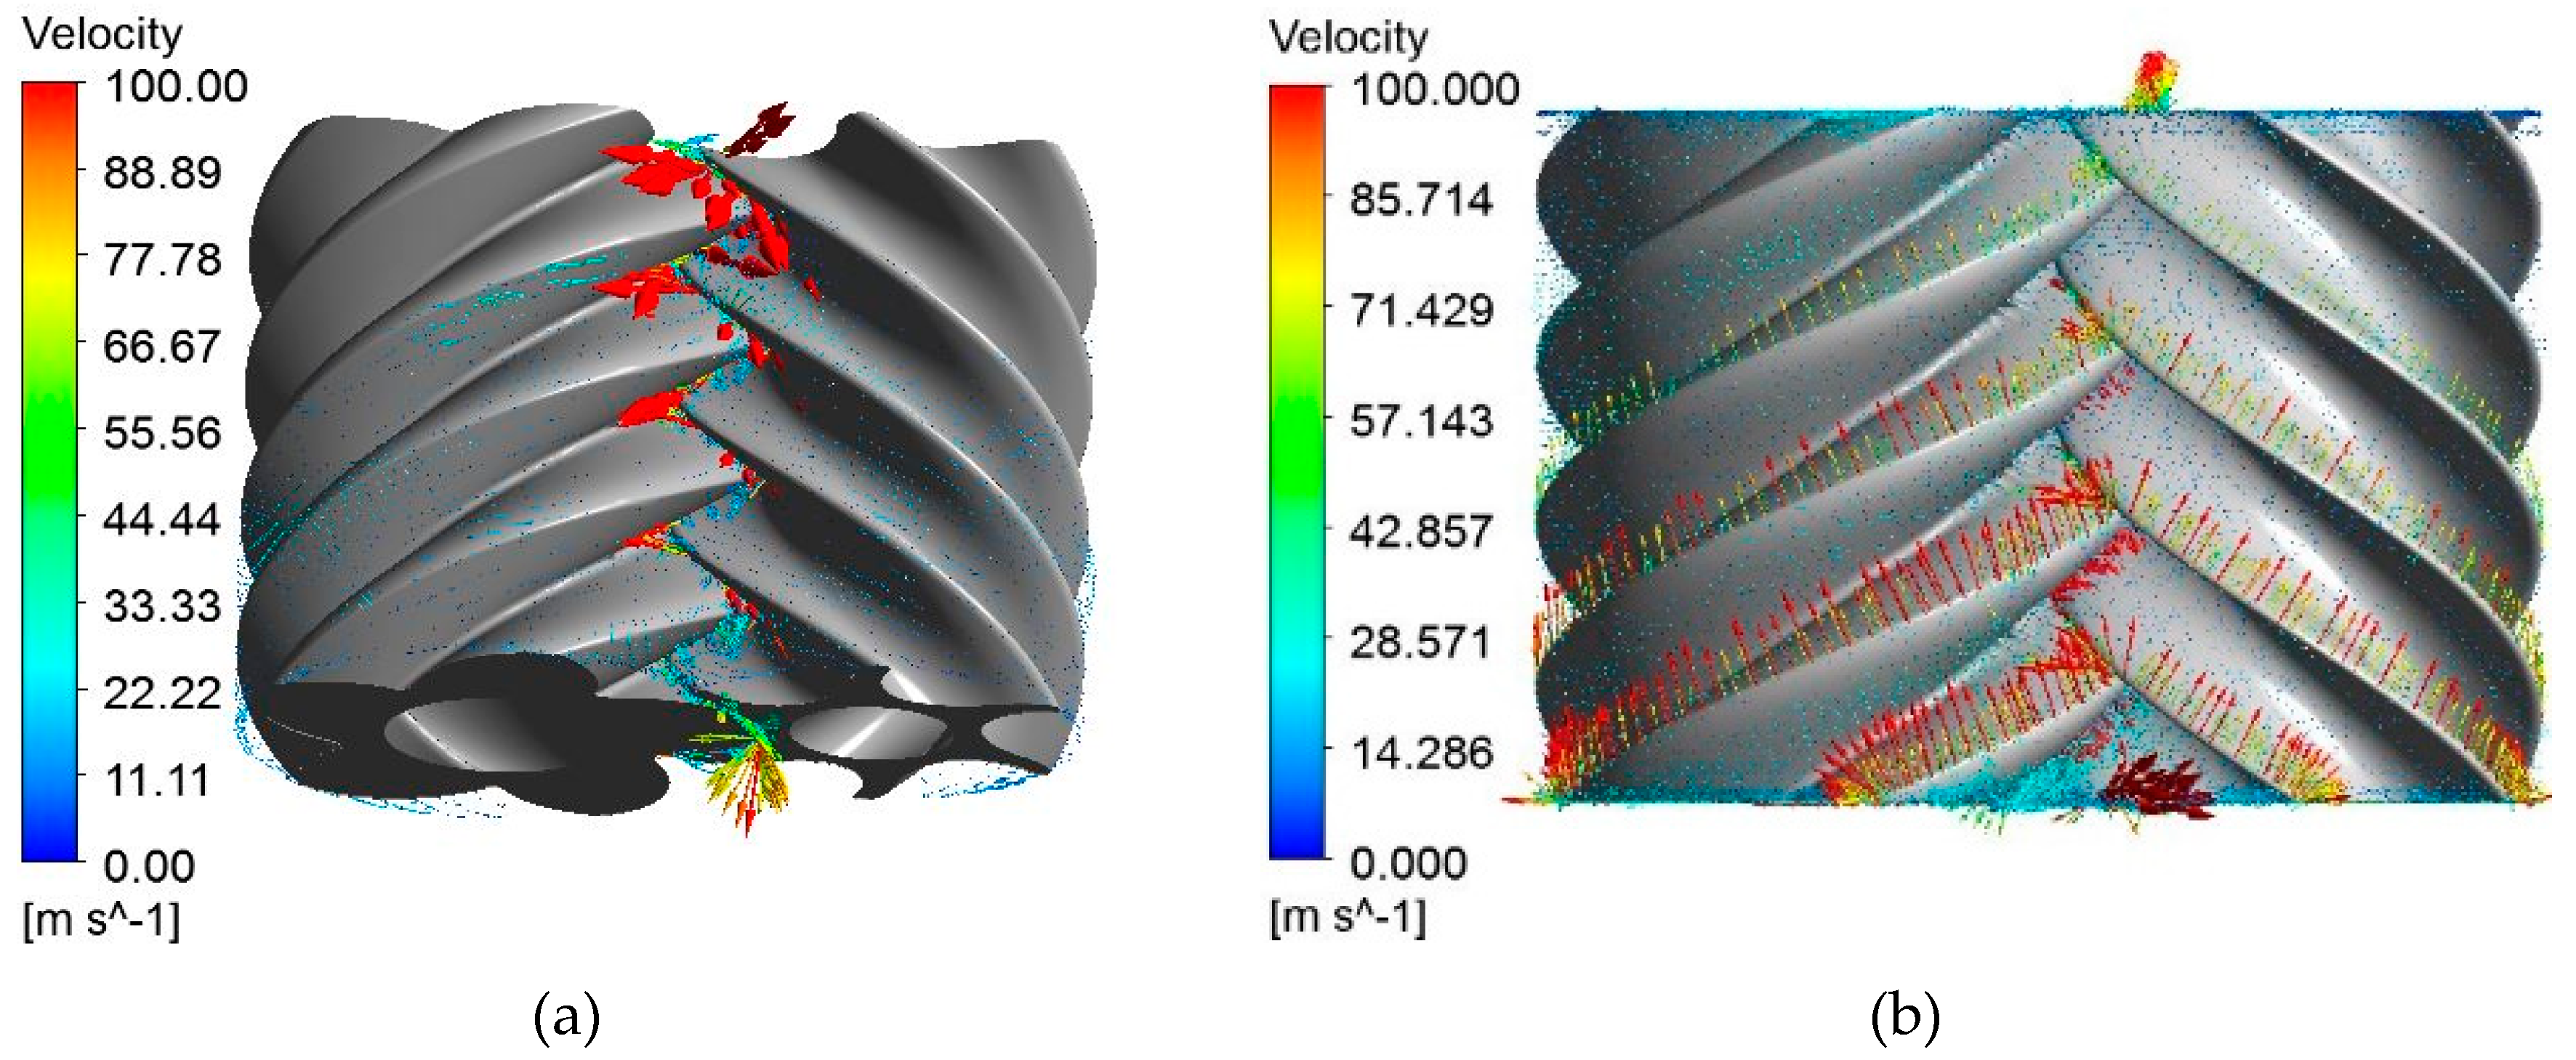
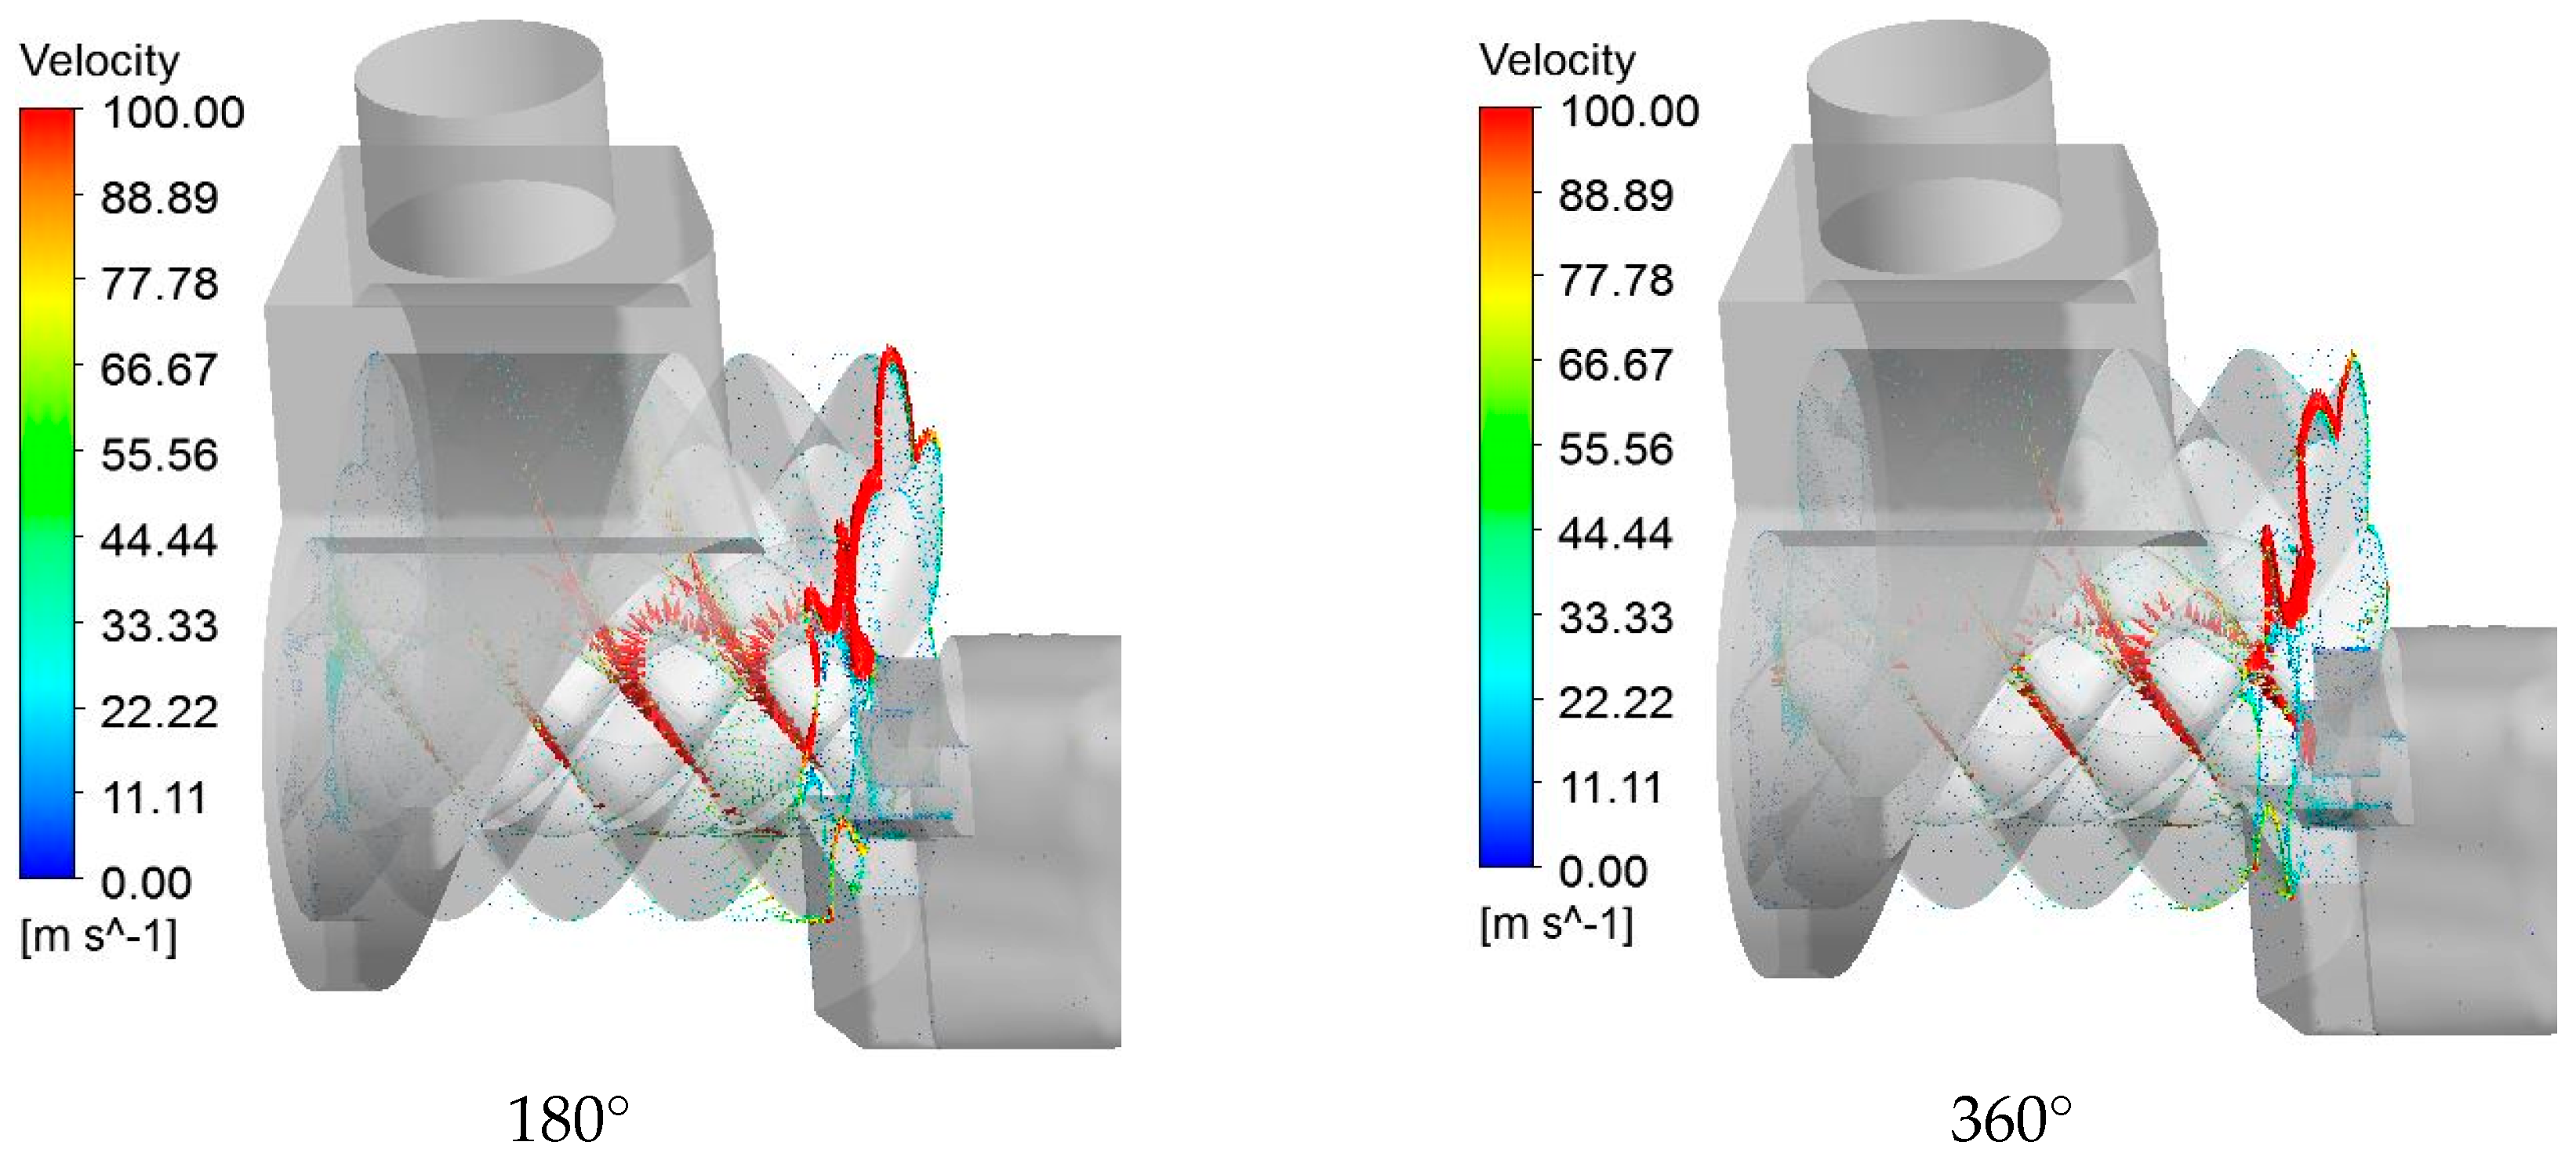
As shown in Figure 11, due to the intermeshing clearance between the male and female rotors, the gas flows back through the intermeshing clearance during the high-speed rotation of the rotor, causing the leakage from the high-pressure chamber to the low-pressure chamber. The velocity in the leakage increases as the pressure differential across the adjacent volumetric elements of the rotor becomes higher, and the velocity of the fluid at the intermeshing clearance is much greater than the velocity of the fluid in the volumetric element. For the same reason, the radial clearance of the compressor also has this leakage problem. Figure 12 shows the leakage velocity vector of the compressor at different angles. It can be seen that the refrigerant flow rate between the different volumetric elements hardly changed and the leakage in the terminal clearance was obvious. The maximum leakage velocity exceeded 200 m/s. The leakage of gas in the compressor was mainly caused by the difference in pressure between the different slots, and the distribution law of the leakage velocity was positively correlated with the pressure difference. Gas leakage changes the flow state of the internal airflow of the compressor and greatly reduces the efficiency of the compressor, so it is especially necessary to properly control the leakage of the twin-screw compressor.
This paper verified the correctness of the CFD model from two aspects: First, the P-θ diagram of the working process of the screw refrigeration compressor obtained by CFD simulation was compared with that obtained by the experiments, and the pressure in the working chamber of the compressor constantly changed with the angle of the male rotor, which was to construct important parameters of the P-θ diagram. If the P-θ diagram calculated by the CFD agrees well with the experimentally measured P-θ diagram, it indicates that the prediction of compressor performance by this CFD calculation model is correct. Second, performance parameters such as volumetric efficiency, isentropic efficiency, and input power of the compressor obtained by CFD simulation were compared with that obtained by the experiments.
Figure 13 and Figure 14 show the P-θ diagram of the screw refrigeration compressor under partial load (75%) and full load conditions. It can be seen that the pressure curve obtained by the CFD calculation agreed well with the experimentally measured pressure curve. In the discharge process, the CFD calculation model failed to accurately reflect the actual process, which may have been caused by the large pressure pulsation in the discharge process.
As can be seen in Figure 13, the starting point of the compression process was delayed, the compression curve became steep, and the discharge time became shorter. At the beginning of the compression process, the capacity control slide valve causes the compress part to be connected to the discharge part, which causes the compression process to be delayed. This causes the compressor discharge pressure to be slightly lower than the compressor discharge pressure at full load. Due to the change in the radial discharge orifice, the compressor’s discharge time was also slightly less than the compressor’s discharge time under a full load.
In the CFD calculation, the indicated power of the compressor under partial load conditions was 22.758 kW, and the indicated power of the compressor under full load conditions was 34.271 kW. The motor efficiency was 0.95 and the mechanical efficiency was 0.91. The input power was 26.325 kW and 39.643 kW, respectively. Table 4 shows the comparison of the macroscopic performance of the compressor under two working conditions. It can be seen from the table that the volumetric efficiency, isentropic efficiency, and input power of the compressor calculated by CFD were in good agreement with the experimentally measured data.
As shown in Figure 15, under full load conditions, the error between the results obtained by the CFD calculation and the experimental results was less than 1%. Under partial load conditions, the error of input power and isentropic efficiency calculated by CFD was large, but the error value was less than 3%. The results of both conditions were within the tolerances.
The accuracy of the CFD calculation model was fully illustrated by the comparison between the CFD calculation results and the experimental results. This model can correctly describe the working processes of the compressor.
6. Conclusions
In this paper, the internal flow field of the twin-screw compressor was numerically simulated by the fluid analysis software CFX, and the flow characteristics of the internal flow field of the compressor were obtained. Our results can be concluded as follows.
The distribution of the pressure, the temperature, and the speed in the leakage clearance inside the compressor were visualized. The gas temperature from the suction port to the discharge port of the compressor was greatly improved, and the temperature was highest at the discharge port. It could be clearly observed that the pressure at the contact line of rotors was the lowest. This could be due to the fact that the intermeshing clearance between the rotors along the contact line was too small, resulting in an increasingly remarkable influence of throttling as the pressure difference increased between the high-pressure chamber and the low-pressure chamber. The refrigerant leakage velocity at the compressor clearance was larger than that in the tooth grooves. The leakage was most obvious from the high-pressure chamber to the low-pressure chamber. The maximum leakage velocity of the clearance exceeded 200 m/s. Therefore, various leakage clearance should be minimized during the design of the compressor.
On the basis of the experimental investigation, the P-θ diagram of the twin-screw refrigeration compressor under different load conditions was obtained, and the performance such as input power, volumetric efficiency, and adiabatic efficiency of the compressor were tested. By comparing the CFD calculation results with the experimental results, it was found that the CFD model of this paper could accurately show the working process of the twin-screw compressor, and the parameters such as discharge temperature and pressure were close to the test results. This provides a reliable method for the design and optimization of twin-screw refrigeration compressors.
Author Contributions
Investigation, H.W. and H.H.; Writing—review & editing, B.Z., B.X. and K.L.
Funding
This research was funded by the National Natural Foundation of China, grant number 50806055 and State Key Laboratory of Compressor Technology Open Fund Project, grant number SKL-YS.1201805.
Conflicts of Interest
The authors declare no conflict of interest.
Nomenclature
| Source term | |
| Pressure on the microelement | |
| Component of the viscous stress τ | |
| F | Volume force on the microelement |
| K | Heat transfer coefficient |
| T | Temperature |
| Specific heat capacity | |
| Internal heat source and the viscous dissipation term | |
| Kinetic energy of turbulence | |
| Effective diffusion terms of | |
| Effective diffusion terms of | |
| Divergent terms for | |
| Divergent terms for | |
| Orthogonal divergence | |
| User-defined item |
References
- Hauser, J.; Brümmer, A. Geometrical abstraction of screw compressors for thermodynamic optimization. Proc. Inst. Mech. Eng. Part C J. Mech. Eng. Sci. 2011, 225, 1399–1406. [Google Scholar] [CrossRef]
- Wu, X.; Xing, Z.; He, Z.; Wang, X.; Chen, W. Effects of lubricating oil on the performance of a semi-hermetic twin screw refrigeration compressor. Appl. Therm. Eng. 2017, 112, 340–351. [Google Scholar] [CrossRef]
- Hou, F.; Zhao, Z.; Yu, Z.; Xing, Z. Experimental study of the axial force on the rotors in a twin-screw refrigeration compressor. Int. J. Refrig. 2017, 75, 155–163. [Google Scholar] [CrossRef] [Green Version]
- Giuffrida, A. A semi-empirical method for assessing the performance of an open-drive screw refrigeration compressor. Appl. Therm. Eng. 2016, 93, 813–823. [Google Scholar] [CrossRef]
- Wu, H.; Xing, Z.; Shu, P. Theoretical and experimental study on indicator diagram of twin screw refrigeration compressor. Int. J. Refrig. 2004, 27, 331–338. [Google Scholar]
- Kovacevic, A. Boundary adaptation in grid generation for CFD analysis of screw compressors. Int. J. Numer. Methods Eng. 2005, 64, 401–426. [Google Scholar] [CrossRef]
- Kovacevic, A.; Stosic, N.; Smith, I. Grid generation of screw machine geometry. In Screw Compressors; Springer: Berlin/Heidelberg, Germany, 2007. [Google Scholar]
- Rane, S.; Kovacevic, A. Algebraic generation of single domain computational grid for twin screw machines. Part I. Implementation. Adv. Eng. Softw. 2017, 107, 38–50. [Google Scholar] [CrossRef] [Green Version]
- Rane, S.; Kovacevic, A. Application of numerical grid generation for improved CFD analysis of multiphase screw machines. IOP Conf. Ser. Mater. Sci. Eng. 2017, 232. [Google Scholar] [CrossRef]
- Willie, J. Use of CFD to predict trapped gas excitation as source of vibration and noise in screw compressors. IOP Conf. Ser. Mater. Sci. Eng. 2017, 232. [Google Scholar] [CrossRef]
- Rane, S.; Kovacevic, A.; Stosic, N.; Kethidi, M. Deforming grid generation and CFD analysis of variable geometry screw compressors. Computers Fluids 2014, 99, 124–141. [Google Scholar] [CrossRef] [Green Version]
- Ding, H.; Jiang, Y. CFD simulation of a screw compressor with oil injection. IOP Conf. Ser. Mater. Sci. Eng. 2017, 232. [Google Scholar] [CrossRef]
- Kim, Y.J.; Byeon, S.; Lee, J.Y. Numerical analysis on the flow characteristics of oil-injected screw air compressor. In Proceedings of the 2014 ISFMFE—6th International Symposium on Fluid Machinery and Fluid Engineering, Wuhan, China, 22–25 October 2014. [Google Scholar]
- Rane, S.; Kovacevic, A.; Stosic, N.; Kethidi, M. CFD grid generation and analysis of screw compressor with variable geometry rotors. In Proceedings of the 8th International Conference on Compressors and their Systems, London, UK, 9–10 September 2013. [Google Scholar]
- Byeon, S.-S.; Lee, J.-Y.; Kim, Y.-J. Performance Characteristics of a 4 x 6 Oil-Free Twin-Screw Compressor. Energies 2017, 10, 945. [Google Scholar] [CrossRef]
- Arjeneh, M.; Kovacevic, A.; Rane, S.; Manolis, M.; Stosic, N. Numerical and experimental investigation of pressure losses at suction of a twin screw compressor. IOP Conf. Ser. Mater. Sci. Eng. 2015, 90. [Google Scholar] [CrossRef]
- Kovacevic, A.; Rane, S.; Stosic, N.; Jiang, Y.; Lowry, S.; Furmanczyk, M. Influence of Approaches in CFD Solvers on Performance Prediction in Screw Compressors. Available online: https://docs.lib.purdue.edu/icec/2252/ (accessed on 15 January 2019).
Figure 1.
The control volume fluid domain of the compressor.

Figure 2.
Meshing of different fluid domains. (a) Suction port fluid domain grid. (b) Discharge port fluid domain grid, (c) Two-dimensional mesh of volumetric element.
Figure 2.
Meshing of different fluid domains. (a) Suction port fluid domain grid. (b) Discharge port fluid domain grid, (c) Two-dimensional mesh of volumetric element.

Figure 3.
The control volume cells of the experimental compressor.

Figure 4.
Mesh independence verification. (a) Mesh numbers in different cases. (b) Volume flow in different cases. (c) P-θ diagram in different cases. (d) Power in different cases.
Figure 4.
Mesh independence verification. (a) Mesh numbers in different cases. (b) Volume flow in different cases. (c) P-θ diagram in different cases. (d) Power in different cases.

Figure 5.
Experimental device. (a) Pressure sensor in the female rotor. (b) Experimental test compressor.
Figure 5.
Experimental device. (a) Pressure sensor in the female rotor. (b) Experimental test compressor.

Figure 6.
The pressure distribution inside the compressor at different angles.

Figure 7.
The pressure distribution of the rotors surface. (a) Male rotor; (b) Female rotor.

Figure 8.
The pressure distribution of the intermeshing clearance of the rotors at different angles.
Figure 8.
The pressure distribution of the intermeshing clearance of the rotors at different angles.

Figure 9.
The temperature distribution of the surface of the male and female rotors: (a) male rotor; (b) female rotor.
Figure 9.
The temperature distribution of the surface of the male and female rotors: (a) male rotor; (b) female rotor.

Figure 10.
The temperature distribution inside the compressor at different angles.

Figure 11.
The leakage velocity vector: (a) the leakage velocity vector of the intermeshing clearance; (b) the leakage velocity vector of the radial clearance.
Figure 11.
The leakage velocity vector: (a) the leakage velocity vector of the intermeshing clearance; (b) the leakage velocity vector of the radial clearance.

Figure 12.
The leakage velocity vector of the compressor at different angles.

Figure 13.
The P-θ diagram of the screw refrigeration compressor under partial load (75%) conditions.
Figure 13.
The P-θ diagram of the screw refrigeration compressor under partial load (75%) conditions.

Figure 14.
The P-θ diagram of the screw refrigeration compressor under full load conditions.

Figure 15.
Comparison of the compressor performance under two working conditions. (a) Input power; (b) Volumetric efficiency; (c) Isentropic efficiency.
Figure 15.
Comparison of the compressor performance under two working conditions. (a) Input power; (b) Volumetric efficiency; (c) Isentropic efficiency.


Table 1.
Boundary conditions of computational fluid dynamics (CFD) simulation.
| Parameters | Measured Value |
|---|---|
| Inlet pressure | 0.285 MPa |
| Inlet temperature | 274 K |
| Discharge pressure | 1.515 MPa |
| Discharge temperature | 360.4 K |
| Volume flow | 3.254 m3·min−1 |
Table 2.
Grid independence verification.
| Case | Circumferential Nodes | Radial Nodes | Axial Nodes | Volume Flow/m3·min−1 | Number of Meshes |
|---|---|---|---|---|---|
| Case 1 | 360 | 30 | 125 | 2.633 | 3,848,194 |
| Case 2 | 720 | 20 | 125 | 2.807 | 4,536,394 |
| Case 3 | 720 | 30 | 125 | 2.837 | 6,477,694 |
| Case 4 | 720 | 20 | 200 | 3.248 | 6,693,394 |
| Case 5 | 720 | 20 | 250 | 3.251 | 8,203,294 |
Table 3.
Structural parameters of the screw compressor.
| Parameter | Male Rotor | Female Rotor |
|---|---|---|
| Number of teeth | 5 | 6 |
| Diameter of rotor D/mm | 138.507 | 109.76 |
| Length of rotor L/mm | 152 | 152 |
| Wrap angle of male rotor | 300° | 250° |
| Screw lead of the male rotor T/mm | 181.761 | 218.113 |
Table 4.
Comparison of the macroscopic performance of the compressor under two working conditions.
| Method | 75% Load | 100% Load | ||||
|---|---|---|---|---|---|---|
| Input Power | Volumetric Efficiency/% | Isentropic Efficiency/% | Input Power | Volumetric Efficiency/% | Isentropic Efficiency/% | |
| Measured | 26.986 | 52.583 | 61.281 | 39.9 | 85.699 | 70.356 |
| CFD | 26.325 | 51.848 | 59.701 | 39.643 | 85.541 | 69.686 |
| Error% | 2.449 | 1.398 | 2.578 | 0.645 | 0.184 | 0.952 |
© 2019 by the authors. Licensee MDPI, Basel, Switzerland. This article is an open access article distributed under the terms and conditions of the Creative Commons Attribution (CC BY) license (http://creativecommons.org/licenses/by/4.0/).
Share and Cite
MDPI and ACS Style
Wu, H.; Huang, H.; Zhang, B.; Xiong, B.; Lin, K. CFD Simulation and Experimental Study of Working Process of Screw Refrigeration Compressor with R134a. Energies 2019, 12, 2054. https://doi.org/10.3390/en12112054
AMA Style
Wu H, Huang H, Zhang B, Xiong B, Lin K. CFD Simulation and Experimental Study of Working Process of Screw Refrigeration Compressor with R134a. Energies. 2019; 12(11):2054. https://doi.org/10.3390/en12112054
Chicago/Turabian StyleWu, Huagen, Hao Huang, Beiyu Zhang, Baoshun Xiong, and Kanlong Lin. 2019. "CFD Simulation and Experimental Study of Working Process of Screw Refrigeration Compressor with R134a" Energies 12, no. 11: 2054. https://doi.org/10.3390/en12112054
Note that from the first issue of 2016, this journal uses article numbers instead of page numbers. See further details here.