Economic and Environmental Multiobjective Optimization of a Wind–Solar–Fuel Cell Hybrid Energy System in the Colombian Caribbean Region


1
Programa de Ingeniería Mecánica, Universidad del Atlántico, Carrera 30 Número 8-49, Puerto Colombia, Área Metropolitana de Barranquilla 080007, Colombia
2
Departamento de Energía, Universidad de la Costa, Barranquilla 080002, Colombia
*
Author to whom correspondence should be addressed.
†
These authors contributed equally to this work.
Energies 2019, 12(11), 2119; https://doi.org/10.3390/en12112119
Submission received: 17 April 2019
/
Revised: 12 May 2019
/
Accepted: 15 May 2019
/
Published: 3 June 2019
(This article belongs to the Special Issue Hybrid Renewable Energy Systems in Remote Sites 2019)
Abstract
:A hybrid system was analyzed and optimized to produce electric energy in non-interconnected zones in the Colombian Caribbean region, contributing to the reduction of greenhouse gas emissions and the improvement in efficient energy management. A comparative analysis of the performance of hybrid was conducted using a proposed model, built with historical data for meteorological conditions, wind speed, and solar radiation. The model is integrated by a Southwest Wind Power Inc. wind turbine AIR 403, a proton-exchange membrane fuel cell (PEM), an electrolyzer, a solar panel, and a regulator based on proportional, integral, and derivative (PID) controllers to manipulate oxygen and hydrogen flow entering in the fuel cell. The transient responses of the cell voltage, current, and power were obtained for the demand of 200 W under changes in solar radiation and wind speed for each day of the year 2013 in different meteorological stations, such as Ernesto Cortissoz airport, Puerto Bolívar, Alfonso Lopez airport, and Simon Bolívar airport. Through the adjustment of the hydrogen and oxygen flow into the fuel cell, the maximum contribution of power generation from the fuel cell was presented for the Simon Bolívar airport in November with a value of 158.35 W (9.45%). Multiobjective design optimization under a Pareto diagram front is presented for each place studied to minimize the levelized cost of energy and CO2 emission, where the objective control variables are the number of panel and stack in the photovoltaic (PV) system and PEM.
1. Introduction
As a measure to the global issue of greenhouse gas emissions and global warming, several countries around the world [1], especially countries in development processes [2], such as India, Pakistan, Nepal, Afghanistan, and so on [3], have begun to diversify their energy matrix by incorporating renewable energy generation systems [4]. The potential for growth of these generation systems has allowed this solution to be positioned as a mature technology in the energy sector, thus attracting the interest of the European scientific community [5], which plays an essential role for the improvement of worldwide environmental indicators [6].
Several countries such as China, USA, Germany, Spain, and others have been using renewable energy resources during the last decade [7]. Colombia is not the exception, national regulations have motivated the rational use of energy and preservation of the environment [8], emphasizing in harnessing renewable energy resources such as solar [9] and wind energy [10]. Nevertheless, the database of hybrid energy performance with local data is limited, although no specific studies have been conducted in the Caribbean region to quantify the economic and environmental impact of this energy generation solution for non-interconnected zones.
However, the power generation percentage contribution, of these renewable energy systems, is low compared to conventional power generation systems. The primary energy resource is the hydroelectric with 69.5%, followed by thermal energy with 29.6% and renewable energy with a percentage less than 1% [11], which corresponds to limited researches developed to evaluate the energy performance of hybrid power generation systems, when they operate with the energy resources available in the different regions of the country [12]. Therefore, the electricity generation in Colombia, from renewable resources, is scarce; thus, excluding the hydroelectric power generation, wind energy is the most significant contributor to the national energy systems. In order to achieve an energy availability at medium and long term, the country must have proper support which takes into consideration the appropriate complementarity and implementation of all technologies and energy sources available. It is required to study this type of technologies through modeling and simulation with local resources and meteorological conditions [11]. In the north region of Colombia, specifically in La Guajira, renewable resources are extensive and varied, which favors the transition to this new model of power generation [12]. It can be demonstrated that the solar radiation and the high levels of wind speed recorded, provide the necessary amount of renewable energy to supply the energy demand of the region. Additionally, a significant part of the country can be supplied from thermosolar systems, photovoltaic or wind farm; however, its use is reduced, due to economic, sociopolitical, and technical factors.
Hybrid power generation systems allow switching the energy source to meet the power demand; hence, these systems have been extensively studied to propose energy solutions in off-grid zones [13]. Economic analysis was carried out for the three photovoltaic systems in remote areas of the Colombian indigenous population, where the use of this alternative technology is competitive under certain assumptions [14].
Simulations of this type of system have been developed on both small and large scale [15], concluding that these energy sources have a common problem that makes the power generation from renewable resources unfeasible, through time due to the dependence of the climatological conditions. Moreover, the natural resources necessary for energy conversion are not consistently available throughout the time, which justifies the need to propose techniques for optimizing the performance of these systems with the local conditions of each region, focusing on regions where there is a high potential for power generation as the sites evaluated in this study.
On the other hand, different studies have been developed in order to maintain a reliable energy supply to the grid, besides to have the optimum operation of microgrids, which are sets of loads, generators, and energy storage systems, isolated or connected to the rest of the electricity grid [16]. Studies like this require the development of mathematical models of the hybrid energy generation system, due to the control strategies based on the model, which supports the objective of this study in proposing and evaluating a model in the face of changes in the wind and solar resources. Furthermore, the assessment of hybrid energy systems takes into account the tidal energy source with highly sophisticated and robust mathematical formulations [17]. Smaeili and Shafiee [18], studied the adaptability of hybrid generation systems through mathematical modeling and MATLAB simulations for autonomous operation. Using proportional, integral, and derivative (PID) controllers as a control technique, Valencia et al [19] studied the response of a hybrid system for two meteorological stations with a demand of 200 W in order to maximize efficiency through the use of different control techniques, however no study of resource optimization was performed.
In countries such as Brazil, photovoltaic solar technology has been integrated into hybrid systems [20]; the proposed model allows calculating a satisfactory response to the tests established and satisfactory results with measurements acquired infield. Nevertheless, the results obtained are only applicable to this specific region, and the impact of climate variables on a hybrid photovoltaic solar and fuel cell production is not considered. This technology is a highly reliable and functional energy alternative [21], with advantages such as the use of few parts, low maintenance requirements and quiet operation [22]. Even in Mexico, the study of this technology in Veracruz was highlighted [23], although the properties of the renewable resource in this region are different from the available in Colombia.
Thus, traditionally in different countries, and especially Colombia, has been widely considered the supply of electricity to communities away from the electricity grid through fossil fuels. Even today, it is common to find isolated communities, which have electricity a few hours a day with fuel generation and a minigrid. However, this solution presents some problems, such as the cost of fuel, which increases the cost of electricity supply. Although in some countries there are state subsidies for fuel used in isolated electricity generation, which reduces the final cost to the user, the cost to society is the same, since it is the state that assume the cost, rather than the user. The transport of fuel also represents an important portion of the cost of supply, being a limiting factor, since in most cases they are communities far away and isolated from the main transport routes. On the other hand, this form of generation has a negative environmental impact, due to greenhouse gases, and possible fuel spills during transportation and storage.
As an alternative, small-scale renewable generation systems have been developed, including photovoltaic, wind, hydro, and biomass systems to meet the demands of small residential units. These technologies have the advantage of very low operating and maintenance costs; however, in many cases, the investment costs are higher than the fossil generation alternative.
The main contribution of this study is to evaluate the complementarity of wind, solar, and electric power generation in a proton-exchange fuel cell (PEM), through a mathematical model of a hybrid system operating in different places in the Colombian Caribbean Region for a specific demand of 200 W. A multiobjective optimization under a Pareto front is presented for each place studied to minimize the levelized cost of energy and CO2 emission. The results obtained help to contribute to the economic and technical viability of the adoption of this technology to the local context in Colombia.
2. Methodology
2.1. Description of the Region and Information
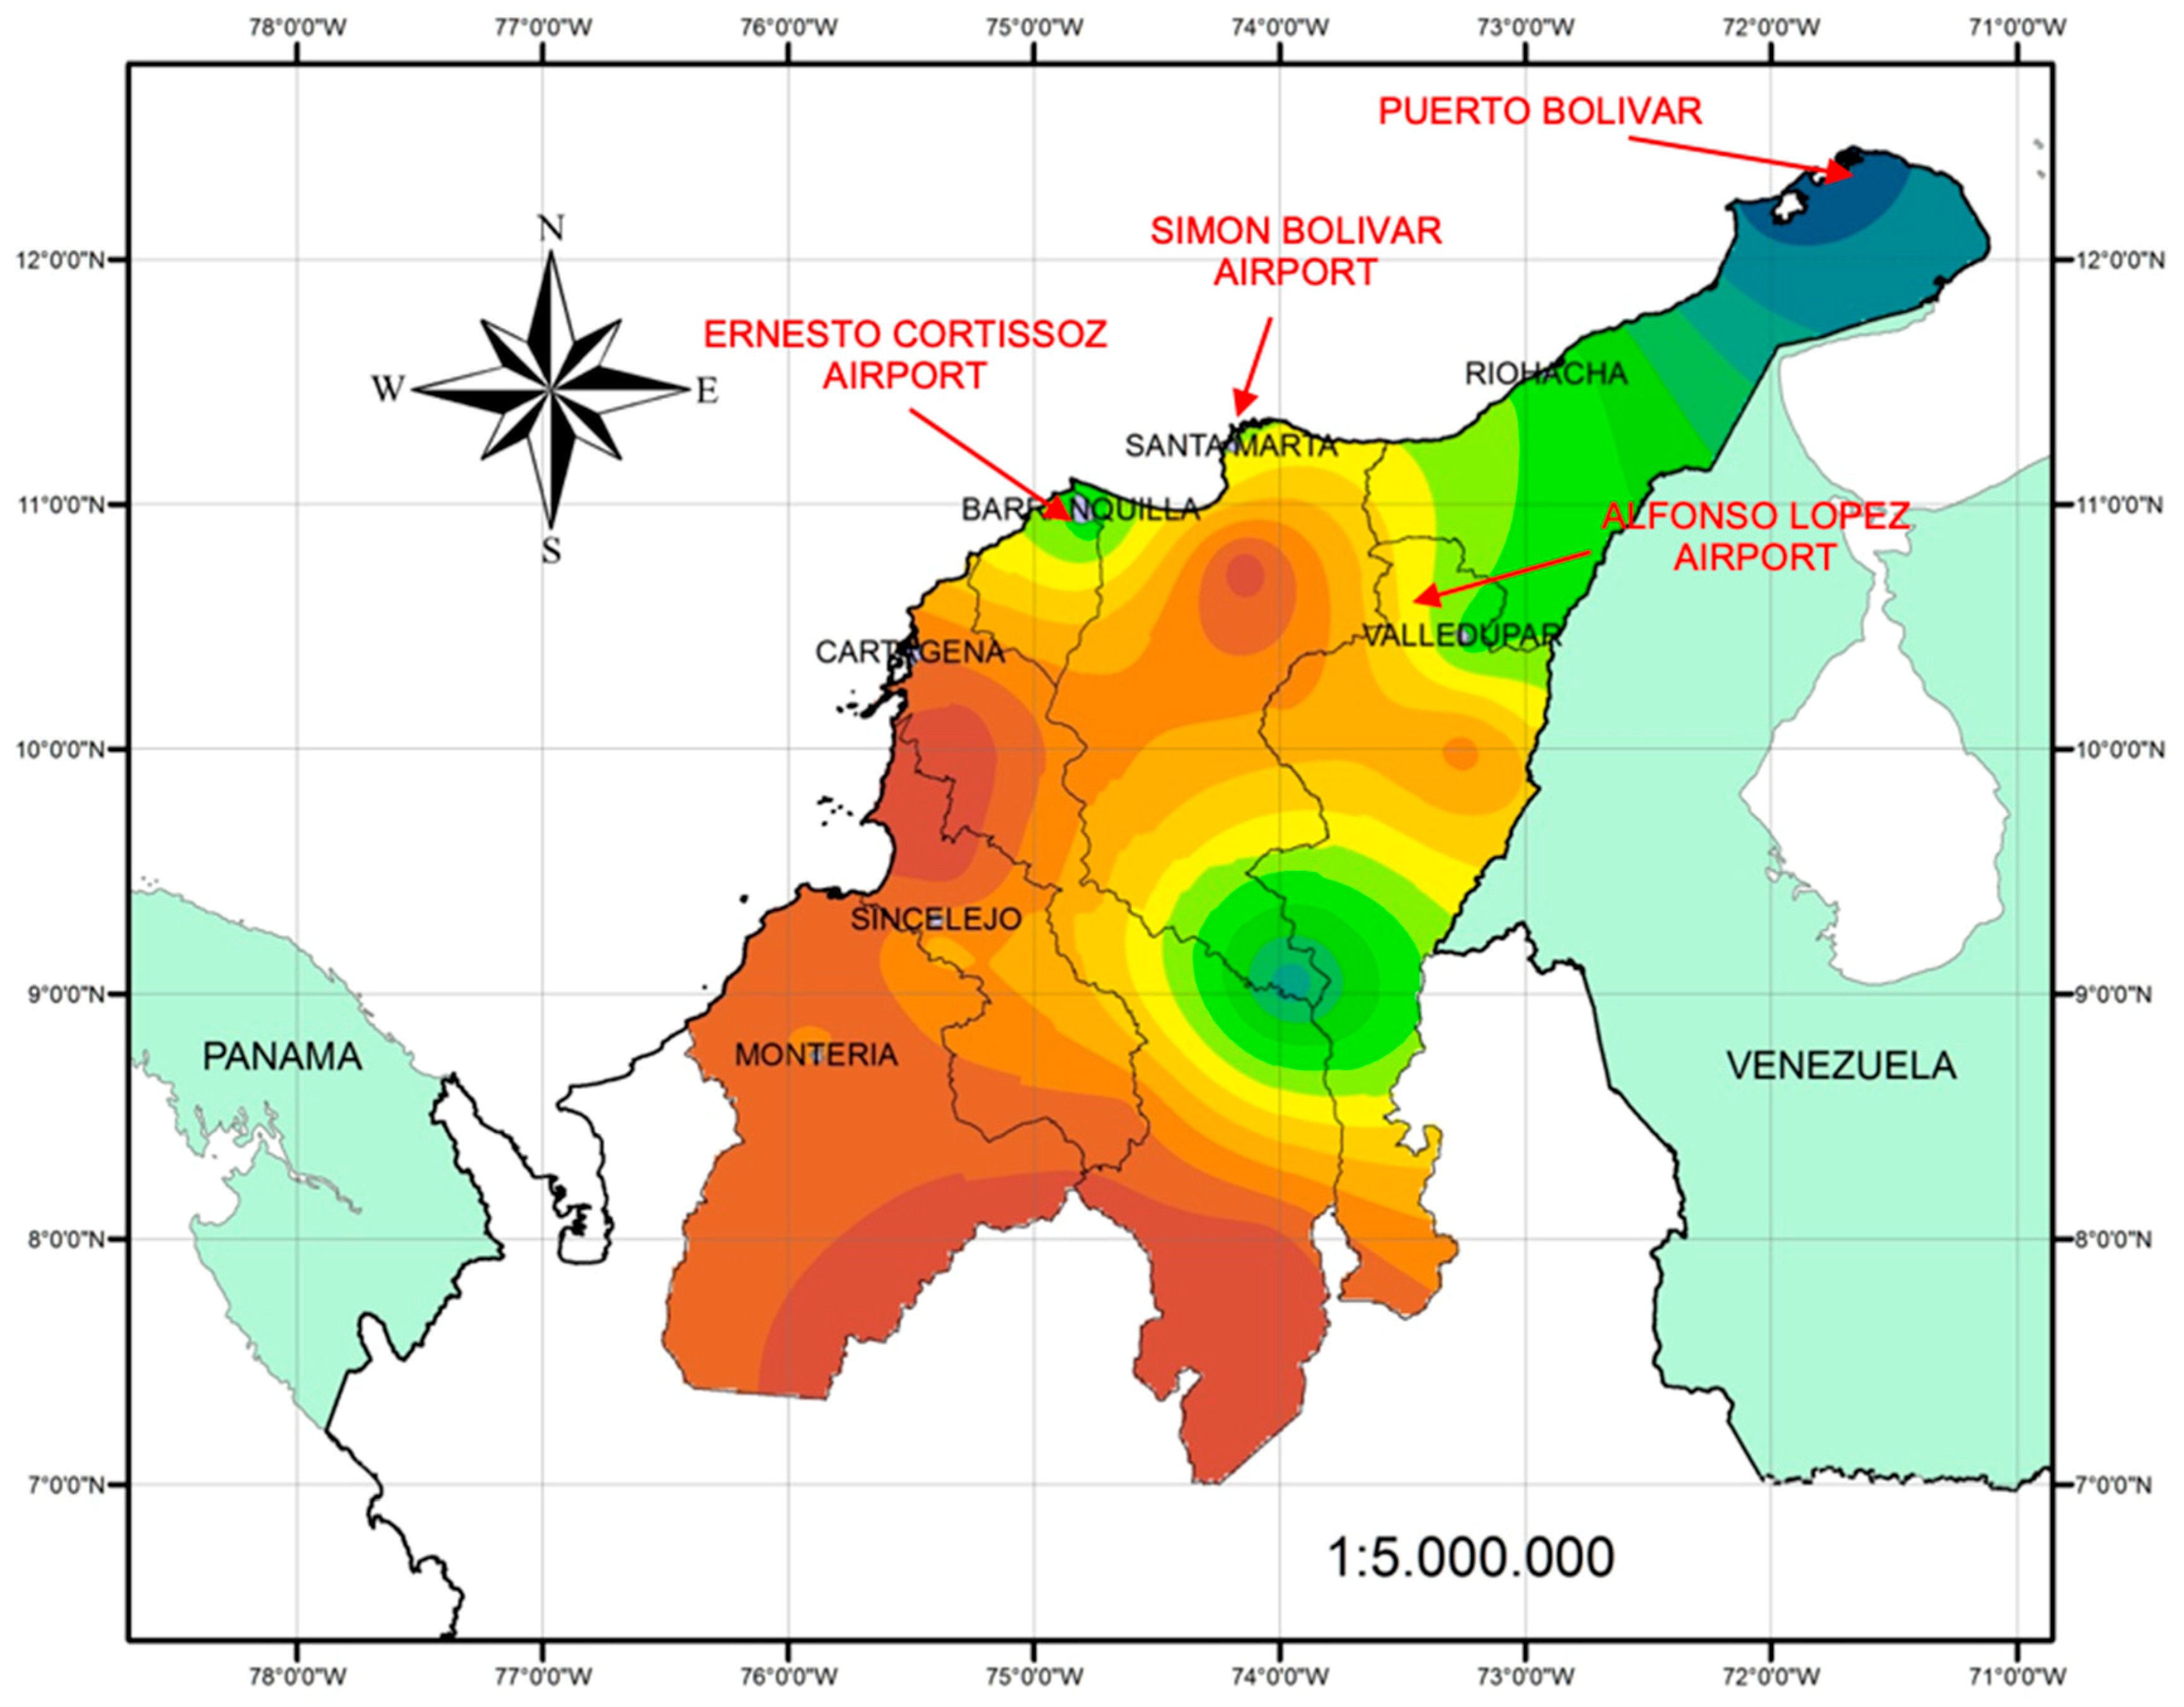
The Colombian Caribbean region, as shown in Figure 1, is located in the north of the country with a population of approximately 11 million people, located in the area of roughly 132,270.5 km2 (11.6% of the national territory) [24]. It is bounded to the north by the Atlantic Ocean, to the east by Venezuela, to the west by the Pacific Ocean and the south by the Andean region is made up from flat areas except Magdalena and the snow-capped mountains (5755 m) and a full coastal region. Also, with a climatic diversity ranging from tropical to subtropical, where the average temperature is 30 °C and even reaching up to 35 °C in the Riohacha because of its arid and desert zone.
2.2. System Description
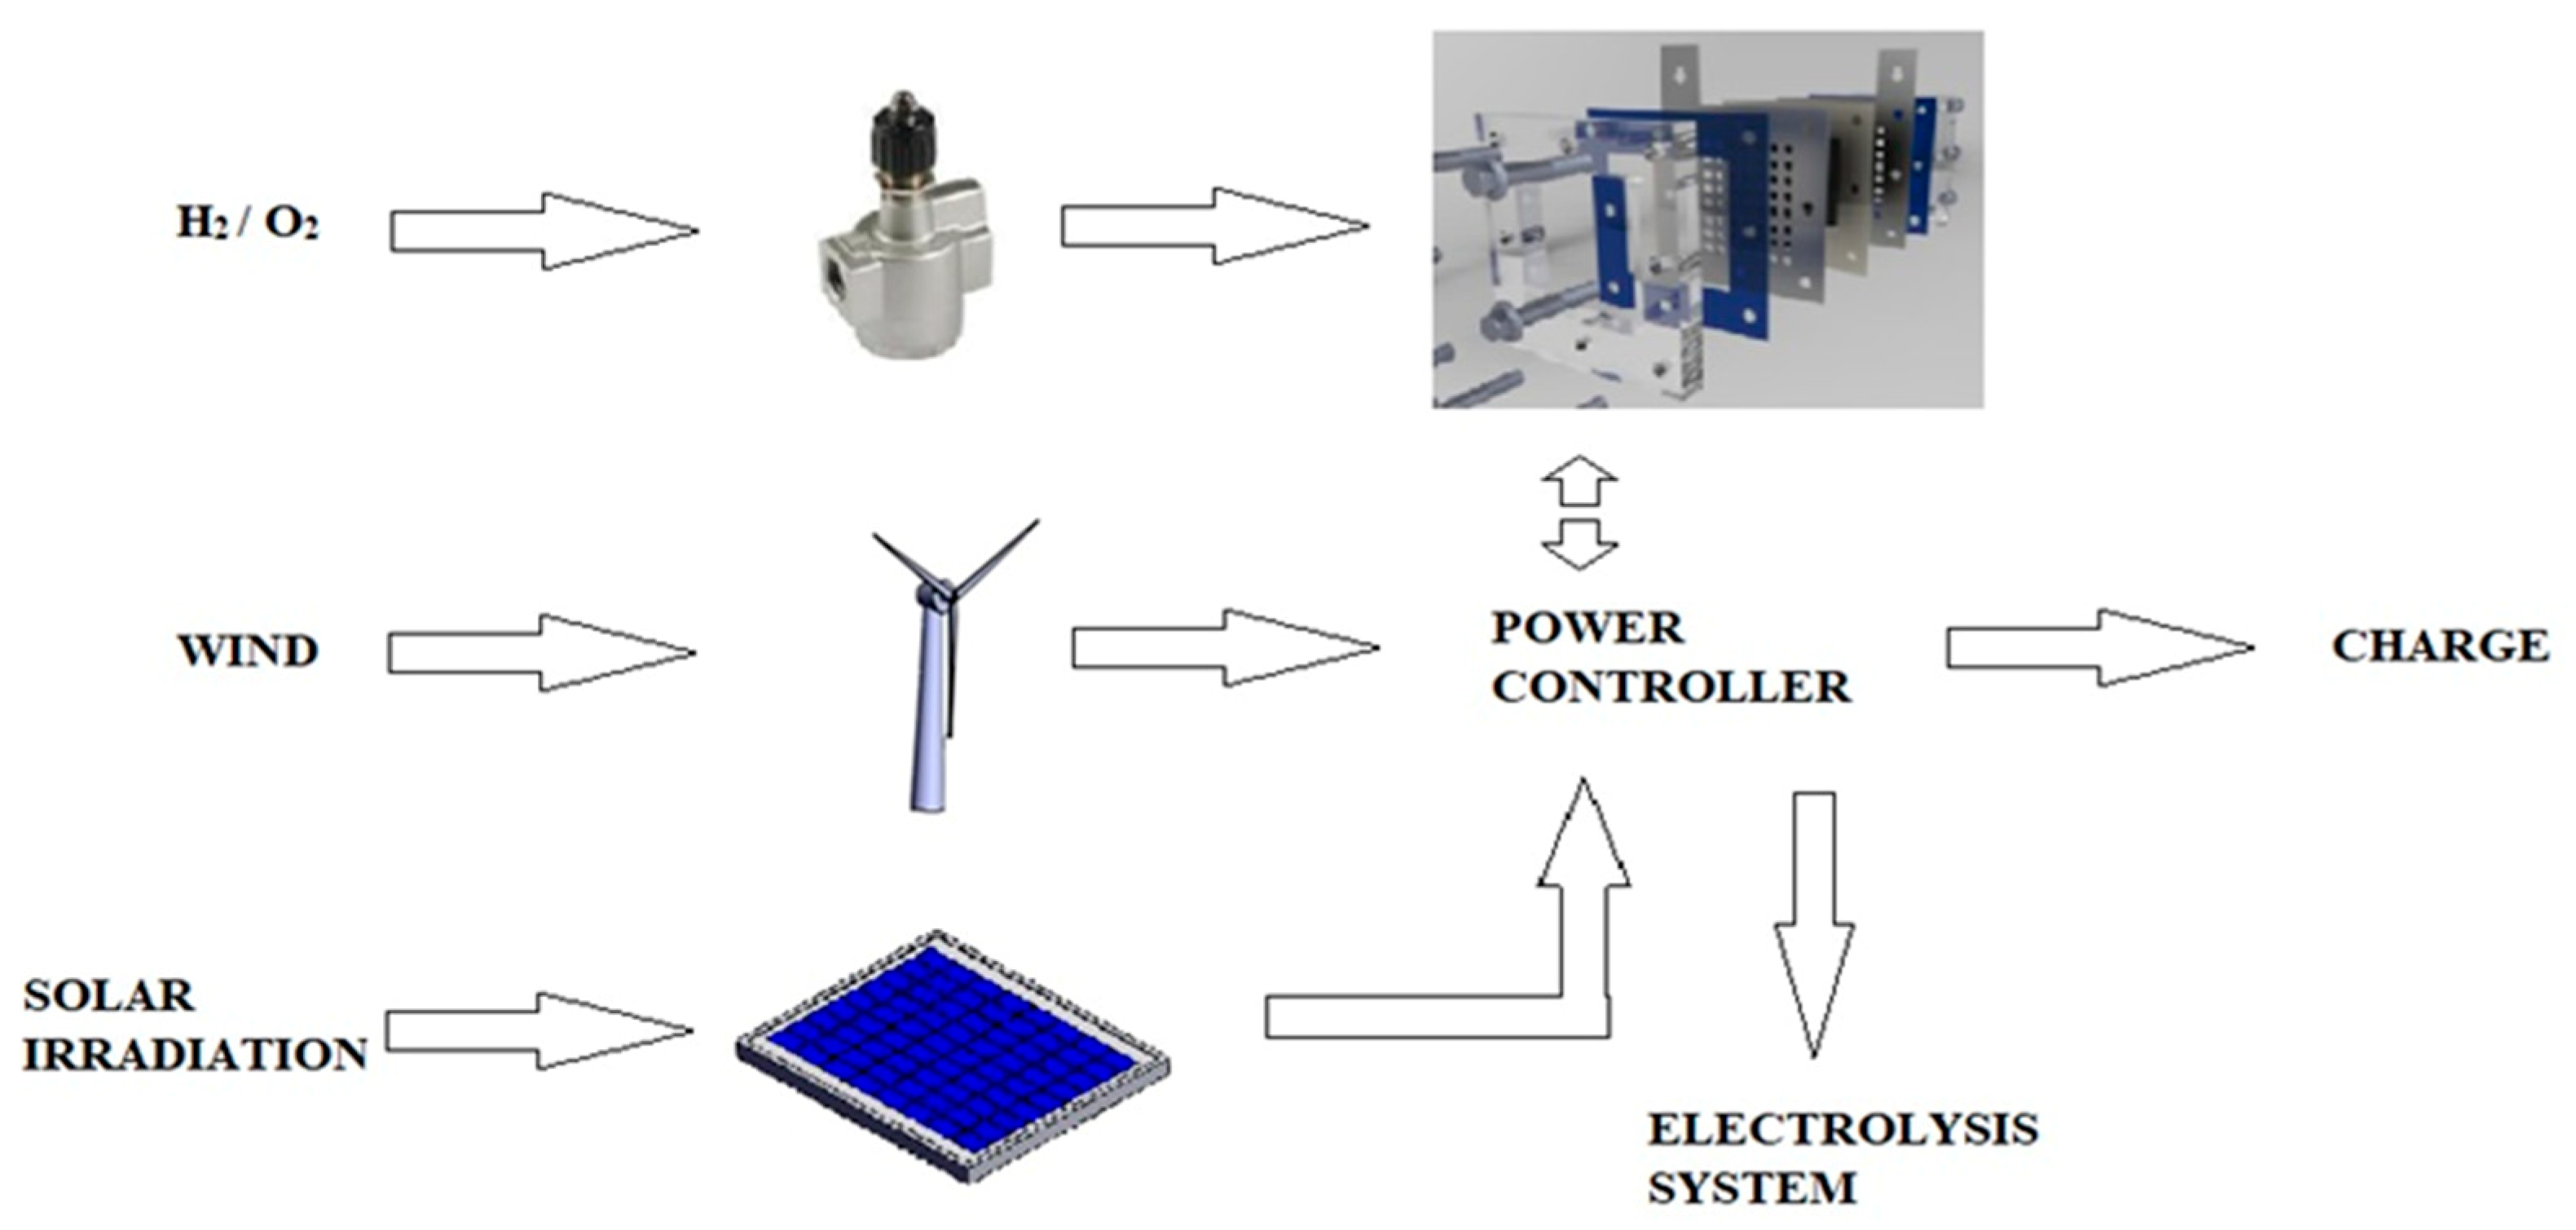
The hybrid energy power generation system (HEPGS), as shown in Figure 2, is composed by a solar power generation module with a unit power ratio of 37.08 W, a maximum voltage and current of 16.56 V and 2.25 A, respectively, for a total of 36 cells in series and 1 in parallel [25]. A Southwest Wind Power Inc. wind turbine AIR 403 has the ability to generate a peak power of 820 W at a wind speed of 40 miles/hour [25]. Finally, a PEM fuel cell, which produces 401.23 W, a voltage and current of 48 V and 8.26 A, when a molar flow of hydrogen and oxygen of 0.005 mol/s at 25 °C is supplied to the chemical reaction. The system was complemented with an electrolyzer for the generation of hydrogen and power regulator that operates with two PID controllers tuned to the Ziegler Nichols method to manipulate the flow of oxygen and hydrogen that has been supplied to the cell [19].
2.3. Mathematical Fuel Cell Model
The behavior of the PEM type fuel cell has been previously studied by [18], where the thermodynamic potential E is calculated using the Nernst equation [26], resulting in the Equation (1)
where E means energy and T is the operating temperature. The concentration of dissolved oxygen in the gas–liquid interface () is defined by Henry’s law, as shown in Equation (2)
The overvoltage activation () and the internal resistance () are calculated by the experimental relationships presented in Equations (3) and (4) as
where the electric current of the cell is IFC.
Fuel cell current and activation resistance are related as Equation (5)
The output voltage of the fuel cell V is given by Equation (6)
where refer to the ohmic and activation voltage, respectively.
The dynamics of the activation voltage of the fuel cell is described by Equation (7)
where the letter C represents capacitance, the loss of the ohmic voltage and the total voltage contained in the fuel cell Vstack is described by Equations (8) and (9) respectively
Anode and cathode pressure are calculated as shown in Equations (10) and (11)
where R represents the universal constant of the gases, F the constant of Faraday, and finally the and the molar density and mass flow of each element, respectively. By the other side, the energy balance in the air-cooled fuel cell was expressed by Equation (12)
The rate of hydrogen production in the electrolyzer is given by Faraday’s Law as shown in Equation (13)
where nF, nC, and Ie represent Faraday efficiency, serial electrolyzed number, and the electrolyzer´s current, respectively. Finally, the relationship between the theoretical and actual maximum amount of hydrogen produced by the electrolyzing is given by Equation (14)
2.4. Mathematical Model of the Photovoltaic Solar Panel
The model used for the photovoltaic solar system is described in Equations (15) and (19), where economic evaluations were made for different configurations [18], as well as applications of control techniques [19], through the use of parameters and operating values of the modeling of this type of systems [25], where the panel current is given by Equation (15) [25]
where Iph is the photovoltaic current, ISCr is the current short-circuit, and is the lighting of photovoltaic modules.
In the same way, the inverse saturation current is defined () and the saturation current (, which is dependent on the temperature of the panel, they are given by the Equations (16) and (17), respectively
where VOC is the solkar module open-circuit voltage, q represents the electron charge, A is the flow area, Ego is the band space for silicone, and Ns the number of components connects in the system. The output current of the cell corresponds to Equation (18)
where . Finally, the total power is given by Equation (19)
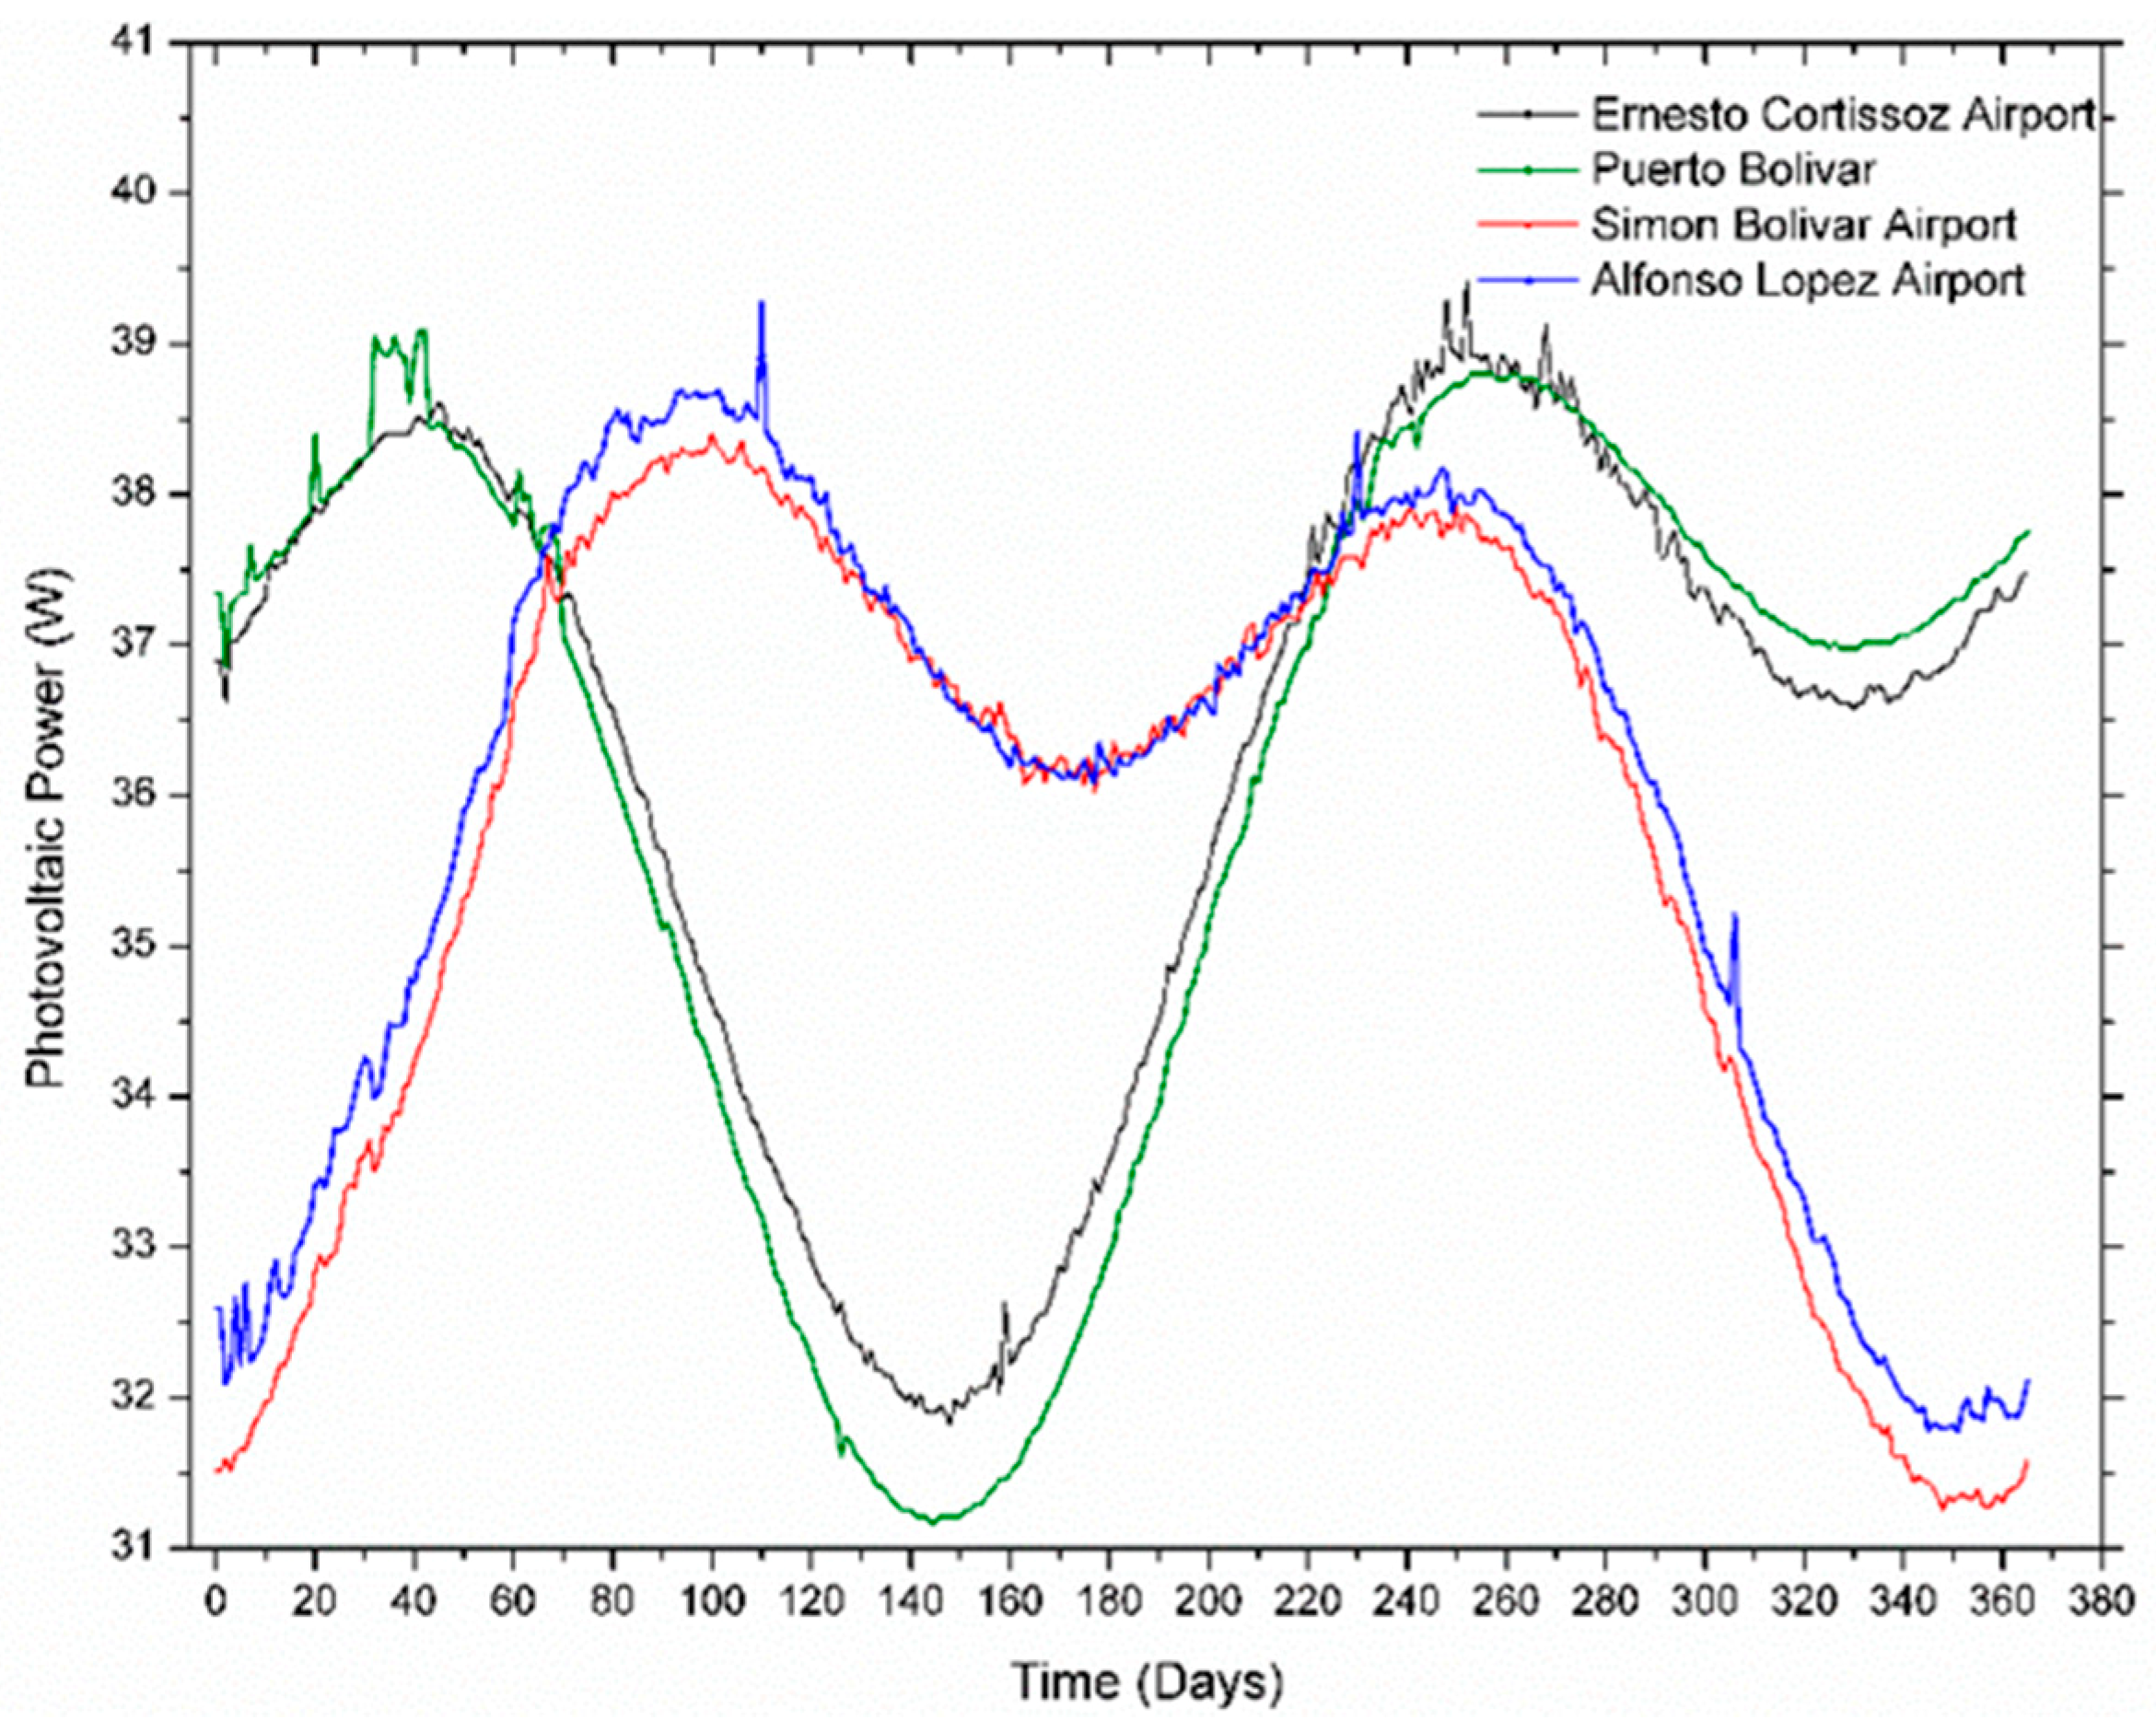
The performance of the photovoltaic cell is related to the solar irradiation available at the site of operation of the system, which for this study was based on the year 2013 [27], resulting in the behavior shown in Figure 3.
The similarity in the behavior of the power generated by the PV, at the Ernesto Cortissoz airport and Puerto Bolívar, is due to the irradiation, which is similar in both places. In the same way, the behavior for the other two energy substations is correlated to the same effect. The dimensioning of the PV system was given in order to meet the consumption of the processing unit of a weather station to be installed in the Colombian Caribbean region.
2.5. Mathematical Model of the Wind Power
The third source of energy presented in the hybrid system was wind energy, which is a function of wind speed at the operating height of the wind turbine. For the projection of wind speed at axle height, Hellmann’s law was applied [28] as is shown in Equation (20)
where is the wind speed at height h to be calculated, is the wind speed at a reference height , and is the wind velocity at the altitude of the relative roughness, values available for these places in the wind Atlas [28].
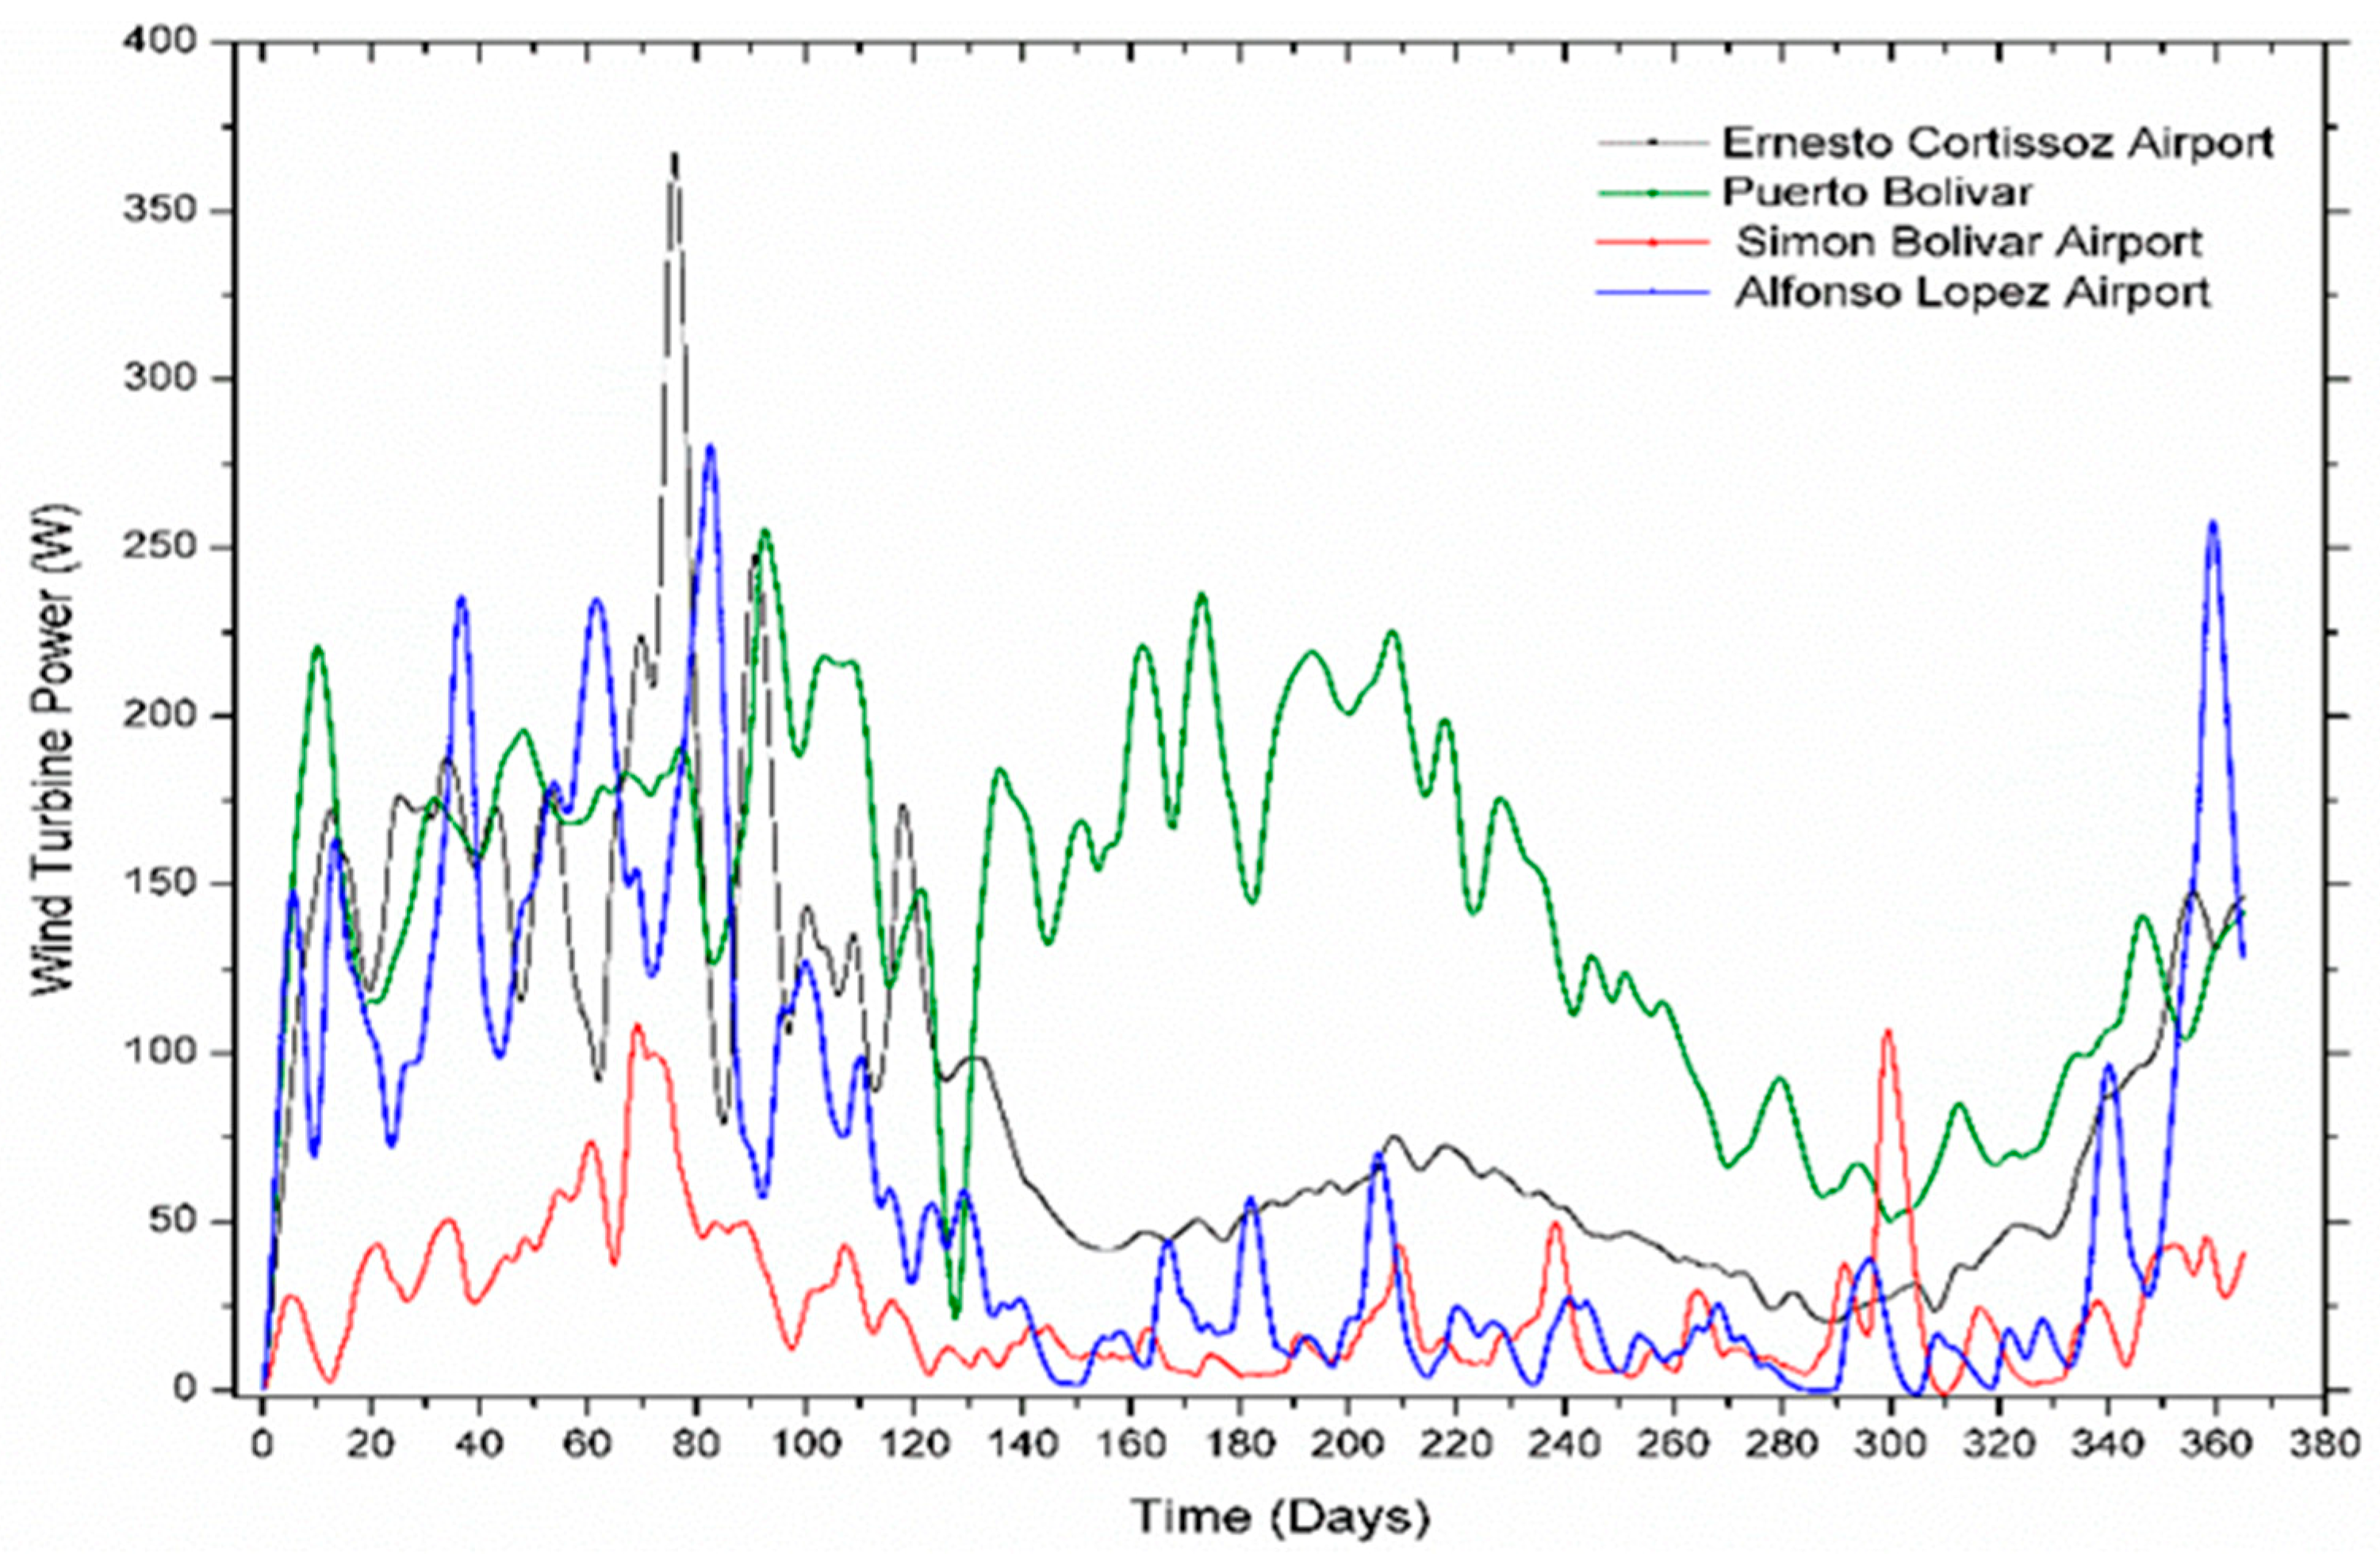
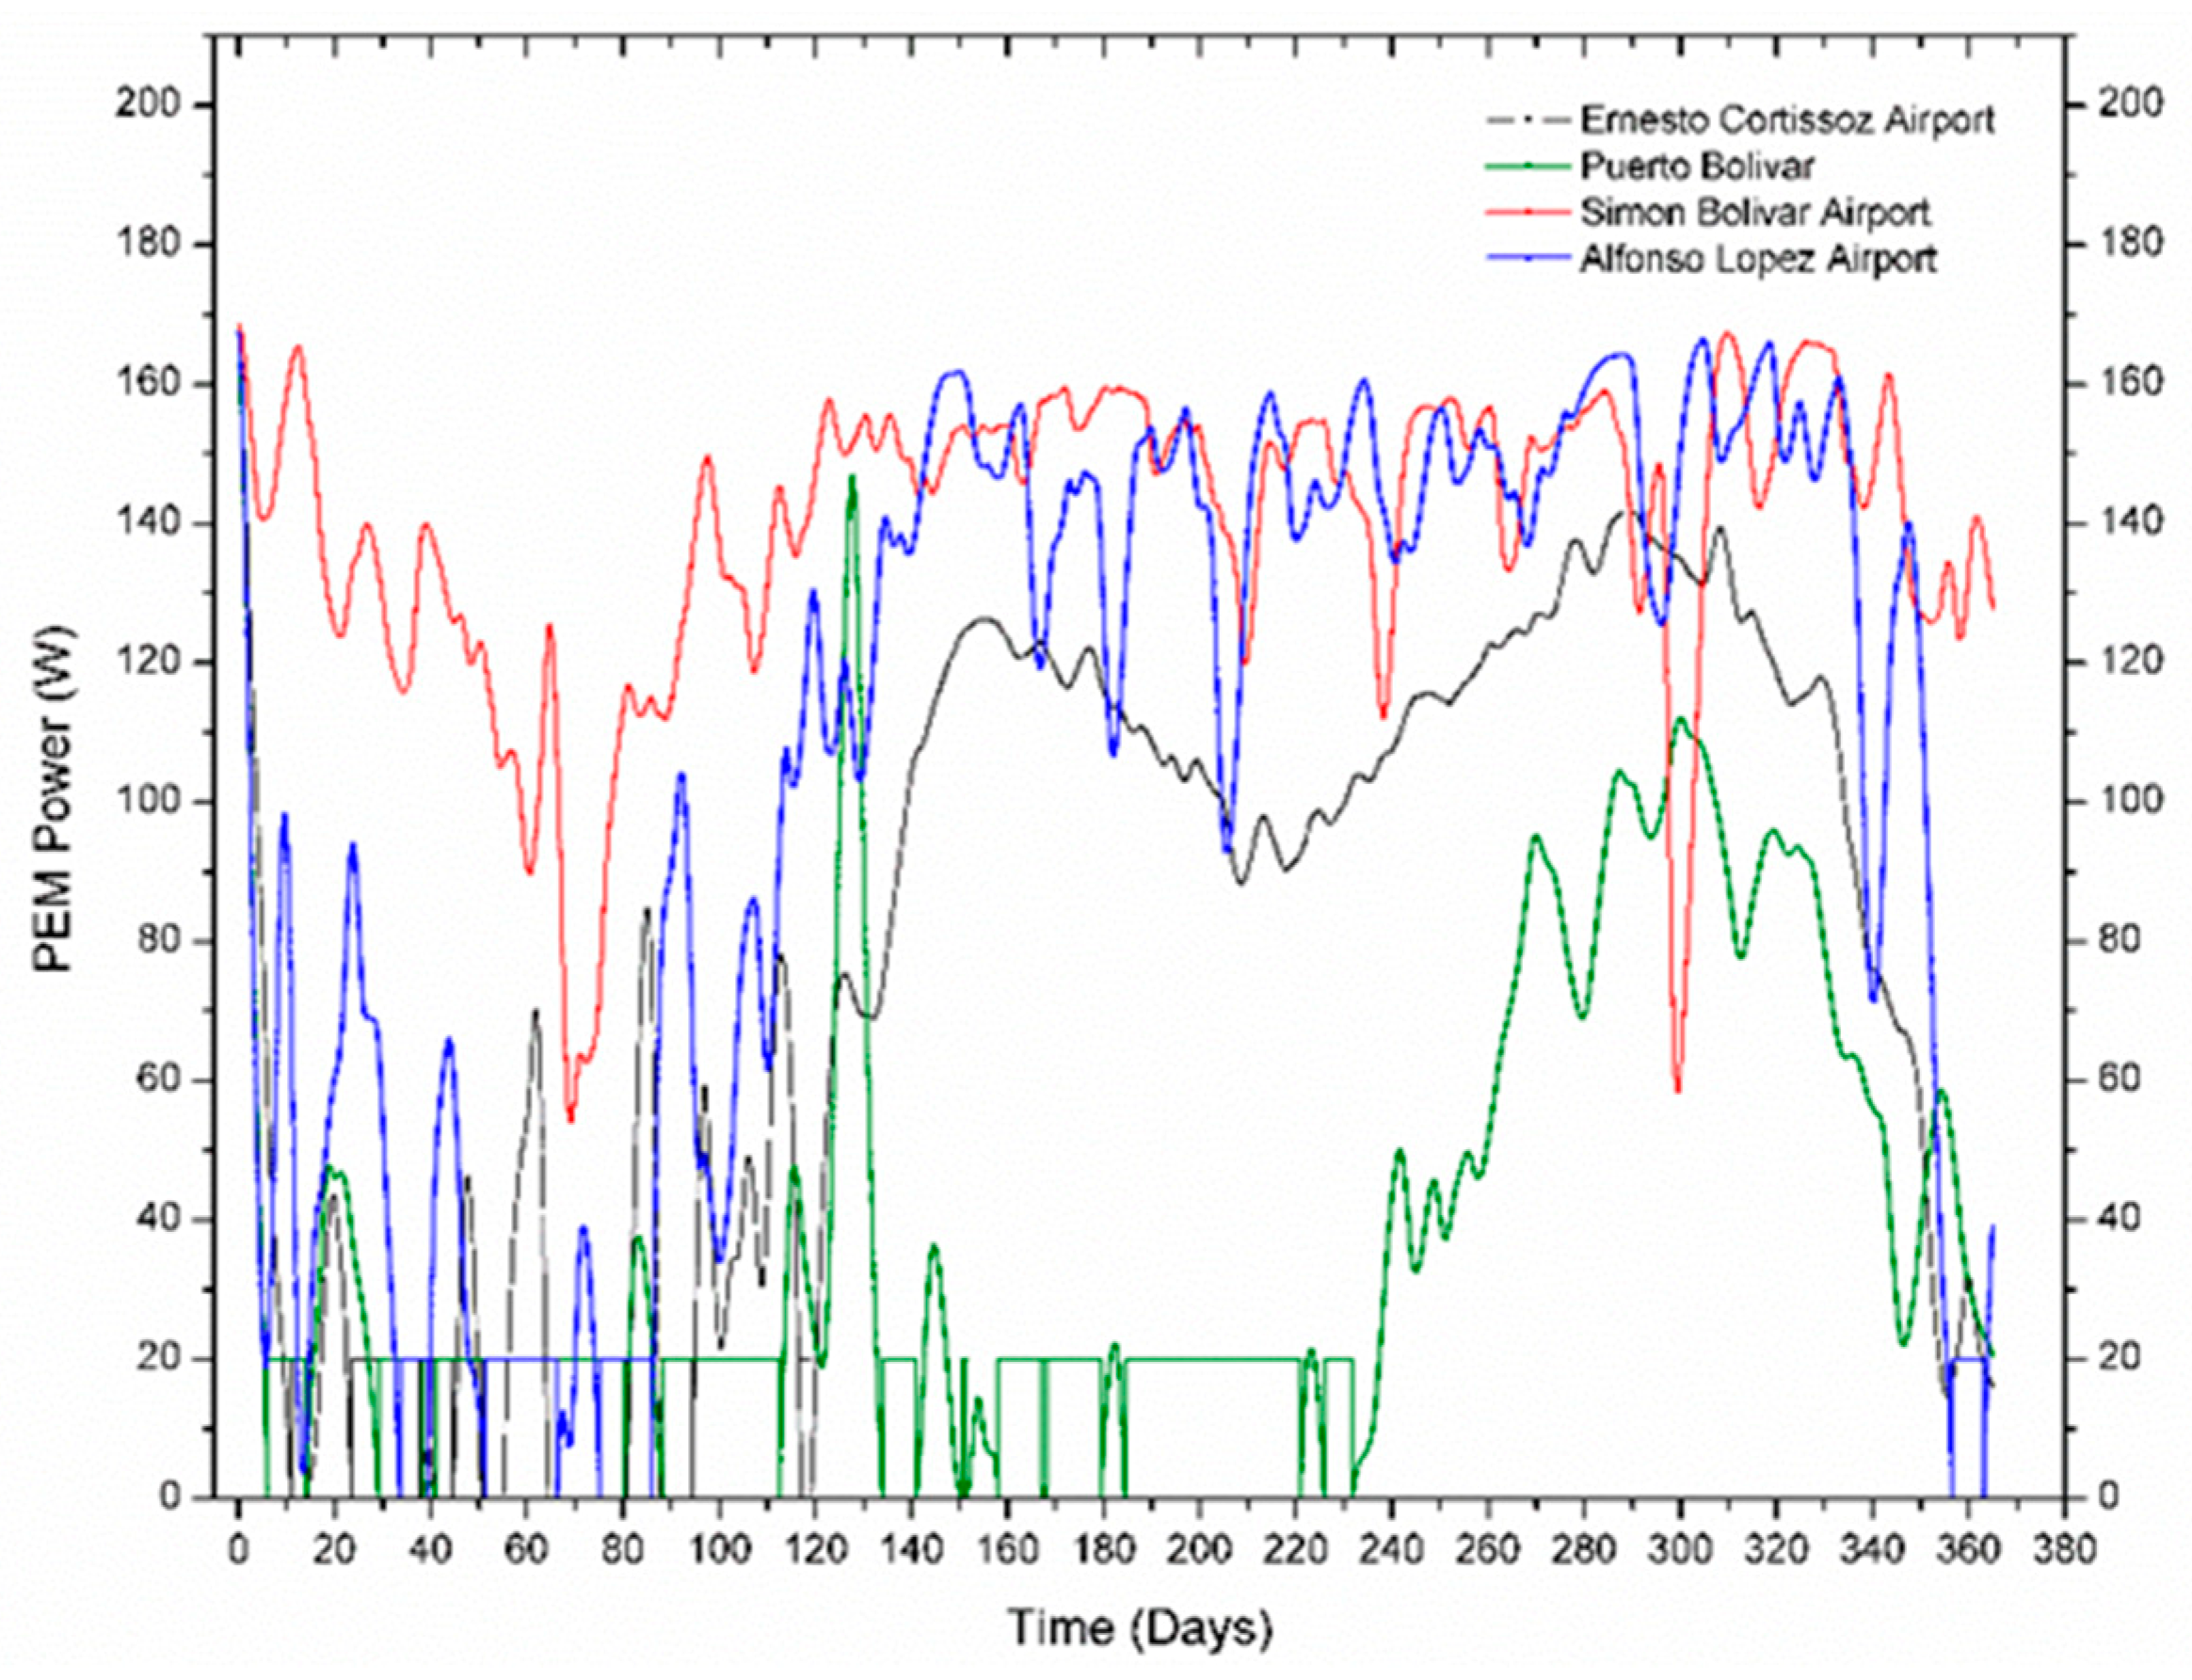
The dynamic behavior of the power generated by the wind turbine operating in each of the study sites is shown in Figure 4.
3. Results
3.1. Results of Dynamic Behavior
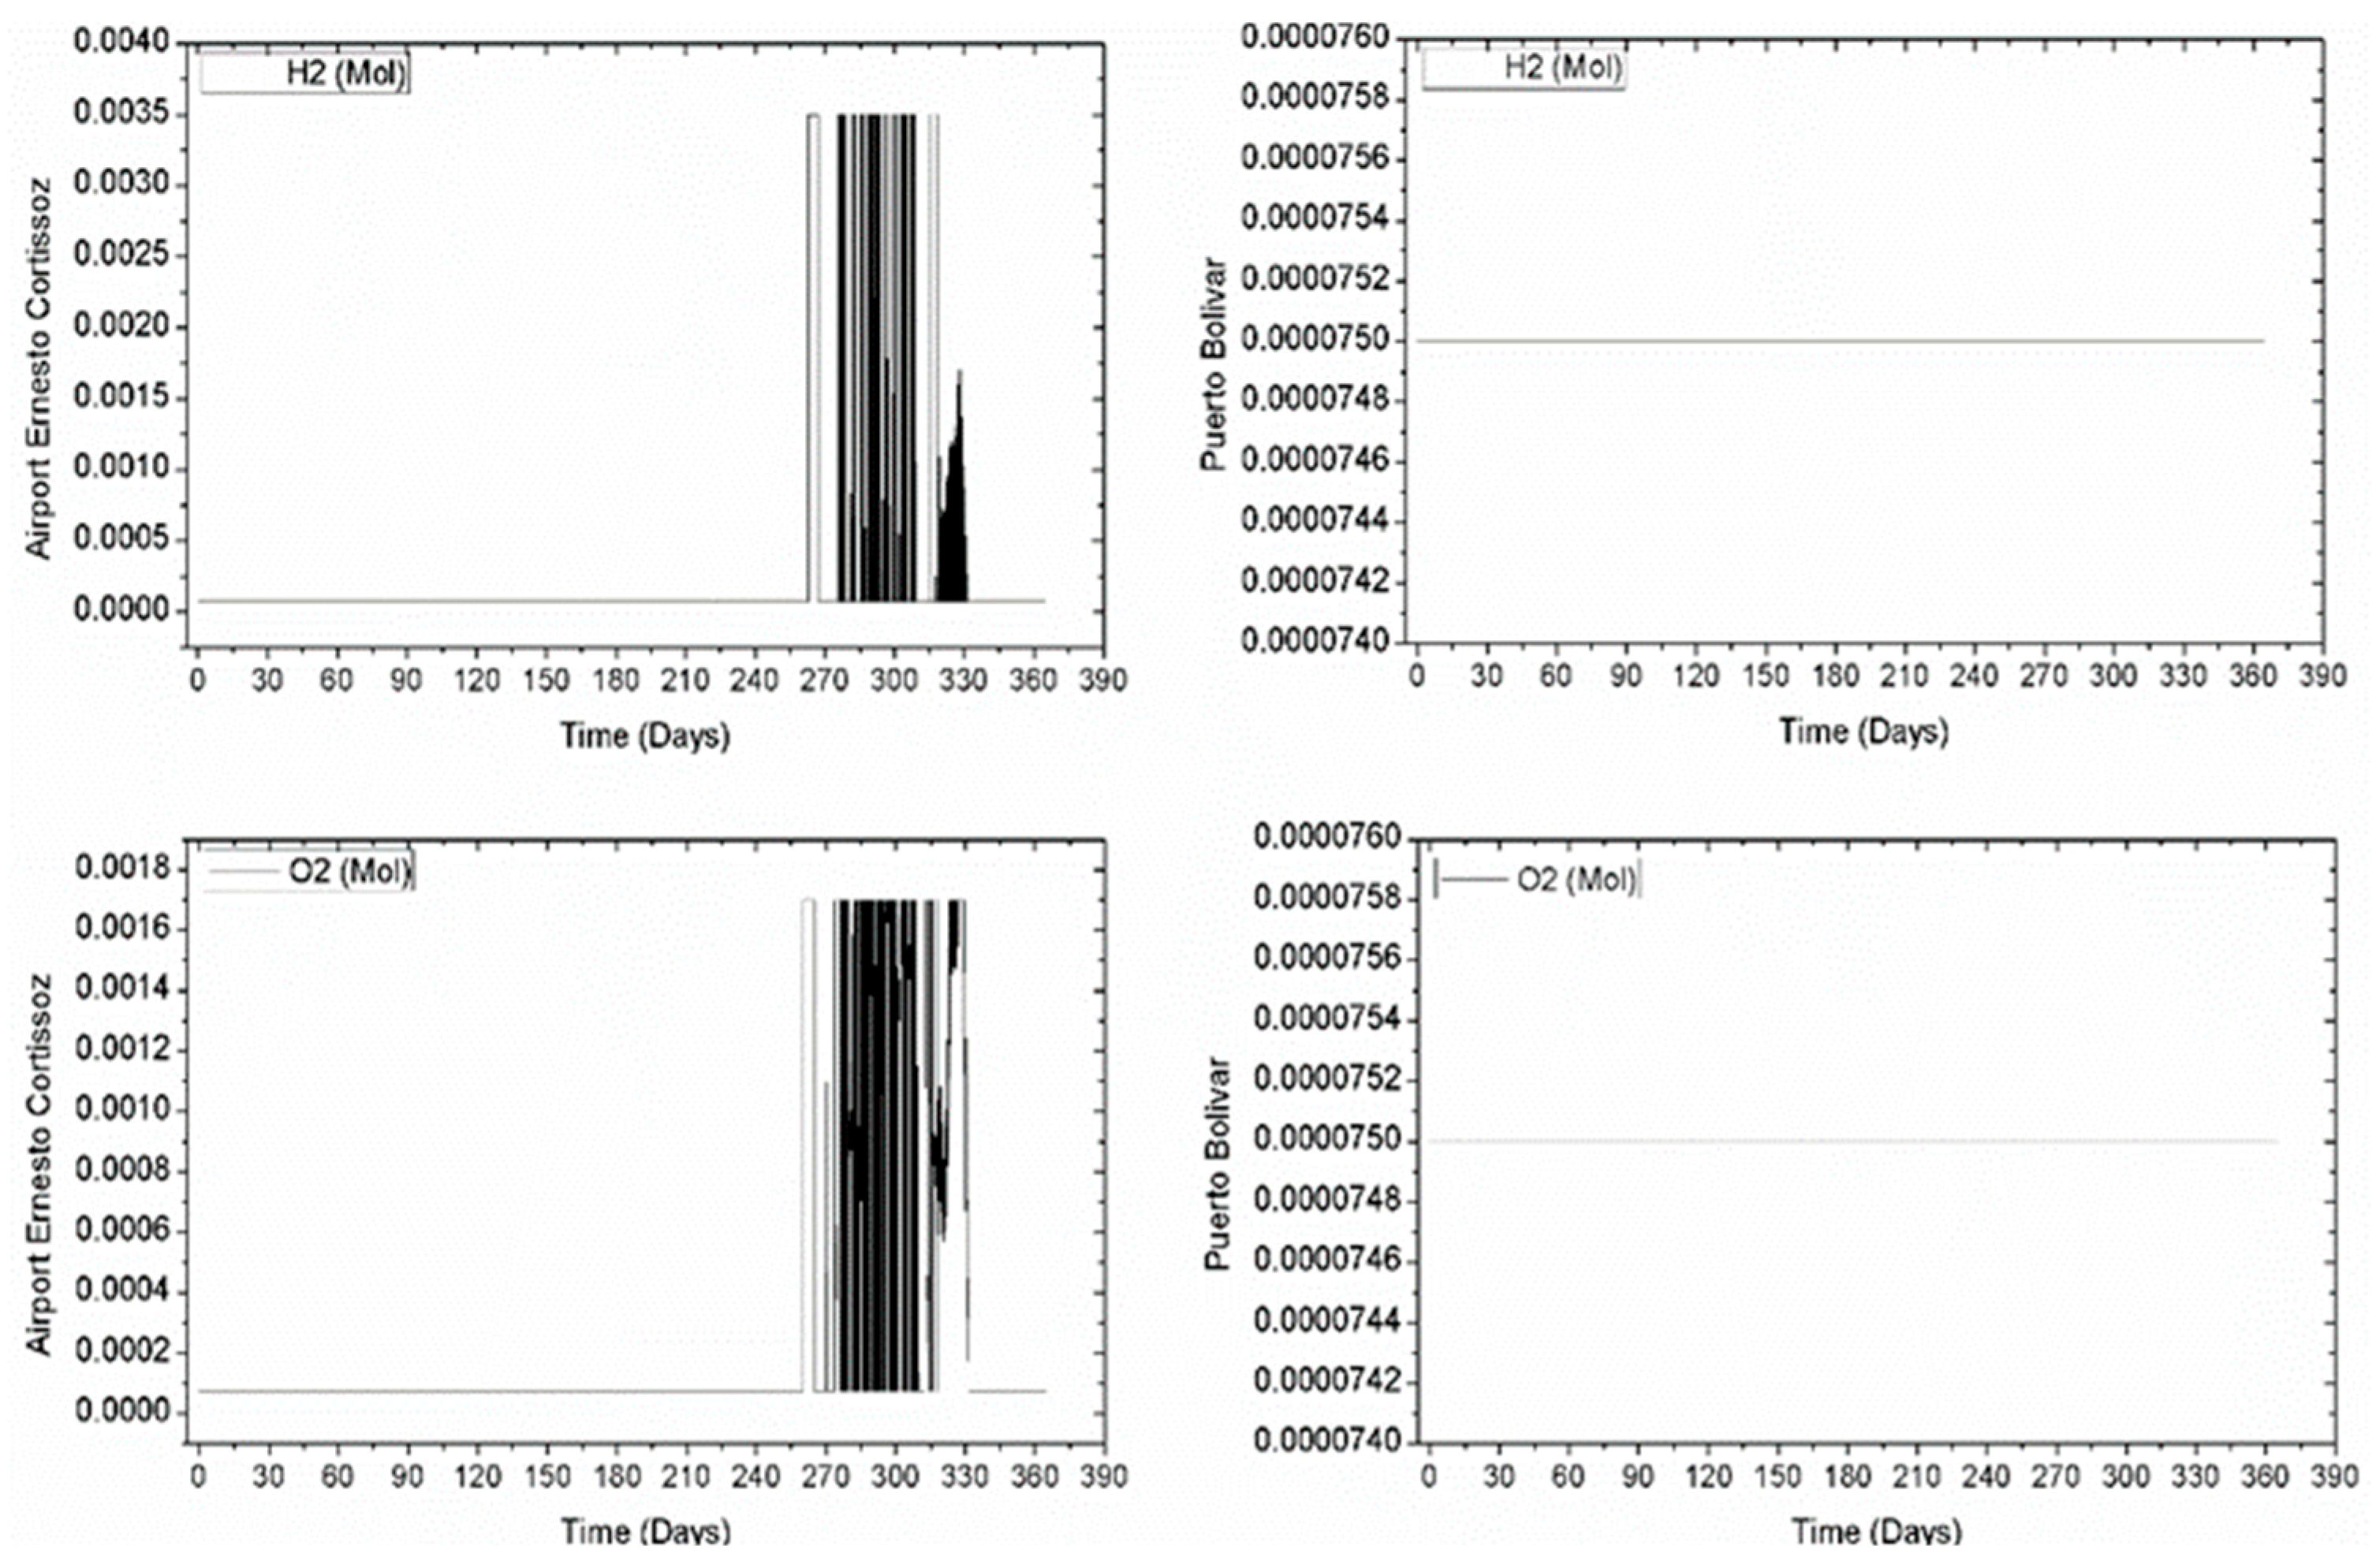
Under the dynamic conditions established by the HEPGS in the different places of interest, the complementarity of solar and wind energy with the energy delivered by the PEM cell was evaluated to supply the 200 W demand. With the purpose to achieve the desired power in the cell, the molar flow of oxygen and hydrogen was regulated by PID controllers, obtaining the flow behavior shown in Figure 5 and Figure 6. For the case of Ernesto Cortissoz airport, as shown in Figure 5, during January to August the cell operated at a low loading rate with the molar flow for hydrogen and oxygen of 7.50 × 10−05 mol/s because wind power generation along with solar energy supplied 67.7% of the total energy generated. However, from September to December, the flows had a variation between 0.0005 to 0.0045 mol/s which mean a fuel cell contribution of 53.45%, equivalent to 427.61 Wh in the year.
For the case of the Puerto Bolívar station, both the molar flow of hydrogen and oxygen that entered the PEM cell presented a constant behavior throughout the year with a value of 0.000075 mol/s as shown in Figure 5. Due to the significant amount of wind energy generated, presenting a total of 2159.26 Wh (81.168%) of total wind and solar power generation, the total amount generated by the cell was approximately 484.32Wh (18.32%) for the whole year 2013.
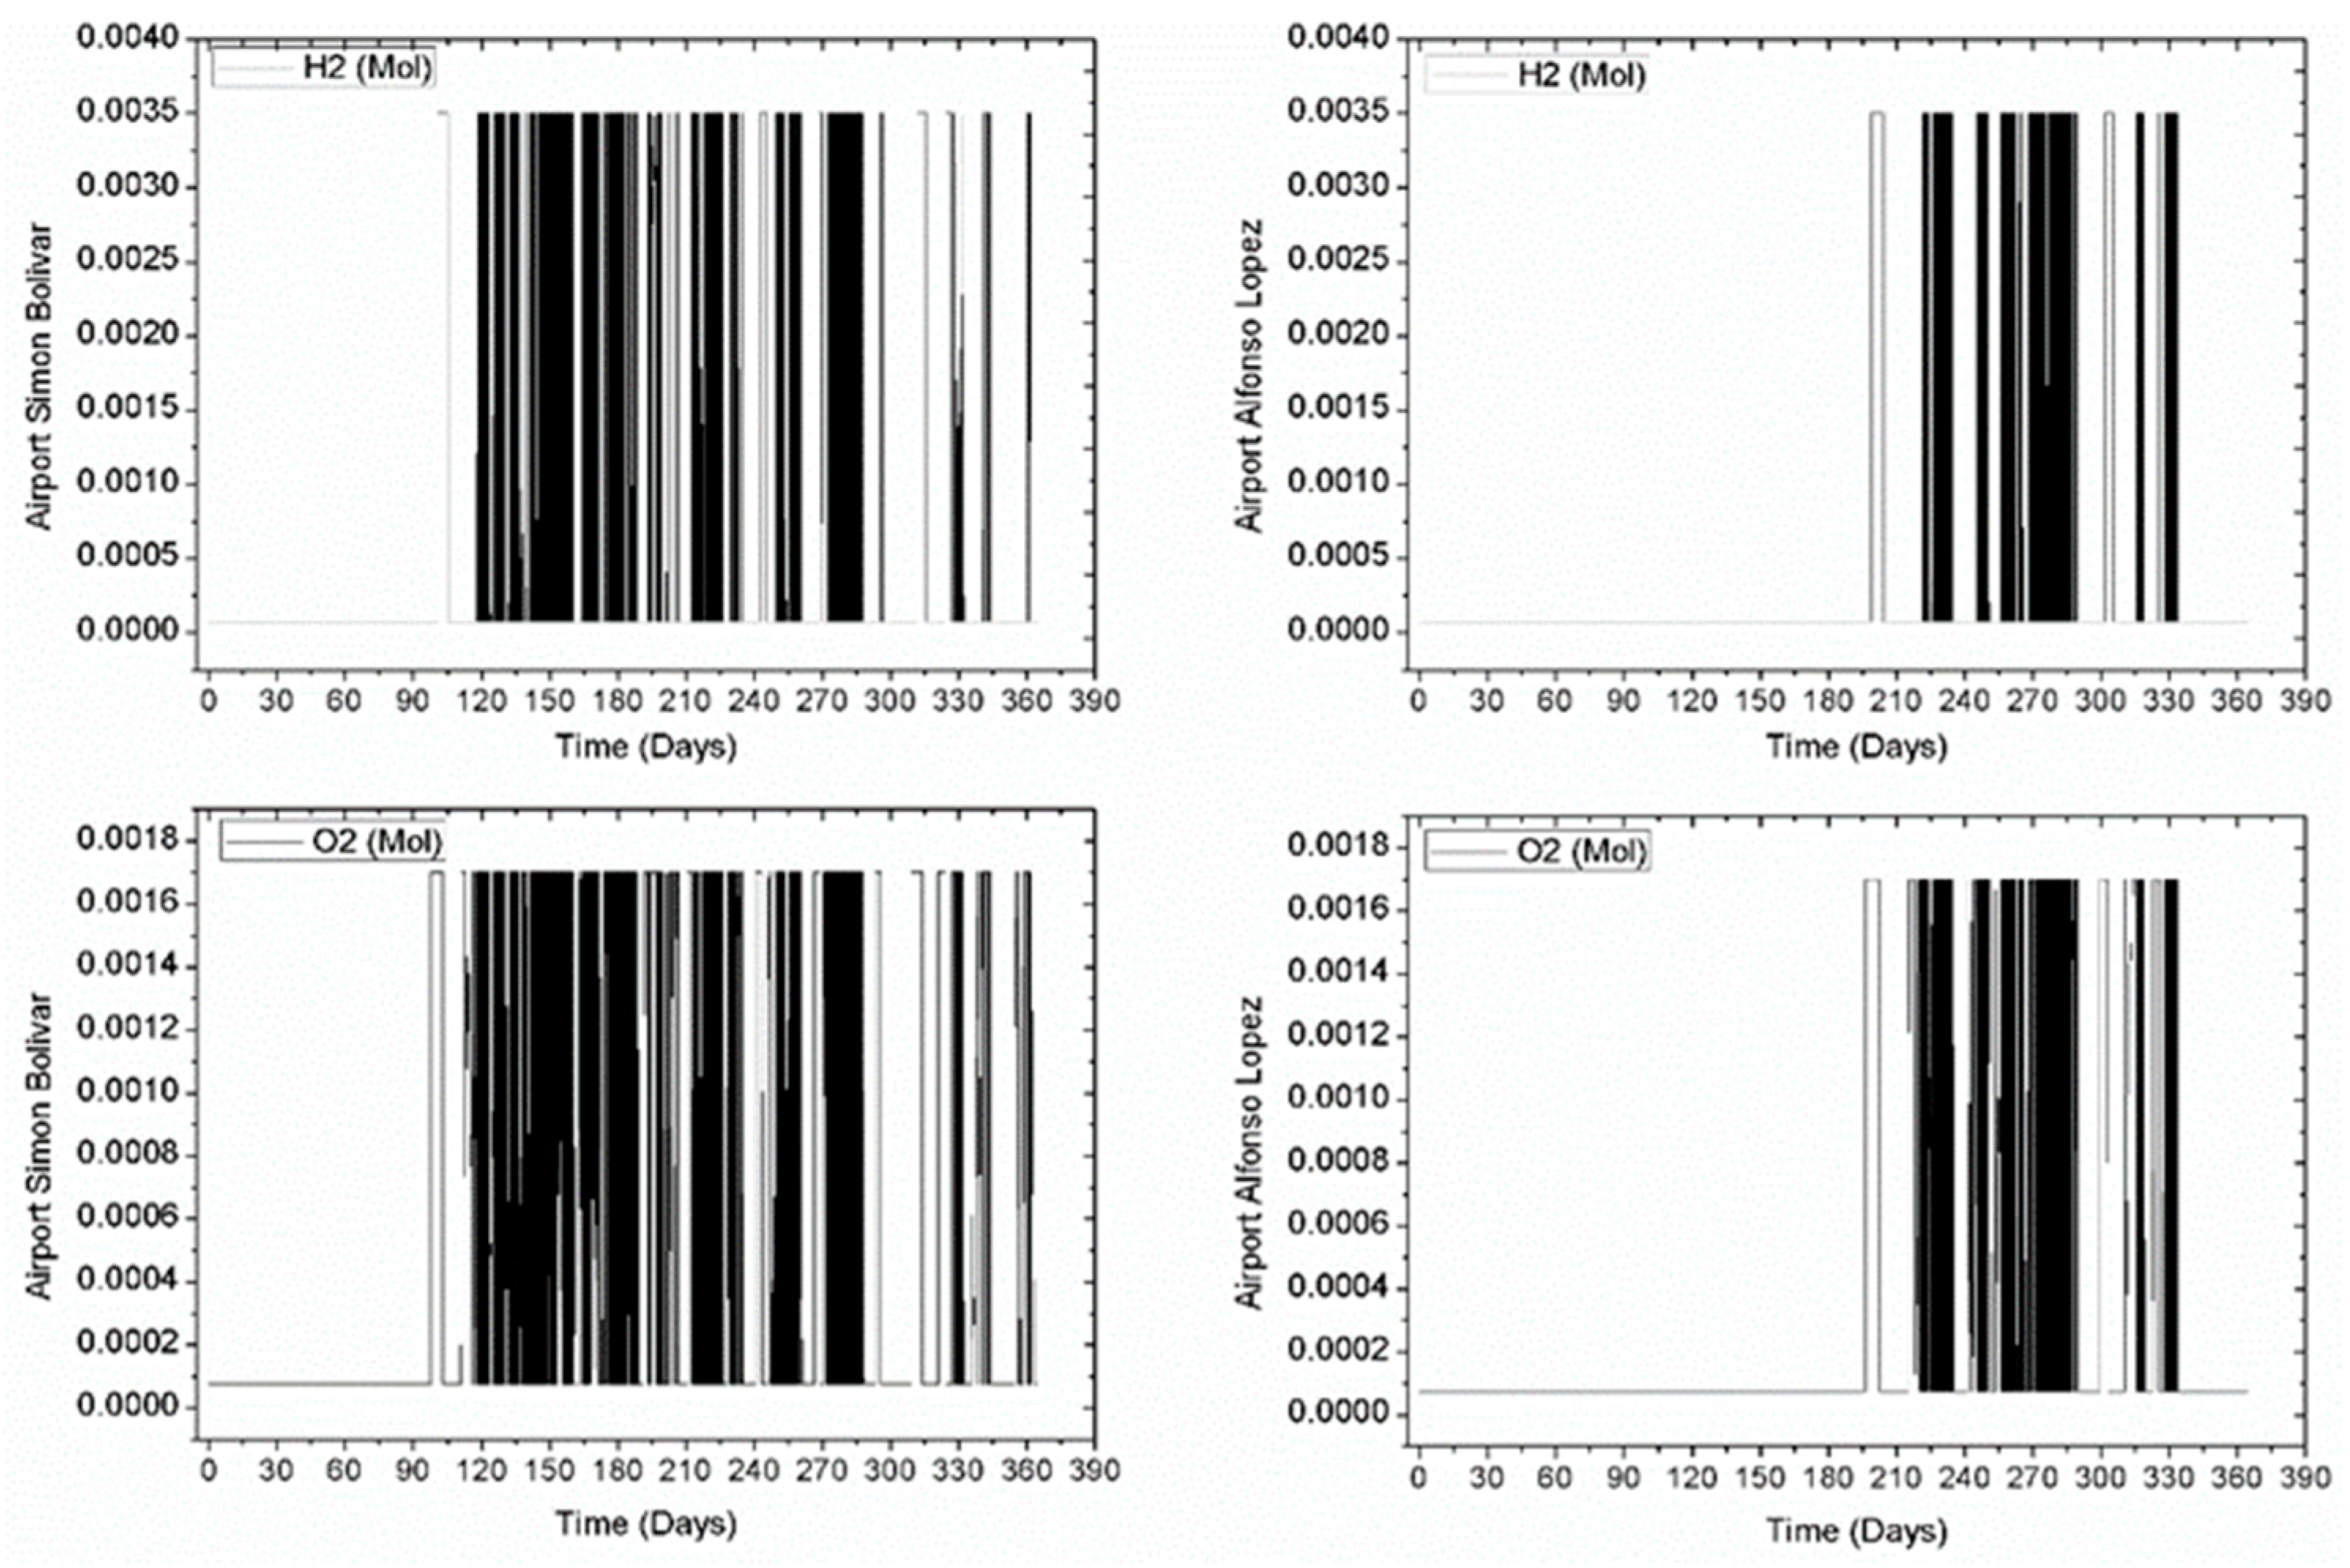
As to the behavior of the system operating at Simon Bolívar airport, during the period from January to March, the cell, produced with a low molar flow regime of both hydrogen and oxygen with a value of 0.0075 mol/s, reached the generation of wind and solar energy 40% of the total energy generated. While in early April to December, the PEM-type cell required the maximum molar flow of hydrogen and oxygen with a value of 0.0035 mol/s and 0.0017 mol/s, respectively, generating a total of 1314.69 Wh (73.03%).
Finally, the operation of the system at Alfonso Lopez airport, led to the cell having a low charge generation between January and early August, with a value of 7.50 × 10⁻⁵ mol/s for the input of hydrogen and oxygen flow, thus giving a combined production between solar and wind power of 58.41%. While for molar flow of oxygen presented the first change on Saturday 3 August with a value of 0.0017 mol/s and hydrogen for Friday 9 August with a value of 0.00119 mol/s as shown in Figure 6, which was associated to the significant change in meteorological conditions, caused by a decrease in wind speed in the place so that the generation of the wind and solar component of the system decreased so that the PEM started to generate energy to supply the demand. In order to provide the energy demand at critical operational points, the cell reached the molar flow values of hydrogen and maximum oxygen at the beginning of August and December, with values of 0.0035 mol/s and 0.0017 mol/s respectively, operational points that represented an energy generation of 1015.78 Wh (66.84%).
The variations in the voltage and electrical current in the cell for the places studied are shown in Figure 7, where it is highlighted that the maximum value of the current was presented for Alfonso Lopez Airport with an amount of 3.97 A at the end of May because, at this time, the speed of viewing was about 85% below its average value. On the other hand, the maximum voltage was not presented in the same place, but at Ernesto Cortissoz airport with a value of 61.8 V for 16 January, values that were the result of a cell power of 12.675 W, which is a low contribution of this component (1.13%) compared to the other days of January, where the cell reached percentage peaks of generation on 1 and 2 January with values of 144.62 W and 123.79 W, respectively.
The PEM fuel cell operates in cases of low electricity generation using wind and solar resources to reach the demand of 200 W. The power generation of the fuel cell was found by obtaining voltage and current from Figure 7 for each of the energy substations studied as shown in Figure 8.
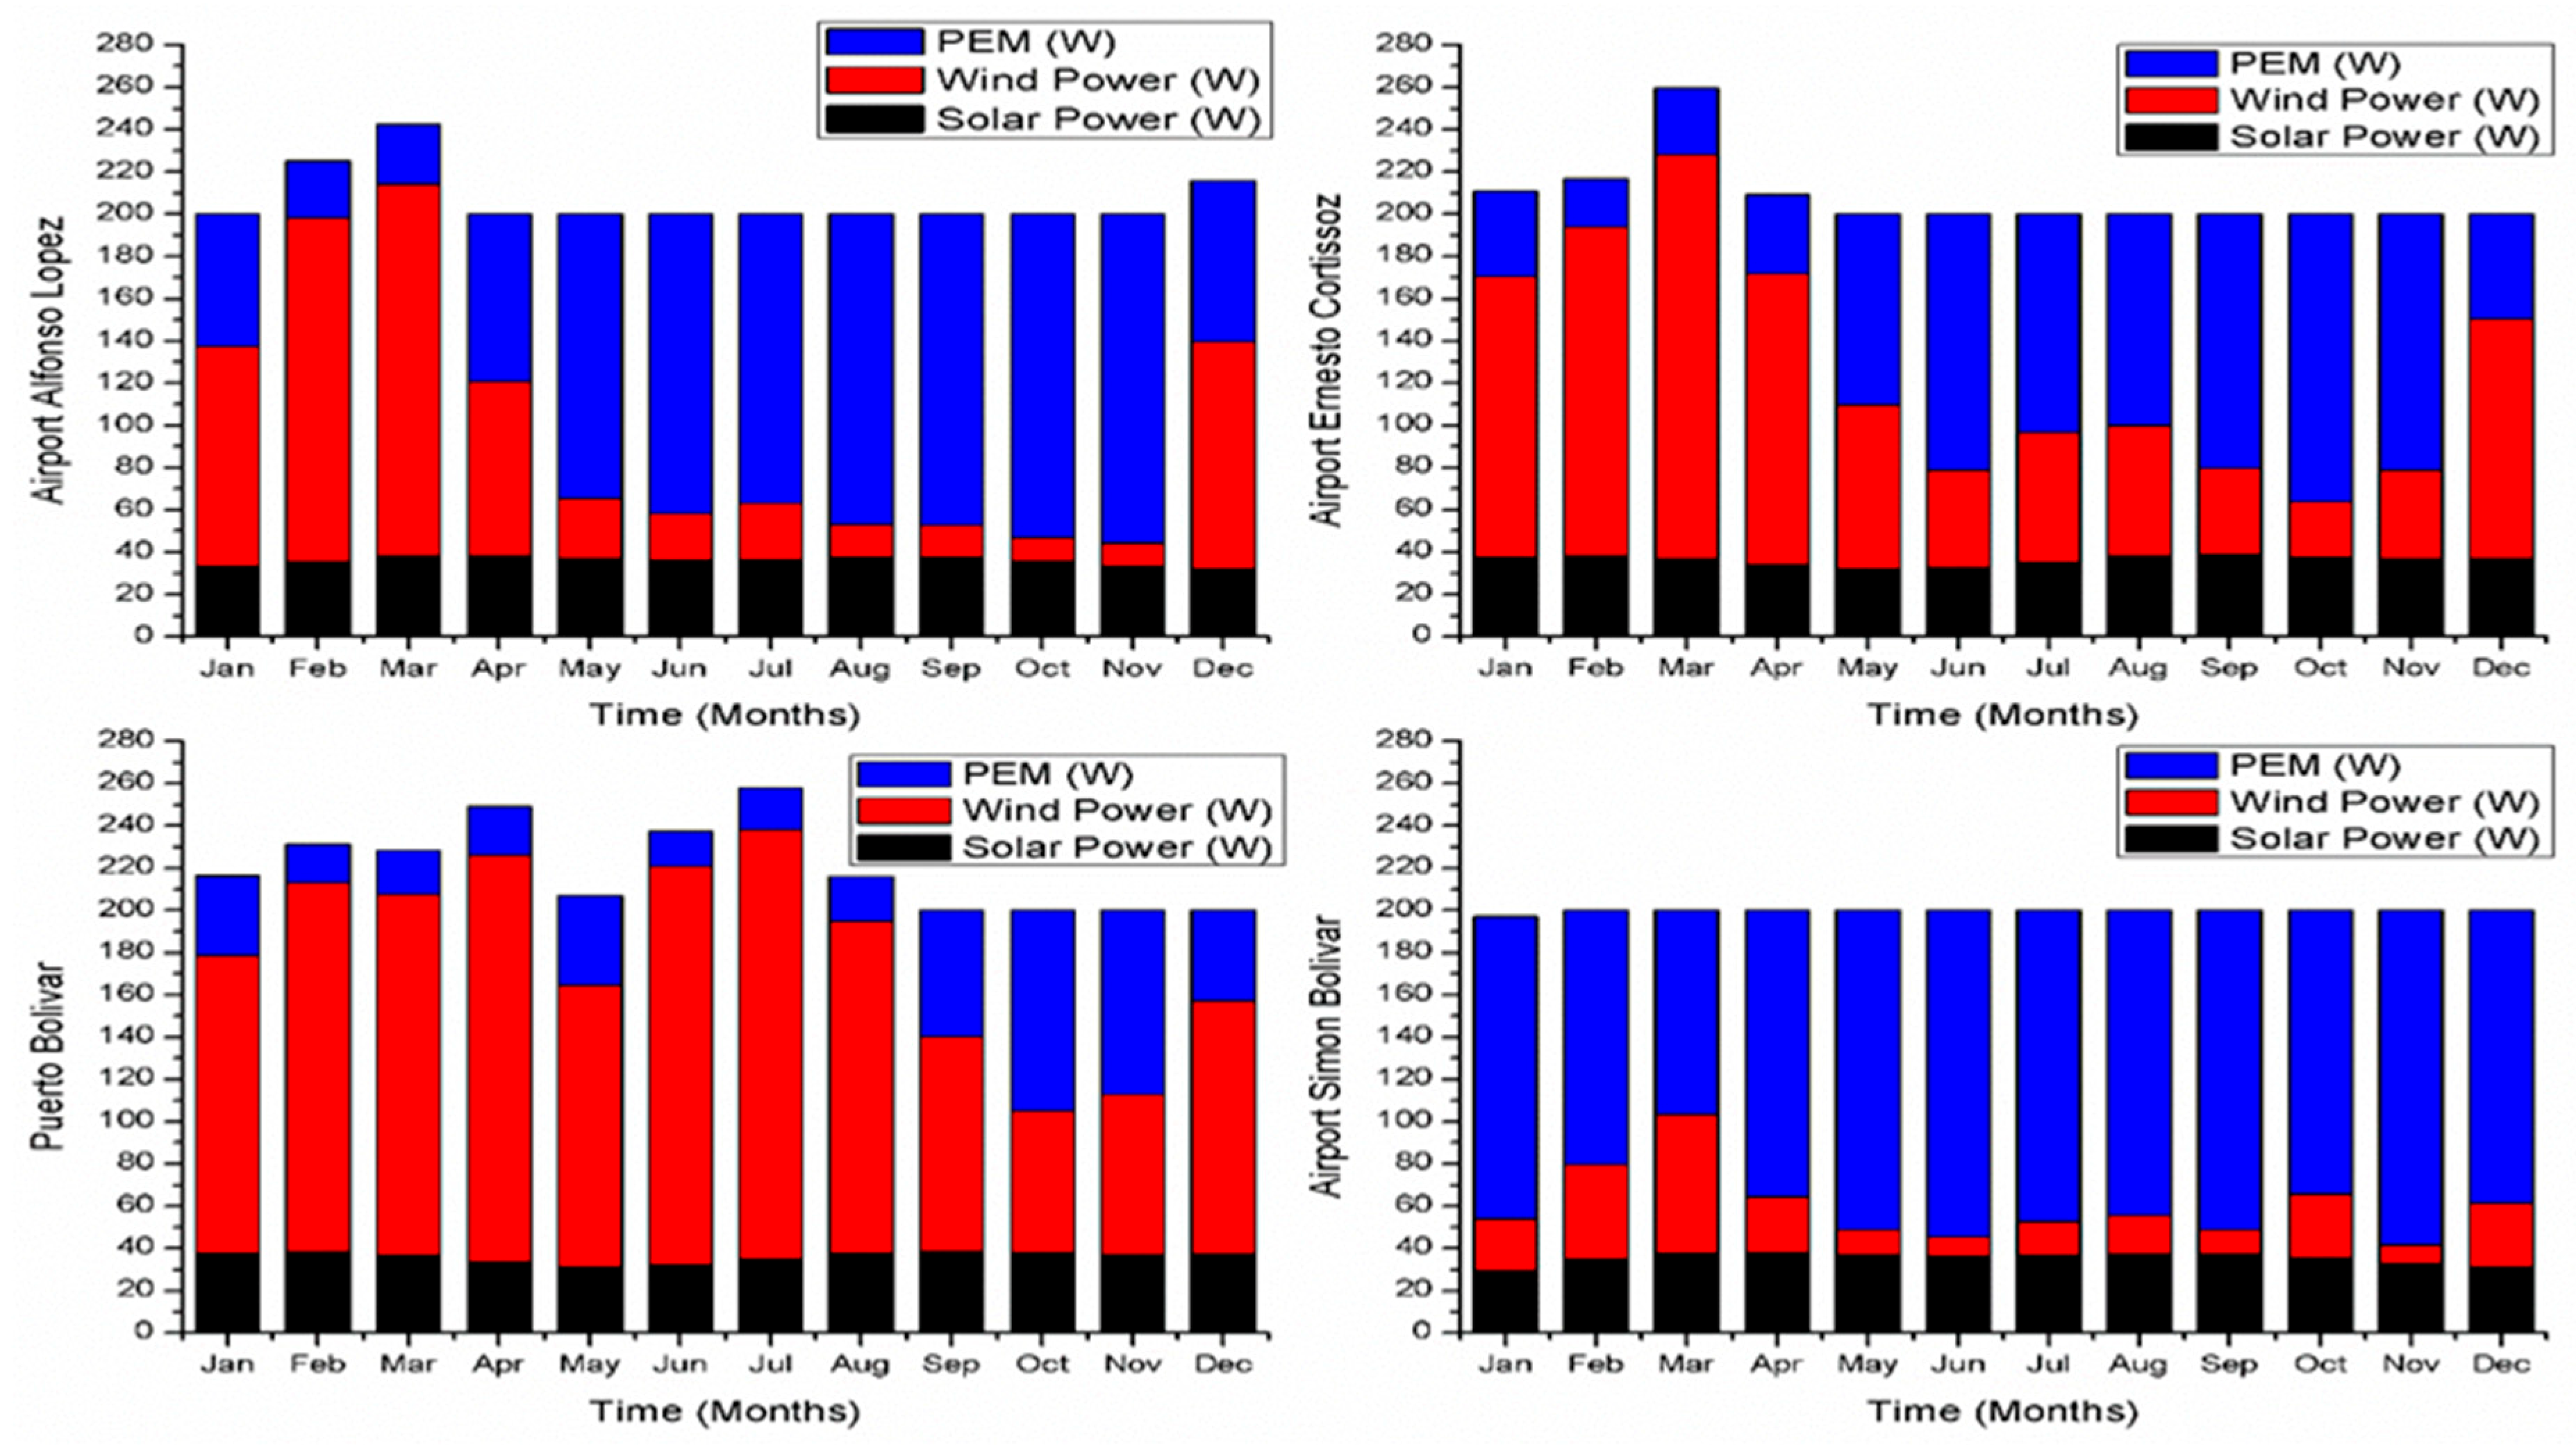
For the demand of 200 W, the respective values for each energy source were obtained, allowing the complementarity of these energy alternatives to be evaluated in each station, where similar behavior is highlighted for the power generated by the photovoltaic solar panel in all the study sites. Additionally, it was determined that the PEM-type cell produced more energy in September for the Simon Bolívar airport with a monthly power of 158.3 W (9.45%), while a lower value was presented in Puerto Bolívar with 18.1 W (3.745%) as shown in Figure 9, in which in the same way it can be observed that, in some months, the established demand was surpassed, due to the fact that the energy resource is fluctuating because of the given meteorological conditions, even the cell cannot stop working, that is why in the places where there are high values of wind and solar energy the demand was surpassed, which implies the storage of this one in a bank of ultracapactiors to minimize sudden variations in voltages and store energy in an electrolyzer to generate hydrogen to the fuel cell.
3.2. Multiobjective Optimization
An optimization problem searches for the optimal value of a target function, which corresponds to a minimum or maximum of the function. However, in many engineering applications, intricate designs have required the lead to a simultaneous optimization of multiple functions which results in a conflict between objectives, which will improve one place to a worsening of the other. For this reason, the technique generates a matrix of decision variables with the possible optimal values of the problem. Equation (21) represents the mathematical expression of multiobjective optimization subject to the restriction of each of the functions and the range of evolution of the decision variables
Subject to and , where denotes the vector of the decision variables to be optimized, is the vector of the objective function, are the inequality constraints, are the equality constraints, and are lower and upper limits of the decision variables, respectively. For this case, the genetic algorithm of non-dominated classification (NSGA-II) [29,30], combined with the programming code of the model was used to optimize the objectives developed in this study.
The systems used for each site introduce the optimization of two objective functions in which the cost per kWh of energy generated and the amount of CO2 emissions per year are minimized, calculated using Equations (22) and (23), respectively.
where LCE is the levelized cost energy, COM is the operating and maintenance cost, and P is related to the pressure. The objective functions are evaluated with respect to the parameters of the designed model, in order to select the decision variables of the genetic algorithm. Likewise, the range of values that can be taken by each optimization criterion is determined, which are considered as design restrictions for each of the cases. Table 1 shows the selected decision variables with the minimum and maximum values it takes during the parametric study and the multiobjective optimization.
In this section, a parametric evaluation is performed on the system to calculate the effect of the variation of the selected decision variables on the target functions for each of the locations under study. Figure 10 shows the variations of the LCE and the amount of CO2 emissions with the increase of the number of stacks and number of panels.
The result shows that, despite the different locations being studied, variations in target functions have the same trend for both cases, both in the increase in the number of panels and number of stacks. The increase in the number of installed panels increased the CO2 emissions in the system, on the other hand, there was a decrease in costs per kWh due to the increase in energy generation capacity (Figure 10a,c).
The increase in the number of stacks generated an increase in LCE but in turn, did not infer the amount of CO2 emissions (Figure 10b,d). The location that presented the highest LCE values was Simon Bolívar; for this reason, the use of the minimum number of stacks installed in the system was considered.
This study shows that the town of Puerto Bolivar is the site with the highest amount of CO2 emissions per year, thus being a determining factor in optimization.
In this case, 25 installation configurations were available for each of the power generation systems located in the airports of Puerto Bolívar, Ernesto Cortissoz, Alfonso Lopez, and Simon Bolívar; with 453 possible iterations inside the generic algorithm. During optimization in each of the locations, a population of 100 values was generated for each of the decision variables in the ranges determined, and these were taken to calculate the objective functions in each of the points. Moreover, thus 35 possible solutions of the objective functions were obtained. Figure 11 shows the Pareto frontiers for the LCE with the CO2 emissions and three possible optimal points, in each of the locations.
Figure 11 shows the areas of optimization composed by the zone of ideal solutions (IS) and the zone of non-ideal solutions (NIS). Also, it shows high values of CO2 emissions at the Puerto Bolivar, so much so that the optimized minimum value was higher than the maximum amount of CO2 emissions by the system located at Simon Bolivar. Also, it was observed that the optimum values in the Ernesto Cortissoz and Alfonso Lopez systems are similar. Therefore, possible ideal solutions will be close to each other. The figure indicates that the system with the highest cost per kWh generated was the one located in Simon Bolivar, but it was also the system with the lowest CO2 emissions.
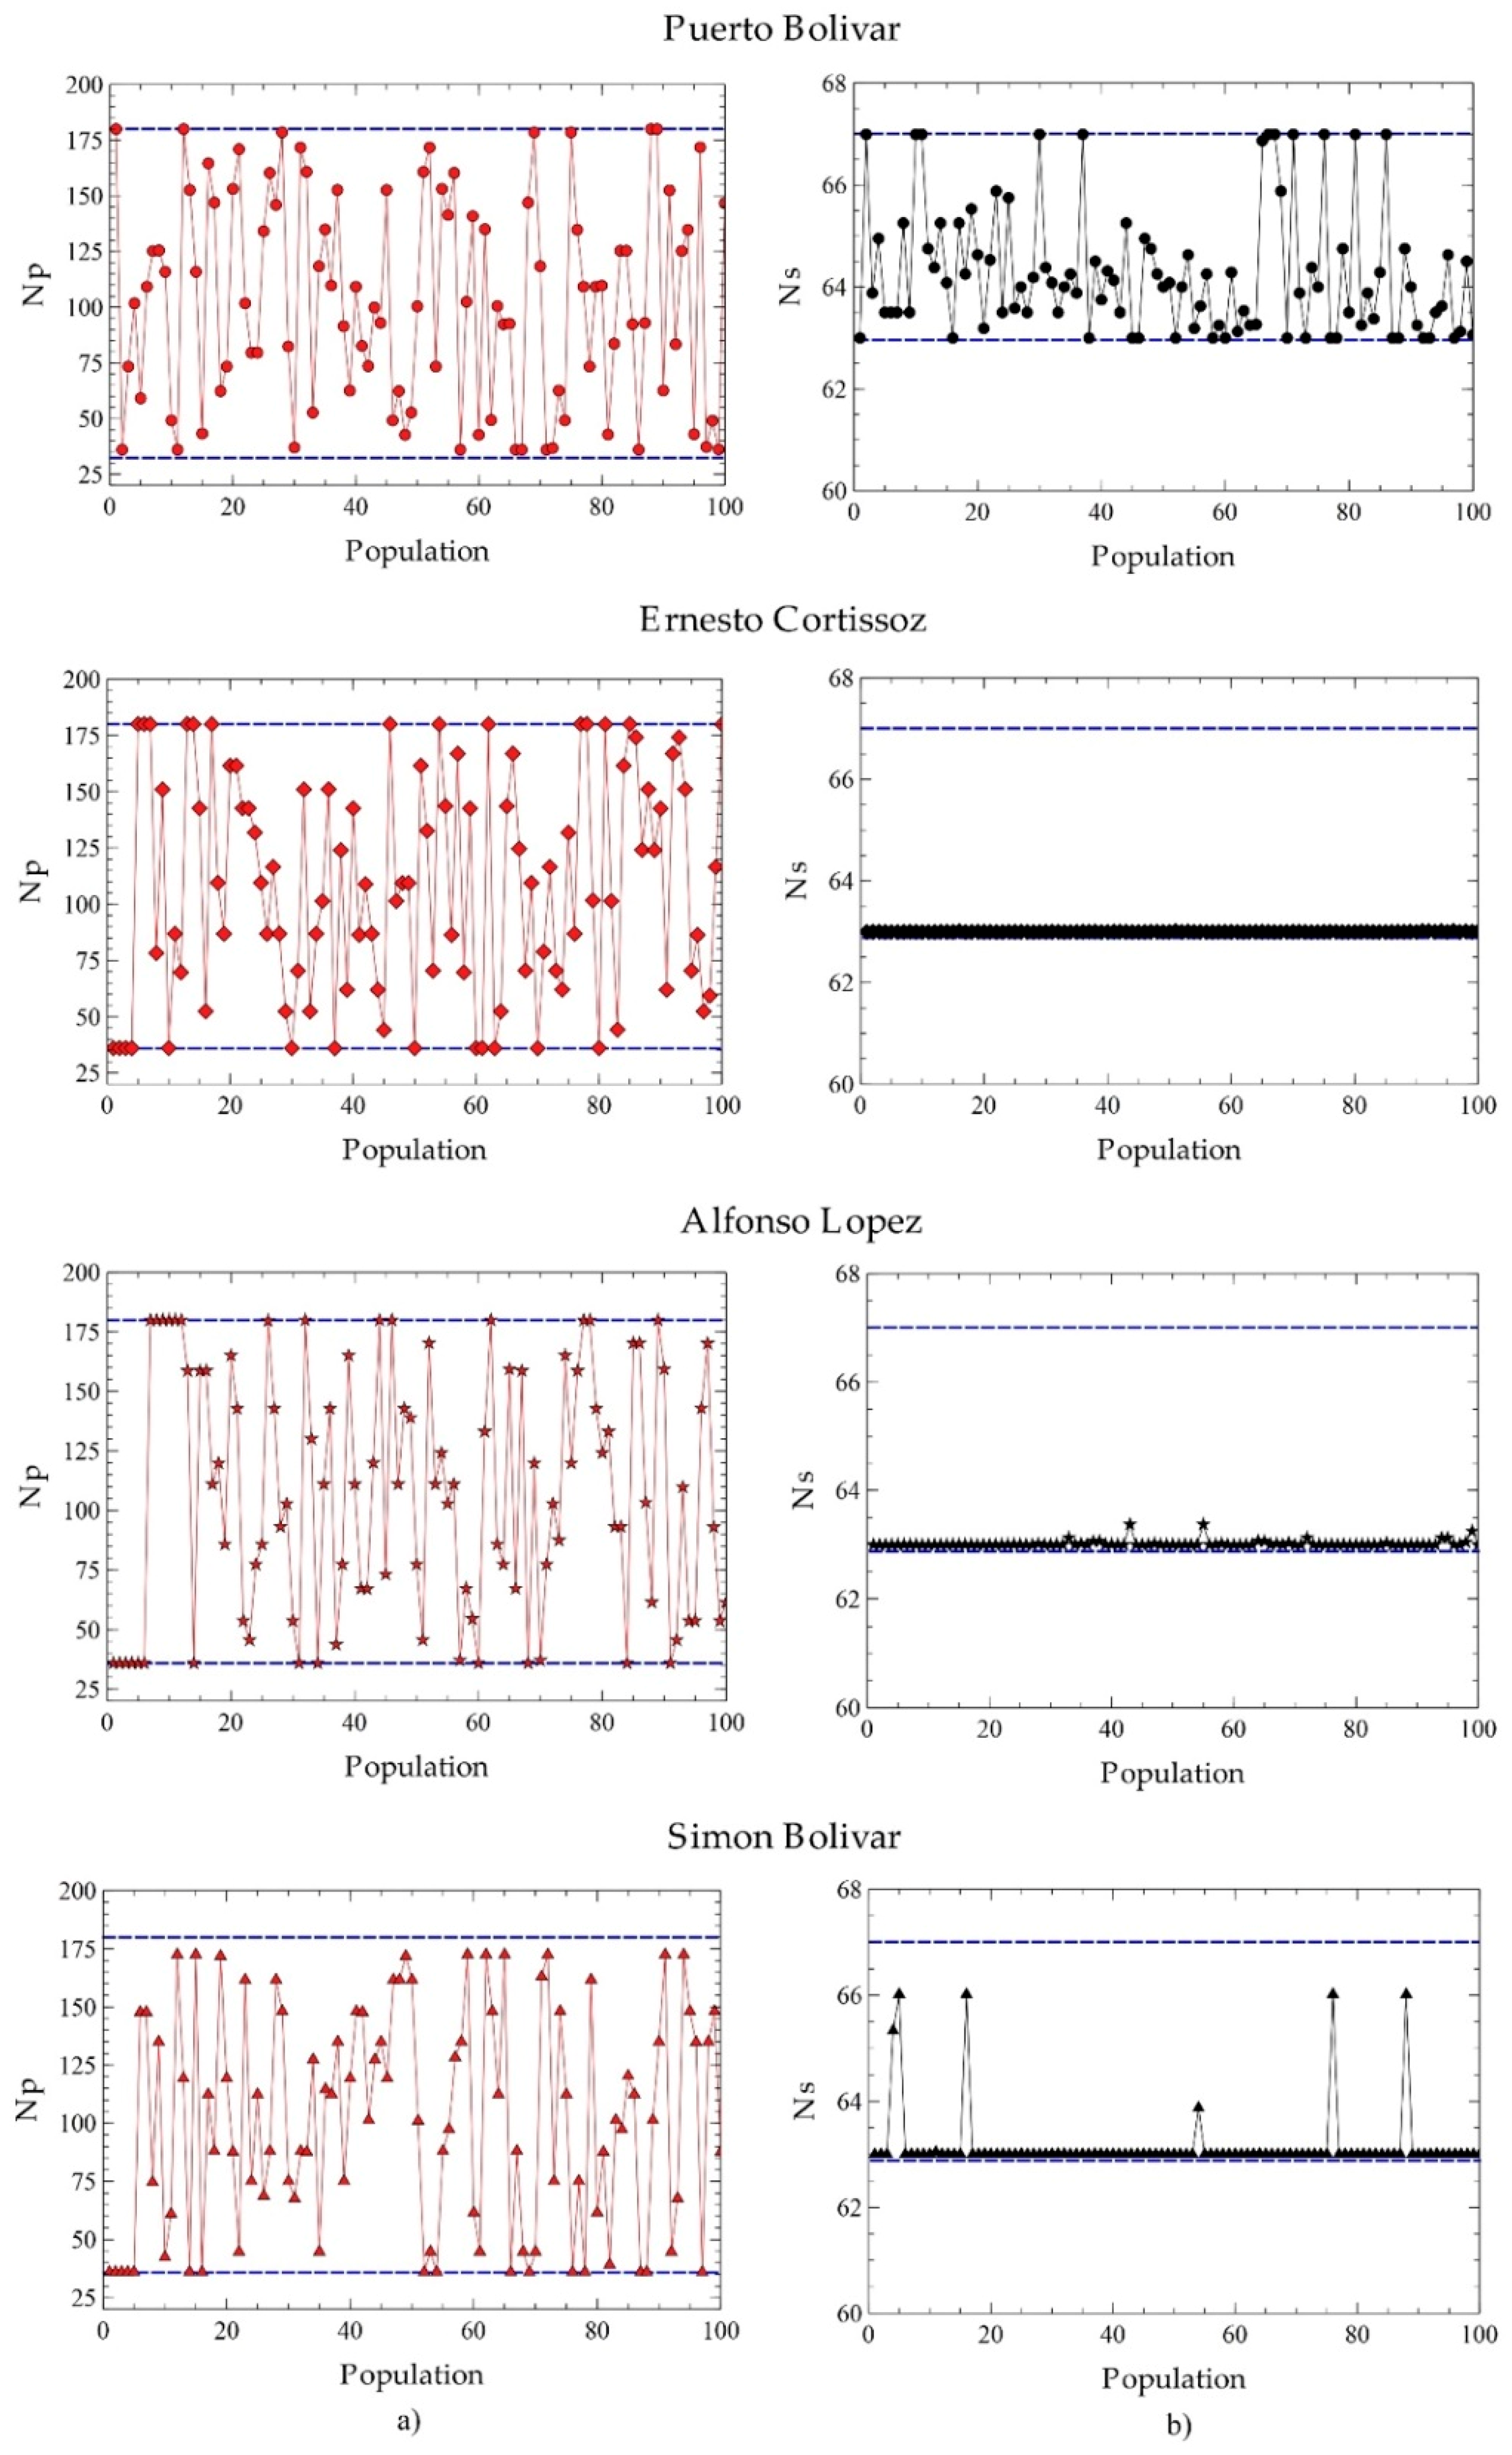
Figure 12 presents the dispersed distributions of the design variables that evidence the evolution of their values during the optimization process for the Puerto Bolívar, Ernesto Cortissoz, Alfonso Lopez, and Simon Bolívar locations, located from top to bottom, respectively. In other words, Figure 12a shows the evolution of the number of panels selected as the first selection criterion during optimization and, in addition to top-down, represents the evolution in each of the locations; Figure 12b represents the same conditions for the second criterion that corresponds to the number of stacks.
For Puerto Bolivar, the number of panels has a dispersed distribution centered; this indicates that its trend is not close to any of the limits of the variable. The second criterion, if it has a tendency close to one of its limits, and that the evolution of the number of stacks tends to the upper limit of the domain during optimization, therefore suggests that this criterion puts at risk the minimization of both functions.
The second row refers to the location of Ernesto Cortissoz, showing an evolution of the number of panels dispersed with a centered distribution. It can be observed that there is no dispersion in the evolution of the number of stacks during optimization, taking the value of the lower limit. This suggests that the latter is the selection criterion that guarantees the solution closest to the ideal.
The evolution of Alfonso Lopez is similar to that described in Ernesto Cortissoz with respect to the number of panels. On the other side, during the distribution of the values of the number of stacks, some have presented small dispersions that try to move away from the lower limit of the domain, they are not significant, however, indicated a variation of the criteria of decision. Likewise, the locality of Simon Bolívar shows a distribution similar to the previous ones with respect to the number of panels; but it shows high dispersions in the evolution of the number of stacks, which suggests some compensations during the optimization.
The results indicate that these design variables are determinant to identify the critical points of the objective functions proposed for the optimization of the systems.
The optimization problem generates multiple possible solutions that correspond to optimal values limited by the design constraints of the system, as shown in Figure 11. For this reason, it is necessary to use a mathematical algorithm that identifies the point with the solution closest to the ideal [31,32]. In this article, it presented the technique of order preference by similarity with the ideal solution (TOPSIS) for the choice of the final solution. Its mathematical principle is based on the identification of the point with the shortest distance from the ideal positive solution and to itself, with the longest distance from the ideal negative solution; conditions that are calculated by Equation (24)
where and are the distances from the points to the ideal positive and negative solution, respectively; is the reference value of alternative i for objective j, and are the ideal and non-ideal values, respectively.
The relative proximity to the ideal solution () is calculated using Equation (25)
where the best solution is the one whose is the closest to 1.
Figure 11 shows the 12 points that meet the optimization requirements, in addition, the intermediate points at each border correspond to the optimal values calculated with TOPSIS. Table 2 shows the values of the model parameters evaluated at each of the optimal points of the Pareto frontiers.
The multicriteria decision technique indicated that points B, E, H, and K are nearest to the ideal solution; therefore, are considered the optimized values for the solution of the case studies.
Table 3 shows the optimal results of the multiobjective optimizations for each location. The Ernesto Cortissoz airport represents a total cost of $USD 189.532 and, in turn, the lowest costs for power generation with a generating capacity of 824.123 kWh of which 10.516 W (11.2%) are not used. This result is explained by the high number of panels installed compared to other locations, because it increases the capacity of the energy generation system. Also, this provides an increase in the amount of emissions as a result of the process of generating solar energy. On the other hand, Puerto Bolivar represents a total cost of $USD 208.657 for the generation of 769.306 kWh of which 7.388 Wh (8.4%) of energy is not used. Alfonso Lopez airport has a system with a generating capacity of 725.039 kWh of which 5.258 Wh (6.35%) is not used, and the total cost of the system is $USD 186.773, while the system operating in Simon Bolivar airport has a cost of $USD 184.014 and a generation capacity of 639.789 kWh entirely usable which means a maximum use of production.
4. Conclusions
In countries where hybrid energy generation systems have been implemented and used, there have been positive results in the energy transition due to the advantages of renewable energy generation systems and the tendency to use less fossil fuels. In Colombia, specifically in the Caribbean region, there is an important renewable resource that, when complemented with electrochemical generation systems such as fuel cell in a hybrid system, presents results of great technical and economic viability. When evaluating the performance of the system in the different places studied, a similar solar power profile was noted due to the proximity of these places in the Colombian Caribbean region, but the wind behavior was different, so the small-scale hybrid system performance is particular to each place and must be well characterized.
An important trend in the Colombian context was identified, because it has been confirmed that the place where these projects have viability, due to the high solar and wind energy resources, coincide with a non-interconnected zone of the country. These results mark a clear tendency to continue evaluating this type of systems with real meteorological data, because these systems can supply all the energy required by the country.
According to the wind energy resource, there is a significant difference between the Puerto Bolivar station and the others, for which the implementation of a PEM is of great help in departments such as Magdalena, however, in the case of the station located in La Guajira (Puerto Bolivar), the use of the PEM has no significant effect on the overall generation of the system where the highest wind power values in the country are presented, implying a low-load operation of the PEM cell type. The results of the wind energy generated show the stock of areas that can be estimated as important wind resources, such as Puerto Bolivar and Ernesto Cortissoz airport, places where the hybrid system would operate with the cell at low load.
The multivariate optimization analysis showed that at the Ernesto Cortissoz airport, although the highest total cost was obtained, the lowest costs were obtained for the generation of energy; however, there are greater quantities of CO2 emissions due to the large number of solar panels used. By reducing the number of elements used in the different places studied, it was not guaranteed a much more environmentally friendly system, as is the case of Puerto Bolivar that used one-third of solar panels in parallel and obtained emissions of kg CO2 per year and energy costs similar to the airport Ernesto Cortissoz. On the other hand, at Simón Bolívar airport, the optimization obtained the lowest emissions at a much higher energy cost because all the energy generated was consumed.
Author Contributions
All the authors of the present research contributed equally to conducting and writing this paper.
Funding
This research received no external funding.
Acknowledgments
Acknowledgments to Universidad del Atlántico, to the mechanical engineering program, and Department of Energy of Universidad de la Costa.
Conflicts of Interest
The authors declare no conflict of interest.
Abbreviations
| The following abbreviations are used in this manuscript: | |
| COM | Operating and maintenance cost |
| Levelized cost energy | |
| PEM | Proton exchange membrane |
| PH | Photogenerated |
| PID | Proportional, integral, and derivative |
| SHGEE | Hybrid electric power generation system |
| Nomenclature | |
| Ar | Flow area |
| C | Capacitance |
| Oxygen concentration at the liquid-gas interface | |
| E | Energy |
| Ego | Band space for silicone |
| F | Faraday Constant |
| h | Height |
| IFC | Electric current of the PEM cell |
| Bank interest rate | |
| K | Boltzmann constant |
| Ki | Temperature coefficient of the short-circuit current |
| M | Molar flow |
| N | Number of components connected in the system |
| P | Pressure |
| q | Electron Charge |
| R | Universal gas constant |
| RE | Resistance |
| Rt | Thermal resistance |
| T | Operating temperature |
| U | Fuel speed |
| Wind speed | |
| Vol | Volume |
| V | Voltage |
| Subscript | |
| 0 | Reference state |
| A | Anode |
| ACT | Activation |
| E | Electrolyze |
| INT | Internal |
| PV | Photovoltaic |
| S | Serial |
| SCR | Short-circuit |
| T | Thermal |
| TOT | Total |
| Greek Symbol | |
| Molar density of gases | |
| emissions for the PV systems | |
| Overvoltage due to activation | |
| Serial electrolyzed number | |
| Faraday Efficiency | |
| Hydrogen molar flux produced | |
| Ohmic voltage | |
| λ | Lighting of photovoltaic modules |
| Roughness coefficient | |
References
- Sinha, A. Inequality of renewable energy generation across OECD countries: A note. Renew. Sustain. Energy Rev. 2017, 79, 9–14. [Google Scholar] [CrossRef]
- Kim, K.; Park, H.; Kim, H. Real options analysis for renewable energy investment decisions in developing countries. Renew. Sustain. Energy Rev. 2017, 75, 918–926. [Google Scholar] [CrossRef]
- Shukla, A.K.; Sudhakar, K.; Baredar, P. Renewable energy resources in South Asian countries: Challenges, policy and recommendations. Resour. Technol. 2017, 3, 342–346. [Google Scholar] [CrossRef]
- Ahmed, S.; Mahmood, A.; Hasan, A.; Sidhu, G.A.S.; Butt, M.F.U. A comparative review of China, India and Pakistan renewable energy sectors and sharing opportunities. Renew. Sustain. Energy Rev. 2016, 57, 216–225. [Google Scholar] [CrossRef]
- Romo-Fernández, L.M.; López-Pujalte, C.; Bote, V.P.G.; Moya-Anegón, F. Analysis of Europe’s scientific production on renewable energies. Renew. Energy 2011, 36, 2529–2537. [Google Scholar] [CrossRef]
- Fernández, L.M.R.; Bote, V.P.G.; Anegón, F.M. Análisis de la producción científica española en energías renovables, sostenibilidad y medio ambiente (Scopus, 2003–2009) en el contexto mundial. Investig. Bibl. Arch. Bibl. Inf. 2013, 27, 125–151. [Google Scholar] [CrossRef]
- Abbasi, S.A.; Abbasi, T. Abbasi. Impact of wind-energy generation on climate: A rising spectre. Renew. Sustain. Energy Rev. 2016, 59, 1591–1598. [Google Scholar] [CrossRef]
- Congreso de Colombia Ley N° 1715 del 13 de mayo de 2014. Available online: www.fedebiocombustibles.com/files/1715.pdf (accessed on 8 September 2018).
- Kannan, N.; Vakeesan, D. Solar energy for future world: A review. Renew. Sustain. Energy Rev. 2016, 62, 1092–1105. [Google Scholar] [CrossRef]
- Islam, M.R.; Mekhilef, S.; Saidur, R. Progress and recent trends of wind energy technology. Renew. Sustain. Energy Rev. 2013, 21, 456–468. [Google Scholar] [CrossRef]
- Procolombia Electric Power in Colombia. Power Generation—2015. Available online: http://www.energynet.co.uk/webfm_send/1839 (accessed on 9 January 2019).
- Budes, F.B.; Escorcia, Y.C.; Ochoa, G.V. Optimization of a Biomass, solar and fuel cell Hybrid energy systems for a specific energy load using Homer Pro software®. Int. J. ChemTech Res. 2018, 11, 335–340. [Google Scholar]
- Sikka, M.; Thornton, T.F.; Worl, R. Sustainable Biomass Energy and Indigenous Cultural Models of Well-being in an Alaska Forest Ecosystem. Ecol. Soc. 2013, 18, 531–543. [Google Scholar] [CrossRef]
- Vides-Prado, A.; Camargo, E.O.; Vides-Prado, C.; Orozco, I.H.; Chenlo, F.; Candelo, J.E.; Sarmiento, A.B. Techno-economic feasibility analysis of photovoltaic systems in remote areas for indigenous communities in the Colombian Guajira. Renew. Sustain. Energy Rev. 2018, 82, 4245–4255. [Google Scholar] [CrossRef]
- Mikati, M.; Santos, M.; Armenta, C. Modelado y Simulación de un Sistema Conjunto de Energía Solar y Eólica para Analizar su Dependencia de la Red Eléctrica. Rev. Iberoam. Autom. Inform. Ind. RIAI 2012, 9, 267–281. [Google Scholar] [CrossRef]
- Bordons, C.; García-Torres, F.; Valverde, L. Gestión Óptima de la Energía en Microrredes con Generación Renovable. Rev. Iberoam. Autom. Inform. Ind. RIAI 2015, 12, 117–132. [Google Scholar] [CrossRef]
- López, A.; Somolinos, J.A.; Núñez, L.R. Modelado Energético de Convertidores Primarios para el Aprovechamiento de las Energías Renovables Marinas. Rev. Iberoam. Autom. Inform. Ind. RIAI 2014, 11, 224–235. [Google Scholar] [CrossRef]
- Esmaeili, S.; Shafiee, M. Simulation of Dynamic Response of Small Wind-Photovoltaic-Fuel Cell Hybrid Energy System. Smart Grid Renew. Energy 2012, 3, 194–203. [Google Scholar] [CrossRef] [Green Version]
- Ochoa, G.V.; Blanco, C.; Martinez, C.; Ramos, E. Fuzzy Adaptive Control Applied to a Hybrid Electric-Power Generation System (HEPGS). Indian J. Sci. Technol 2017, 10, 1–9. [Google Scholar] [CrossRef] [Green Version]
- De Dias, C.L.; Branco, D.A.C.; Arouca, M.C.; Legey, L.F.L. Performance estimation of photovoltaic technologies in Brazil. Renew. Energy 2017, 114, 367–375. [Google Scholar] [CrossRef]
- Abbes, D.; Martinez, A.; Champenois, G. Life cycle cost, embodied energy and loss of power supply probability for the optimal design of hybrid power systems. Math. Comput. Simul. 2014, 98, 46–62. [Google Scholar] [CrossRef]
- Parida, B.; Iniyan, S.; Goic, R. A review of solar photovoltaic technologies. Renew. Sustain. Energy Rev. 2011, 15, 1625–1636. [Google Scholar] [CrossRef]
- Cancino-Solórzano, Y.; Xiberta-Bernat, J. Statistical analysis of wind power in the region of Veracruz (Mexico). Renew. Energy 2009, 34, 1628–1634. [Google Scholar] [CrossRef]
- Observatorio del Caribe Colombiano. Región Caribe Colombiana 2015. Available online: http://www.ocaribe.org/region-caribe (accessed on 7 January 2019).
- Pandiarajan, N.; Ramaprabha, R.; Muthu, R. Application of circuit model for photovoltaic energy conversion system. Int. J. Photoenergy 2012, 2012, 410401. [Google Scholar] [CrossRef]
- Şen, S.; Demirer, G.N. Anaerobic tratment of real textile wastewater with a fluidized bed reactor. Water Res. 2003, 37, 1868–1878. [Google Scholar] [CrossRef]
- Padilla, R.V.; Demirkaya, G.; Goswami, D.Y.; Stefanakos, E.; Rahman, M.M. Heat transfer analysis of parabolic trough solar receiver. Appl. Energy 2011, 88, 5097–5110. [Google Scholar] [CrossRef]
- Ochoa, G.V.; Chamorro, M.V.; Jiménez, J.P. Análisis Estadístico de la Velocidad y Dirección del Viento en la Región Caribe Colombiana con Énfasis en la Guajira; Universidad del Atlántico: Barranquilla, Colombia, 2016. [Google Scholar]
- Bilil, H.; Aniba, G.; Maaroufi, M. Multiobjective Optimization of Renewable Energy Penetration Rate in Power Systems. Energy Procedia 2014, 50, 368–375. [Google Scholar] [CrossRef] [Green Version]
- Kamjoo, A.; Maheri, A.; Dizqah, A.M.; Putrus, G.A. Multi-objective design under uncertainties of hybrid renewable energy system using NSGA-II and chance constrained programming. Int. J. Electr. Power Energy Syst. 2016, 74, 187–194. [Google Scholar] [CrossRef]
- Ighravwe, D. A CRITIC-TOPSIS framework for hybrid renewable energy systems evaluation under techno-economic requirements. J. Proj. Manag. 2019, 4, 109–126. [Google Scholar]
- Chen, S.J.; Hwang, C.L. Fuzzy Multiple Attribute Decision Making Methods. In Fuzzy Multiple Attribute Decision Making; Springer: Berlin/Heidelberg, Germany, 1992; Volume 375, pp. 289–486. [Google Scholar]
Figure 1.
The geographical location of the places studied in the Caribbean region (Colombia).

Figure 2.
Schematic diagram for a hybrid power generation system.

Figure 3.
Photovoltaic power response for Ernesto Cortissoz, Puerto Bolívar, Simon Bolívar, and Alfonso Lopez.
Figure 3.
Photovoltaic power response for Ernesto Cortissoz, Puerto Bolívar, Simon Bolívar, and Alfonso Lopez.

Figure 4.
The behavior of wind power through an entire year at 100 meters high.

Figure 5.
Hydrogen and molecular oxygen at the entrance of Ernesto Cortissoz airport and Puerto Bolívar.
Figure 5.
Hydrogen and molecular oxygen at the entrance of Ernesto Cortissoz airport and Puerto Bolívar.

Figure 6.
Hydrogen and molecular oxygen at the entrance of Simon Bolívar and Alfonso Lopez airport.

Figure 7.
Fuel cell electrical voltage and current at Ernesto Cortissoz, Puerto Bolívar, Simon Bolívar, and Alfonso Lopez.
Figure 7.
Fuel cell electrical voltage and current at Ernesto Cortissoz, Puerto Bolívar, Simon Bolívar, and Alfonso Lopez.
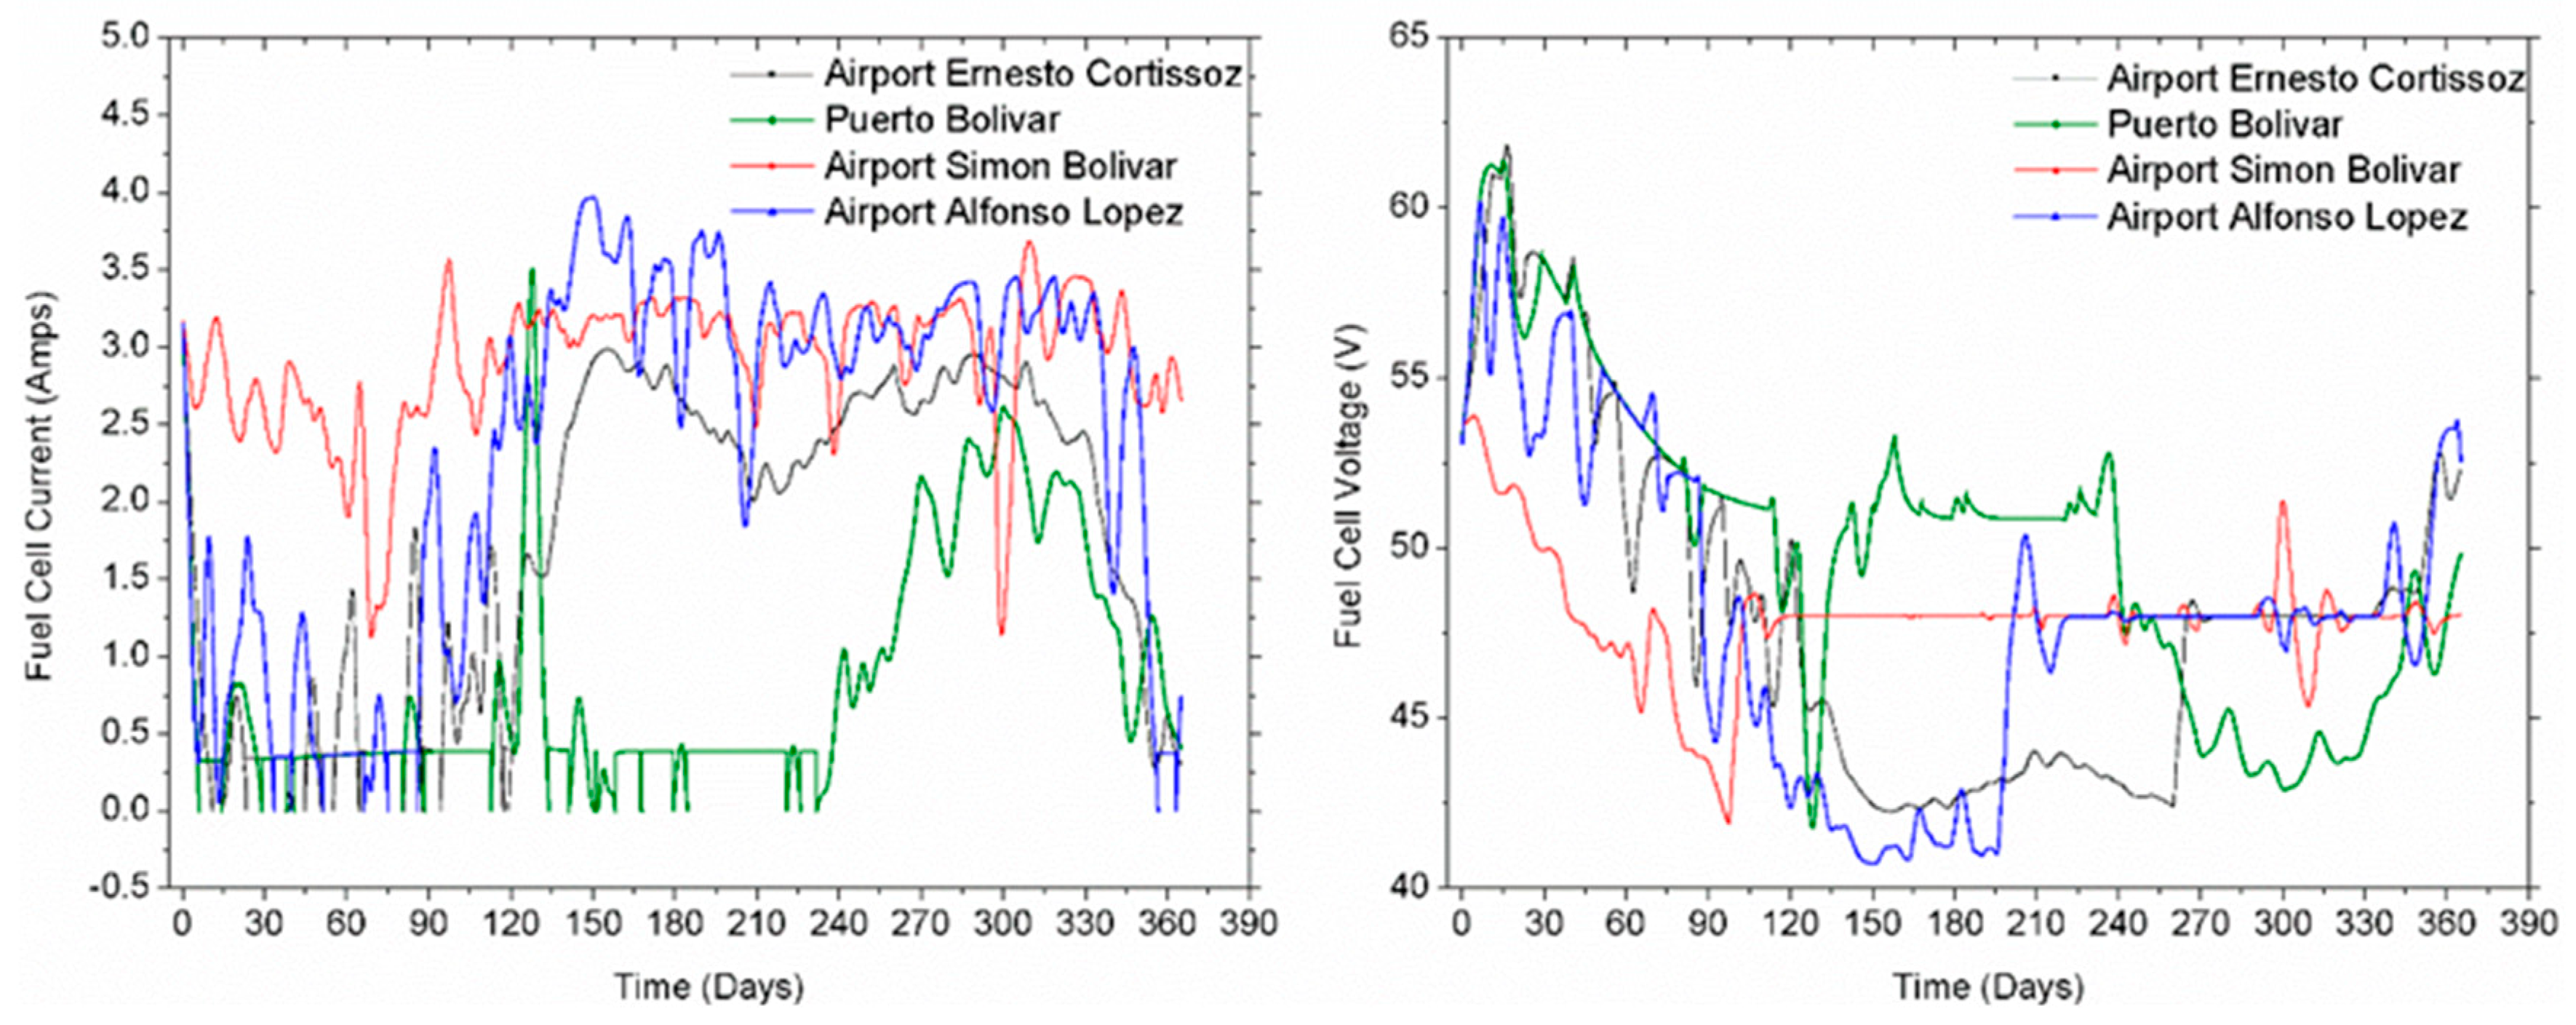
Figure 8.
Fuel cell electrical voltage and current at Ernesto Cortissoz, Puerto Bolívar, Simon Bolívar, and Alfonso Lopez.
Figure 8.
Fuel cell electrical voltage and current at Ernesto Cortissoz, Puerto Bolívar, Simon Bolívar, and Alfonso Lopez.

Figure 9.
Accumulated power from different energy sources for different substations.

Figure 10.
Variations of the levelized cost energy (LCE) and CO2 emissions with the decision criteria on locations; (a,b) Puerto Bolivar and Ernesto Cortissoz, (c,d) Alfonso Lopez and Simon Bolivar.
Figure 10.
Variations of the levelized cost energy (LCE) and CO2 emissions with the decision criteria on locations; (a,b) Puerto Bolivar and Ernesto Cortissoz, (c,d) Alfonso Lopez and Simon Bolivar.
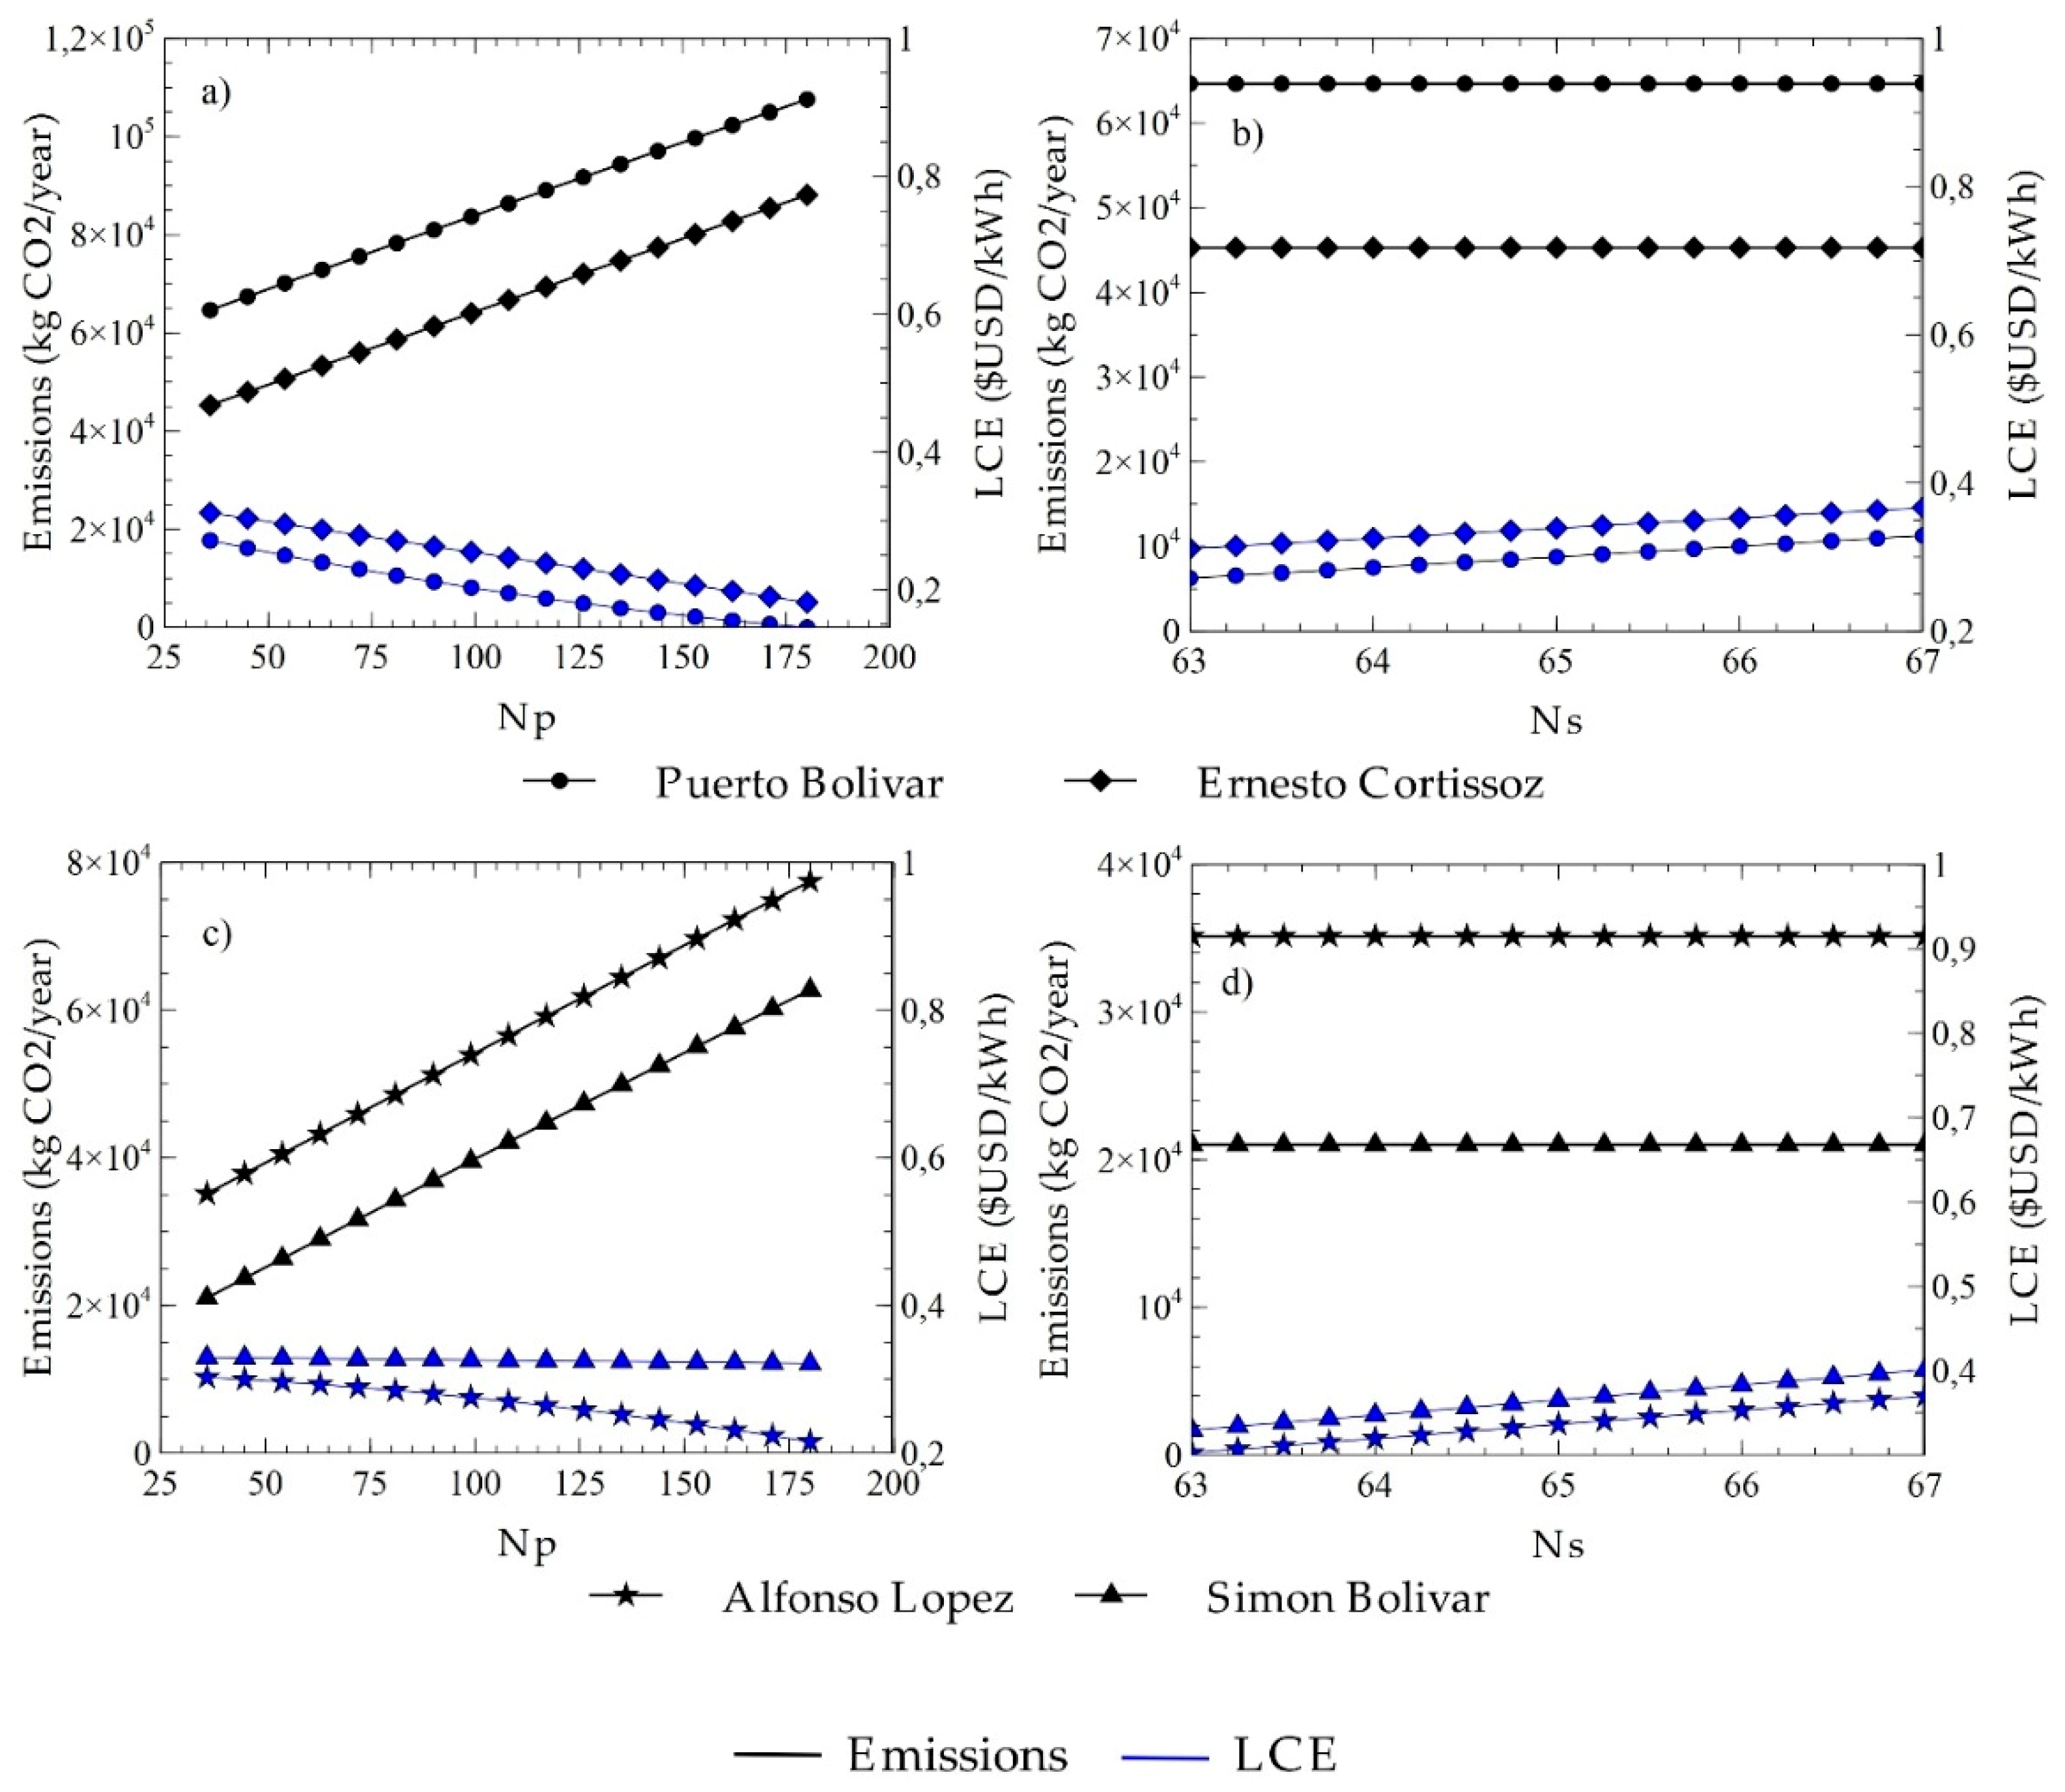
Figure 11.
Pareto frontiers of LCE with CO2 emissions for each location.
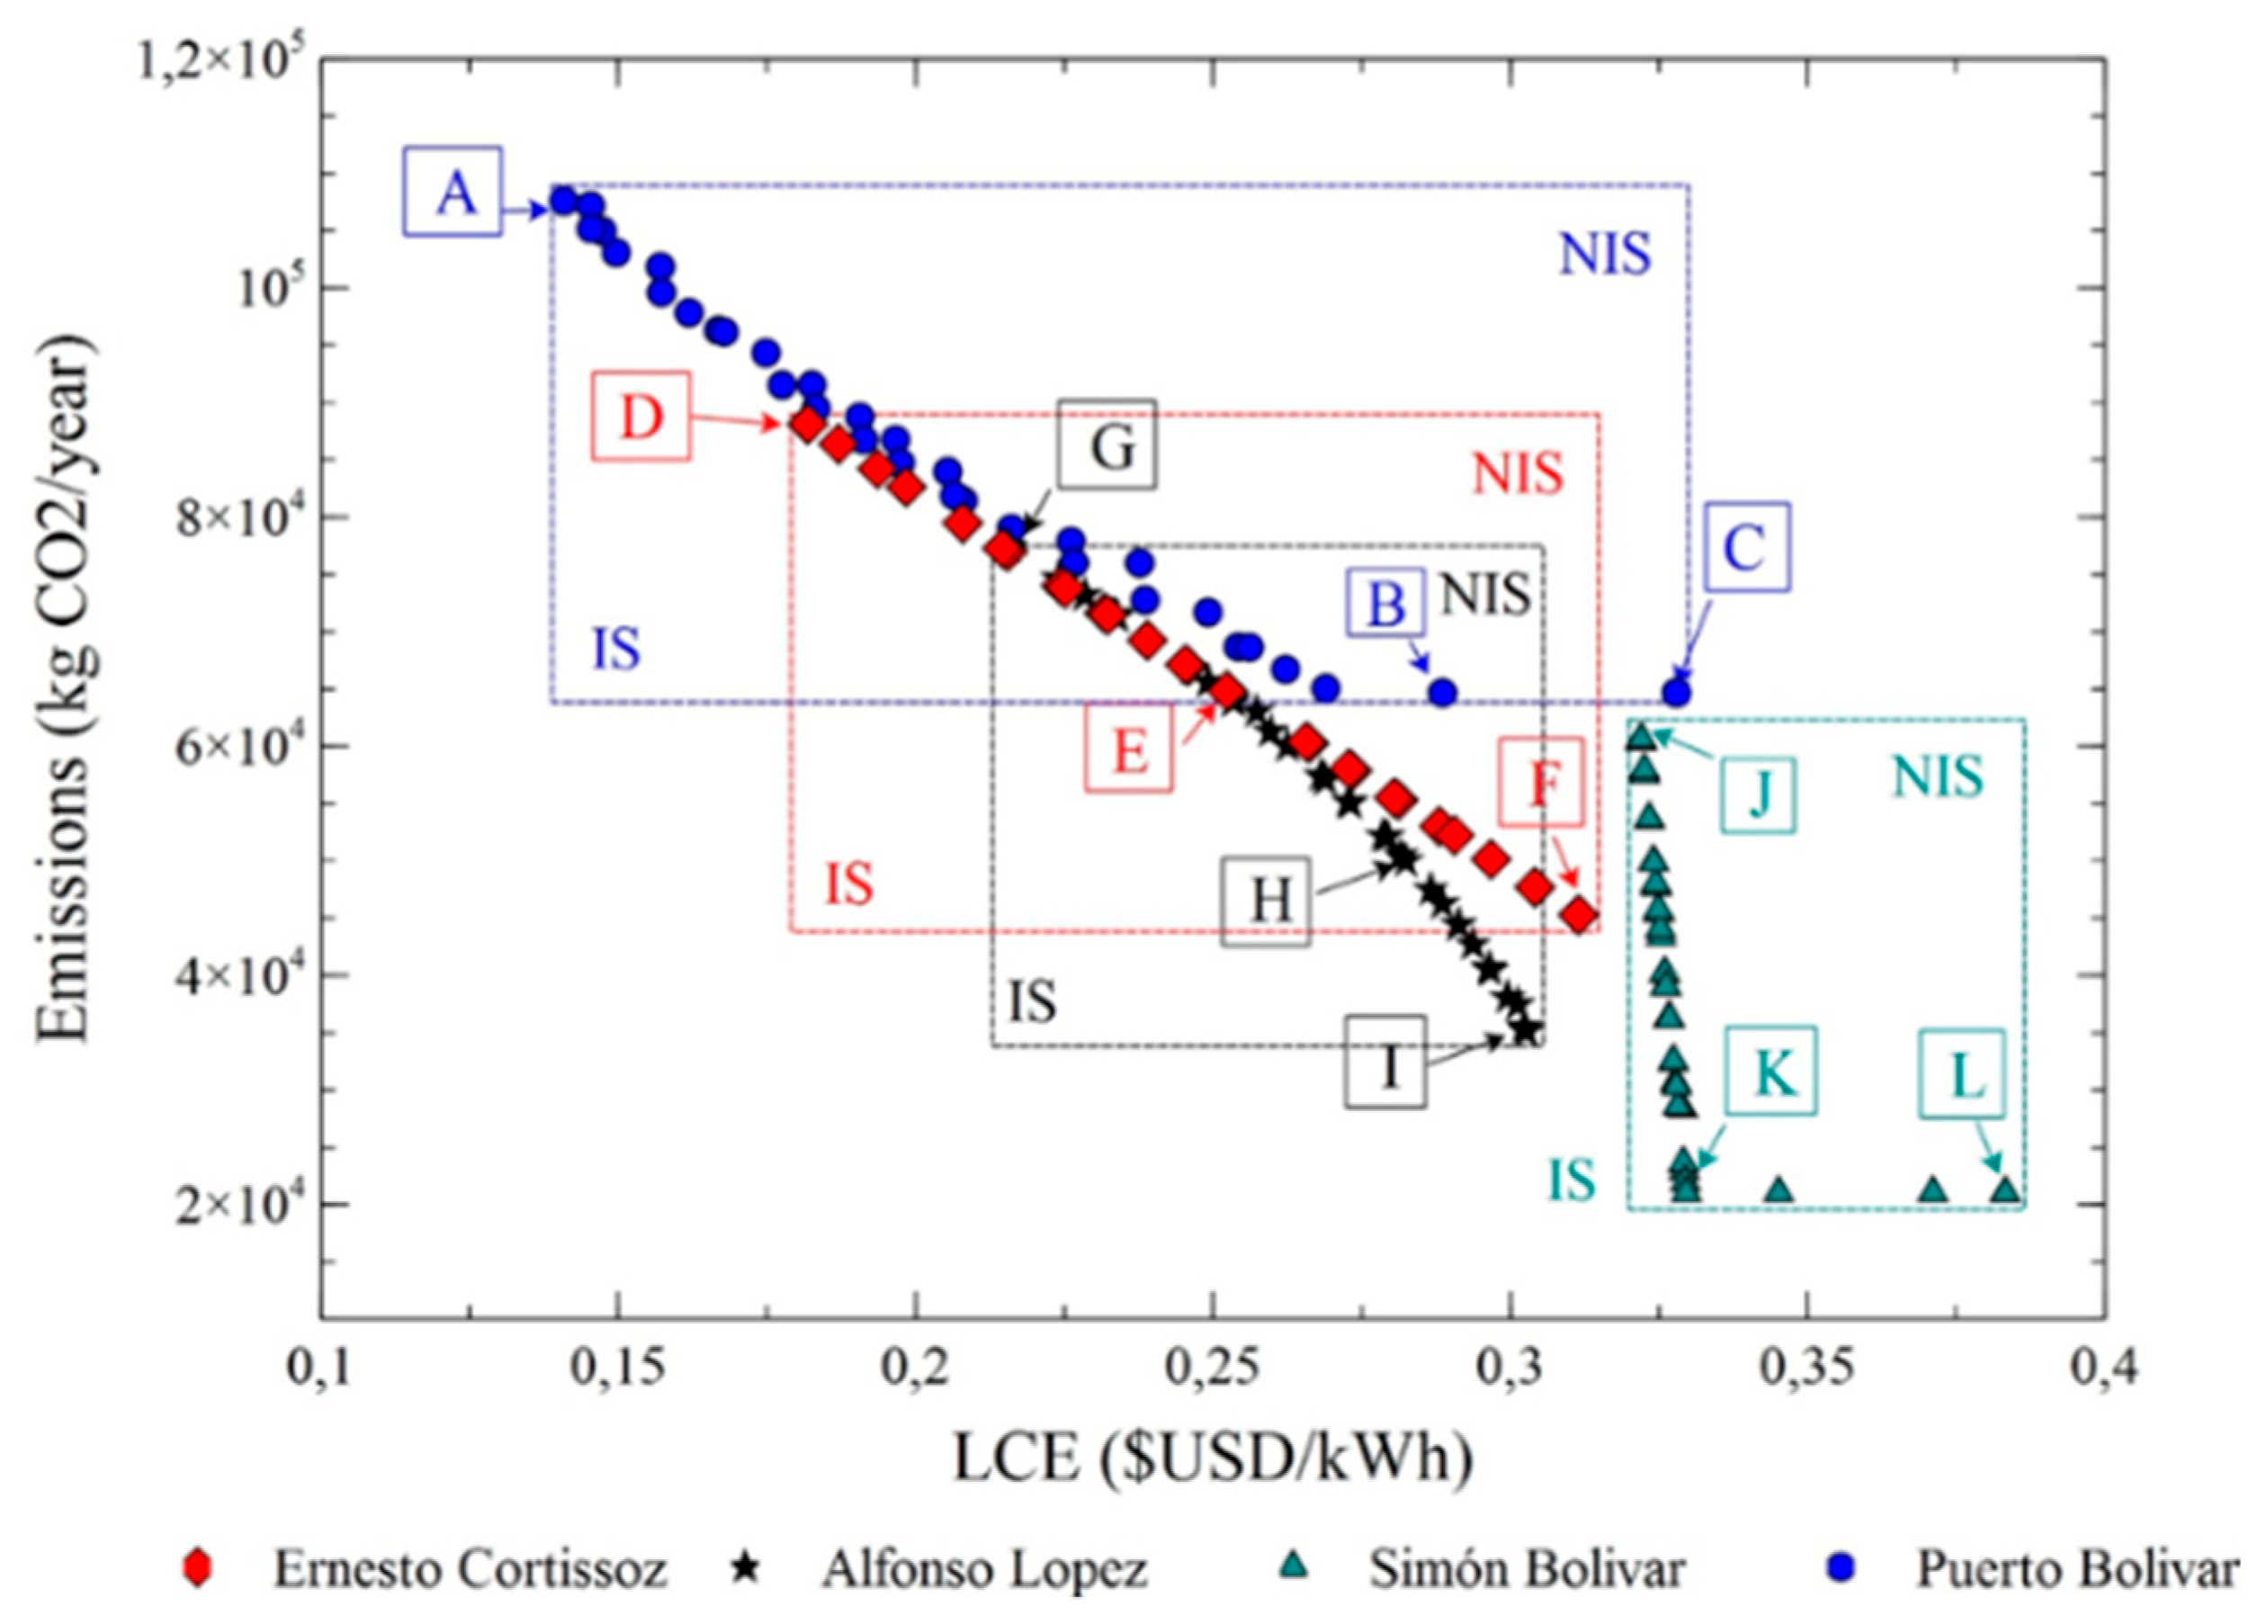
Figure 12.
Dispersed distribution of decision criteria for LCE and CO2 emissions with the population at the Pareto frontier for each of the locations; (a) Number of panels (Np) and (b) Number of stacks (Ns).
Figure 12.
Dispersed distribution of decision criteria for LCE and CO2 emissions with the population at the Pareto frontier for each of the locations; (a) Number of panels (Np) and (b) Number of stacks (Ns).


Table 1.
Decision variables on multiobjective optimization.
| Decision Variables | Symbol | Maximum Value | Minimum Value | Criteria |
|---|---|---|---|---|
| Number of panels | 36 | 180 | C1 | |
| Number of stacks | 63 | 67 | C2 |
Table 2.
Optimized values of parameters and objective functions.
| Parameters of Design | ||||||||||||
|---|---|---|---|---|---|---|---|---|---|---|---|---|
| LCE | Emissions | |||||||||||
| Units | - | - | mol | Mol | kW | kW | kW | kW | kWh | $USD | $USD/kWh | |
| Ref | 36 | 65 | 0.0273 | 0.0273 | 13.184 | 52.446 | 14.757 | 7.388 | 769.306 | 208.657 | 0.2988 | 64,671.64 |
| A | 180 | 63 | 0.0273 | 0.0273 | 64.324 | 52.446 | 7.275 | 51.045 | 1534.544 | 195.051 | 0.1408 | 107,584.42 |
| B | 36 | 64 | 0.0273 | 0.0273 | 13.184 | 52.446 | 14.757 | 7.388 | 769.306 | 208.657 | 0.2885 | 64,661.49 |
| C | 36 | 67 | 0.0273 | 0.0273 | 13.184 | 52.446 | 14.757 | 7.388 | 769.306 | 208.657 | 0.3279 | 64,661.47 |
| Ref | 36 | 65 | 0.0734 | 0.0459 | 13.246 | 32.964 | 29.730 | 2.941 | 691.348 | 208.657 | 0.3325 | 45,179.31 |
| D | 180 | 63 | 0.0273 | 0.0273 | 64.623 | 32.964 | 7.138 | 31.726 | 1195.909 | 195.051 | 0.1817 | 88,119.16 |
| E | 102 | 63 | 0.0273 | 0.0273 | 37.130 | 32.964 | 13.421 | 10.516 | 824.123 | 189.532 | 0.2525 | 64,738.88 |
| F | 36 | 63 | 0.1501 | 0.0922 | 13.246 | 32.964 | 29.730 | 2.941 | 691.348 | 184.014 | 0.3114 | 45,279.78 |
| Ref | 36 | 65 | 0.1322 | 0.079 | 13.138 | 23.016 | 39.340 | 2.495 | 683.536 | 208.657 | 0.2988 | 64,671.64 |
| G | 180 | 63 | 0.0273 | 0.0273 | 64.101 | 23.016 | 6.461 | 20.579 | 1000.519 | 195.051 | 0.2154 | 77,455.43 |
| H | 77 | 63 | 0.1091 | 0.1156 | 27.028 | 23.016 | 27.413 | 5.258 | 725.039 | 186.773 | 0.2866 | 47,475.15 |
| I | 36 | 63 | 0.1322 | 0.079 | 13.138 | 23.016 | 39.340 | 2.495 | 683.536 | 184.014 | 0.3026 | 35,141.09 |
| Ref | 36 | 65 | 0.2102 | 0.1219 | 13.027 | 9.018 | 50.954 | 0 | 639.789 | 208.657 | 0.3593 | 21,022.60 |
| J | 172 | 63 | 0.0273 | 0.0273 | 60.749 | 9.018 | 7.280 | 4.049 | 710.762 | 242.767 | 0.3220 | 60,629.99 |
| K | 39 | 63 | 0.2238 | 0.5678 | 14.102 | 9.018 | 49.878 | 0 | 639.789 | 184.014 | 0.3294 | 21,959.29 |
| L | 36 | 66 | 0.1809 | 0.6725 | 13.027 | 9.018 | 50.954 | 0 | 639.789 | 221.424 | 0.3832 | 21,026.78 |
Table 3.
Multiobjective optimal solution.
| Cases Studies | Objective Functions Values | Criteria Values | ||
|---|---|---|---|---|
| LCE ($USD/kWh) | Emissions (kg CO2/year) | C1 | C2 | |
| Puerto Bolívar | 0.2885 | 64,661.49 | 36 | 64 |
| Ernesto Cortissoz | 0.2525 | 64,738.88 | 102 | 63 |
| Alfonso Lopez | 0.2866 | 47,475.15 | 77 | 63 |
| Simon Bolívar | 0.3294 | 21,959.29 | 39 | 63 |
© 2019 by the authors. Licensee MDPI, Basel, Switzerland. This article is an open access article distributed under the terms and conditions of the Creative Commons Attribution (CC BY) license (http://creativecommons.org/licenses/by/4.0/).
Share and Cite
MDPI and ACS Style
Valencia, G.; Benavides, A.; Cárdenas, Y. Economic and Environmental Multiobjective Optimization of a Wind–Solar–Fuel Cell Hybrid Energy System in the Colombian Caribbean Region. Energies 2019, 12, 2119. https://doi.org/10.3390/en12112119
AMA Style
Valencia G, Benavides A, Cárdenas Y. Economic and Environmental Multiobjective Optimization of a Wind–Solar–Fuel Cell Hybrid Energy System in the Colombian Caribbean Region. Energies. 2019; 12(11):2119. https://doi.org/10.3390/en12112119
Chicago/Turabian StyleValencia, Guillermo, Aldair Benavides, and Yulineth Cárdenas. 2019. "Economic and Environmental Multiobjective Optimization of a Wind–Solar–Fuel Cell Hybrid Energy System in the Colombian Caribbean Region" Energies 12, no. 11: 2119. https://doi.org/10.3390/en12112119
Note that from the first issue of 2016, this journal uses article numbers instead of page numbers. See further details here.