An Experimental and Numerical Study on Supported Ultra-Lean Methane Combustion


1
Department of Aeronautics and Astronautics, National Cheng Kung University, Tainan 701, Taiwan
2
Research Center for Energy Technology and Strategy, National Cheng Kung University, Tainan 701, Taiwan
*
Author to whom correspondence should be addressed.
Energies 2019, 12(11), 2168; https://doi.org/10.3390/en12112168
Submission received: 25 March 2019
/
Revised: 13 May 2019
/
Accepted: 28 May 2019
/
Published: 6 June 2019
(This article belongs to the Special Issue Cleaner Combustion)
Abstract
:With a much larger global warming potential (GWP) and much shorter lifespan, the reduction of methane emissions offers an additional opportunity and a relatively quick way of mitigating climate change in the near future. However, the emissions from coal mining in the form of ventilation air methane (VAM), usually in ultra-lean concentration, pose the most significant technical challenge to the mitigation of methane emission. Therefore, a better understanding of ultra-lean methane combustion is essential. With three 5 mm × 50 mm rectangle cross-section slot jets, a novel sandwich-type triple-jet burner is proposed to provide stable combustion of an ultra-lean methane–air mixture with equivalence ratios from 0.3 to 0.88, and 0.22 in extreme conditions. The ultra-lean methane flame in the center of the triple-jet burner is supported by the two lean outer flames at an equivalence ratio φ = 0.88. The flow field and combustion chemical reactions are predicted by detailed numerical simulation with GRI-Mech 3.0 reaction mechanisms. Two-dimensional numerical results are validated with those obtained by experimental particle image velocimetry (PIV), as well as visual flame height and temperature measurements. An ultra-lean methane–air mixture has to burn with external support. In addition, the ultra-lean flame is non-propagating with a relatively low temperature. The ultra-lean center flame is seen to start from the outer flame and incline perfectly to the post-flame temperature and OH concentration profiles of the outer lean flame. The adjacent stronger flame provides heat and active radicals, such as OH and HO2, from the post-flame region and in the wall proximity of the gap between the adjacent flame and the central ultra-lean jet to initiate and maintain the combustion of the central ultra-lean flame. The outstanding wall-proximity radical of HO2 is found to be the main contributor to the initiation and stabilization of the central ultra-lean flame by providing a low-temperature oxidation of fuel through the following reaction: HO2 + CH3 ⇔ OH + CH3O. The major chemical reaction paths contributing to fuel decomposition and oxidation of the supported ultra-lean center flame are also identified and delineated.
1. Introduction
Anthropogenic emissions of greenhouse gases (GHGs) directly altered the earth’s climate and led to global warming. In addition to CO2 as the main contributor to GHGs, the less-known non-CO2 GHGs contributed about one-third of the total CO2-equivalent emissions as of 2010 [1]. Among these non-CO2 GHGs, methane contributes nearly two-thirds of present total emissions. Methane, with its abundance on earth in different forms and its low carbon ratio, is regarded as a major energy source following the fossil oil age. However, methane has a much larger global warming potential (GWP) and a much shorter lifetime (around nine years) than CO2. Reducing methane emissions offers an additional opportunity and a relatively quick way of mitigating climate change in the near future [1]. Concentrated point sources of methane emissions from natural sources and fossil fuel exploitation are relatively important and manageable [2,3,4]. Most of these “fugitive methane” [4] emissions from various fossil fuel exploitations and waste treatments are released or escape without treatment, with only a smaller part being flared off. In particular, the emissions from coal mining in the form of ventilation air methane (VAM), accounting for about 6% of the total anthropogenic methane emissions, pose the most significant technical challenge to the mitigation of methane as a non-CO2 GHG. For safety reasons, VAM usually comes in very low concentrations, usually as an ultra-lean methane–air mixture, which is defined as a mixture with a methane concentration lower than the lean flammability limit. Combustion mitigation relies heavily on high-temperature preheating, recuperative/regenerative thermal oxidation, and catalytic reactions. Practical VAM utilization in a prototype recuperative catalytic gas turbine was reported by Su and Yu [5]. Recently, combustion mitigation of methane as a non-CO2 GHG was reviewed by Jiang et al. [4] with the emphasis on modeling and simulation of ultra-lean methane ignition/combustion. They pointed out that the challenges are faced in the ignition and sustainability of ultra-lean methane combustion and the lack of reliable chemical kinetic schemes for the development and design of advanced mitigation systems. Due to its inherent flame instability, ultra-lean methane combustion received little research attention in the past. Methods to enhance combustion stability were reported in the literature [6,7,8,9,10]. However, these methods deal only with lean combustion and induced instability. The application of burner arrays [11,12,13,14,15,16,17,18] and counterflow flames [19,20,21,22,23,24,25,26] for flame stability enhancement were also reported. Unfortunately, the practical ultra-lean combustion systems are complicated because of the low reaction rates, mild heat release, and low flame temperature, leading to difficulties in ignition, flame sustainability, and flame extinction. Thus, a better understanding of ultra-lean methane reaction chemical kinetics and its combustion mechanism through innovative design of the burner facility to provide stable reaction/combustion for studies is essential for this era of climate change and energy crisis.
Recently, Lin et al. [27] showed that effects of lateral impingement created by two identical adjacent slot-jet flames can lower the stable lean equivalence ratio to 0.5 or lower. The stabilization mechanism was related to the lateral impingement of post-flame streams when two adjacent slot flames were brought closer in distance. Cheng et al. [28] reported the flame structure for opposed jet flames of lean premixed propane–air versus hot products generated by lean hydrogen flames to simulate a direct injection spark ignition (DISI) engine. The lean propane–air was burnt by the support of high-temperature hot products of the lean hydrogen flame. Cheng et al. [29] further reported lean and ultra-lean stretched methane–air counterflow flames. Stretched laminar flame structures for a wide range of methane–air mixtures versus hot products of lean hydrogen flames were investigated using laser Raman diagnostics and numerical simulation. This work mostly concentrated on the comparison and evaluation of numerical codes of GRI-3.0, and C1 and C2 chemical kinetic mechanisms. The counterflow set-up reported in References [29,30], although good for detailed flame analysis, is much less practical for real applications. In this study, the concept of lateral flame impingement of two adjacent slot-jet flames [27] is extended to a novel sandwich-type triple-jet burner for experimental and numerical studies of the central ultra-lean flame supported through heat and radical flux provided by two adjacent lean jet flames from the hot post-flame region. Basically, the ultra-lean flame is non-self-propagating and non-self-sustainable without external support. However, the stabilization and combustion mechanism, detailed flame structure, and characteristic chemical reaction pathway associated with these supported very lean and ultra-lean flames were not comprehensively studied and, thus, represent the main purpose of this study.
2. Experimental Set-Up
2.1. Triple-Slot-Jet Burner
As shown in Figure 1a, a sandwich triple-slot-jet burner issued two identical outer jet flames and one variable center flame which were premixed and metered by two separate methane air supplies. Three equal spacing slots were used to form the sandwich triple-jet burner with a rectangular tube which had an inner cross-section of 5 mm (d, width) × 50 mm (depth). Two layers of ceramic honeycomb and one layer of steel wool were used to remove large-scale turbulent motion in the gas flow before entering the slot-jet burner. The temperature profile was measured by a coated R-type thermocouple with the junction of a 25-µm-diameter mounting on a two-dimensional (2D) moving frame driven by computer and an NI6024 PCI box in 0.02-mm increments in both x- and y-axes. This thermocouple had a deviation of 4.3% or 77.5 K at 1800 K. Two outer flames were operated identically with an equivalence ratio of 0.88. The equivalence ratio φ of the center flame varied from φ = 0.7 to 0.3. A fixed average exit velocity of 1 m/s was used for outer and center jets in all experimental cases. If the mass flow rate of the outer jets was lower, the outer flames would not produce enough heat and radicals to support the center flame and it would extinguish. In addition, according to the calculated Reynolds number (around 300), the flow field was laminar in the study. It was found that, when the centerline to centerline distance of two adjacent slot jets, L, was smaller than 2d (d = 5 mm), the triple-jet burner could stabilize the ultra-lean flame for further experiments. As a result, L was set equal to 2d for all cases in this study. The flow area near the burner jet exit was a fully developed velocity profile verified by the particle image velocimetry (PIV) measurement, as shown later in Section 4.2. There was no inert gas sheath flow around the burners. The flame appearance was captured by a digital charge-coupled device (CCD) camera, FujiPix6900. The ISO value was 400 and the aperture was F3.5.
2.2. PIV Measurement
The flow field between the outer and center flame was carefully examined using the PIV technique. As shown in Figure 1b, the PIV system consisted of two neodymium-doped yttrium aluminum garnet (Nd:YAG) lasers, an external triggerable CCD camera, a pulse generator, a mechanical shutter, and a controller. This laser system possessed two Q-switched Nd:YAG pulse lasers (LOTIS TII LS-2134U) lasing at the fundamental wavelength (1064 nm) and second harmonic (532 nm) with a timing difference of 0.117 ms and picking pulse energy of 170 mJ. A set of laser sheet forming optics, including a wave plate, two polarizers, and cylindrical lens, was used to form a thin laser sheet of about 0.5 mm in thickness to illuminate seeding particles in the test section. A global seeding system was used with Al2O3 particles with a size of 7–10 µm. After mixing methane with air, the mixture flowed through a container with Al2O3 powder and was then introduced into the jet burner. A high-resolution and high-performance digital CCD camera (sharpVISIONTM) was used. Each image contained 1024 × 1280 pixels, which rendered a spatial resolution of 6.7 μm/pixel in the set-up. The inter-frame time for double-shutter mode could go at an interval as low as 200 ns. The mechanical shutter was used to prevent over-exposure of the second image of the PIV data image caused by strong flame illumination. The uncertainties for the major pieces of apparatus are estimated and listed in Table 1.
3. Numerical Analysis
3.1. Governing Equations
To numerically model the interactive methane–air premixed flames, the governing equations of mass, momentum, energy, and chemical species for a steady reacting flow were written in the Cartesian (x, y) coordinate system as
and the equation of state was
where ρ, p, T, Y, cp, h, wi, R0, M, gx, and υ are the density, pressure, temperature, mass fraction, specific heat capacity of the mixture, enthalpy, species production rate, universal gas constant, molecular weight, gravitational acceleration in the x-direction, and velocity vector, respectively, while µ, λ, and D are the viscosity, thermal conductivity, and mass diffusivity, respectively. The subscript i in Equations (3)–(5) stands for the i-th chemical species. The second diffusion term in the bracket of Equations (3) and (4) is the thermo-diffusion or Soret diffusion due to the effect of the temperature gradient. The concentration-driven diffusion coefficient was calculated as
where Dij is the binary diffusion coefficient and the subscripts i and j stand for the i-th and j-th species, whereas the binary mass diffusivity was determined by the Chapman–Enskog kinetic theory using Lennard–Jones parameters [31]. The thermo-diffusion coefficient was calculated as
where M is the mixture molecular weight and kij is the thermo-diffusion ratio.
3.2. Boundary Conditions
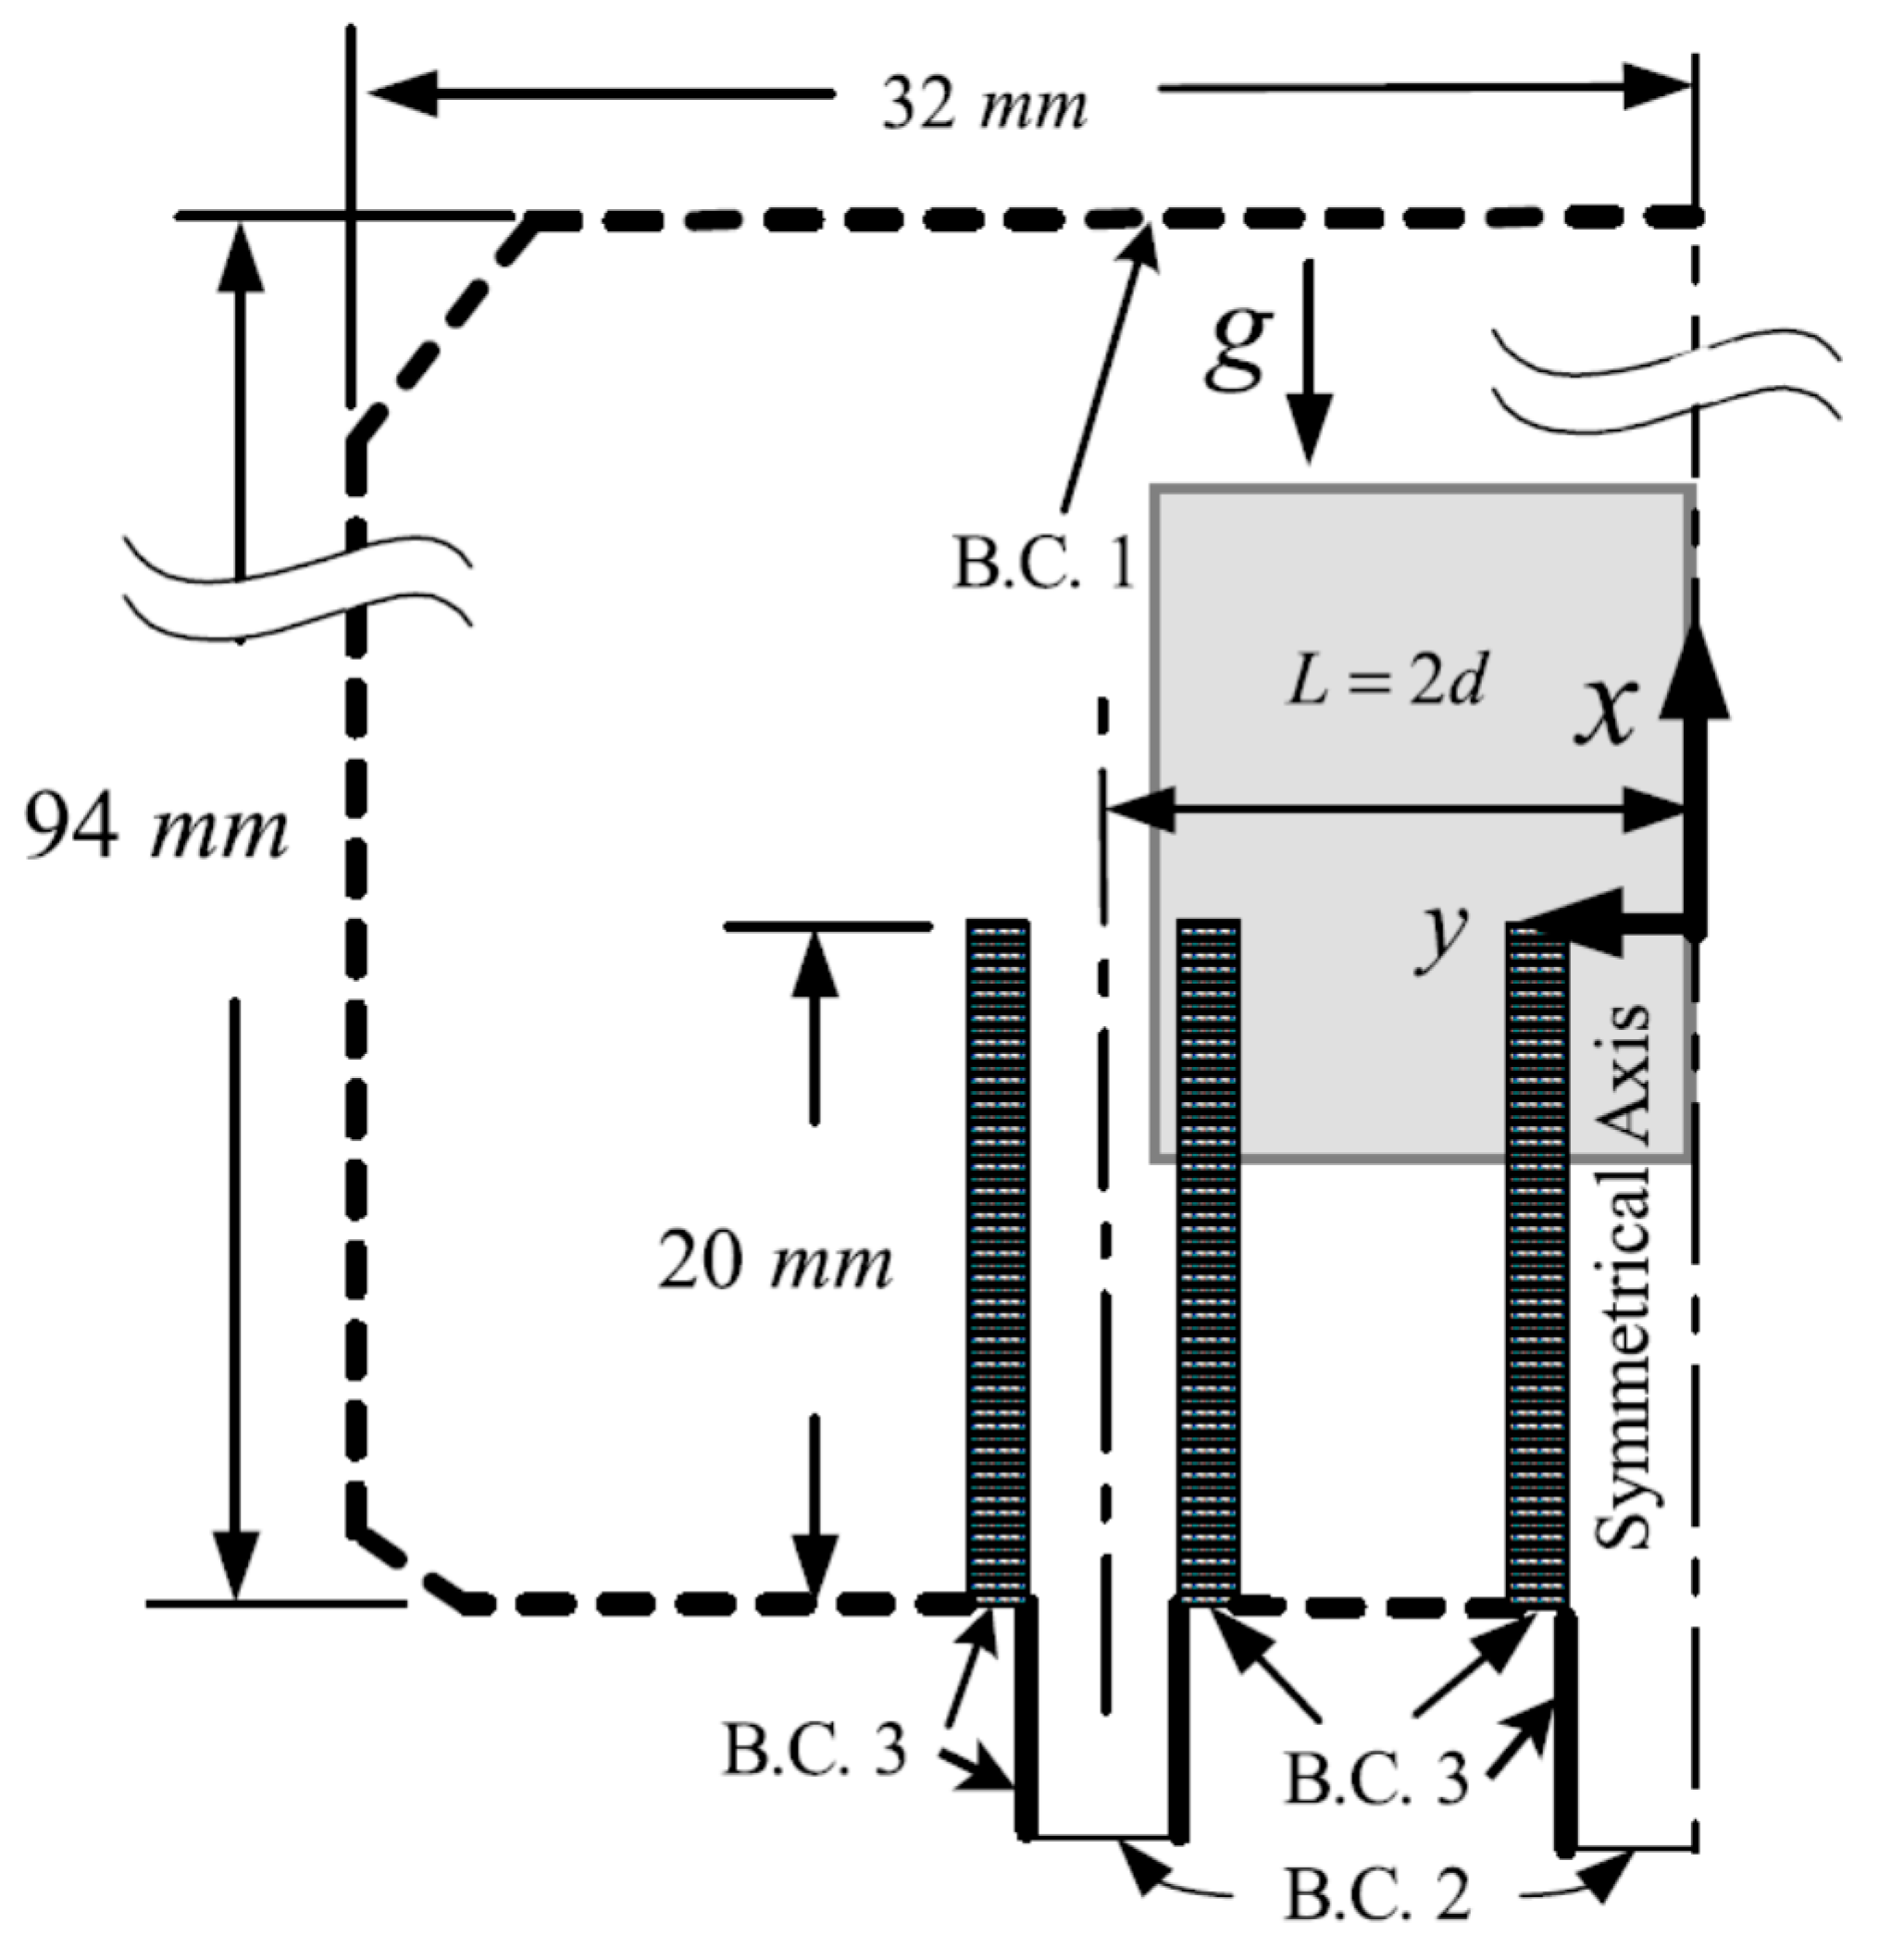
The relevant governing equations above were solved using the commercial package ESI-CFD for flow, heat transfer, and chemistry/mixing computations. A flame-zone reinforced grid system was used to solve the discretized equations with a control volume formulation according to the SIMPLEC algorithm. Figure 2 shows the schematic diagram of the computational domain. The x-and y-coordinates were denoted as shown in Figure 2. The origin (0,0) was located at the symmetrical centerline of the jet exit. There were four types of boundary conditions (B.C.) as indicated in the figure, i.e., the symmetrical axis, B.C. 1, B.C. 2, and B.C. 3. B.C. 1 was a fixed pressure inlet or outlet condition. For the outlet scenario, the variable gage pressure p was equal to zero and the other variables were equal to the calculated outcomes. At the inlet B.C. 2, premixed gas with a uniform velocity distribution of 1 or 0.4 m/s and a constant temperature of 300 K was ducted into the slot base. For B.C. 2, the equivalence ratio of the outer flame was fixed at φ = 0.88 and that of the center flame varied from 0.3 to 0.88. For B.C. 3, temperatures and slip conditions of the slot base and slot wall were set as constant at T = 300 K with non-slip conditions. The gravity force was downward as shown with g and an arrow. The domain size dimension 32 mm × 94 mm is not scaled in the figure. The heat transfer of burner slots located inside the computational domain was conjugated into the whole calculation. The appropriate boundary conditions and simulation schemes were chosen by verifying their results with the flame photo images and temperature measurements. To save computational time, the simulation began with the skeletal mechanism (16 species and 25 reactions) [32] and the results were then refined using the GRI-mech 3.0 mechanism (52 species and 325 reactions) [33]. The radiation effect was not embodied into the current numerical calculation. The assumptions and boundaries conditions used in the study were widely used for the numerical simulations of open-flame situations in the literature. We also used the same method for the simulation of methane–air combustion, and performed and discussed error analysis by comparing the results with experimental results in a similar previous study [27].
3.3. Grid and Domain Selection
This study utilized a combined grid system to generate finer grids in the flame sheet region, but kept the coarser grids for the other areas. Using different grid systems resulted in a different flame sheet contour and flame temperature. For the grid-independent study, three different grid sizes of 0.1, 0.06, and 0.03 mm within the fine grid area were tested. It was found that 0.06 mm was a reasonable grid size since the flame temperature distribution was almost the same for the grid sizes of 0.06 and 0.03 mm (as shown in Figure 3). As for the grid size of 0.1 mm, the flame temperature distribution was obviously different. The total cell number of the entire calculation zone was about 30,000. The computational time was less than one day using an HP-DL580G7 server (two Intel Xeon E7-4850 central processing units (CPUs) and 96 GB of memory).
The computational domain 32 mm × 94 mm was verified using a trial-and-error method to make sure this physical size was large enough to be a domain that was independent of size in the simulation results. A minimum required pipe length was also verified at the same time to ensure a fully developed velocity profile at the jet exit.
4. Results
4.1. Experimental Results
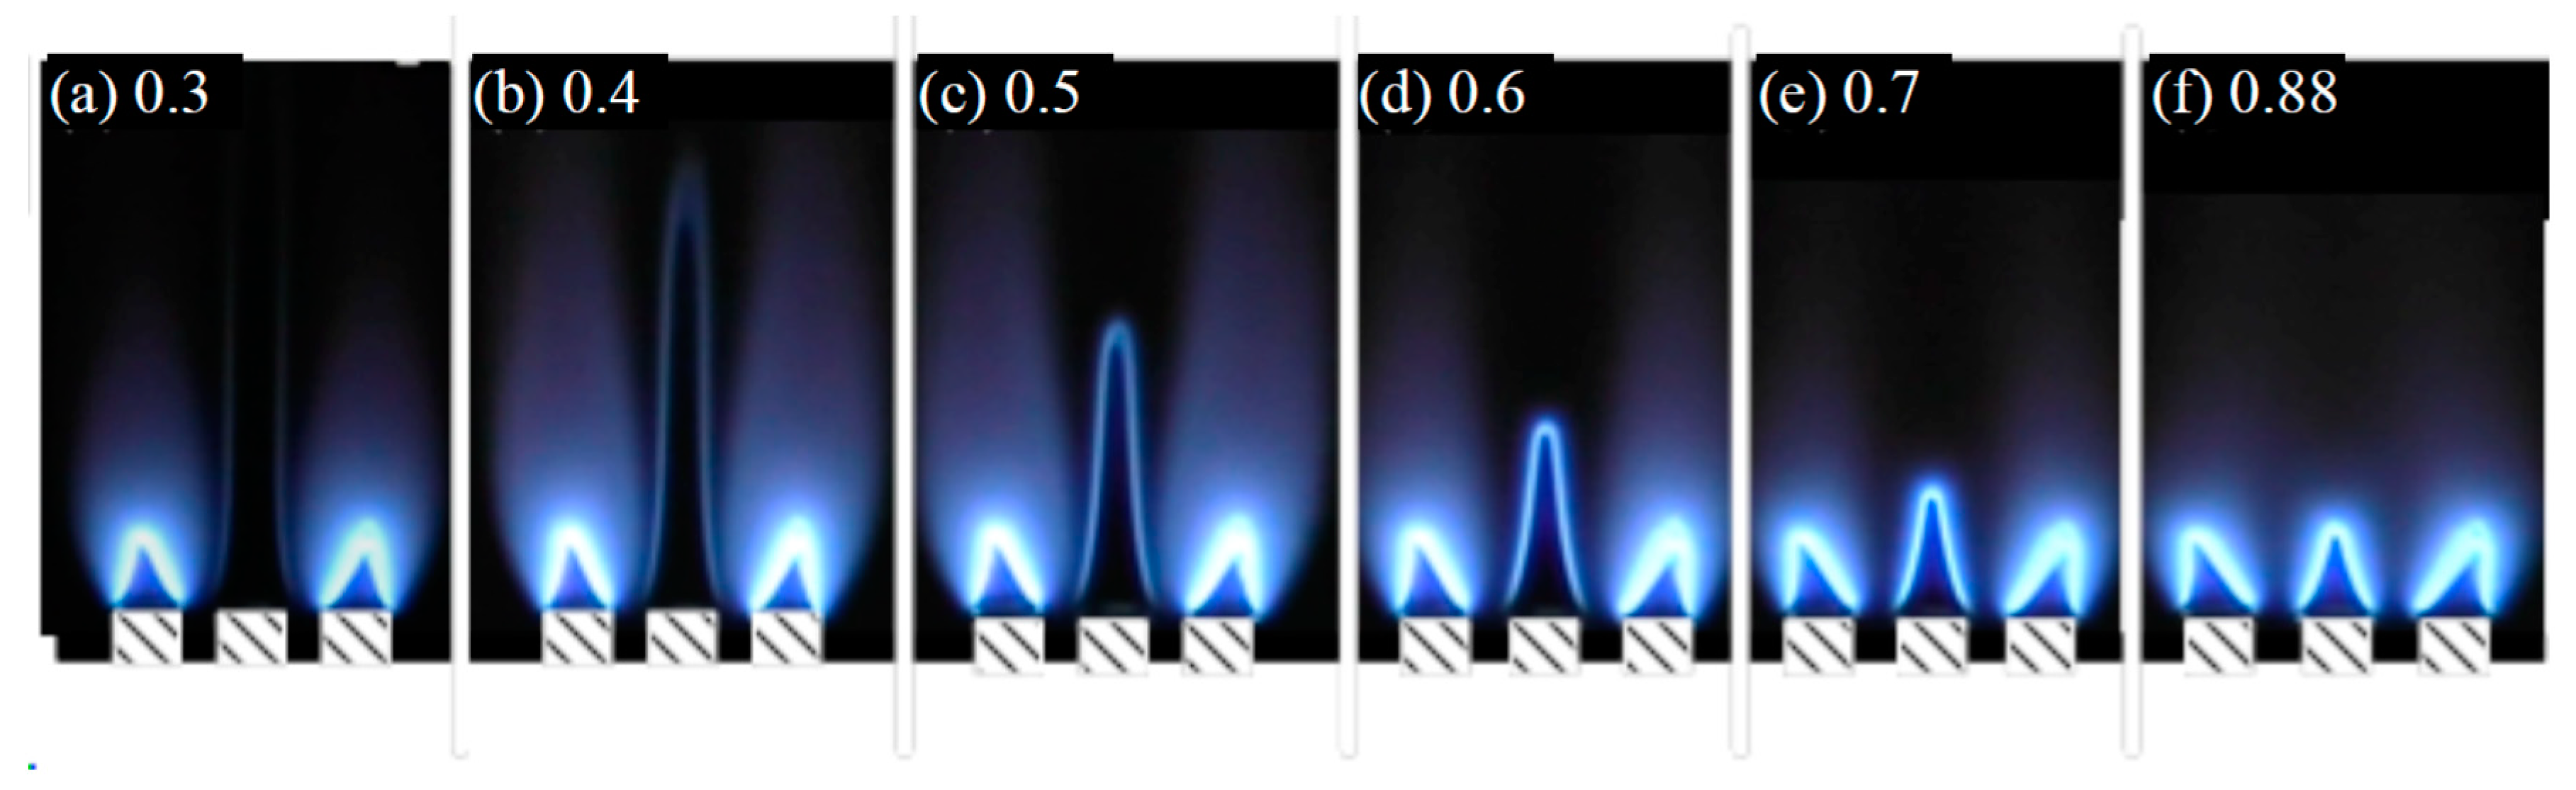
Figure 4 shows the flame chemiluminescence images of the sandwich triple-jet burner with the center flame varied from lean to supported ultra-lean flames. The flame chemiluminescence image was taken using a CCD camera with a filter of specific wavelength of the luminating flame intermediate species, such as OH at 307 nm. Before the camera shots, a suitable ISO value, shutter, and aperture were selected to gain the best result of the camera image. In addition, the able transform was used to analyze the brightest area and help determine the flame height. The velocity at the burner jet exit for the center and the outer premixed methane air mixtures was 1 m/s. A fixed equivalence ratio of 0.88 was applied to the outer flames for all cases, but an equivalence ratio varying from 0.3 to 0.88 was applied to the center flame. The only difference between the outer flame and center flame was the equivalence ratio. It was observed that the height of the center flame increased as the equivalence ratio decreased, especially in the cases of ultra-lean φ = 0.3 and 0.4. The tilting angle of the outer flames became less pronounced with the decrease in equivalence ratio of the center flame as shown in Figure 4a–f, especially for the ultra-lean cases (φ < 0.5). It was noted that the flame tip at φ = 0.3 was broken. The flame tip opening phenomena are related to the low Lewis number and negative stretch rate [31]. As shown in Figure 5a,b, the center slot jet was moved upstream purposely using the same burning conditions with Figure 5a for lean φ = 0.88 and Figure 5b for ultra-lean φ = 0.4 cases to distinguish the non-propagating and requiring-external-support nature of the ultra-lean flame.
In order to find the lowest operational equivalence ratio of the sandwich triple-jet burner, all slot spacers were removed and the remaining spacing of the jets was measured and found to be L = 1.5d due to wall finite thickness. When the jet spacing was at L = 1.5d, the operation limit of the center flame could go further down to the equivalence ratio of 0.22.
4.2. Calculated Flow Patterns and PIV Measurement
Figure 6 shows the streamline patterns in the computational domain of the enclosed gray area in Figure 2 near the jet exit, with the color-coded heat release rate distribution as the background to indicate the flame locations. The streamline pattern shows the interaction of the central and outer flames. The dividing streamline resulting from the lateral impingement of the post-flames was seen to incline to the center flame as the equivalence ratio of the center flame was reduced to ultra-lean and the flame became weak. The calculated streamline patterns of the lateral impingement showed the following characteristics: in the gap between the center and outer burner walls, the flow field was characterized by (1) the reverse flow for the case of φ = 0.7 for the center flame in Figure 6a, the reverse-and-recirculation flow for φ = 0.5 and 0.4 in Figure 6b,c, and the recirculation flow for φ = 0.3 in Figure 6d. In Figure 6, the areas in red or in green color had a heat release rate greater than 1 × 10⁷ J∙cm−1∙s−1. The area in blue had zero heat release rate. As shown in Figure 6, upon reducing the center flame equivalence ratio, the center flame base was lifted from the burner rim, becoming close to the dividing streamline (stagnation plane of the lateral impingement) before finally going over to the other side of the dividing streamline in Figure 6c,d. However, the flame cone portion of the center flame remained on the same side for all cases. Leakage of the methane−air mixture through the lifted gap between the center flame base and the burner rim became notable for the ultra-lean cases.
Figure 7a shows the comparison between measurement PIV velocity vectors in yellow and the calculated streamlines in black. The burning conditions were for the center flame at φ = 0.5 and outer flame at φ = 0.88. The average jet exit speed was equal to 1 m/s for both center and outer flames. The calculated streamlines were in good correspondence with the PIV results. The stabilization mechanism of the central ultra-lean methane jet flame was highly related to the physical and chemical processes of the interaction between the central ultra-lean flame and the outer flame. Among the physical interaction processes, the velocity distribution of the combustion flow field of the interacting jet flames played an important role in the stabilization of the ultra-lean flame, and the good agreement between the CFD velocity results and PIV results served to partially validate the CFD predictions. Figure 7b compares the calculated velocity with the experimental PIV data along a section perpendicular to the center ultra-lean flame from the symmetrical axis at the position of 5 mm above the slot exit. The velocity trends matched well with each other, and the maximum deviation was about 18%. Currently, it is difficult to avoid the mutual influence and interference of these flames when experimentally measuring the species information. Some useful experimental quantities of laser combustion diagnostics of the concentration and radical (such as OH) information may be considered for further detailed studies in the future.
Similar to Figure 6, the background of Figure 7a shows the calculated heat release rates to indicate the flame position. It was noted the deflection angles of streamlines across the outer flame and the center flame were quite different, characterizing a different flame temperature and strength.
It was reported in Reference [27] that the lateral impingement of the post-flame streamline is useful to stabilize the flame when two adjacent slot-jet flames are brought close to each other. Thus, only the typical condition of stable flames with the jet spacing L = 2d is discussed in this work.
4.3. OH Concentration
Figure 8 depicts the calculated OH concentration in white isopleths against the background of heat release rate, which was used to represent flame location. The white rectangular blocks represent the slot-jet wall of the outer and center jets. The right side of the picture is lined up with the symmetrical line and x-axis. The black streamlines are shown in Figure 8 to indicate the position of diving streamline and flow pattern. As shown, the center flame was perfectly enveloped within two OH concentration isopleths 1 (1 × 10⁻⁵ mol/m3) and 2 (3.1 × 10⁻⁴ mol/m3) rooted from the outer flame. If being tracked from the base of the outer flame, the distance between OH isopleth 1 and 2 got wider and then narrower after reaching the center flame base. In contrast, the distance between isopleth 2 and 3 constantly got wider. In other words, the OH diffusion strength across OH isopleths 1 and 2 became weaker from the outer lean flame base over the impingement area and became stronger along the center flame sheet, which could be identified by tracing the distance between these two isopleths, as shown in Figure 8. This indicates that the base of the center flame received OH radicals from the outer flame. However, the main portion of the center flame did locally generate a small amount of OH radicals via its own reactions. This is one of the reasons why the center flame was attached to the outer flame and not to the center jet burner rim when the center slot jet was moved upstream in Figure 5. In other words, the existence of the ultra-lean center flame depended on the support of OH radicals from the post-flame of the outer flame.
4.4. OH and CO Diffusion Vectors
Figure 9 and Figure 10 show the OH and CO diffusion vectors. The symmetry axis is along the x-axis. The white lines indicate the streamlines. In the background of these two figures, the heat release rates of the center flame in green and outer flame in both red and green are drawn to indicate the position of the outer and center flames, and the blue color means zero heat release rate in that area. The white OH diffusion vectors pointed away from the red area or higher-concentration area in the outer flame, but there was no change in direction observed for white OH diffusion vectors over the center flame. Note that the OH diffusion vectors all went toward the symmetry axis regardless of which side they were on with respect to the center flame. In other words, the reaction of the center flame depended on the diffusion of the OH radicals from the post-flame of the outer flame. However, the CO diffusion vectors went against each other from the outer and center flames, as shown in the middle of Figure 10, indicating that CO was generated locally from both the center and outer flames.
4.5. Flame Shape
Figure 11 shows the side-by-side comparison of flame location, flame length, and flame shapes between the simulated image of heat release rate and the photo picture of the triple-slot-jet flame. The burning condition of this case was an equivalence ratio of 0.88 for both outboard flames and 0.5 for the center flame, and a burner average exit speed of 1 m/s for all three of the flames. In order to acquire the best result of the camera image of the center flame, the camera was aimed at the mid-point of the center flame. At this position, the camera was aimed at the top of the outboard flames. Thus, the image of outboard flames looks slightly fuzzy or slightly out of focus. However, in this way of image shooting for the center flame, it was shot in a near-perpendicular position so that the photo could be directly compared with the simulated result in a side-by-side position without distortion. It was found that the simulated result matched well with the photo image. The measured flame height of the center ultra-lean flame was about 26 mm, and the calculated flame height was about 26.2 mm. The deviation was only about 0.77%.
4.6. Calculated and Measured Temperature Isopleths
The calculated temperature isopleths for the center flame φ = 0.4 case are compared with thermocouple measurements and a flame image in Figure 12. The comparison with flame image is shown in Figure 12a, with the thermocouple measurement in Figure 12b. The calculated temperature isopleths (lines 1 (400 K), 2 (800 K), 3 (1200 K), and 4 (1600 K)) were superimposed on the flame image and experimental temperature profile. The calculated temperature profile was in good correspondence with the measured results and flame image. The measured maximum flame temperature was 1853 K while the calculated value was 2005 K. The deviation was about 8%, which was probably due to the uncertainty of the R-type thermocouple (±4.3% at 1800 K) and heat radiation to the environment. The temperature profile of the ultra-lean center flame of φ = 0.4 lay between temperature isopleths 2 (800 K) and 3 (1200 K) as shown in Figure 12a,b, denoting a relatively low-temperature “flame”. The appearance of the center flame in the flame photograph also had very good correspondence with the temperature isopleths in Figure 12b, indicating the close relationship between the ultra-lean center flame and the hot product gas of the outer flame. In view of the relatively low-temperature and non-propagating nature of the ultra-lean flame, it is argued that this “flame” is not really a flame; however, with external support chemical reactions of species conversion (e.g., CO generation), although relatively small, heat release does exist in a thin layer. Further discussions on the flame structure and major chemical reaction path are presented in Section 5.
5. Discussions
Although the above simulation results showed good agreements when compared with the experimental data, one should estimate the computational error and carefully examine the assumptions and boundary conditions used in the numerical simulation before further discussions on the supported ultra-lean flame stabilization and chemical reaction characteristics using simulation results. For ease of comparison, the simulation boundary conditions and assumptions, and the resultant maximum deviation as compared with experimental measurements are summarized and listed in Table 2. The discrepancy of the predicted flame appearance, especially the flame height of the ultra-lean flame, was about 1%, and the maximum deviation in temperature prediction was about 8% with an uncertainty of ±4.3% for the R-type thermocouple at high temperature. Therefore, the constant 300 K inlet temperature boundary condition and the assumption of neglecting thermal radiation used in the numerical simulation are justifiable since the current ultra-lean flame and the supporting lean flame (at φ = 0.88) were light-blue in color and non-sooting (see Figure 4). The velocity discrepancy was relatively large with a maximum error of 18% relative to the PIV measurement. However, the uncertainty of the PIV measurement was estimated to be about 10%. From Figure 5 and the results above, as well as further discussion on the ultra-lean flame stabilization mechanism below, we show that the ultra-lean flame is too weak and the stabilization mechanism is mostly dominated by the chemical reaction supported by the supporting flame from the post-flame. Therefore, the flame shape and the temperature are the key factors related to the ultra-lean flame stabilization mechanism, and velocity discrepancy may not have a strong influence on the stabilization.
One of the main objectives of this study was to delineate the stabilization and combustion mechanism of the ultra-lean methane jet flame supported by two adjacent lean jet flames. The stabilization mechanism of the central ultra-lean methane jet flame was highly related to the physical and chemical processes of the interaction between the central ultra-lean flame and the outer flames. However, the central ultra-lean jet flame was relatively too weak, and the existence and stabilization of the central ultra-lean flame depended significantly on the thermal and radical flux from the adjacent stronger flame, as can be seen from the fact that the central ultra-lean flame was almost attached to the high-temperature post-flame of the adjacent jet flame in Figure 4 and Figure 5. Therefore, the contribution to the ultra-lean flame stabilization from the physical process in terms of flow velocity interaction between two adjacent flames was relatively low compared with the chemical process. In other words, the stabilization of the ultra-lean central flame depended more on the chemical process of the interaction by providing heat and active radicals from the post-flame region of the adjacent flame to initiate and maintain the combustion of the central ultra-lean flame. Therefore, there was more of a chemical/combustion mechanism than physical mechanism in the stabilization. In order to further delineate these cross-stream chemical activities, chemical sensitivity analysis for the reaction rates [31] was performed based on the results of four major reactions; R99: OH + CO ⇔ H + CO2, R86: OH + OH ⇔ O + H2O, R38: O2 + H ⇔ O + OH, and R98: OH + CH4 ⇔ CH3 + H2O were identified as the key reaction steps for the ultra-lean combustion. Most important of all, among these four reactions, the OH radical was involved in the forward and/or backward reactions, indicating that the OH radical is the key to ultra-lean flame reactions. OH is involved in the initial fuel decomposition or hydrogen abstraction process from methane, as indicated in R98. Methane can be decomposed initially by reactions R98: OH + CH4 ⇔ CH3 + H2O, R53: H + CH4 ⇔ H2 + CH3, and R11: O + CH4 ⇔ OH + CH3. Upon decreasing the equivalence ratio, the weights of these three reactions shift. For the center flame, the weights of relative contribution to CH4 decomposition initiation reactions were about 75%, 7%, and 18% for R98, R53, and R11, respectively. OH is also involved in further heat release of CO oxidation through R99. Reactions 86 and 38 show the branching reactions, in which R86 indicates that OH may be involved in providing the active oxidation radical of O atom through a different pathway other than high-temperature decomposition of oxygen molecules. As shown in Figure 8, Figure 9 and Figure 12, highlighting the temperature distribution, the OH concentration distribution, and the OH diffusion vectors, it can be seen that the ultra-lean flame was relatively weak with a temperature around 1200–1400 K and OH was mainly dependent on diffusion from the post-flame region of the adjacent stronger φ = 0.88 flame.
To further look into the chemical reactions related to the process of how the adjacent stronger flame provides active radicals to stabilize the ultra-lean flame in the flame base region, reaction sensitivity analysis was further performed and confined to the wall-proximity region of the gap between the adjacent flame and the central ultra-lean jet. The process in the flame base region is strongly related to initial oxidation of the fuel and maintaining the combustion, leading to stabilization of the weak central ultra-lean flame. Among the weak reactions, R119: HO2 + CH3 ⇔ OH + CH3O was identified as the key reaction in this region. Figure 13 shows the reaction rate distribution of R119. The outstanding wall-proximity radical of HO2 is seen (in Figure 13) to distribute from the post-flame of the adjacent outer jet flame to directly connect the flame base (flame stabilization location) of the central ultra-lean flame, leading to the initiation and stabilization of the central ultra-lean flame by providing a low-temperature oxidation of fuel through reaction R119: HO2 + CH3 ⇔ OH + CH3O, rather than the high-temperature oxidation through decomposition of the oxygen molecule as seen for conventional methane combustion. Figure 13b shows the enlarged plot of the jet exit wall-proximity region with a schematic expression of the reaction process of the ultra-lean flame near the flame base.
The above arguments and discussions can be summarized with a comparison of the major reaction pathway of the supported ultra-lean methane jet flame with respect to the conventional stable lean and stoichiometric methane flame in Figure 14. In Figure 14, in reaction R98 OH reacts with CH4 to produce CH3 and H2O. For the lean or stoichiometric methane flame, the H and O are also important for the decomposition of CH4. Instead of O, HO2 reacts with CH3 to CH3O in the ultra-lean flame through R119: HO2 + CH3 ⇔ OH + CH3O, and, for the lean or stoichiometric methane flame, CH3 may decompose directly to CH2O through a reaction with the O atom. For the ultra-lean center flame, CH3O is further attacked by the third body M to form CH2O, and CH2O then reacts with OH again to produce HCO. Reaction R168: HCO + O2 ⇔ HO2 + CO takes HCO and O2 together to produce CO. In these two steps, from CH2O to HCO and then further down to CO, the center flame has fewer choices than the outer flame. After that, CO reacts with OH to form H and CO2, which is the same for both center and outer flames. With the relative abundance of the OH radicals, with respect to the H and O radicals in the post-flame of the outer flame, as shown by the relative weights above, the initiation, decomposition, and subsequent reactions of methane in the ultra-lean center flame are mainly dominated by the OH radical and its participating reactions. With the lower flame temperature, the ultra-lean center flame tends to take the slower HO2 route for further CH3 reaction down to CH3O. However, the main route of methane oxidation remains the same for both the center and the outer flames.
6. Conclusions
This study successfully demonstrated the feasibility of stably sustaining an ultra-lean premixed methane–air flame in a novel sandwich triple-jet burner, and also successfully explained the structure of the ultra-lean flame in terms of the hydrodynamic field, thermodynamic field, and cross-stream chemical species activities. The simulated results made it possible to explain the stabilization mechanisms in terms of lateral impingement and species exchange routes. It was found that the ultra-lean center flame could be sustained with the support of thermal energy and active radicals diffused from the post-flame of the adjacent lean flames to stabilize the ultra-lean combustion of the central jet. The lateral impingement in the post-flame region accommodated a slow speed of ultra-lean combustion, extending the residence time and allowing chemical species and thermal energy to perform cross-stream diffusion. Remarkably, the methane coming out of the center flame was heated, decomposed, ignited, and burnt with the support of the outer post-flame, which was the stabilization mechanism of the supported ultra-lean methane flames.
Due to the paths of mass and thermal diffusion between the post-flame of the outer flame and the center flame, the central ultra-lean flame can be stabilized and further react while releasing heat. With a greater number of the OH radicals in the post-flame of the outer flame, the OH radical and its participating reactions dominate the initial decomposition and subsequent reactions of methane in the ultra-lean center flame. On the other hand, with the lower flame temperature, the ultra-lean center flame tends to take the slower HO2 route for further CH3 oxidation reaction. This work provides the outstanding chemical reaction paths, combustion mechanism, and flame structure of the central ultra-lean flame stabilized in a novel triple-jet burner, which represents the combustion/stabilization mechanism of the supported ultra-lean methane flames.
Author Contributions
H.-C.L. and Y.-C.C. contributed to the concept, numerical simulation, results explanation and writing of the paper. G.-B.C. contributed to the numerical simulation and results explanation. F.-H.W. and H.-Y.L. contributed to paper review and editing.
Funding
This research was funded by the Ministry of Science and Technology of Republic of China grant number NSC 95-2221-E-006-392-MY3. The computer time and CFD package were provided by the National Center for High-Performance Computing, Taiwan, ROC.
Conflicts of Interest
The authors declare no conflicts of interest.
References
- Montzka, S.A.; Dlugokencky, E.J.; Butler, J.H. Non-CO2 greenhouse gases and climate change. Nature 2011, 476, 43–50. [Google Scholar] [CrossRef] [PubMed]
- Foster, P.; Ramaswamy, V.; Artexo, P.; Berntsen, T.; Betts, R.; Fahey, D.W. Changes in atmospheric constituents and in radiative forcing. In Climate 2007: The Physical Science Basis; Solomon, S., Qin, D., Manning, M., Chen, Z., Marquiz, M., Averyt, K.B., Eds.; Cambridge University Press: Cambridge, UK, 2007; pp. 129–234. [Google Scholar]
- Lombardi, L.; Carnevale, E.; Corti, A. Greenhouse effect reduction and energy recovery from waste landfill. Energy 2006, 31, 3208–3219. [Google Scholar] [CrossRef]
- Jiang, X.; Mira, D.; Cluff, D.L. The combustion mitigation of methane as a non-CO2 greenhouse gas. Prog. Energy Combust. Sci. 2018, 66, 176–199. [Google Scholar] [CrossRef]
- Su, S.; Yu, X. A 25 kWe low concentration methane catalytic combustion gas turbine prototype unit. Energy 2015, 79, 428–438. [Google Scholar] [CrossRef]
- Schuller, T.; Durox, D.; Candel, S. Self-induced combustion oscillations of laminar premixed flames stabilized on annular burners, Combust. Flame 2003, 135, 525–537. [Google Scholar] [CrossRef]
- Lee, B.-J.; Kim, J.-S.; Lee, S. Enhancement of blowout limit by the interaction of multiple nonpremixed jet flames. Combust. Sci. Technol. 2004, 176, 482–497. [Google Scholar] [CrossRef]
- Hawkes, E.R.; Chen, J.H. Direct numerical simulation of hydrogen-enriched lean premixed methane-air flames. Combust. Flame 2004, 138, 242–258. [Google Scholar] [CrossRef]
- Ren, J.-Y.; Egolfopoulos, F.N. NOx Emission control of lean methane-air combustion with addition of methane reforming products. Combust. Sci. Technol. 2002, 174, 181–205. [Google Scholar] [CrossRef]
- Joannon, M.D.E.; Sabia, P.; Tregrossi, A.; Cavaliere, A. Dynamic behavior of methane oxidation in premixed flow reactor. Combust. Sci. Technol. 2004, 176, 769–783. [Google Scholar] [CrossRef]
- Kimura, I.; Ukawa, H. Studies on the Bunsen Flames of Fuel-Rich Mixture. In Proceedings of the 8th Symposium (International) on Combustion, Pasadena, CA, USA, 28 August–3 September 1960; The Combustion Institute: Pittsburgh, PA, USA, 1956; pp. 521–523. [Google Scholar]
- Singer, J.M. Burning Velocity Measurements on Slot Burners; Comparison with Cylindrical Burner Determination. In Proceedings of the 4th Symposium (International) on Combustion, Cambridge, MA, USA, 1–5 September 1952; The Combustion Institute: Pittsburgh, PA, USA, 1952; pp. 352–358. [Google Scholar]
- Menon, R.; Gollahalli, S.R. Multiple Jet Gas Flames in Still Air, ASME, HTD; ASME: New York, NY, USA, 1985; Volume 45, pp. 27–133. [Google Scholar]
- Menon, R.; Gollahalli, S.R. Investigation of Interacting Multiple Jets in Cross Flow. Combust. Sci. Technol. 1988, 60, 375–389. [Google Scholar] [CrossRef]
- Roper, F.G. Laminar Diffusion Flame Sizes for Interacting Burners. Combust. Flame 1979, 34, 19–27. [Google Scholar] [CrossRef]
- Seigo, K.; Satoshi, H.; Yoshito, U.; Syuichi, M.; Katsuo, A. Characteristics of combustion of Rich-Lean Flame Burner under Low Load Combustion. In Proceedings of the 20th International Colloquium on the Dynamics of Explosion and Reactive Systems, Montreal, QC, Canada, 31 July–5 August 2005. [Google Scholar]
- Lin, H.-C.; Chen, B.-C.; Ho, C.-C.; Chao, Y.-C. A Study of Mutual Interaction of Two Premixed Flame in Lean Combustion. In Proceedings of the Asia-Pacific Conference on Combustion, Nagoya, Japan, 20–23 May 2007. [Google Scholar]
- Lin, H.-C.; Chen, B.-C.; Ho, C.-C.; Chao, Y.-C. Mutual Interaction of Two Methane Premixed Flames in Extremely Lean Combustion. In Proceedings of the 21th International Colloquium on the Dynamics of Explosion and Reactive Systems, Poitiers, France, 23–27 July 2007. [Google Scholar]
- Chao, B.H.; Egolfopoulos, F.N.; Law, C.K. Structure and Propagation of Premixed Flame in Nozzle-Generated Counterflow. Combust. Flame 1997, 109, 620–638. [Google Scholar] [CrossRef]
- Chelliah, H.K.; Bui-Pham, M.; Seshadri, K.; Law, C.K. Numerical Description of the Structure of Counterflow Heptane-Air Flames Using Detailed and Reduced Chemistry with Comparison to Experiment. In Proceedings of the Twenty-Fourth Symposium (International) on Combustion, Sydney, Australia, 5–10 July 1992; The Combustion Institute: Pittsburgh, PA, USA, 1992; pp. 851–857. [Google Scholar]
- Kaiser, C.; Liu, J.-B.; Ronney, P.D. Diffusive-Thermal Instability of Counterflow Flames at Low Lewis Number. In Proceedings of the 38th Aerospace Sciences Meeting & Exhibit, Reno, Nevada, 10–13 January 2000. [Google Scholar]
- Sohrab, S.H.; Ye, Z.Y.; Law, C.K. Theory of Interactive Combustion of Counterflow Premixed Flames. Combust. Sci. Technol. 1986, 45, 27–45. [Google Scholar] [CrossRef]
- Vagelopoulos, C.M.; Egolfopoulos, F.N.; Law, K.C. Further Considerations on the Determination of Laminar Flame Speeds with the Counterflow Twin Flame Technique. In Proceedings of the Twenty-Fifth Symposium (International) on Combustion, Irvine, CA, USA, 31 July–5 August 1994; The Combustion Institute: Pittsburgh, PA, USA, 1994; pp. 1341–1347. [Google Scholar]
- Sung, C.J.; Liu, J.B.; Law, C.K. On the Scalar Structure of Nonequidiffusive Premixed Flames in Counterflow. Combust. Flame 1996, 106, 168–183. [Google Scholar] [CrossRef]
- Zheng, X.L.; Law, C.K. Ignition of premixed hydrogen/air by heated counterflow under reduced and elevated pressures. Combust. Flame 2004, 136, 168–179. [Google Scholar] [CrossRef]
- Sung, C.J.; Law, C.K. Structural Sensitivity, Response, and Extinction of Diffusion and Premixed Flames in Oscillating Counterflow. Combust. Flame 2000, 123, 375–388. [Google Scholar] [CrossRef]
- Lin, H.-C.; Cheng, T.-S.; Chen, B.-C.; Ho, C.-C.; Chao, Y.-C. A comprehensive study of two interactive parallel premixed methane flames on lean combustion. Proc. Combust. Inst. 2009, 32, 995–1002. [Google Scholar] [CrossRef]
- Cheng, Z.; Pitz, R.; Wehrmeyer, J. Opposed Jet Flames of Very Lean or Rich Premixed Propane-Air Reactants vs. Hot Products. Combust. Flame 2002, 128, 232–241. [Google Scholar]
- Cheng, Z.; Wehrmeyer, J.A.; Pitz, R.W. Lean or ultra-lean stretched planar methane/air flames. Proc. Combust. Inst. 2005, 30, 285–293. [Google Scholar] [CrossRef]
- Cheng, Z.; Pitz, R.; Wehrmeyer, J. Lean and ultralean stretched propane–air counterflow flames. Combust. Flame 2006, 145, 647–662. [Google Scholar] [CrossRef]
- Law, C.K. Combustion Physics; Cambridge University Press: Cambridge, UK, 2006. [Google Scholar]
- Smooke, M.D. Reduced Kinetic Mechanisms and Asymptotic Approximations for Methane-Air Flames; Lecture Note in Physics 384; Springer: Berlin, Germany, 1991. [Google Scholar]
- GRI-Mech. Available online: http://combustion.berkeley.edu/gri-mech/ version30 /text30.html (accessed on 30 July 1999).
Figure 1.
(a) Schematics of the triple-jet burner and experimental measurement set-up, and (b) essentials of combining the shuttered particle image velocimetry (PIV) system with high-speed video camera imaging.
Figure 1.
(a) Schematics of the triple-jet burner and experimental measurement set-up, and (b) essentials of combining the shuttered particle image velocimetry (PIV) system with high-speed video camera imaging.

Figure 2.
The computational domain and inlet and boundary conditions. The gray block near the x- and y-axes is the area shown in Figures 5–11. Boundary condition (B.C.) 1: fixed pressure (gauge p = 0) that can be an inlet (T = 300 K) or outlet; B.C. 2: uniform velocity, T = 300 K, premixed at φ = 0.88 for outer jets and φ = 0.3–0.88 for center jet; B.C. 3: T = 300 K and non-slip wall condition for all jets.

Figure 3.
The temperature distribution for different grid sizes. The burning condition was at jet spacing of 2d, a burner average inlet flow speed of 1 m/s, and an equivalence ratio of 0.88.
Figure 3.
The temperature distribution for different grid sizes. The burning condition was at jet spacing of 2d, a burner average inlet flow speed of 1 m/s, and an equivalence ratio of 0.88.

Figure 4.
The flame chemiluminescence images of the outer flames for φ = 0.88 and the center flame varying from φ = 0.3 to 0.88 with equal spacing L = 2d and a constant even distribution exit velocity of 1 m/s.
Figure 4.
The flame chemiluminescence images of the outer flames for φ = 0.88 and the center flame varying from φ = 0.3 to 0.88 with equal spacing L = 2d and a constant even distribution exit velocity of 1 m/s.

Figure 5.
The flame chemiluminescence images of the triple-jet burner for the cases with the center flame equivalence ratio (a) φ = 0.88 and (b) φ = 0.4, when the center jet was intentionally placed in an upstream location.
Figure 5.
The flame chemiluminescence images of the triple-jet burner for the cases with the center flame equivalence ratio (a) φ = 0.88 and (b) φ = 0.4, when the center jet was intentionally placed in an upstream location.

Figure 6.
With the color-coded heat release rate distribution as the background, the streamline patterns show lateral impingement of the post-flame flow between the two flames with the varied center flame equivalence ratio φ = 0.7–0.3 and fixed outer flame φ = 0.88 (arrow indicates inlet flow direction).

Figure 7.
(a) Comparison between PIV velocity vectors in yellow and the calculated streamlines in black with the color-coded heat release rate distribution as the background. The burning conditions were for the center flame at φ = 0.5 and outer flame at φ = 0.88. The average jet exit speed was equal to 1 m/s for both center and outer flames. (b) Comparison between PIV data and calculated velocity.

Figure 8.
OH isopleths in white and streamlines in black in the post-flame region in contrast to the color-coded heat release rate distribution. The burning conditions were for the center flame at φ = 0.5 and outer flame at φ = 0.88. The average jet exit speed was equal to 1 m/s for both center and outer flames.

Figure 9.
The OH diffusion vector (arrow) distribution in the post-flame region between the outer and the center flame, in contrast to the streamline (line) pattern and color-coded heat release rate. The burning conditions were for the center flame at φ = 0.5 and outer flame at φ = 0.88. The average jet exit speed was equal to 1 m/s for both center and outer flames.

Figure 10.
The CO diffusion vector distribution in the post-flame region between the outer and the center flame, in contrast to the streamline (line) pattern and color-coded heat release rate. The burning conditions were for the center flame at φ = 0.5 and outer flame at φ = 0.88. The average jet exit speed was equal to 1 m/s for both center and outer flames.

Figure 11.
The triple-jet burner is illustrated; the right half shows the picture and the left half shows the simulated image at a burner average exit speed of 1 m/s and an equivalence ratio of 0.88/0.5/0.88 for the outboard/center/outboard.
Figure 11.
The triple-jet burner is illustrated; the right half shows the picture and the left half shows the simulated image at a burner average exit speed of 1 m/s and an equivalence ratio of 0.88/0.5/0.88 for the outboard/center/outboard.

Figure 12.
Comparisons of the calculated temperature isopleths against (a) the photo and (b) the experimental thermocouple measured temperature distribution of the outer flame and half of the center flame. The burning conditions were for the center flame at φ = 0.4 and outer flame at φ = 0.88. The average jet exit speed was equal to 1 m/s for both center and outer flames.

Figure 13.
(a) The reaction rate distribution of the outstanding reaction of R119: HO2 + CH3 ⇔ OH + CH3O, and (b) the enlarged plot of the jet exit wall-proximity region with a schematic expression of the reaction process of the ultra-lean flame near the flame base.
Figure 13.
(a) The reaction rate distribution of the outstanding reaction of R119: HO2 + CH3 ⇔ OH + CH3O, and (b) the enlarged plot of the jet exit wall-proximity region with a schematic expression of the reaction process of the ultra-lean flame near the flame base.

Figure 14.
The major reaction pathways of ultra-lean methane combustion as compared to a conventional methane flame.
Figure 14.
The major reaction pathways of ultra-lean methane combustion as compared to a conventional methane flame.


Table 1.
The uncertainties for major pieces of apparatus. Nd:YAG—neodymium-doped yttrium aluminum garnet; CCD—charge-coupled device.
Table 1.
The uncertainties for major pieces of apparatus. Nd:YAG—neodymium-doped yttrium aluminum garnet; CCD—charge-coupled device.
| Apparatus | Model | Range | Uncertainty |
|---|---|---|---|
| Thermocouple | R-type | 233–2043 K | ±4.3% at 1800 K |
| Particle image velocimetry (PIV) | Nd:YAG pulse lasers (LOTIS TII) digital CCD camera (sharpVISIONTM) | double-shutter mode 0–200 ns | ±10% |
Table 2.
The error analysis for simulation boundary conditions and assumptions.
| Boundary Conditions (BC) and Assumptions | Parameters | Maximum Deviation to the Measured Data |
|---|---|---|
| Flame height (mm) * | 1% (Figure 11) |
| Temperature (K) | 8% (Figure 12) | |
| Velocity (m/s) | 18% (Figure 7) |
* Flame height was determined by the photo picture (experiment) and image of heat release rate (simulation).
© 2019 by the authors. Licensee MDPI, Basel, Switzerland. This article is an open access article distributed under the terms and conditions of the Creative Commons Attribution (CC BY) license (http://creativecommons.org/licenses/by/4.0/).
Share and Cite
MDPI and ACS Style
Lin, H.-C.; Chen, G.-B.; Wu, F.-H.; Li, H.-Y.; Chao, Y.-C. An Experimental and Numerical Study on Supported Ultra-Lean Methane Combustion. Energies 2019, 12, 2168. https://doi.org/10.3390/en12112168
AMA Style
Lin H-C, Chen G-B, Wu F-H, Li H-Y, Chao Y-C. An Experimental and Numerical Study on Supported Ultra-Lean Methane Combustion. Energies. 2019; 12(11):2168. https://doi.org/10.3390/en12112168
Chicago/Turabian StyleLin, Ho-Chuan, Guan-Bang Chen, Fang-Hsien Wu, Hong-Yeng Li, and Yei-Chin Chao. 2019. "An Experimental and Numerical Study on Supported Ultra-Lean Methane Combustion" Energies 12, no. 11: 2168. https://doi.org/10.3390/en12112168
Note that from the first issue of 2016, this journal uses article numbers instead of page numbers. See further details here.