The Strategies for Improving Energy Efficiency of Power System with Increasing Share of Wind Power in China

1
School of Humanities and Social Sciences, North China Electric Power University, Beijing 102206, China
2
Lawrence Berkeley National Laboratory (LBNL), Berkeley, CA 94720, USA
*
Author to whom correspondence should be addressed.
Energies 2019, 12(12), 2376; https://doi.org/10.3390/en12122376
Submission received: 2 May 2019
/
Revised: 10 June 2019
/
Accepted: 18 June 2019
/
Published: 20 June 2019
(This article belongs to the Section F: Electrical Engineering)
Abstract
:Coal-fired power generation will dominate the electricity supply in China in the foreseeable future. Coal fired power units can play a crucial role in integrating intermittent wind energy and improving the overall energy efficiency of the power system. The integration benefits of wind power, along with the gains of high load rates of coal fired units, should be fully taken into account. An optimal model combining wind power and coal fired units is built to analyze the operational flexibility of coal fired units and the integration of wind power. Taking the coal fired units in North China Power Grid as an example, the dispatch costs and benefits are examined under the energy efficiency dispatch mode, in comparison with those under the fair dispatch rules and the installed capacity. The results show that increasing the flexibility of the power system under the energy efficiency dispatch mode may be the best choice for the power system with the high share of coal fired units to integrate more wind power, and that the units delivering flexibility services are financially influenced. The results also indicate that a certain amount of wind power curtailment may be reasonable, and that rational penalty rate and fees for the curtailment of wind power may help to optimize the operation of the power system and integrate more wind power. Based on these results, policy and strategy recommendations are proposed to promote the flexibility of coal fired units and change their operation mode and their dispatch mode in the power system.
1. Introduction
In response to climate change, economic, and environmental challenges, the Paris Agreement is an important milestone against the global warming. Many countries have begun to deploy renewable energy (RE, mainly wind and solar energy) and low carbon energy technologies towards a more sustainable power supply, and high shares of RE have become a focus around the world [1,2]. Because of the coal-based energy endowment, China’s power industry is facing huge challenges [3]. China targets to increase the proportion of non-fossil energy to 15% in 2020, and 20% in 2030, and the CO2 intensity of GDP will be lowered by 60–65% by 2030, in comparison with that in 2005 [4].
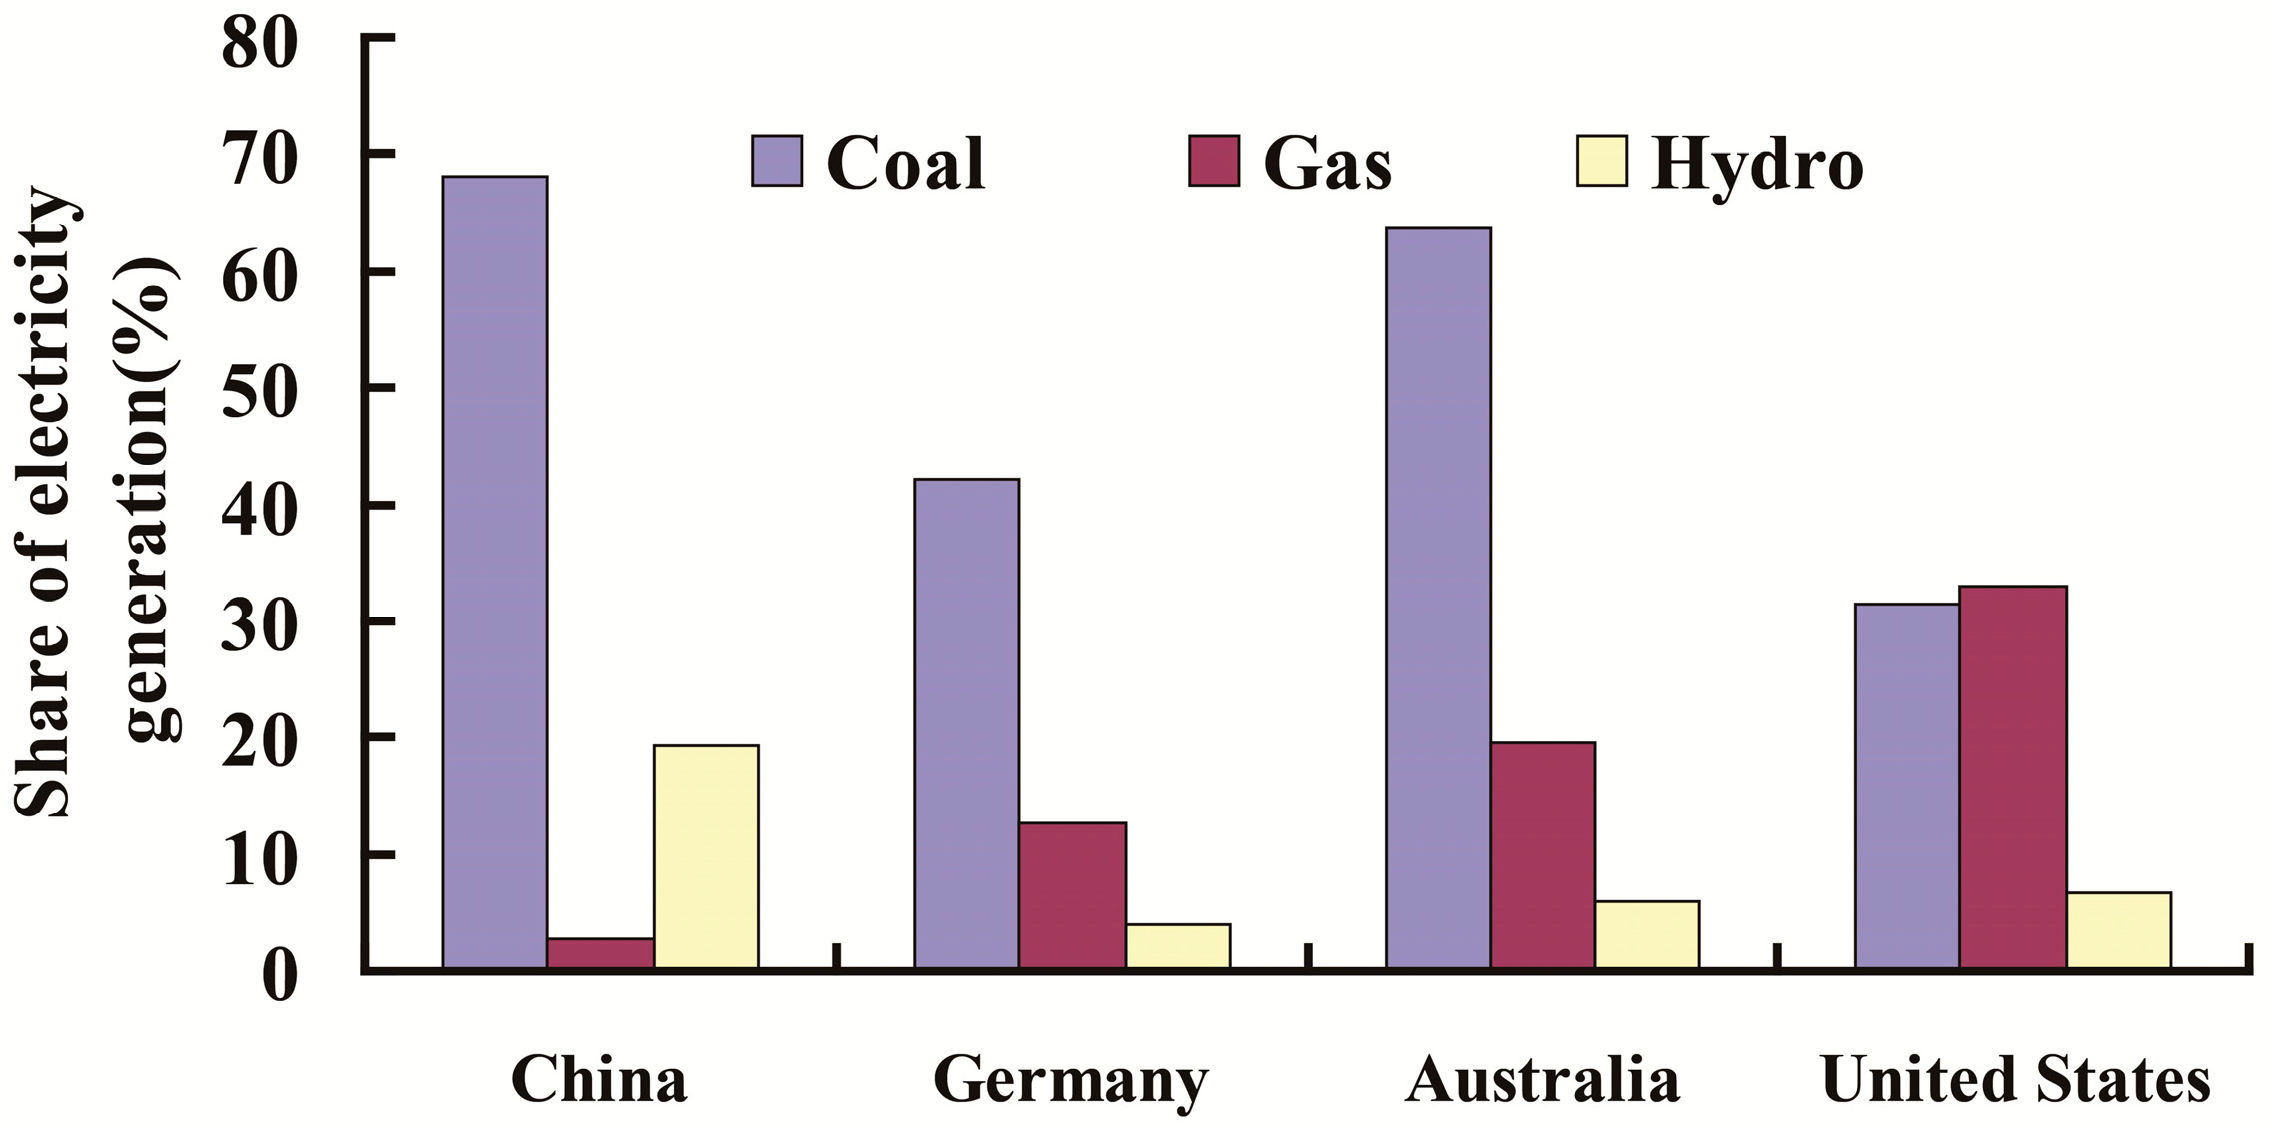
China is not alone in the energy system transition as other countries (e.g., Germany, USA, Australia, etc.) with high proportion of coal power generation pursue their own energy targets, and the paths these countries have taken may vary because of their energy mix, RE resources, and political and social setting [5]. These countries are still relying on coal for the bulk of their power generation, and their shares of electricity generation by fuel sources in 2016 [6] are shown in Figure 1. Hydropower and Gas-fired power stations are usually regarded as peak regulation sources or flexibility sources to integrate renewable energy, but hydroelectric generation is affected by the environment, seasons, etc. [7], and the capacity share of pumped-hydro energy storage stations is less than 9 percent of overall hydroelectric generation capacity in China [8]. Hydroelectric generation is also clean energy and is always granted priority dispatch. All these factors affect the flexibility services provided by the hydroelectric power units. China lacks flexibility sources for renewable energy integration, which are available in other countries with high share of renewable energy.
Although the shares of RE are also increasing steadily in China, coal-fired power generation still dominates the electricity supply and will be expected to be so for the foreseeable future. By the end of 2017, the capacity of coal fired power units was about 981.3 Gigawatts (GW), accounting for more than 55 percent of the total generation capacity, and it generated 4149.8 Terawatt-hours (TWh), accounting for almost 65 percent of the total power output [9]. With the cumulative wind power capacity of 163.3 GW and the solar photovoltaic (PV) capacity of 129.4 GW in 2017, they generated, respectively, 303.4 TWh and 116.6 TWh, accounting for 4.73% and 1.82% of total electricity generation [9]. According to the requirements referred in Opinions on Further Deepening the Reform of Power System [10], China’s electric power system in the future should be a combination of conventional power generation, centralized and distributed renewable energy, and would run in the mode where types of energy are complementary, and are transmitted over a long distance by power grid along with the local consumption by microgrid, ensuing that renewable energy could be exploited to the outmost extend and the energy efficiency significantly be improved.
The expansion of RE will increase the operation complexity of the power system and has an effect on the dispatch mode of the power system and the operation way of the conventional generation units [11]. Given the variable, unpredictable characteristics of RE, more RE integration increases the requirements of the flexibility sources to balance their variances, and these flexibility requirements have to be imposed on the overall power system.
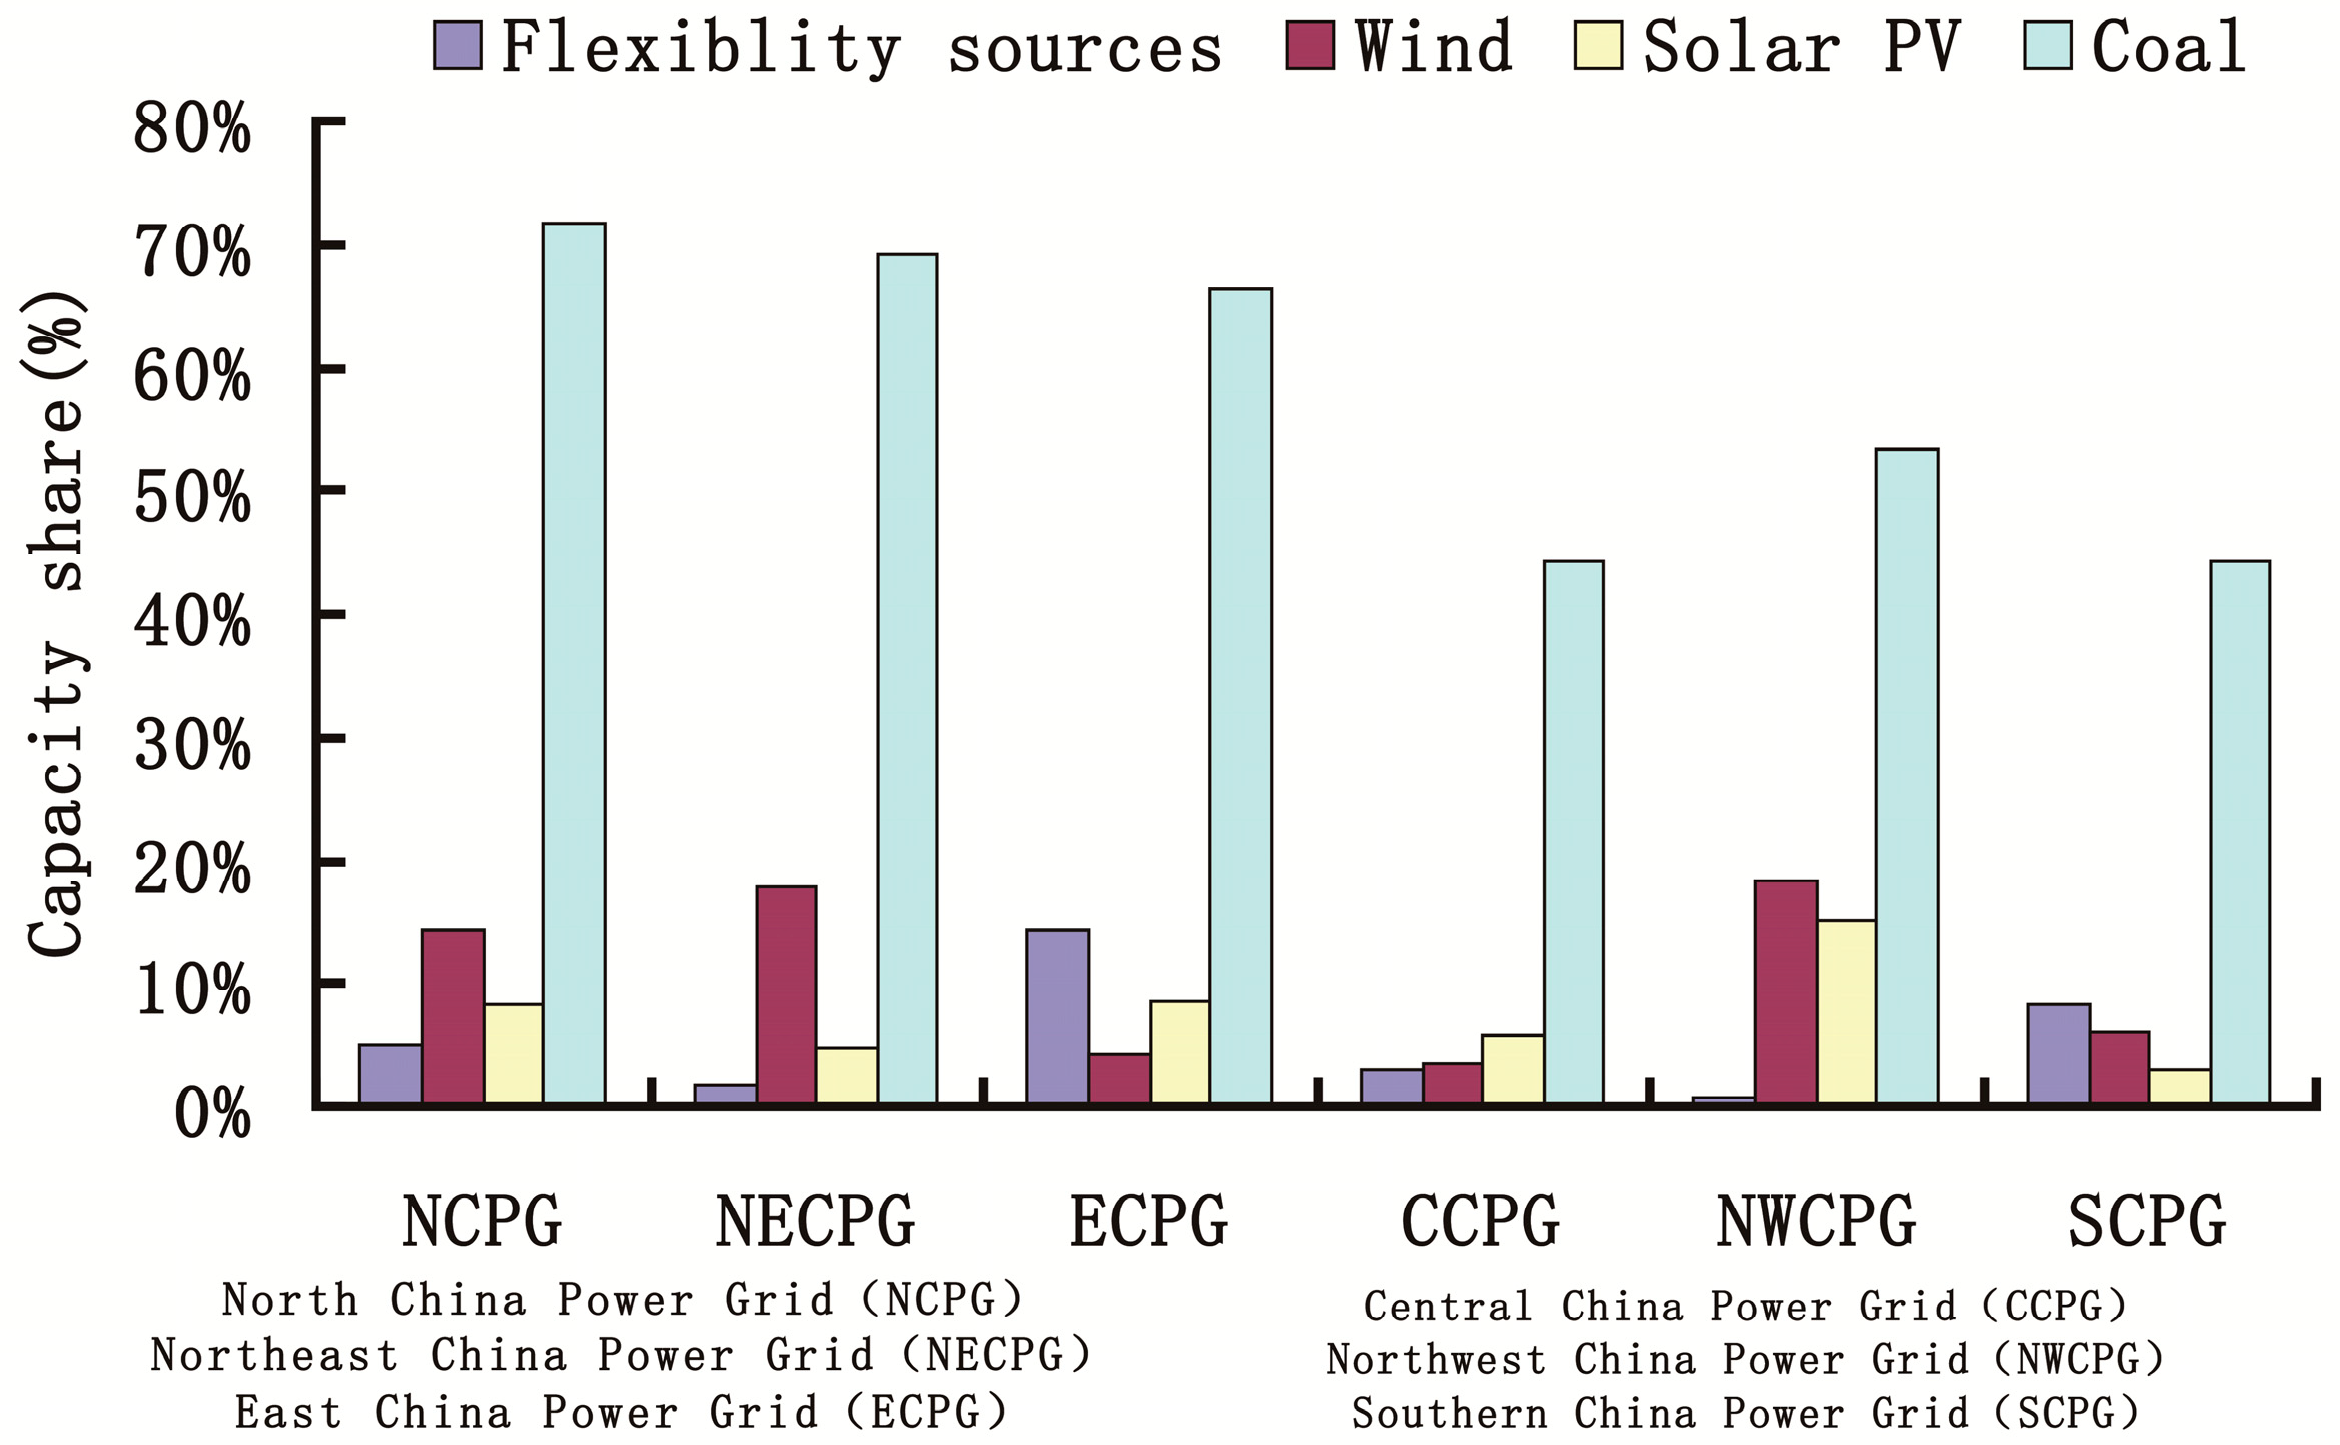
The flexibility can be defined as the ability of a power system to rapidly response to the power changes in demand and supply, and its evolution is driven by the increase of RE integration in the power system [12]. The potential flexibility sources usually include electricity storage units, demand side management, cross-border energy trading, hydro power units, and the flexible operation of thermal power units, etc. [7,13]. The capacity shares of units by fuel sources in the regional power grids in 2017 [8,9] are shown in Figure 2. The flexibility sources include the gas fired units, pumped-hydro energy storage stations and hydro power stations with reservoirs. In the northern regions of China with about nearly 69% of RE capacities, there is a shortage of the flexible power units, and these flexibility sources are only less than 5 percent of the total regional capacity and coal-fired power plants account for about 63.3 percent [9,14], resulting in the curtailment of RE. Thus, the existing coal fired power plants in these areas may continue to play an important role in meeting the flexibility requirements posed by intermittent RE integration, and parts of units have to change their former base- and mid-load cycling patterns [15]. The flexibility augment of these thermal units may be a major strategy for the power system with few other flexible power units.
The coal fired units delivering the flexibility services will need to run more frequently at partial loads by ramping up or down, or to be started up and shut down [16]. The start-up time, minimum load, and ramp rate of coal fired units are the key factors for their operational flexibility [13,17,18], which usually increase their operation and maintenance costs [19]. The startup of a unit increases the extra cost of the power generation [13], mainly for heating up its components and steam cycle. According to the shutdown period of a unit before its startup, there are generally there types of startups, which are hot startup (less than 8 hours since unit shutdown), warm startup (between 8 and 48 hours since unit shutdown) and cold startup (more than 48 hours since unit shutdown), and their definitions can vary between manufacturers [13,17,20]. The startups of the units delivering the flexibility are often hot startups, or warm startups. The startup cost of a coal fired unit includes the cost of startup fuel and the cost of startup auxiliary power and operations (such as chemicals, water, etc.) [21,22]. The startup of the thermal unit can also increase CO2 emissions.
The flexible operation of a unit can exacerbate the impacts of thermal stress on its component damages [23,24], reducing its lifetime and increasing the maintenance costs [13,25,26,27]. These costs may depend on the type and the capacity of a unit [22,25]. During the flexible operation of coal fired units running at low load levels, their thermal efficiency is reduced and lower than that of them running at their nominal loads, increasing their gross coal consumption rate and CO2 emissions. However, these units may reduce their overall coal consumption and CO2 emissions because they produce less electricity for delivering the flexibility services. According to the operation chrematistics of coal fired units, the overall energy efficiency of these thermal units can be improved through redistributing their power outputs, so that some of the units increase their load rates and other units may be shut down because they are regulated down to reach their minimal power output constraints.
There are various researches about the flexible operations of coal fired units, and they usually focused on the flexibility characteristics of units according to their technologies constrains [13,17]. Most of previous studies are qualitative, and do not explicitly report the costs of these flexibility services [15]. It has been usually indicated that the increasing shares of RE raise the flexibility requirements and affect the benefits and the costs of these thermal power plants providing the flexibility services [12,15,17,25]. Literature [12,25] systematically analyzes the flexibility during the power system transformation, however it has not been analyzed in the light of China’s actual situation. Literature [15,28,29] explicitly focuses only on start-up costs in the context of renewable integration, and does not report the cost of deep-down regulated units. Literature [17] reviews the operational flexibility and emissions of coal fired units with higher renewable energy, by examining the flexibility and the multiple operational processes of the units in more detail.
There seem few quantitative analyses on the development of flexibility services provided by coal fired units and the relative strategies and policies, especially for China, so far. Because of the different focuses of the literature on the integration economics of RE, a range of conclusions are reached without consensus [30]. The flexibility can be enhanced in the short-term through changes in operational practices and equipment modifications [31], and the associated costs with flexible operation of units have to be considered during the policy-making process and planning stages [32]. A short-term analysis model may be a better choice due to the sever curtailment of RE, along with high share of coal fired units in China.
However, the comprehensive assessment of the flexibility of coal fired units should include the growing deployment of RE, the dispatch conditions, and the operation of power unit fleet in the power system. From a system perspective, the flexibility costs of coal fired units and the integration benefits of RE should be fully taken into account [33,34,35,36], along with the energy efficiency improvement of the power system. Therefore, it is very important to establish effective strategies for China’s coal-dominated electric power system under low carbon constraints by increasing the shares of RE, and also improving the operation efficiency of coal-fired power units, which can be acquired through maintaining their high load rates.
Wind power and solar PV are intermittent RE, and wind power has the characteristic of anti-peak regulation, which might increase more demand for flexibility services than solar PV. For the simplicity of analysis, this paper only focuses on wind power integration and analyzes its impacts on the flexibility costs of coal fired units and the overall integration benefit of the power system, and also analyzes the strategy recommendations for improving energy efficiency of the power system and effectively integrating wind power in China. The rest of this paper is organized as follows: Section 2 presents an economic model to minimize the dispatch cost as the objective while the flexibility services of coal fired power units are also considered. Section 3 provides a case study based on the coal fired unit fleet in North China Regional Grid, and the results are also discussed. Section 4 summarizes the conclusions and provides the policy and strategy recommendations.
2. Methodology
A power system usually includes power sources, power transmission grid, load demand. The decisions on the development of the power system (such as the construction of new power units or demand response utilization are made on the basis of the resources in power demand side, power grid, and power supply side [37]. In order to highlight the flexible operation effects of coal fired units on the integration of intermittent RE, this research focuses on the power supply side, including the integration of wind energy, the demand for the flexibility services of coal fired units, and the energy efficiency improvement of the power system. Because of the large share of coal fired power units in China, it is assumed that these thermal units can provide enough flexibility requirements posed by the integration of wind power. Then an optimal model combining wind power and coal fired power generation is built to analyze the impacts of the flexible operation of coal fired power units on the power system. The coal fired units with high efficiency are granted priority dispatch in the model.
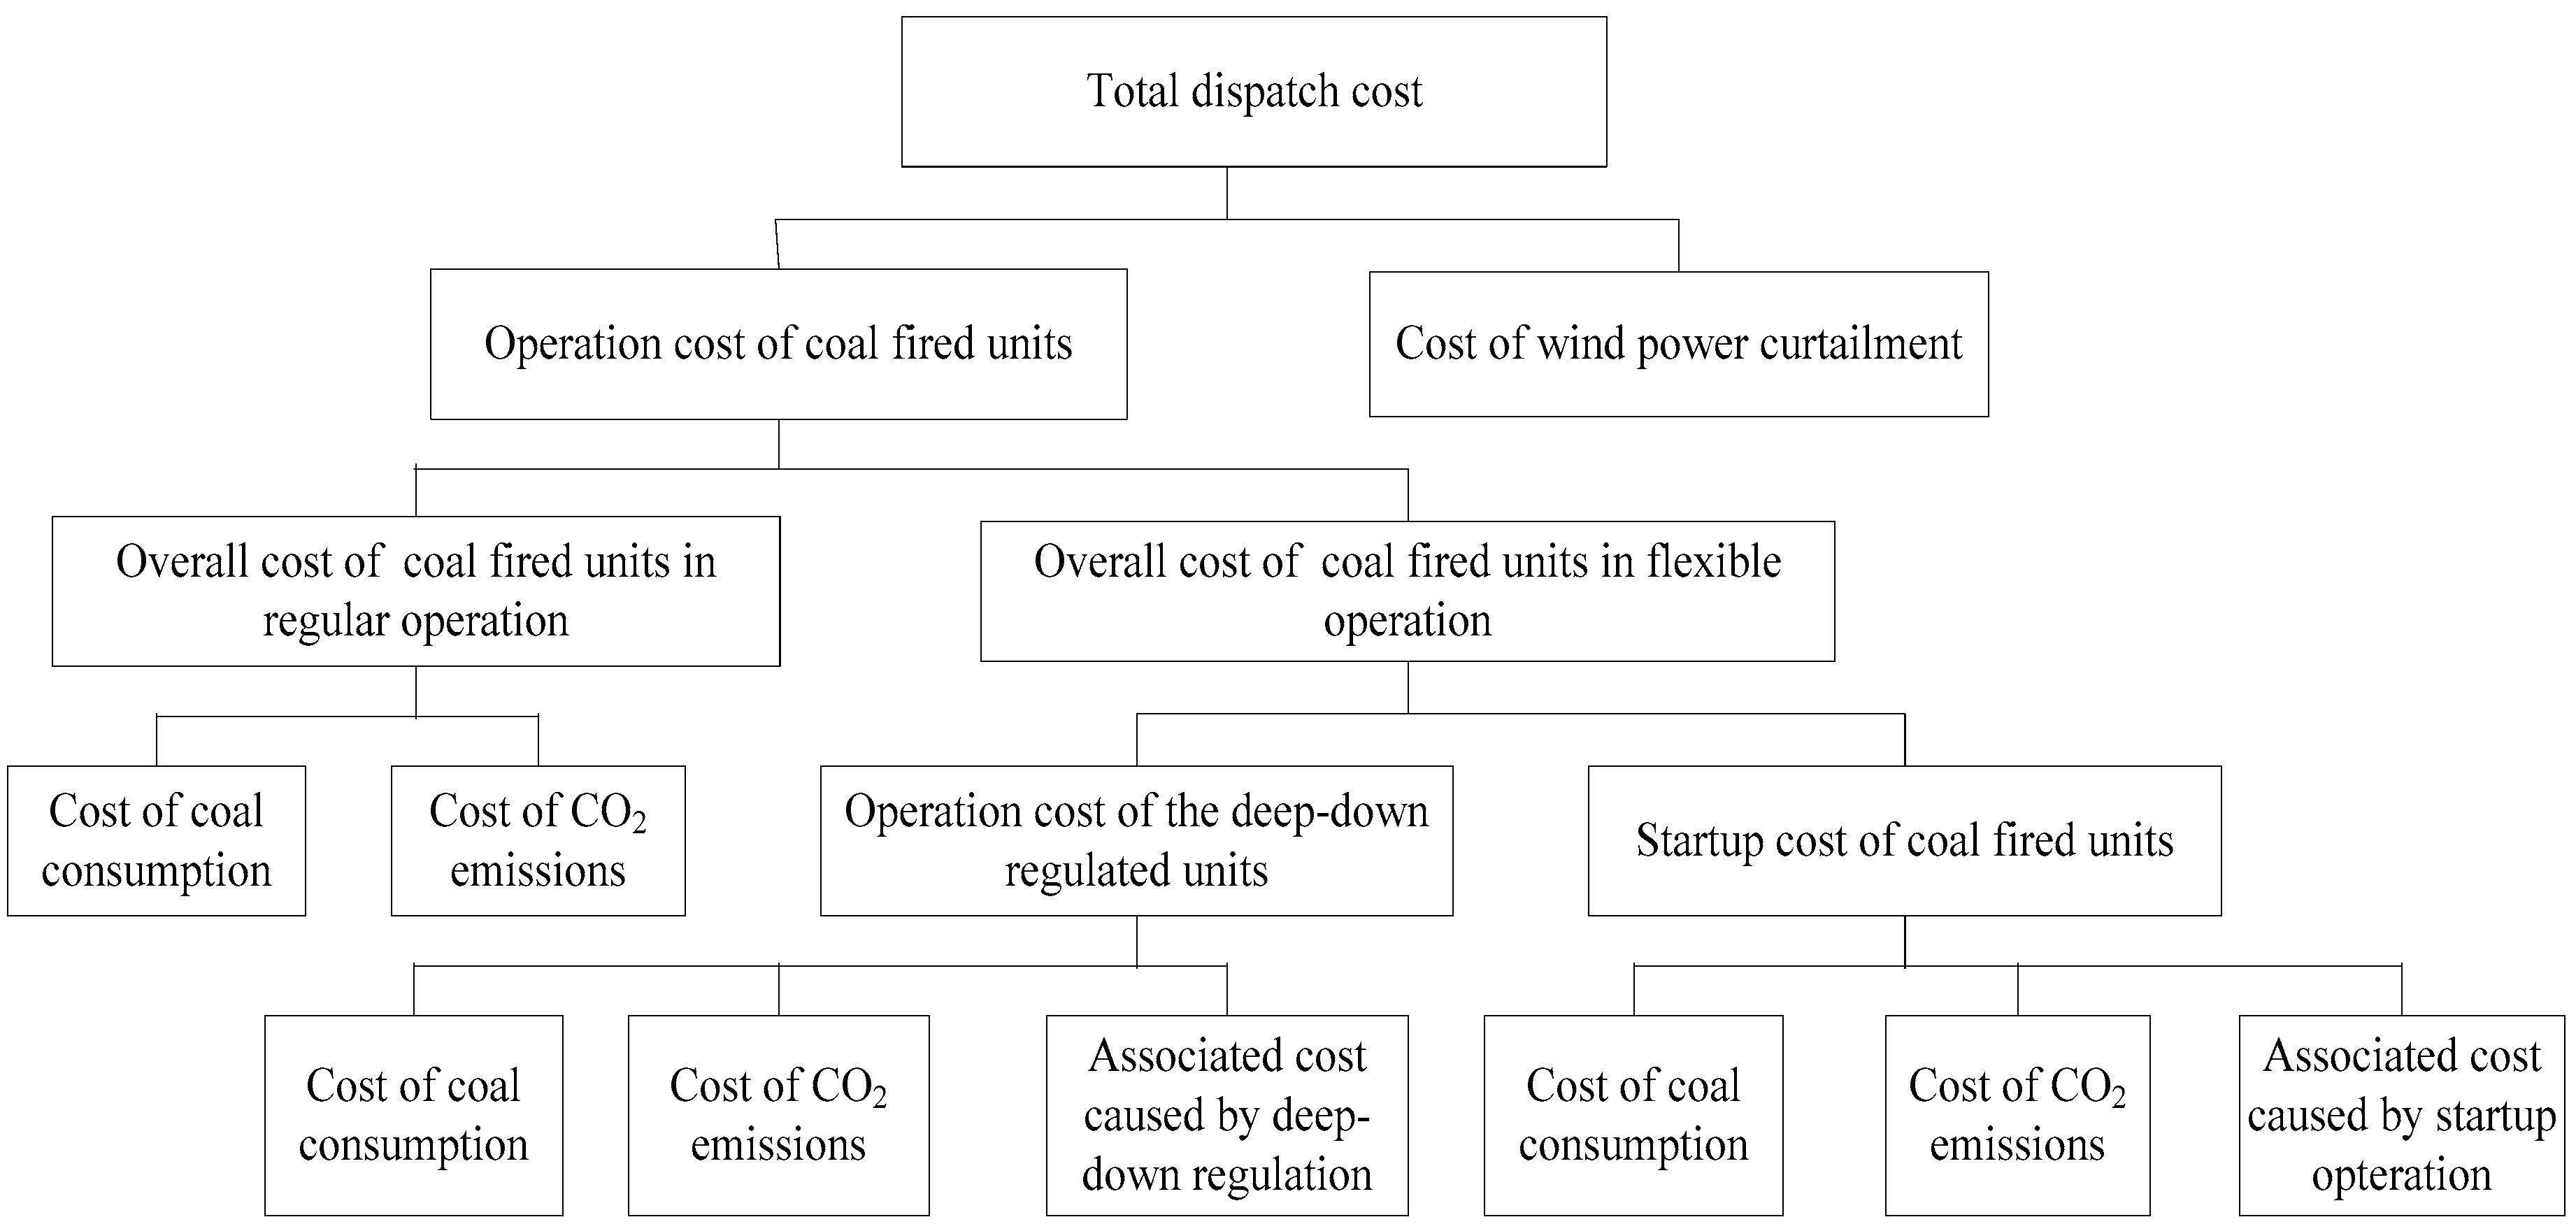
Due to the improvement of the flexibility retrofit technologies [13,16,22,25], the minimum load of a coal fired unit can be maintained down to 30% of its full load with no use of fuel oil. Then the flexibility costs in the model only depend on the cost of coal consumption, the cost of wind power curtailment, environmental costs such as CO2 emission cost, etc. Although the lifetime consumption of a coal fired unit and the associated costs caused by its flexible operation largely depend on future operation and maintenance, repair strategies, future revenues, etc. [13,25], or some mitigation strategies may be taken, these costs are also included in the model. The detail of total dispatch cost of the power system is shown in Figure 3. The costs of flexible operations of the coal fired units in the model include the operation cost of deep-down regulated units and the startup cost of the units. The deep-down regulation of a unit means that its load rate is regulated down below 0.5.
2.1. Objective Function and Constrains
2.1.1. Objective Function
The optimization objective is to minimize the dispatch costs of the power system in the scheduling period T, including the energy consumption cost of the coal fired units, the costs of flexibility services and balancing reserves, the cost of wind power curtailment, environmental cost in which only CO2 emissions are considered. The objective function is defined in Equation (1) [11,15,18]:
where i is the number index of a coal fired unit and n is the total number of coal fired units, uit is the status variable of coal fired unit i at time t (1 if unit i is generating, 0 otherwise); Si is the startup cost of unit i, the Pit is the power output of unit i at time t; Pwind,po,t is the potential wind power output (the total wind power output can be dispatched ) at time t, Pwind,ac,t is the actual wind power output dispatched at time t; penaltywind is the penalty rate for wind power curtailment; fi(Pit) is a function for the fuel cost of power generation of unit i at time t. The overall energy consumption B can be expressed in Equation (2) [30].
where Sci is the start-up energy consumption cost of unit i; Bi(Pit) is a function for the coal consumption cost of unit i at time t. Bi(Pit), fi(Pit) and Si are calculated respectively from Equation (3) [37], Equations (4) and (5).
where ai, bi and ci are coal consumption parameters of coal fired unit i; Pcoal is the coal price; Costiodr is the associated cost caused by deep-down regulations of unit i; Costiosu is the associated cost caused by startup operation of unit i; Pco2 is the CO2 price; r is the carbon emission factor for standard coal.
2.1.2. Constrains
(1) Power demand and supply balance.
(2) The output constraint of wind power units.
(3) System backup constraint.
(4) Power output constraints of coal fired unit i.
(5) The minimum startup and shutdown time constraints of coal fired unit i.
(6) The ramping constraints of coal fired unit i.
where PDt are the system power load demand at time t; Rt is the system reserve capacity; Piminc, Pimaxc are respectively the minimum and maximum stable output of coal fired unit i; , are respectively the minimum on and off time of coal fired unit i; Tion, Tioff are respectively the continuous operation time and shutdown time of coal fired unit i; rido, riup are respectively the ramping-down and ramping-up constraints of coal fired unit i.
2.2. Solving Method for the Model
The above objective function and its constraints define the model of the unit commitment and the economic dispatch. The power system in the model consists of renewable power units and coal fired units. There are binary variables in the model for the on/off states of coal fired units to optimize the operation of the power system for the integration of wind power, and the fuel consumption curves of coal fired units are convex. Therefore, the model is a MINLP (mixed integer nonlinear programming) problem, and it is formulated and solved in GAMS (General Algebraic Modeling System).
3. Case Study
3.1. Description of the Case
The coal fired units in North China Power Grid are taken as an example. These coal fired units are the backbone of North China Power Grid, and the installed capacity is 50425MW, among which the capacity of CHP units accounts for 52.22 percent. The detail capacities of coal fired units are shown in Table 1. The installed capacity of renewable generation is about 14740MW, including the wind power capacity of about 11530 MW and the solar PV capacity of about 3210 MW. There is still much potential for deploying more RE in this regional grid.
According to literature [13,17,29], the lower minimum load, faster ramping rate, and shorter startup time of a coal fired unit could increase its flexibility. CHP units can increase their flexibility by decoupling the heat and power generation, such as deployment of heat storage equipment or optimization of turbine and steam flow, etc. CHP units can deliver more flexibility to respond rapidly to the fluctuations in load demand or supply during the non-heating season than that during the heating season, so that more wind power can be integrated into the power system during the non-heating season.
For the simplicity of analysis, this case study only focuses on the wind power generation and highlights the impacts of the flexibility of coal fired units during the heating season. The potential integration of wind power will be analyzed on the basis of the optimal operation of the coal fired units to meet a typical daily load demand.
3.2. Assumptions
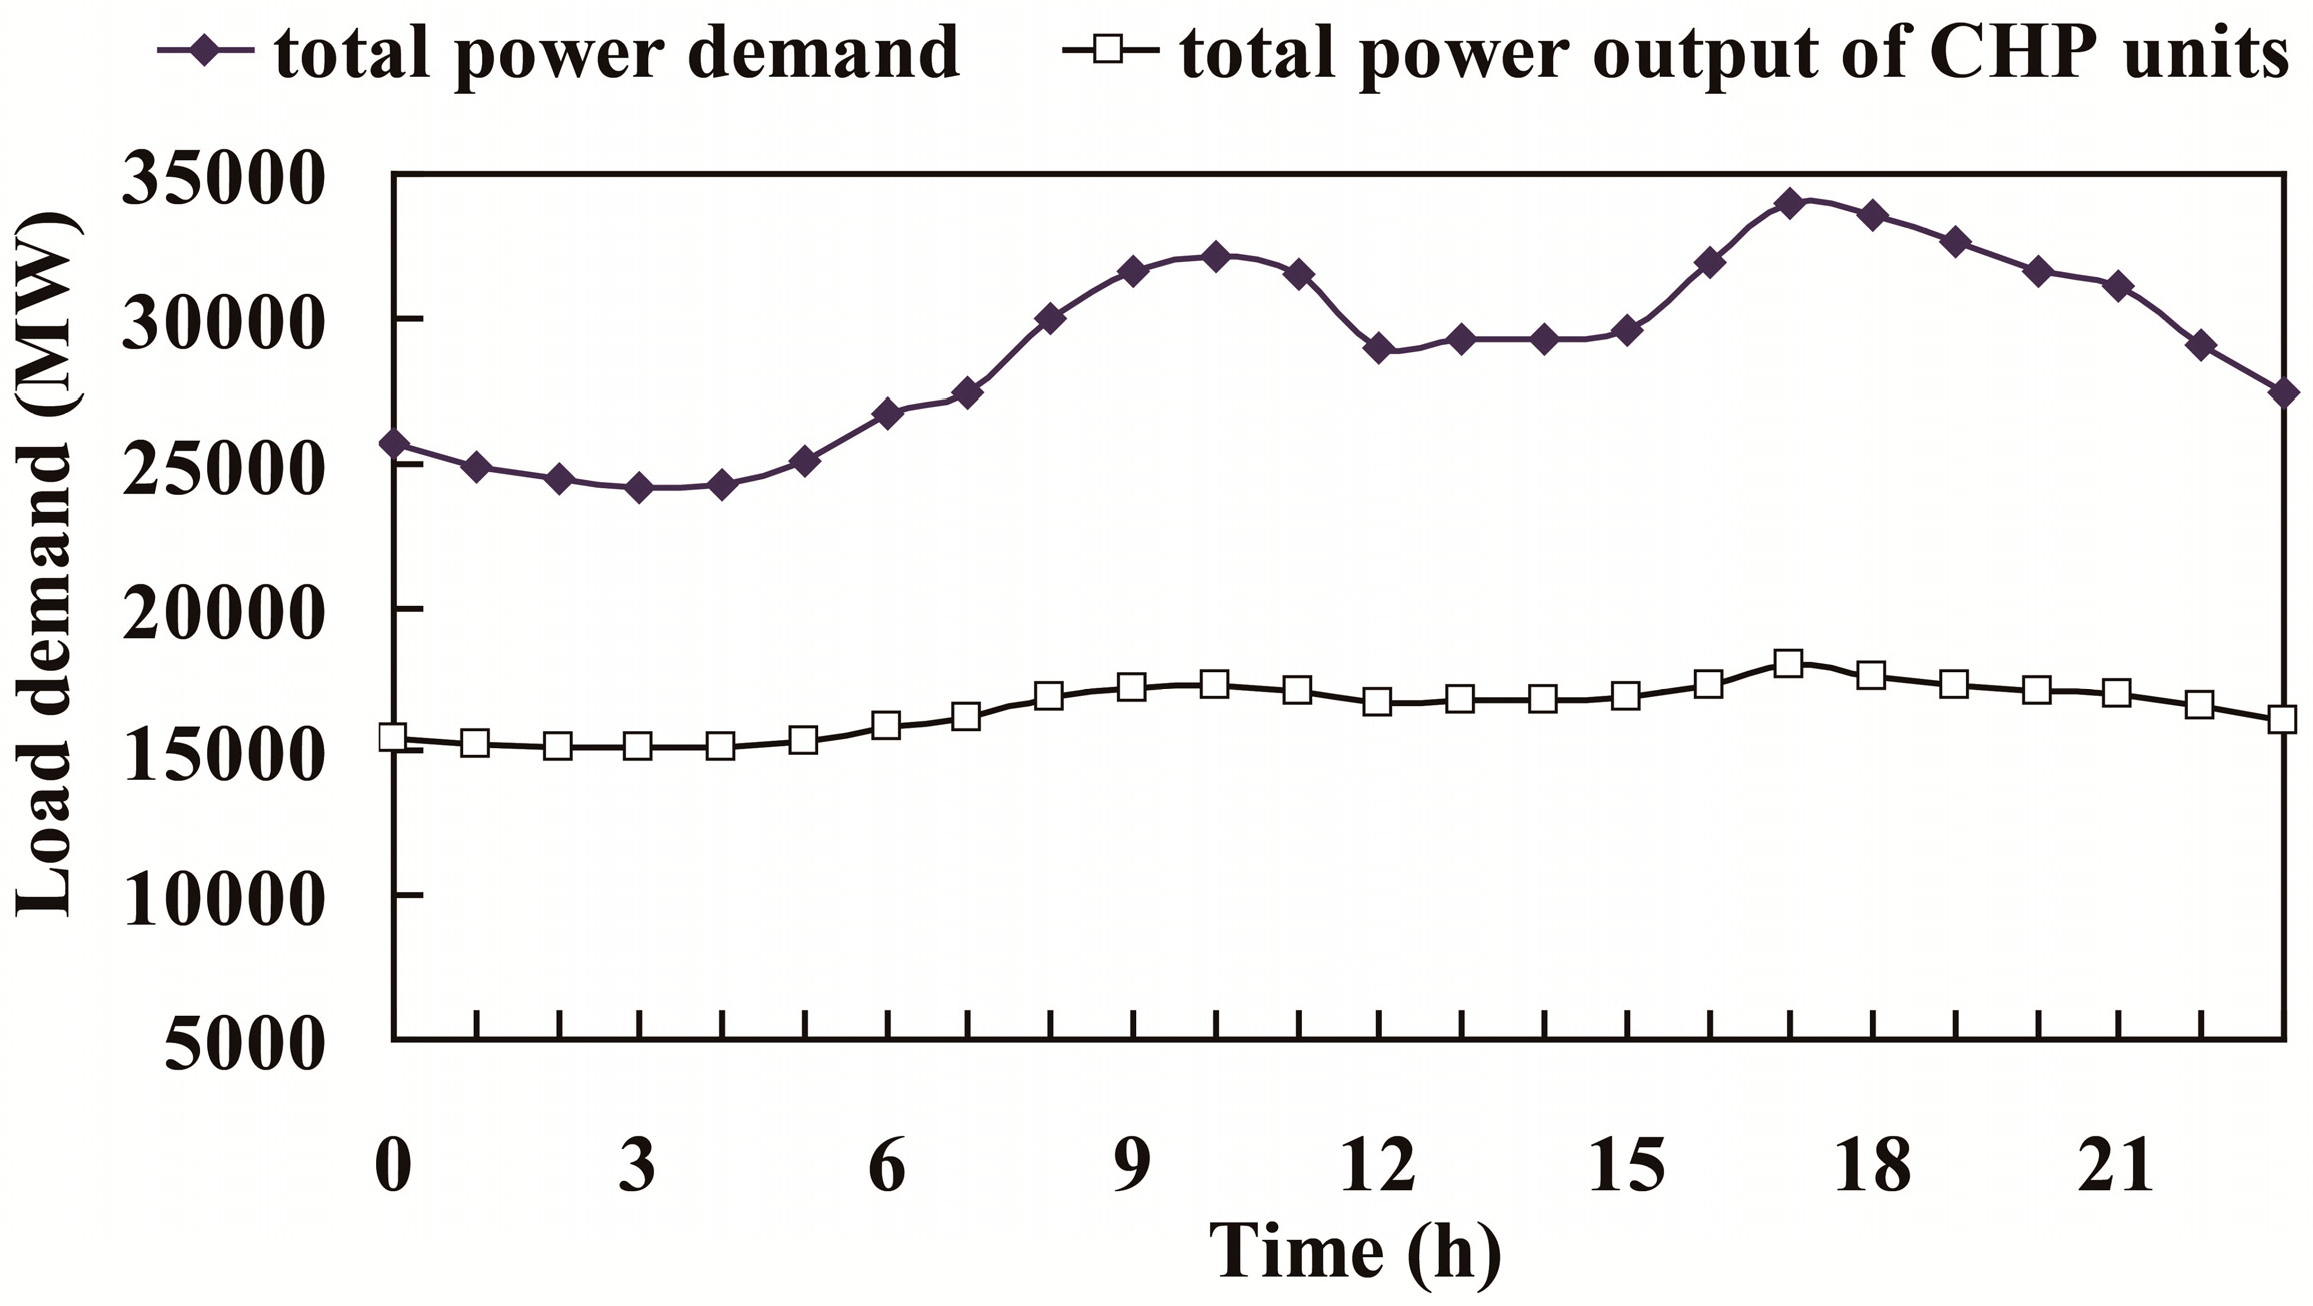
The load demand on a typical day is illustrated in Figure 4, including the system load demand and the power output of CHP units. The wind capacity factors in the regional grid are shown in Figure 5. Based on state-of-the-art power plants and literature analyses, the minimum load, ramping rate, the startup time, the startup energy loss, and cost loss of a coal fired unit are selected from the literature [22,40]. During the heating season, CHP units in the northern regions of China usually have to maintain a minimum load rate of about 70 percent [14], for their district heating system to meet the heat demand. It is assumed that a CHP unit has the flexibility of 10% of its full load during the period of delivering heat service. Figure 6 shows the average fuel consumption rate curves of typical coal fired units [41,42], and some data of these curves are acquired through the investigations and interviews.
The scenario taken as the baseline is in which all coal fired units run under the fair dispatch rules including transparency, equity and fairness, and no wind power is integrated, and the load demand has to be met. The average load rates of units within 24 h on a typical day in the baseline scenario, which are acquired through the investigations and interviews, are shown in Figure 7 [14,41,42], and overall average load rates of the coal fired units in the regional grid are shown in Table 2. Dispatch costs of the power system with 24 h on a typical day in the baseline scenario is shown in Table A1 in the Appendix A, and total dispatch cost of the power system (the sum of the dispatch costs within 24 h) on the typical day is 184.856 Million RMB. Then the impact of wind power integration on the flexibility of coal fired units under the operation constraints of the power system will be analyzed, along with the improvement of the overall energy efficiency of the power system. In the following analyses, we use the total dispatch cost, overall wind power integration ratio, and curtailment ratio for comparison purposes instead of the values within 24 h.
3.3. Simulation Results and Analysis
3.3.1. Integration of Wind Power and Its Curtailment and Dispatch Cost of the Power System
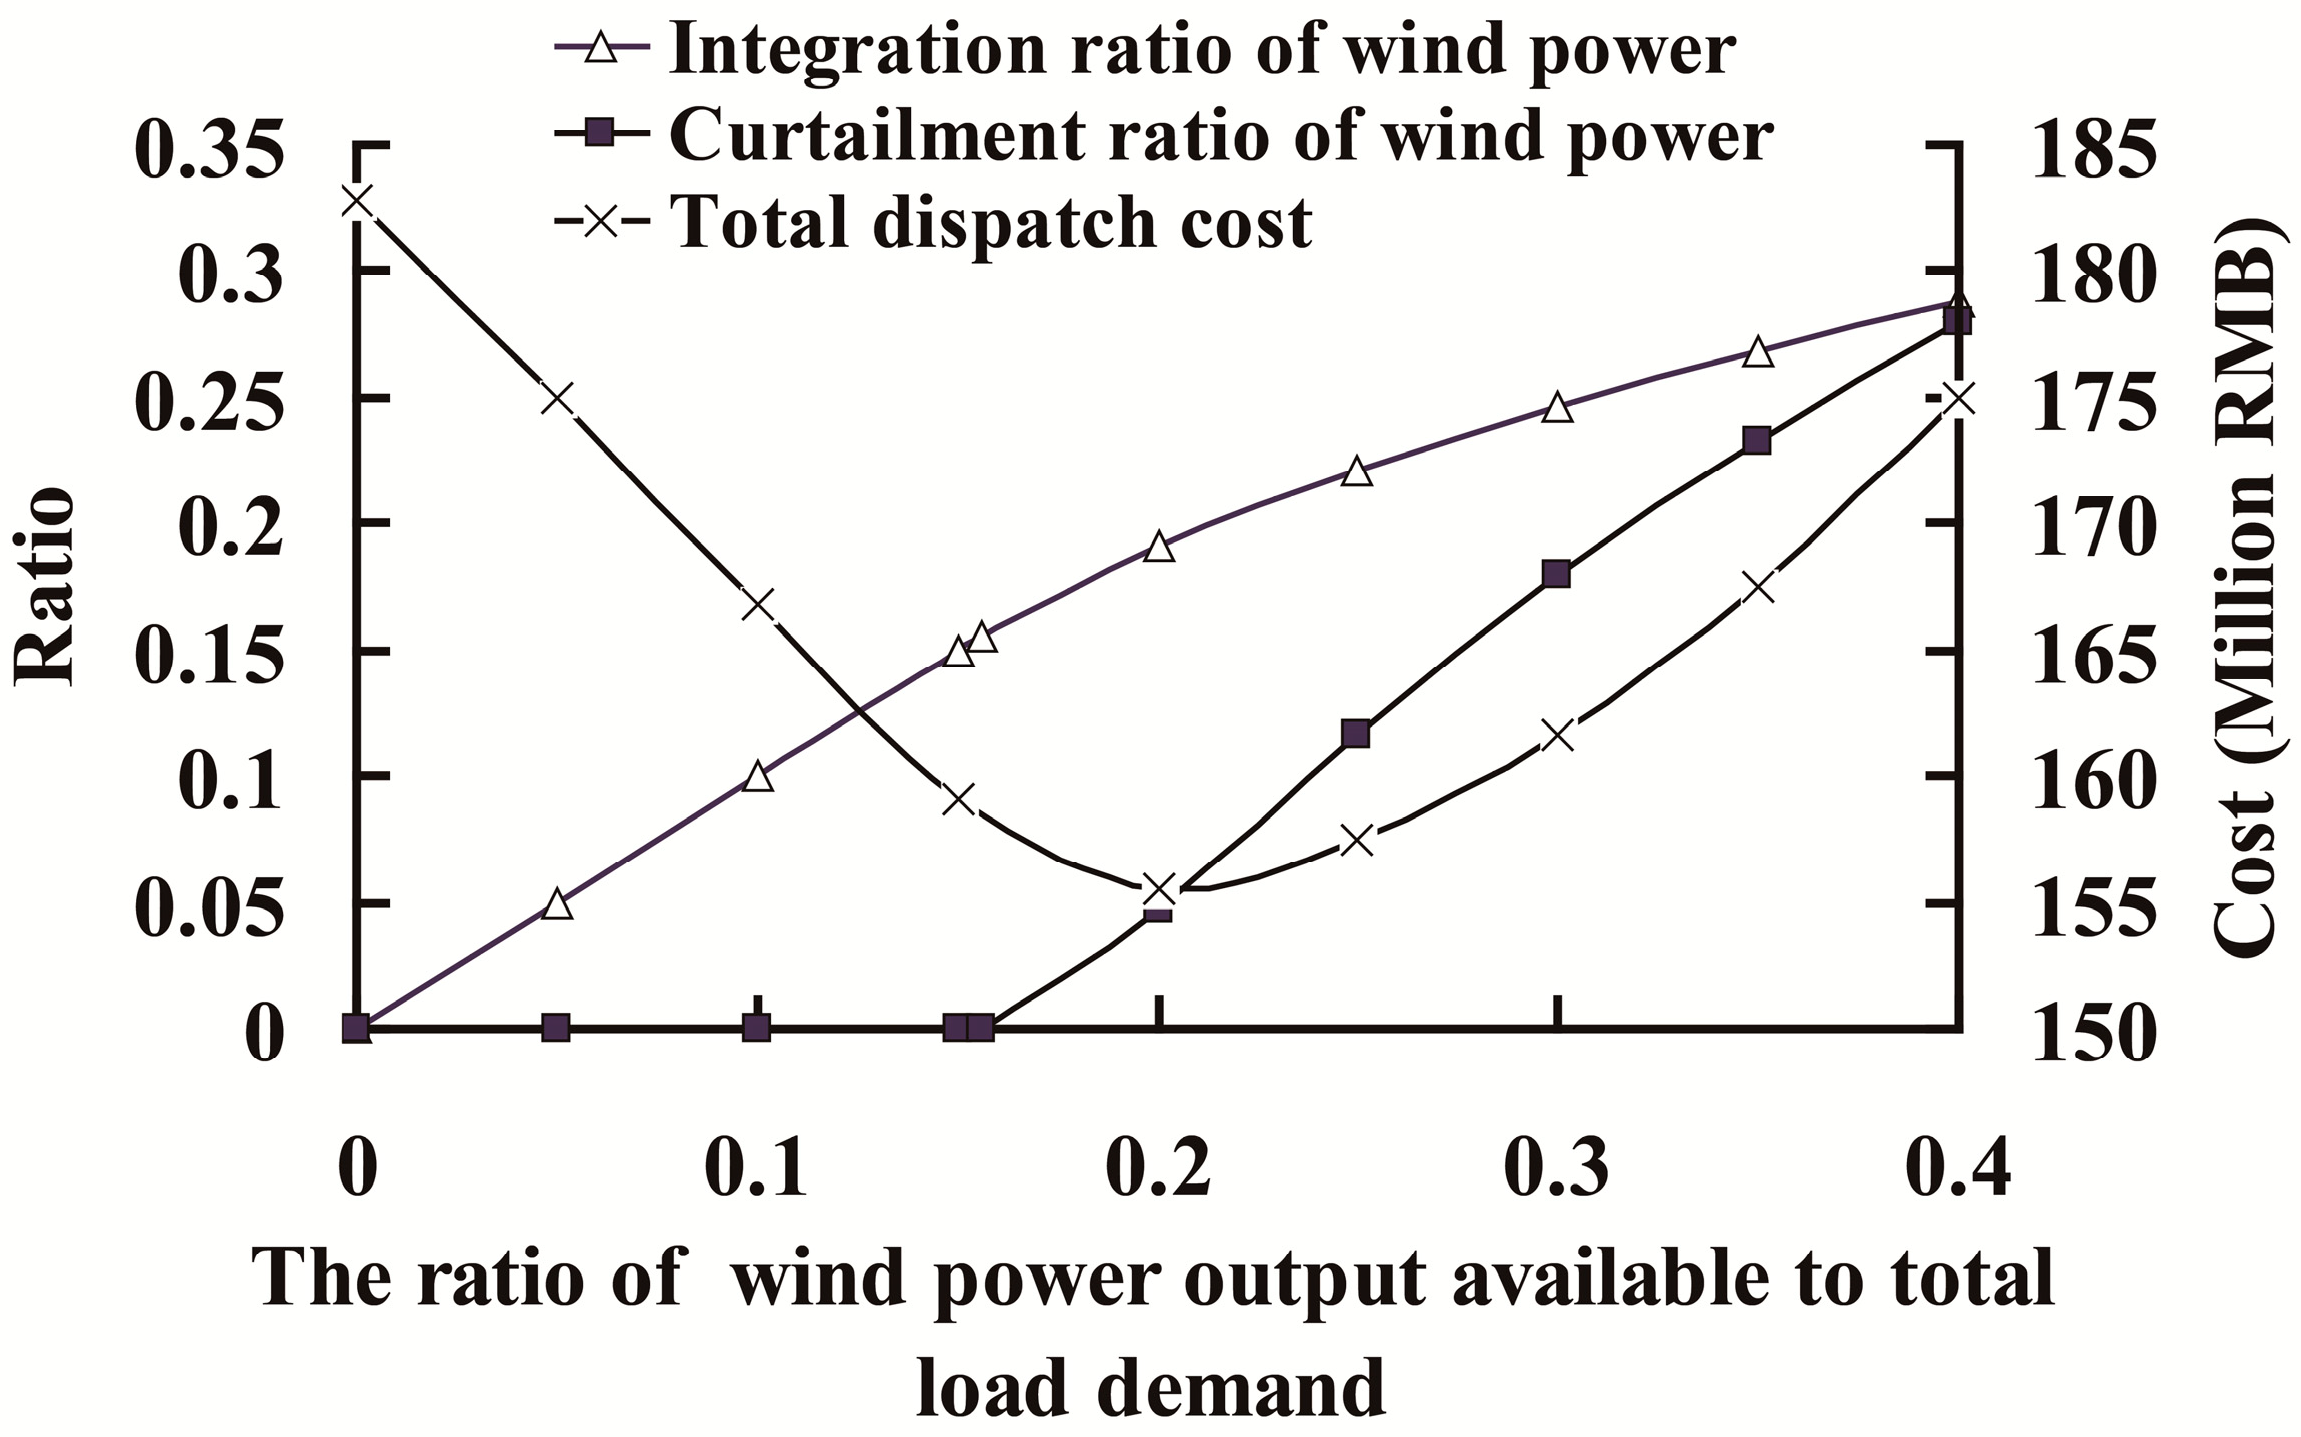
The integration of wind power and its curtailment are shown in Figure 8. When the ratio of wind power output available (wind power output available is the total output of wind power which can be dispatched) to the total power demand is low, all wind power can be fully integrated by the power system, for the coal fired units can be regulated down to provide the flexibility requirements for its integration.
As the ratio of wind power output available to the total power demand increases, the curtailment rate of wind power (the ratio of wind power curtailment in the total wind power output available) will occur. When the ratio reaches 0.1558, the curtailment begins. Because the total power load demand during the period of 3:00 am, 4:00 am, 5:00 am is low and the wind power output available is relatively high, the coal fired units may have to provide the peak regulation or flexibility services to balance the wind power integration. In order to minimize the dispatch cost of the power system, the curtailment may take place under the operation constraints of the power system. The integration ratio of wind power (the ratio of wind power integrated in the total generation output or in the total power demand) will reach its maximum until no more wind power can be integrated. With the increasing share of wind power, the power outputs of some thermal power units reach their minimal output constraints, and the startup number of these units also increases.
As the wind power is integrated, the dispatch cost first decreases and then increases. Before the wind power is fully integrated by the power system, the benefits from the reducing coal consumption and CO2 emissions can lower the dispatch cost. As the wind power curtailment increases, the penalty of curtailment cost will exist besides these benefits, they have a combined effect on the dispatch cost until it reaches its minimum. The curtailment penalty will gradually outweigh the integration benefits with further augment of wind power curtailment, resulting in increasing the dispatch cost.
3.3.2. Flexibility Impacts on the Operations of Coal Fired Units
When there is no wind power integration, only the coal-fired units are involved in optimizing of unit commitment. In order to minimize the dispatching cost, the average load rates of the units will be changed by redistributing their power outputs, so that some of the units may reach their minimal power output constraints and be shutdown provisionally, and the average load rates of the units with high energy efficiency will be improved. Figure 9 shows the total average load rates of coal fired units with the integration of wind power. As the integration ratio of wind power increases, the average load rates of the units decrease except for CHP units, because they are regulated down to deliver the flexibility. The units with the capacity of above1000 MW maintain high load rates, and their average load rate decreases slightly with the growing share of wind power. The average load rates of the units with the capacities of 600–1000 MW and 300–600 MW vary greatly, for they account for a high share among the coal fired unit fleet and the wind power integration heavily relies on their flexibility services. The units with the capacities of 200–300 MW and 100–200 MW account for a low share in the unit fleet and are mainly CHP units with limited down-regulated capacity during the heating season, so that they play a smaller role in the wind power integration and their average load rates almost keep constant.
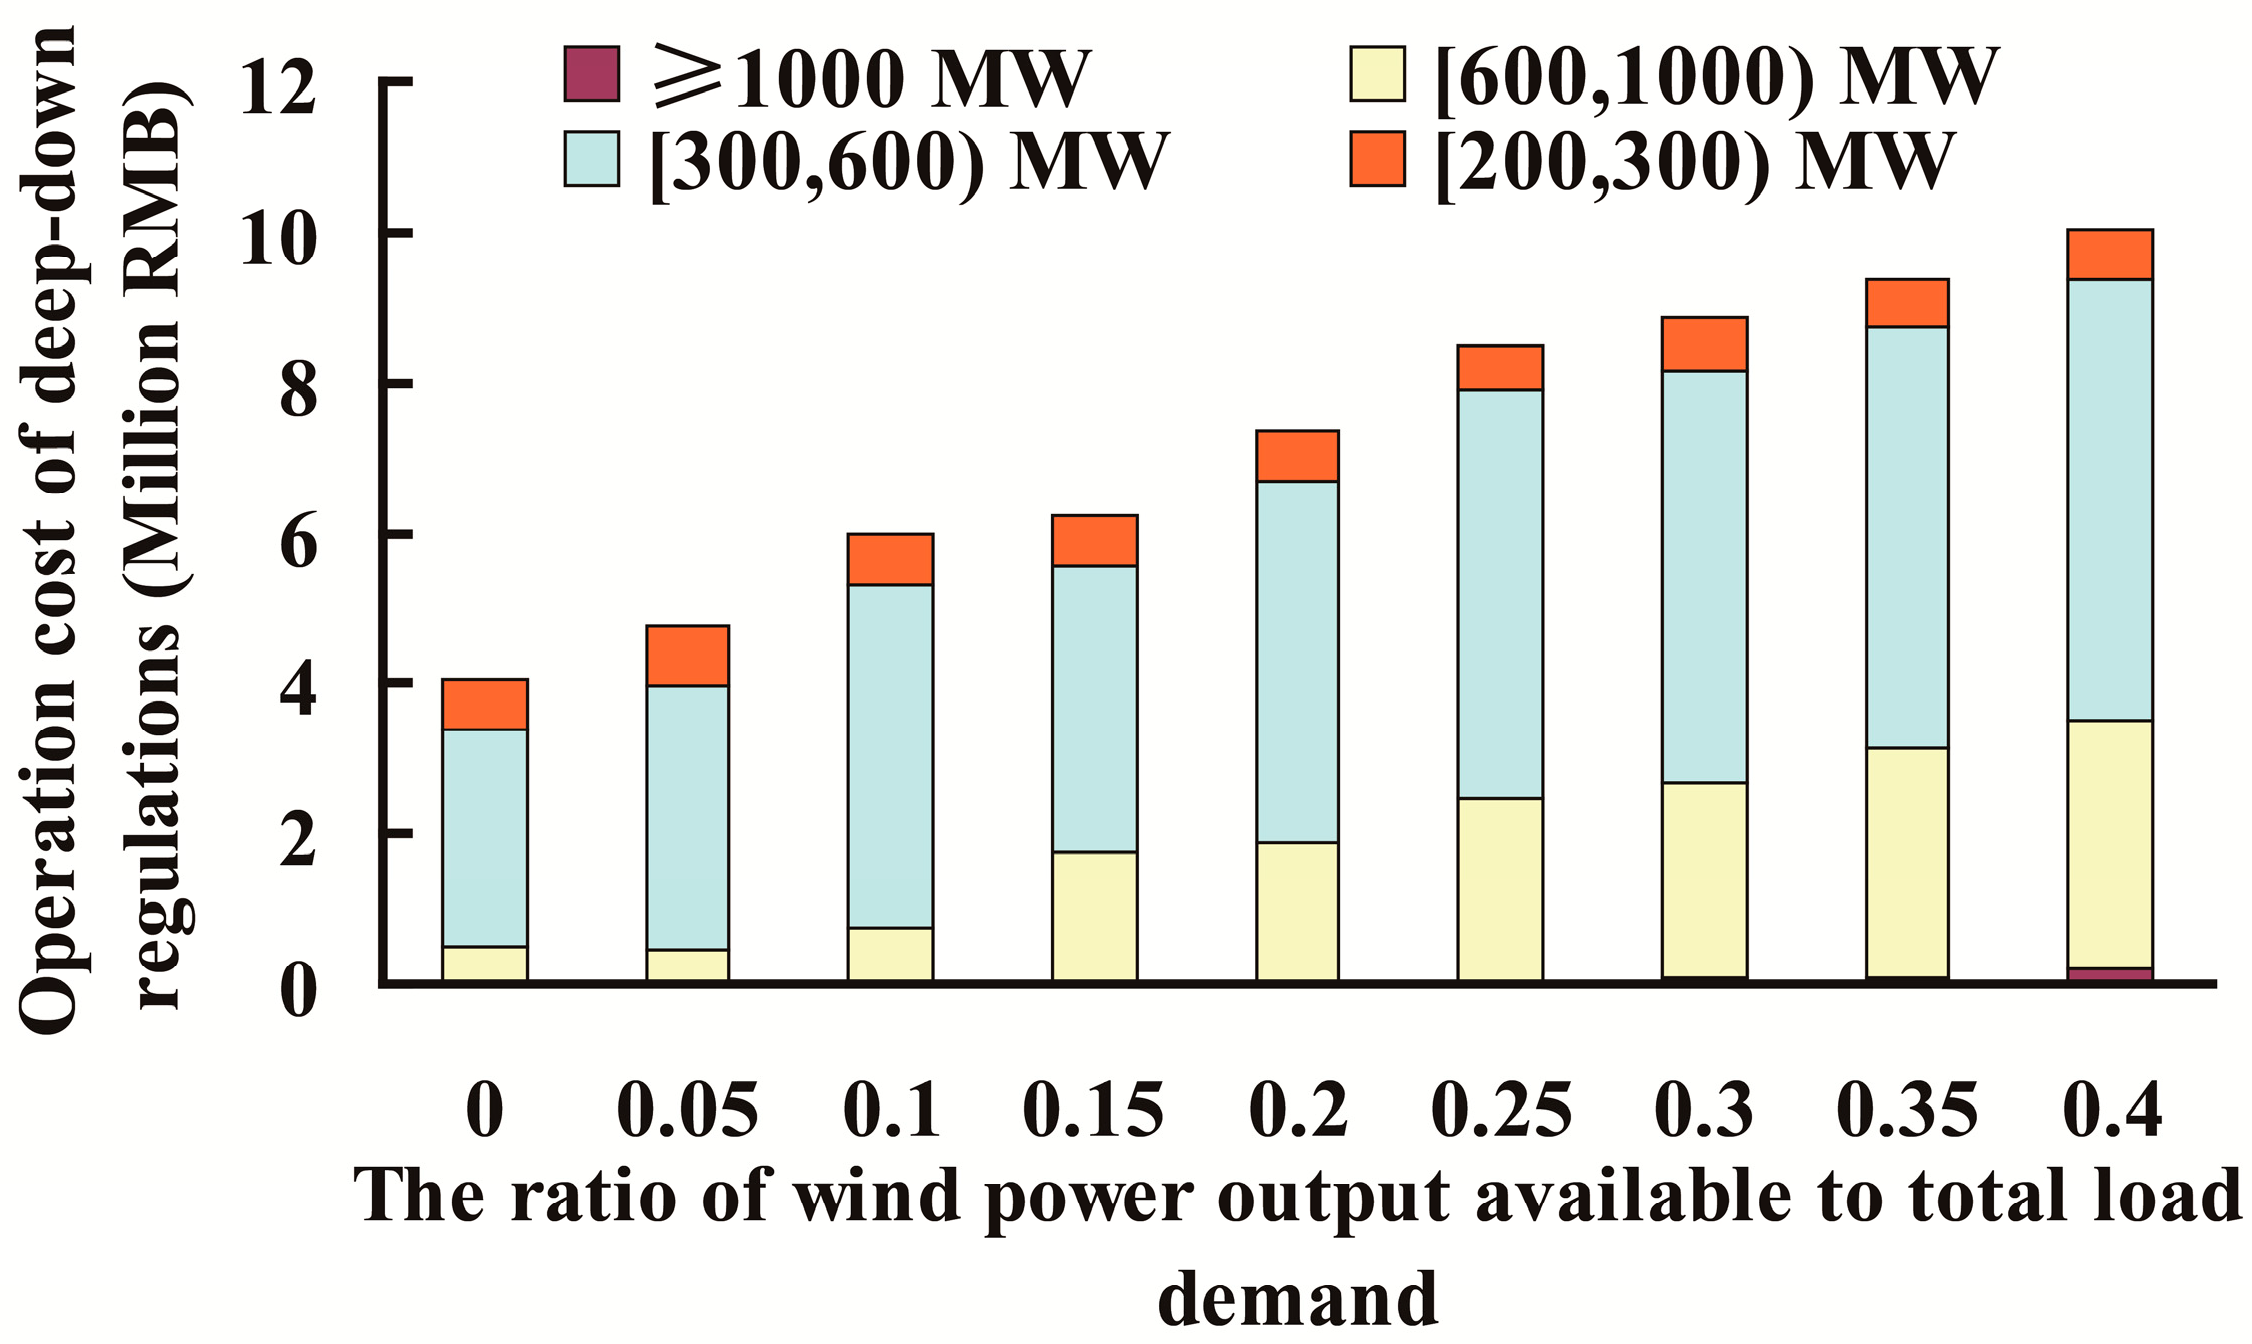
The number of the startups of coal fired units and the number of the deep-down regulations of these units (the deep-down regulation of a unit means that its load rate is regulated down below 0.5) are respectively shown in Figure 10 and Figure 11. The total number of the startups of the units fluctuates above their startup frequency with no wind power integration. The total number of deep-down regulated units increases with the growing shares of wind power. Figure 12 and Figure 13 respectively show the start-up costs and operation costs of deep-down regulated units with the integration of wind power. In order to minimize the total dispatch cost of the power system, the unit commitment is optimized based on their energy consumption costs and the benefits of wind power integration.
The units with the capacity of 600–1000 MW are the backbone of peak regulation or flexibility services during the heating season, and in the meantime, the units with the capacity of 300–600 MW also play an important role. However, the startup frequency of the former units is the highest and the frequency of deep-down regulations of the latter units is also the highest among these total units. Correspondingly, the startup costs of the units with the capacities of 600–1000 MW and above 1000 MW are the main part of total startup cost. The operation costs of the deep-down regulated units with the capacities of 600–1000 MW and 300–600 MW are the dominating part of the total deep-down regulation cost.
3.3.3. The Net Benefit of the Power System and the Impacts of Penalty Rate
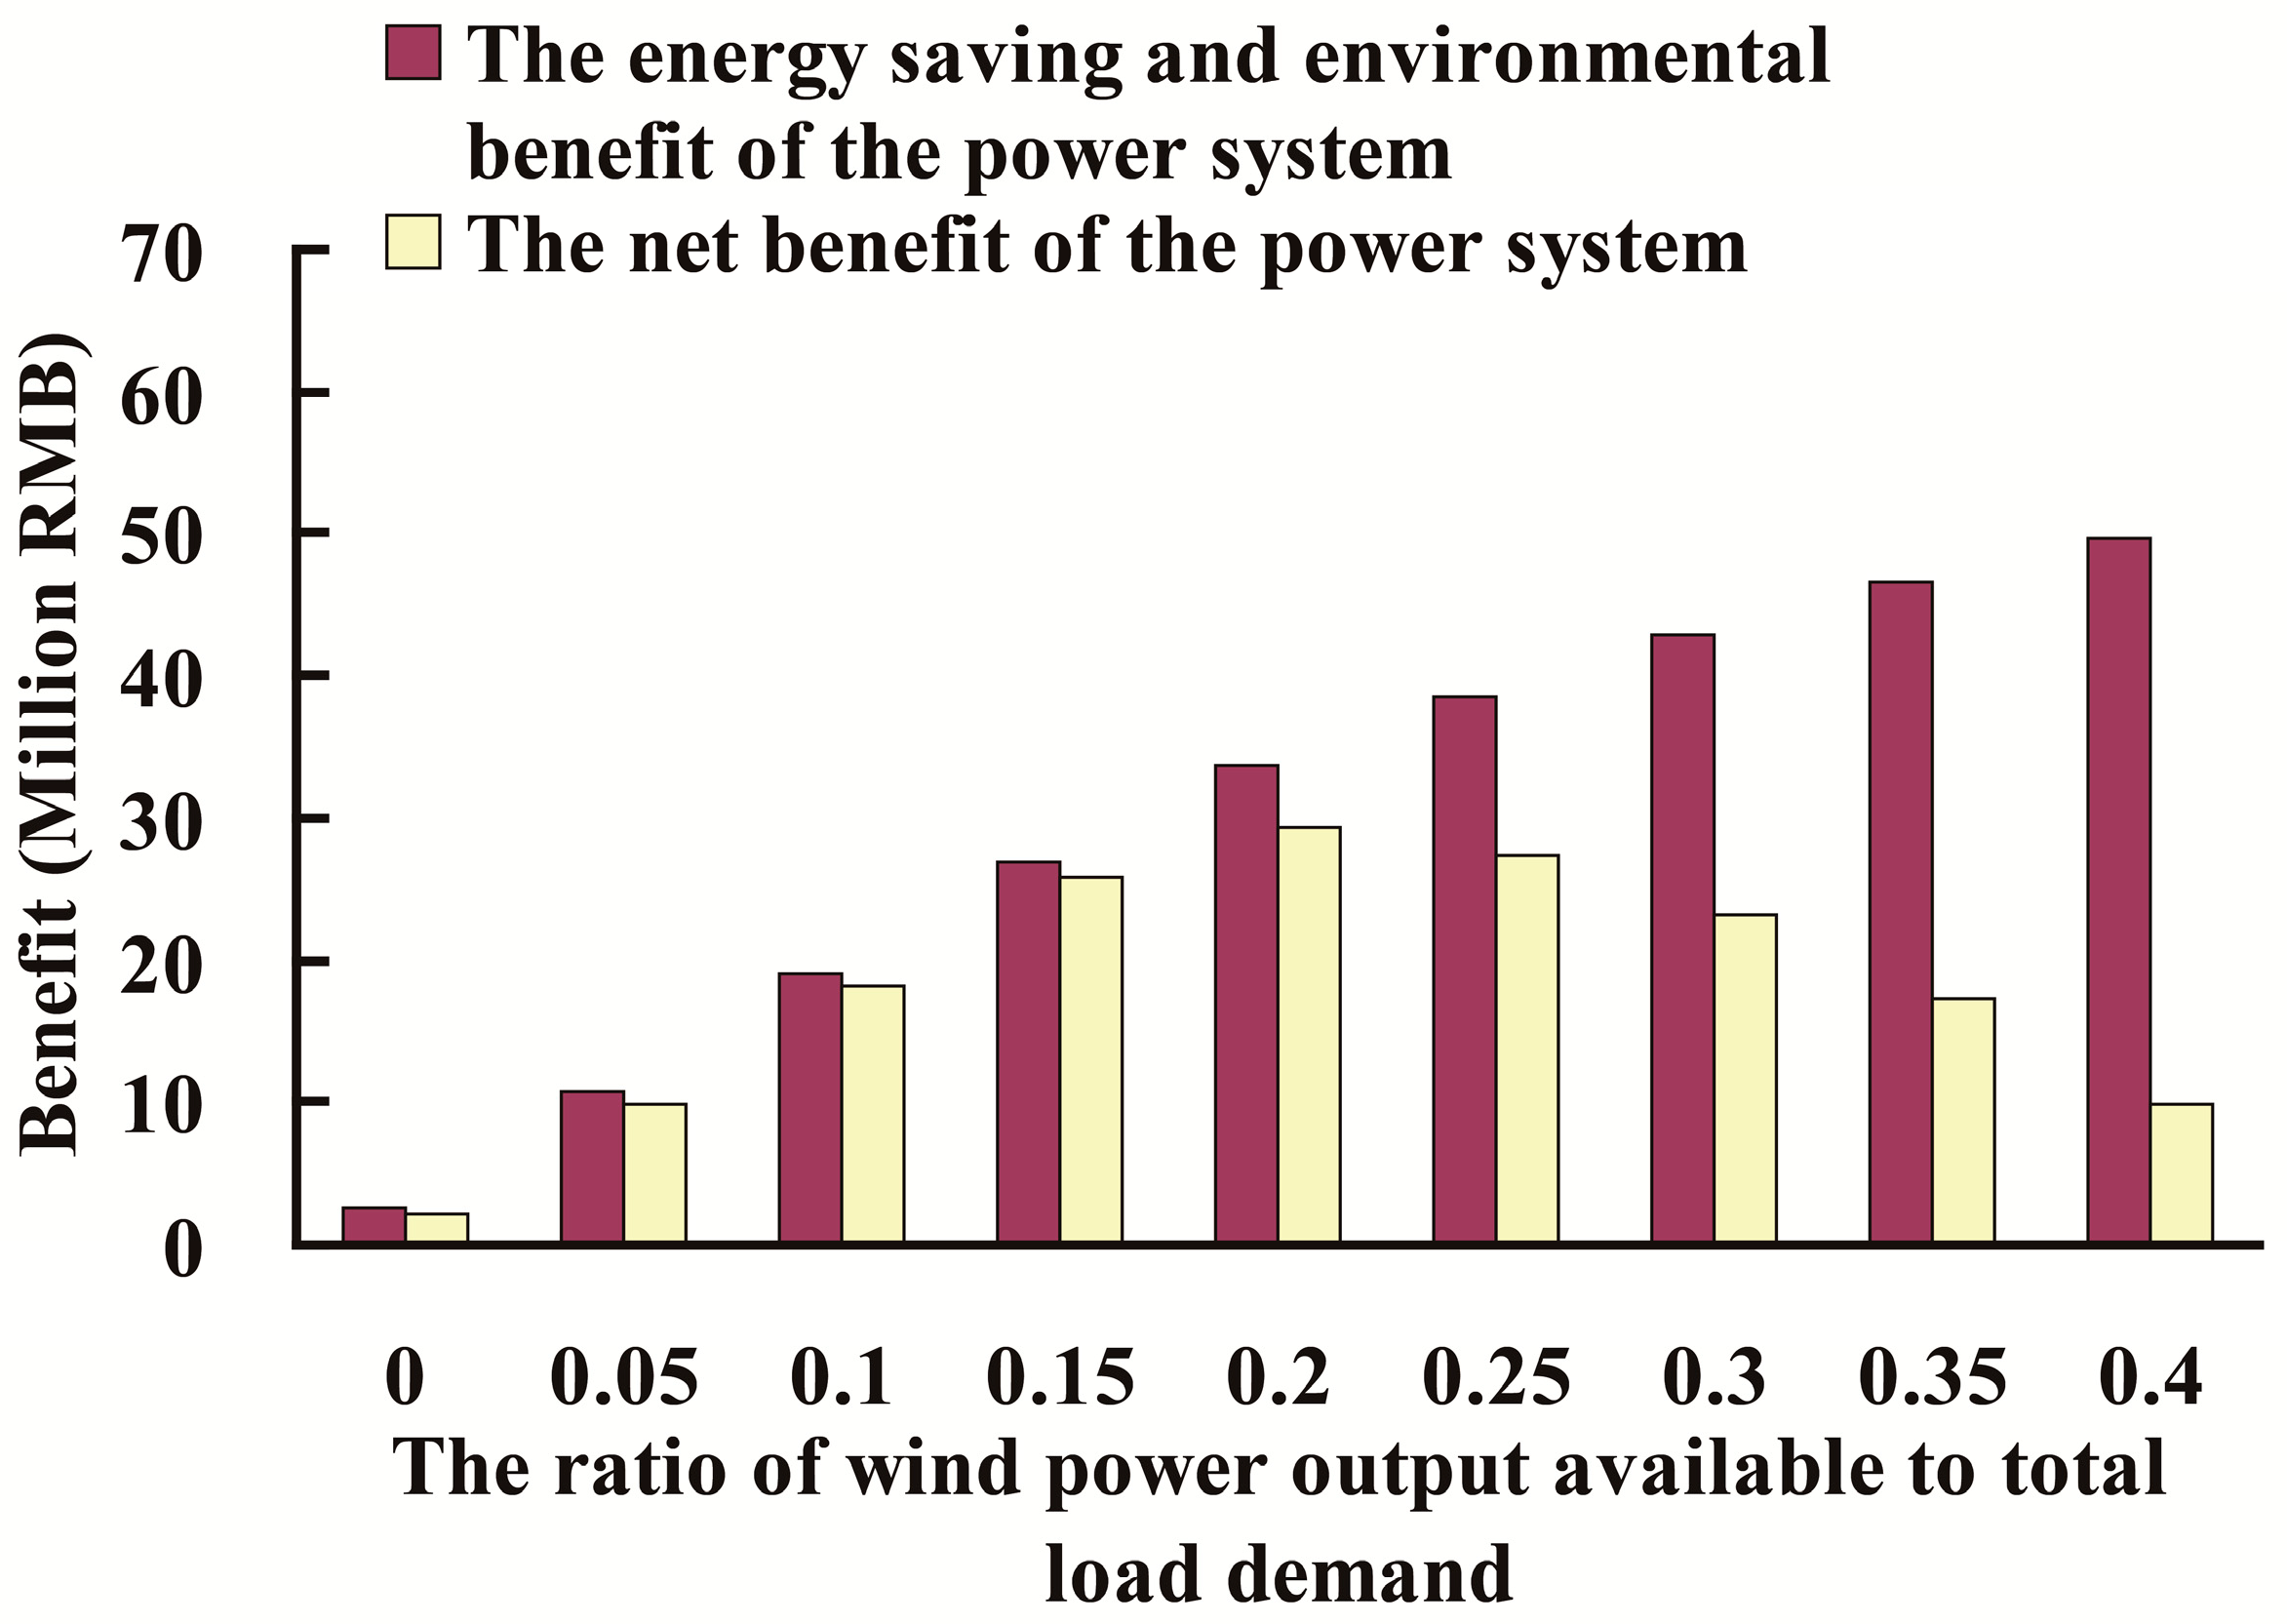
The benefit of energy saving and CO2 emission reductions can be achieved from the wind power integration and the optimal operation of the power system. The net benefit of the power system which can be defined as the system value of the wind power integration, is from the difference between the baseline dispatch cost and the optimized dispatch cost. Figure 14 shows the total dispatch cost of the power system, including the overall startup cost of units, the overall operation costs of the deep-down regulated units, and the overall regular operation costs of other coal fired units. The overall start-up cost is the smallest in size. The overall operation cost of the deep-down regulated units is the relatively smaller, but slightly larger than the overall startup cost. Figure 15 shows the correlation between the net benefit of the power system and the energy saving and environmental benefit. The net benefit is almost slightly less than the benefit of energy saving and CO2 emission reductions before the wind power is curtailed, because the startup cost of a coal fired unit includes the cost of startup fuel and other relative fees. The benefit of energy saving and CO2 emission reductions still increases with the integration of wind power, and it can reach its maximum until no more wind power is integrated. The net benefit decreases due to the increasing cost of the wind power curtailment.
Figure 16 shows the impact of the penalty rate on the net benefit. Before the wind power is fully integrated, the penalty cost of the wind power curtailment has an effect on the net benefit. When the curtailment of wind power begins, the net benefit is influenced by the penalty rate, and the net benefit decreases with the growing penalty rate. When the penalty rate is 0, the net benefit of the power system increases with the growing integration of wind power. But as the integration increases, the growth of the net benefit slows down gradually because of the curtailment of wind power, and it can reach its maximum until no wind power is integrated under the operation constrains of the power system. When the penalty rate is not 0, the maximum net benefit occurs in the area with the curtailment of wind power, which means that a certain amount of wind power curtailment is reasonable to minimize the dispatch cost of the power system.
The power system may technically reach the integration limit of wind power because of its operation constrains and the flexibility of coal fired units. When no more wind power can be integrated beyond the integration limit of the power system, a penalty rate only increases the dispatch cost. But within the integration limit, the cost of wind power curtailment based on the penalty rate can be taken as a part of the dispatch cost to optimize the operation of the power system.
3.3.4. Sensitivity Analysis
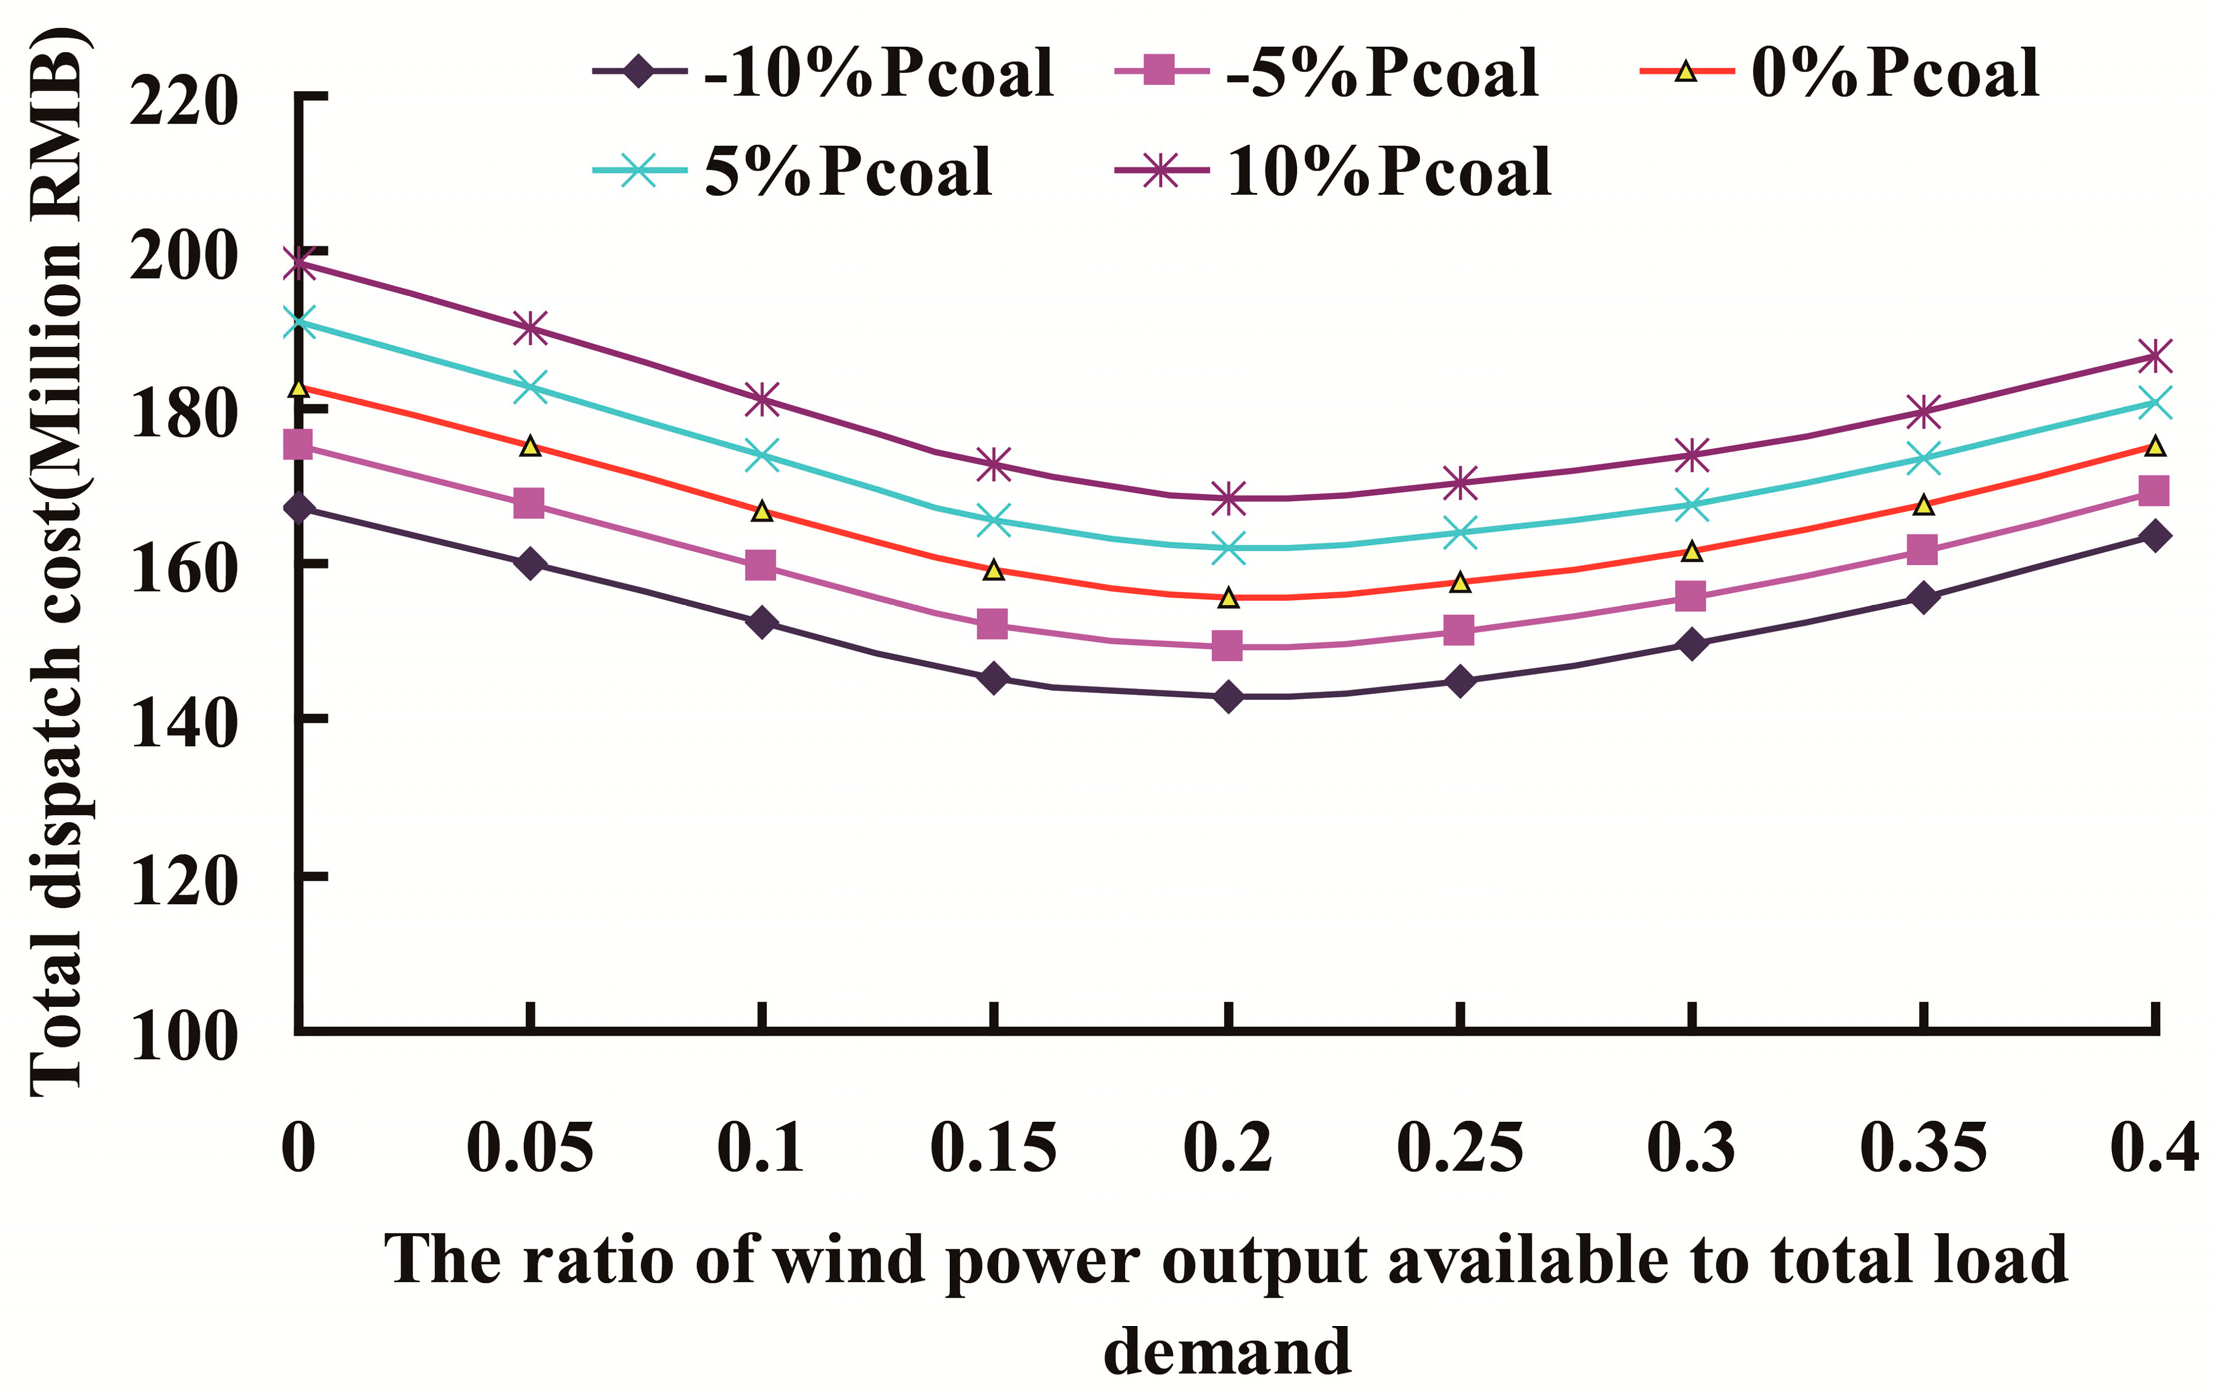
The coal price and CO2 price are the important factors which can have an effect on the operation benefit of the power system. Their changes may lead to some uncertainties. These two prices can affect the operation cost of units in the power system, resulting in the changes of total dispatch cost and the net benefit of wind power integration (i.e., the system value), and the sensitivity analyses of them should be included [43,44]. The changes of dispatch costs of the power system and the system value of wind power integration by the coal price, along with the ratio of wind power output available to total load demand are respectively shown in Figure A1 and Figure A2 in the Appendix A, and the dispatch costs and system value by CO2 price are respectively shown in Figure A3 and Figure A4 in the Appendix A. Taking the ratio of 0.2 as an analysis example, the changes of these costs by coal price and CO2 price are respectively listed in Table 3 and Table 4. The analyses indicate that total dispatch cost, the net benefit of wind power integration are more sensitive to the change of coal price, and less than the CO2 emissions price, and the net benefit is more sensitive than the total dispatch cost.
3.3.5. Further Analyses and Discussions
According to the above results, some further analyses are supplemented:
First, because of the simplicity of analysis, the case study only focused on the integration of wind power and the flexibility of coal fired units during the heating season. The wind power can be completely integrated on the basis of the optimal operation of the power system until the ratio of wind power integration to the total power demand is 0.1558, and the curtailment begins. However, during the non-heating season, the ratio can reach 0.41 with all coal fired units delivering the flexibility services. In the baseline scenario, the curtailment begins when the ratio of wind power integration to the total power demand is less than 0.05 under the fair dispatch rules.
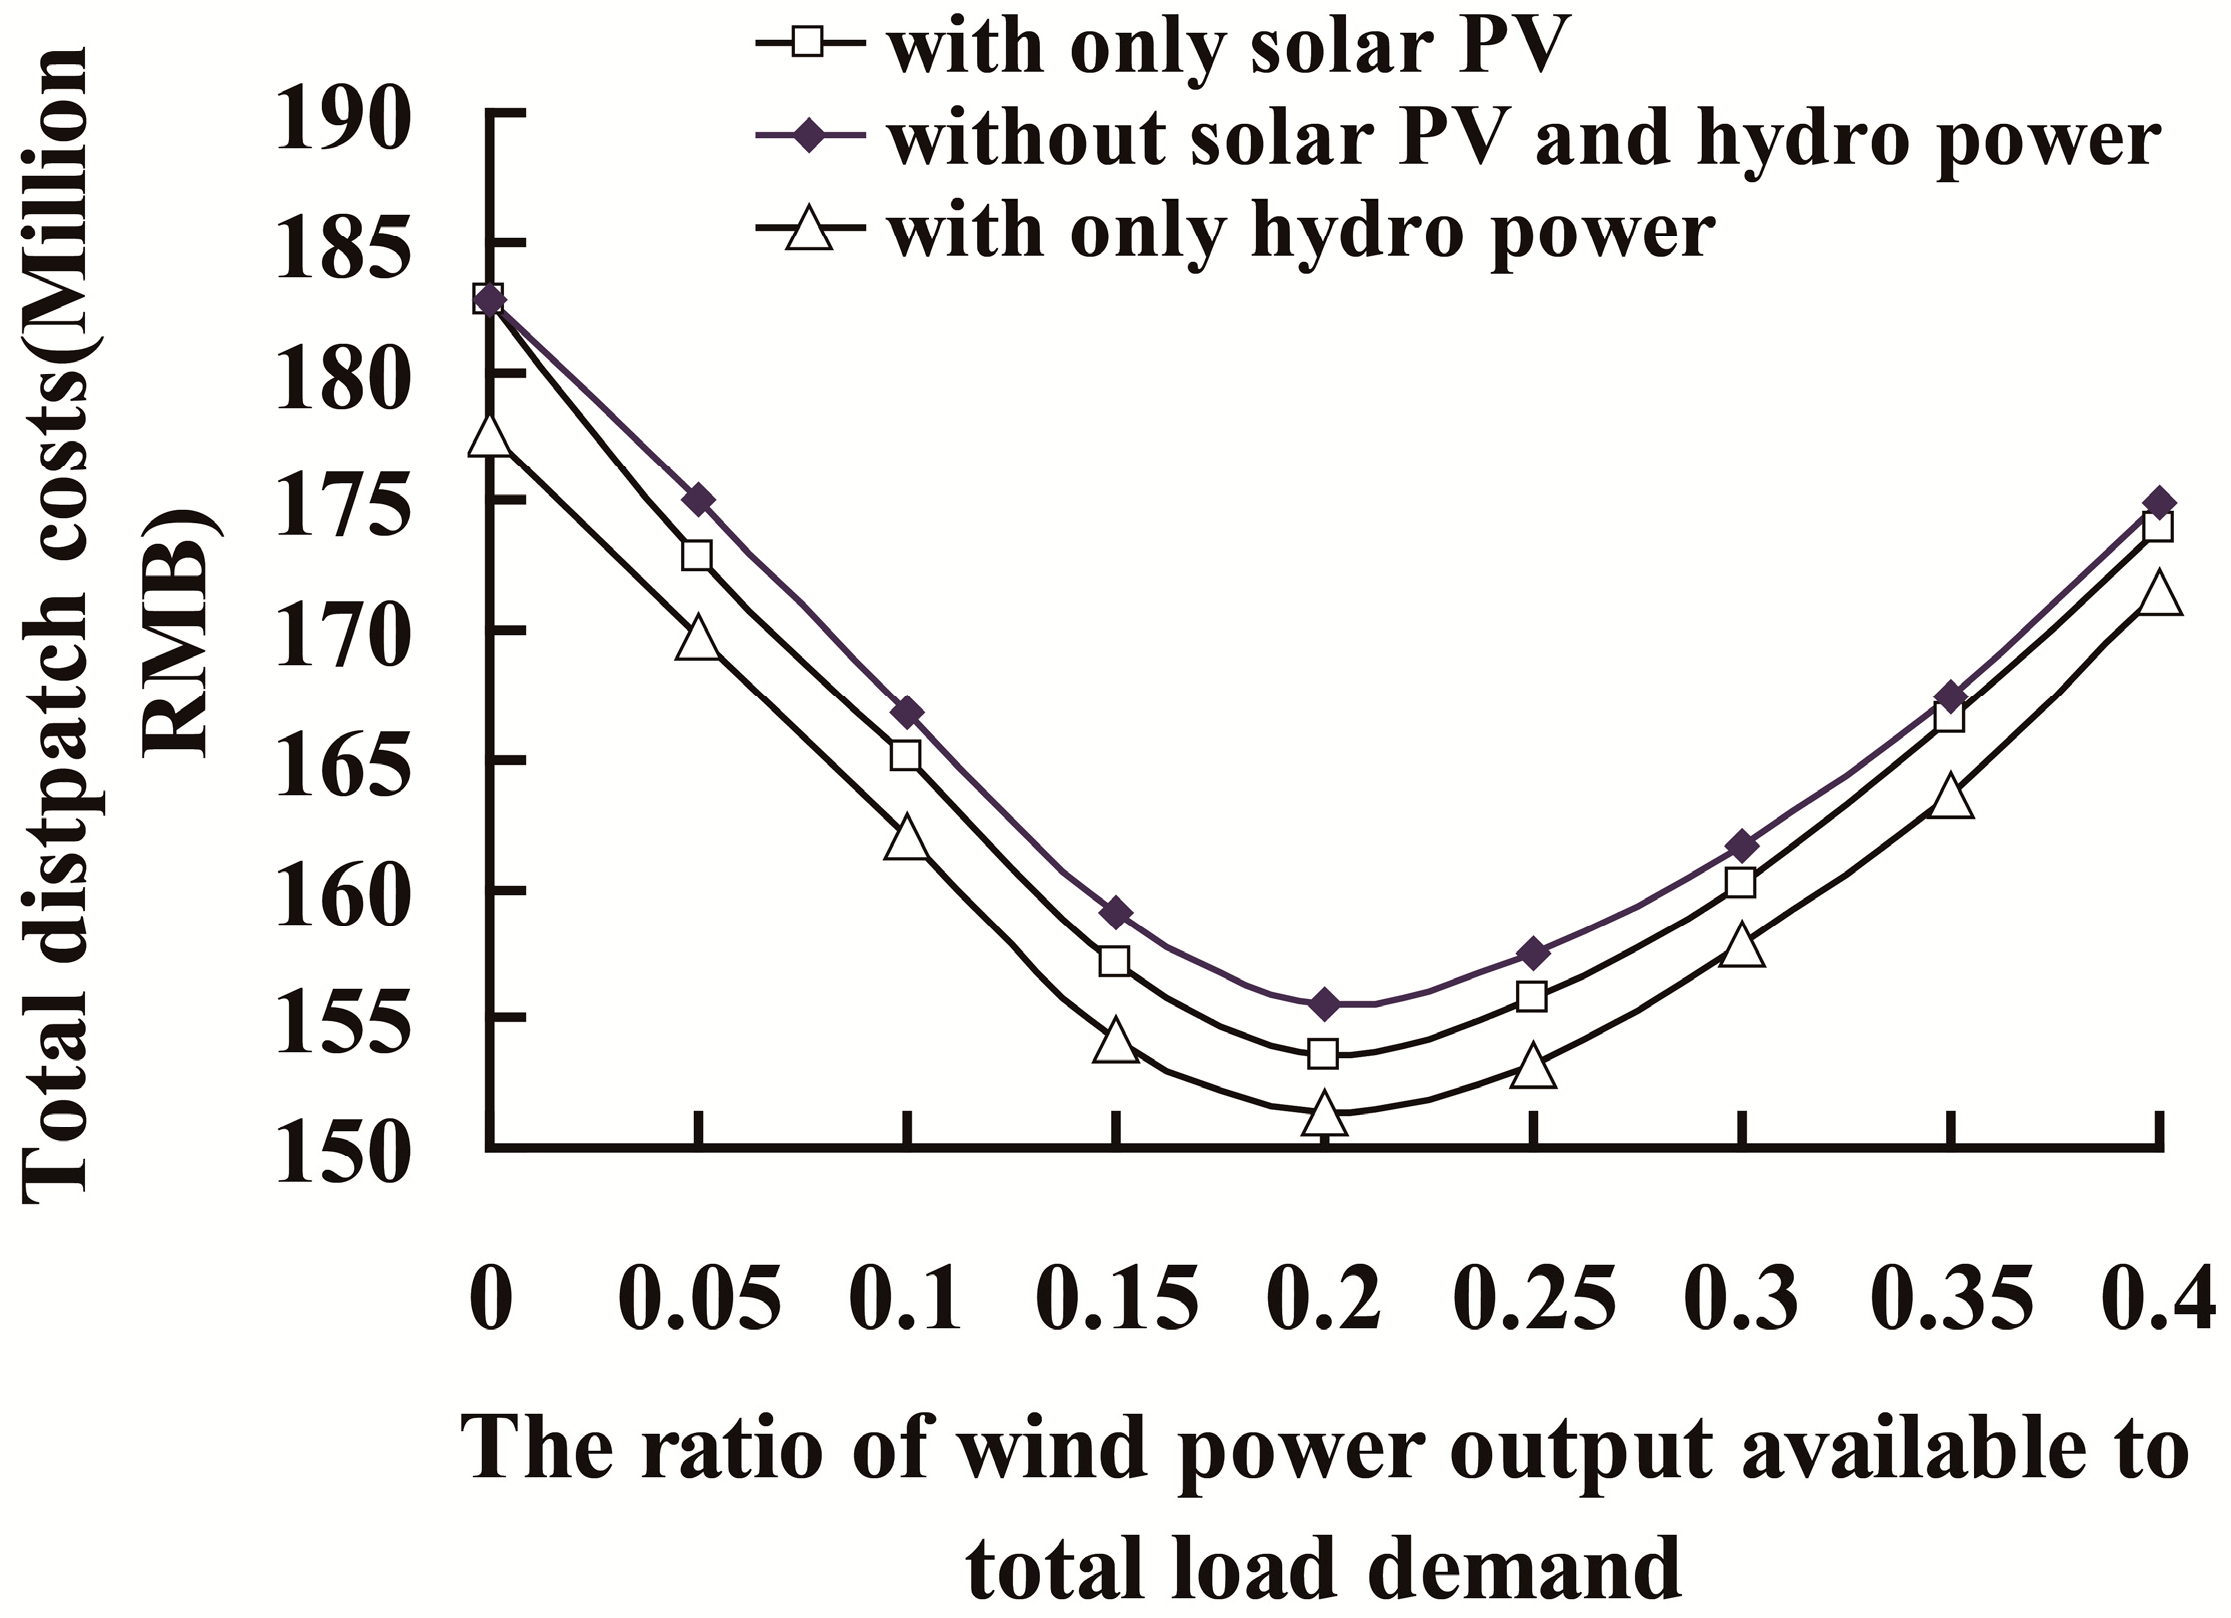
Second, the growing share of solar PV can have an overlapping effect with the wind power integration on the flexibility requirements. However, additional flexible power units (such as pumped storages, and peaking gas turbines, etc.), will countervail the flexibility requirements on the coal fired units. Taking the hydro power capacity of 1600MW and solar PV capacity of 3210MW as an example, the details of their effects are shown in Figure A6, Figure A7 and Figure A8 in the Appendix B.
Third, only the reduction benefit of CO2 is considered for the integration of wind power. If other pollutants (such as NOx, SO2, etc.) are fully taken into account, the system value of wind power integration may be much higher.
3.3.6. Limitation Assessment of This Study
A few of limitations exist in this paper from the research assumptions and methodology to simplify the operation of the power system and analyze the dispatch cost and the flexibility of coal fired units.
In the methodology analysis, only coal fired units and renewable power generation plants are selected as the optimal candidates in the power system. In the case study, the variations on the power demand side are not reflected in the system load curve, and the transmission and distribution loss in the power system is also not taken into account. But these are not the case in the real power system. In despite of these limitations, this study highlights the principles about the integration of wind power and the flexibility of coal fired units. The validity of this study might be weakened by these limitations, so that the findings in the study should be carefully summarized.
4. Conclusions and Policy Recommendations
4.1. Conclusions
The integration of wind power is related to their capacities and productions, the power system into which wind power is fed, and the flexibility sources in the power system. This study shows that the flexibility of the power system and reasonable dispatch mode can play an important role in the integration of wind power according to the baseline assumptions, and there is much potential for increasing the share of wind power and improving the energy efficiency of the power system. Increasing the flexibility of the power system may be critical for it to integrate more wind power effectively, especially for the power system with the high share of coal fired units.
This study also shows that the flexibility requirements posed by the wind power integration result in increasing the intraday startup number of coal fired units and their deep-down regulated frequency, and, meanwhile, the load rates of coal fired units, especially the units with high energy efficiency, are also improved. Although the overall flexibility cost is a comparatively smaller part in the total dispatch cost and the overall startup cost is the smallest, the coal fired units delivering the flexibility are financially influenced due to their production of less electricity and the reduction of their thermal efficiencies. The small ratio of the overall flexibility cost to the total dispatch cost means that the flexibility of the units has no important affects on the optimal operation of the power system to an extent, and also that increasing the flexibility of coal fired units may be the best choice to integrate more wind power. This study also indicates that a certain amount of wind power curtailment may be reasonable. Reasonable penalty rate and fees for the curtailment of wind power may help to optimize the operation of the power system and integrate more wind power.
4.2. Policy and Strategy Recommendations
In accordance with the above conclusions and in order to increase the share of wind power and improve the energy efficiency of the power system in China, policy and strategy recommendations are as follows:
4.2.1. To Scale up the Flexibility of Coal Fired Units
In order to meet China’s non-fossil target for 2030 by the Paris Agreement, more wind power integration is expected to increase in the next decade or so, and this will pose more peak regulation or flexibility requirements on the power system. However, there are not enough flexible power sources to balance the impacts of wind power integration on the operation of the power system in China. Given the cost and time to build the conventional flexible power units (such as pumped hydro stations, gas-fired units, etc.), the flexibility retrofitting of existing coal fired power plants may be a cost-effective [14] and a much faster strategy to scale up the flexible power sources. It’s worth noting that the flexibility retrofit goal of coal fired units with total capacity of 220 GW before 2020, including the CHP capacity of 133 GW [45], is set in the 13th Five-year Plan. These flexibility-retrofitted units will play an important role in integrating the wind power in the near term. With the growing share of wind power, more coal fired units may have to be retrofitted to delivering the flexibility services, and other flexible power units should also have to be planned and built. For the future higher penetration of wind power, the measures on the demand side and on the grid side should also be considered.
4.2.2. To Change the Operation Mode of Coal Fired Units and the Dispatch Mode of the Power System
More wind power integration will increase the number of the cycling or deep-down regulations of coal fired units. Some units may run during the day and stop at night. These units have the characteristic of two-shift operation mode in which they can be regulated almost from 0 to 100 percent of their rated capacities. Two-shift operation mode involves the startups and stops of the units, which are complicated, and the benefits of these units may be influenced heavily. The impact factors of two-shift operation mode are more than those of the low-load operation mode in which the units can be regulated down to their minimum loads. So the low-load operation mode is more often taken to meet the load demand variations of the power system. However, based on state-of-the-art coal fired units or plants, their startups can also be controlled safely to provide the flexibility services [13,17]. Thus, the operation mode of coal fired units should be changed to increase their flexibility for wind power integration on the basis of reasonable economic remuneration.
In China, most provinces have adopted the fair dispatch mode except for some provinces employing the energy saving dispatch. The current dispatch mode under the fair dispatch rules and the installed capacity, are contradictory to the integration of wind power because coal fired units are still allocated the generation hours and there are no further measures to promote the development of wind power [12]. The coal fired units delivering the flexibility may run at part load. The energy efficiency of the power system into which the power generation of these units is fed, can be further improved by increasing their load rates through redistributing their outputs among them under the operation constraints of the power system. This energy efficiency optimization may further increase the number of the cycling of coal fired units, and also further increase the ability to respond to the integration of wind power. So the dispatch mode should be modified to be in accordance with the operation mode change of coal fired units.
4.2.3. To Promote the Flexibility Services on the Basis of the System Value of Wind Power Integration
It is worth noting that although wind power is environment-friendly technology with no pollutant emissions, their integration still comes at a cost due to their flexibility demands under the operation constrains of the power system. The curtailment of wind power should be determined on the basis of the dispatch cost of the power system, the system value of wind power integration which can be defined as the net benefit from its integration. A small share of wind power curtailment may be reasonable, and the curtailment can be considered as a type of peak regulation services or flexibility services.
The system value of wind power integration relies on when and where it is integrated, and also on the cost of the flexibility services in the power system. Because of the constraints of the flexible power sources, there may be the limit of wind power integration in the power system. When an abundance of flexible power sources coincide with the high flexibility demand of wind power integration, the system value of wind power integration is high. When limited flexible power sources are available, more wind power integration may be at a higher cost, and the system value is low. The curtailment penalty cost can be taken as a strategy to guarantee the priority dispatch of wind power, and can also affect the system value of wind power integration in the power system. How to properly set the curtailment penalty rate and how to use these penalty fees should be considered deliberately because market-oriented regulation or taking these fees as part of government revenues may have different incentives [46] to integrate wind power.
4.2.4. To Improve the Compensation Mechanism of the Flexibility Services
The ancillary services of peak regulation are essential to the operation of the power system, and the units involved in the peak regulation should be treated fairly and reasonably. The flexibility services can be regarded as the ancillary services of peak regulation, but they are different from the conventional peak regulation in the power system with no high share of wind power. Each unit should bear its corresponding responsibilities and obligations, and be encouraged to actively participate in the ancillary services of peak regulation, especially the flexibility services for wind power integration.
Coal fired units are the workhorse of the flexible power sources in China, especially in three northern regions of China. In order to promote the power units to deliver the flexibility services for the wind power integration, an incentive policy was issued by the government in 2016 to award the priority generation for these units in accordance with the principle of "who benefits, who bears" [47]. However, further incentives are still needed to promote coal fired units to provide the flexibility services for wind power integration. The compensation for the flexibility of coal fired units should be designed on their ability to respond to the load variations, their contribution to balance these variations, the system value of wind power integration and the fluctuations of coal price and CO2 price. And the compensation mechanism may also be carried out based on market arrangements with the existing ancillary service compensation mechanisms, to improve the initiatives of the coal fired power units to provide the flexibility services for the integration of wind power.
Author Contributions
J.Z. and B.S. conceived the theory and built the mode, J.Z. performed the experiments and analyzed the data, wrote the paper.
Funding
This research was funded by Energy Foundation, grant number G-1509-23762.
Conflicts of Interest
The authors declare no conflict of interest.
Appendix A

Table A1.
Dispatch costs on a typical day in the baseline scenario.
| Time | Dispatch Cost/Million RMB | Time | Dispatch Cost/Million RMB |
|---|---|---|---|
| 0:00 | 6.933 | 12:00 | 7.705 |
| 1:00 | 6.755 | 13:00 | 7.765 |
| 2:00 | 6.663 | 14:00 | 7.772 |
| 3:00 | 6.593 | 15:00 | 7.846 |
| 4:00 | 6.609 | 16:00 | 8.372 |
| 5:00 | 6.788 | 17:00 | 8.854 |
| 6:00 | 7.168 | 18:00 | 8.743 |
| 7:00 | 7.343 | 19:00 | 8.525 |
| 8:00 | 7.934 | 20:00 | 8.298 |
| 9:00 | 8.294 | 21:00 | 8.179 |
| 10:00 | 8.405 | 22:00 | 7.707 |
| 11:00 | 8.265 | 23:00 | 7.339 |
Figure A1.
Sensitivity of total dispatch cost by coal price.

Figure A2.
Sensitivity of the net benefit of wind power integration by coal price.

Figure A3.
Sensitivity of total dispatch cost by CO2 price.

Figure A4.
Sensitivity of the net benefit of wind power integration by CO2 price.

Appendix B
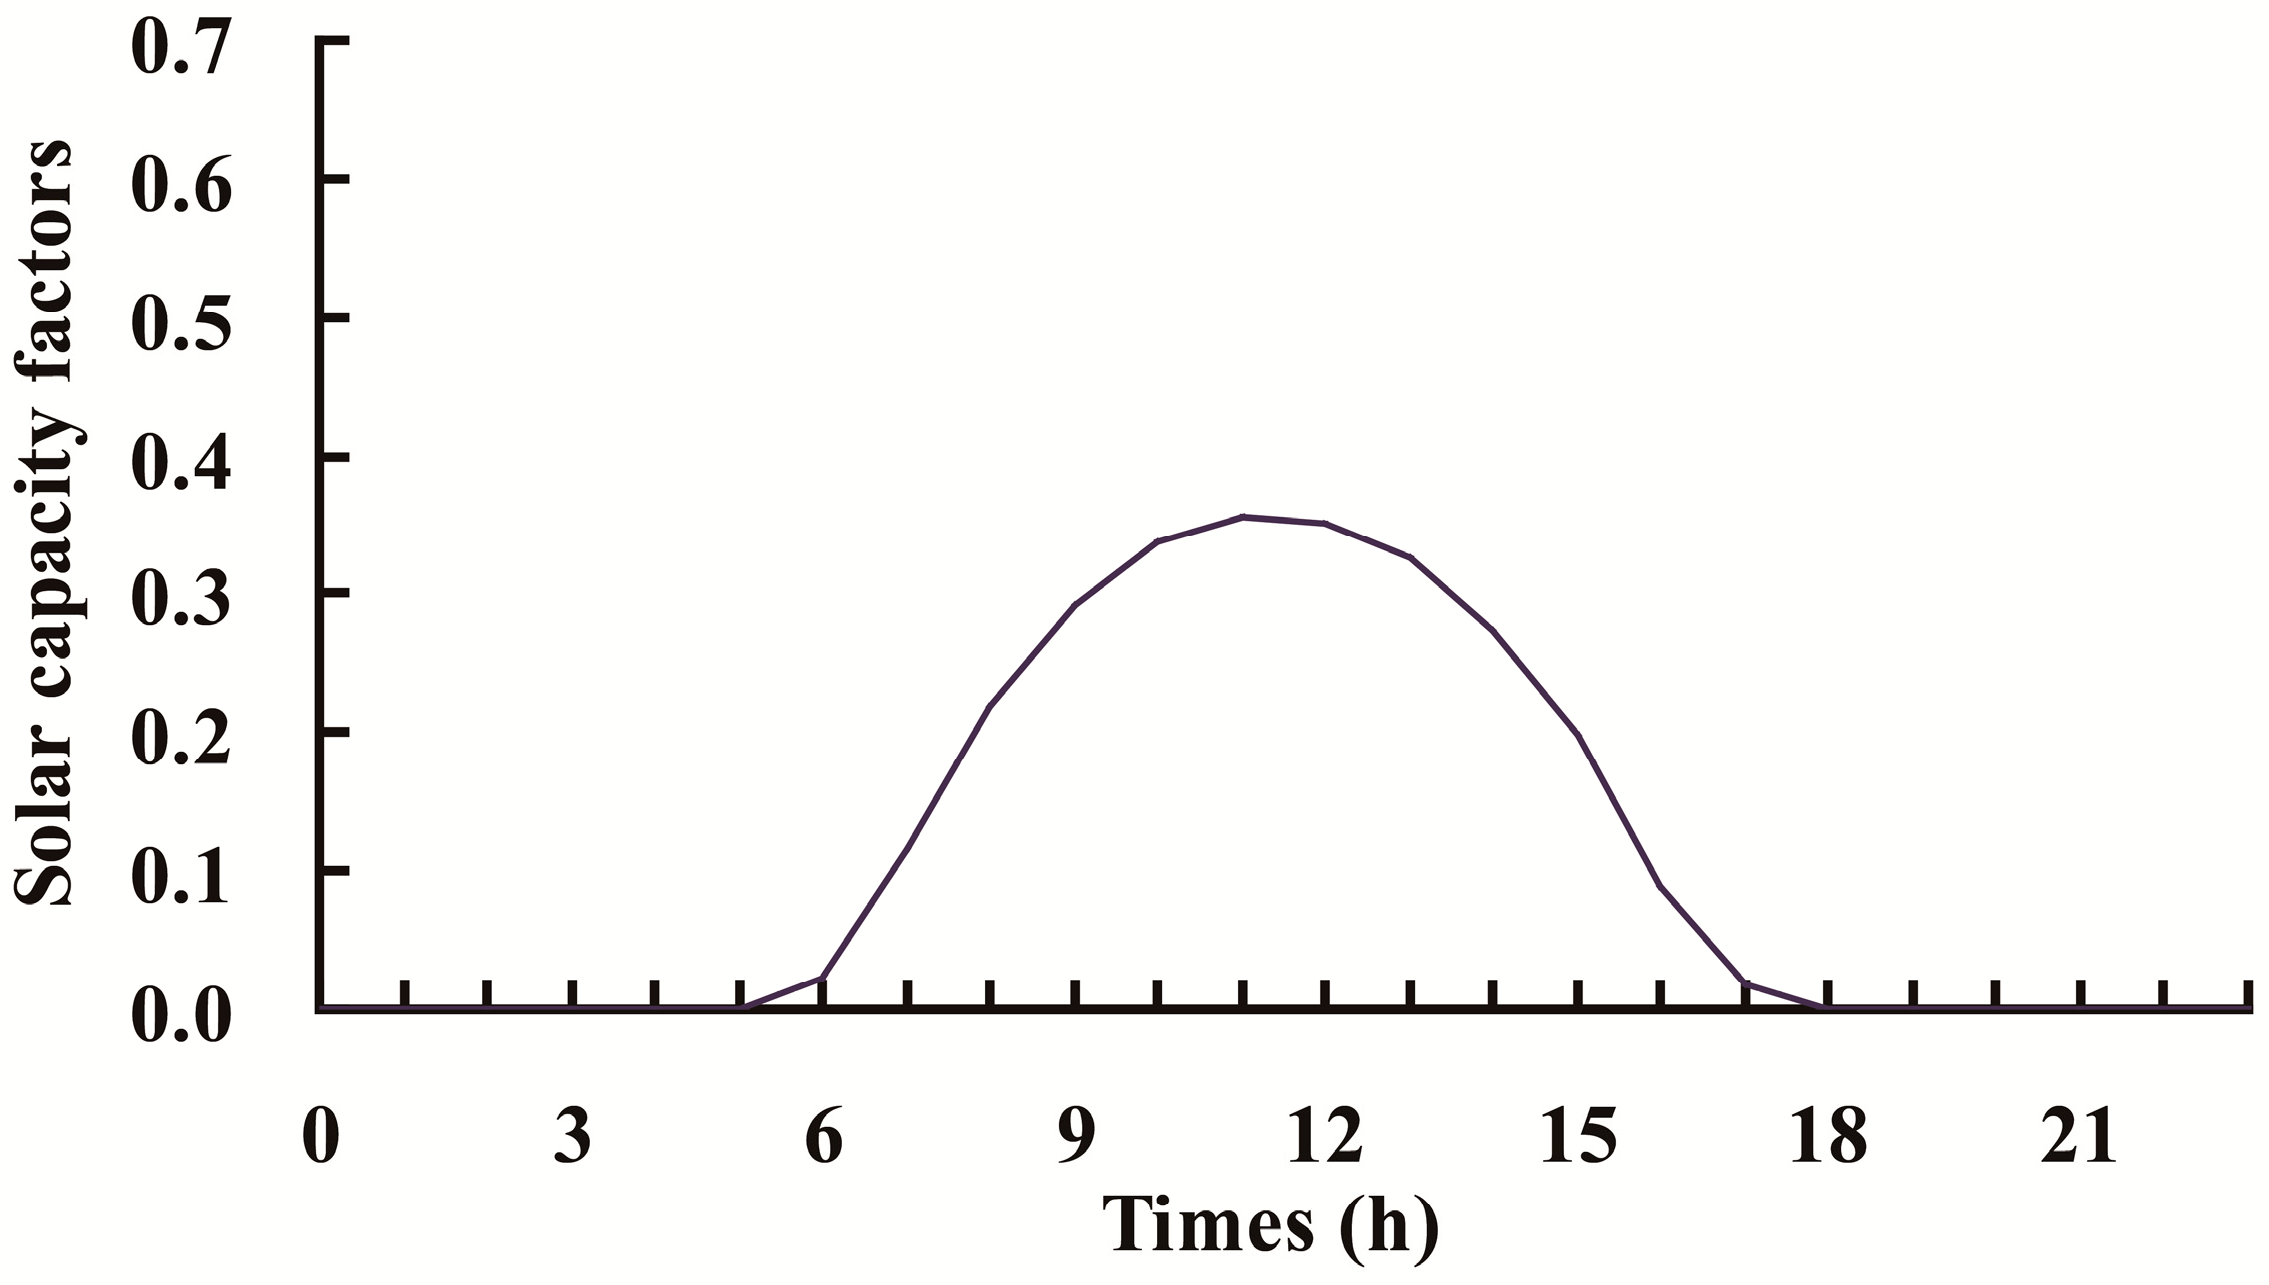
The solar PV capacity is 3210 MW, and hydro power capacity is 1600 MW. The capacity factors of solar PV on a typical day in the regional power system are shown in Figure A5.
Figure A5.
Solar PV capacity factors on a typical day in the regional power system.

Figure A6.
Flexibility cost comparison of coal fired units with RE integrations.

Figure A7.
Comparison of the total dispatch cost of power system with RE integrations.

Figure A8.
Comparison of the net benefit of power system with RE integrations.

References
- Mitchell, C. Momentum is increasing towards a flexible electricity system based on renewables. Nat. Energy 2016, 1, 6. [Google Scholar] [CrossRef]
- Antal, M.; Karhunmaa, K. The German energy transition in the British, Finnish and Hungarian news media. Nat. Energy 2018, 3, 994–1001. [Google Scholar] [CrossRef]
- Davidson, M.R.; Zhang, D.; Xiong, W.M.; Zhang, X.L.; Karplus, V.J. Modelling the potential for wind energy integration on China’s coal-heavy electricity grid. Nat. Energy 2016, 1, 7. [Google Scholar] [CrossRef]
- The National Development and Reform Commission (NDRC); National Energy Administration (NEA). Energy Production and Consumption Revolution Strategy (2016–2030). (In Chinese). Available online: http://www.ndrc.gov.cn/gzdt/201704/W020170425548780357458.pdf (accessed on 21 February 2018).
- Energy Transition Trends 2019. Available online: https://www.dena.de/fileadmin/dena/Dokumente/Themen_und_Projekte/Internationales/China/CREO/Energy_transition_trends_2019_engl.pdf (accessed on 25 April 2019).
- International Energy Agency (IEA). Key World Energy Statistics 2018. Available online: https://webstore.iea.org/key-world-energy-statistics-2018 (accessed on 27 April 2019).
- Gu, Y.; Xu, J.; Chen, D.; Wang, Z.; Li, Q. Overall review of peak shaving for coal-fired power units in China. Renew. Sustain. Energy Rev. 2016, 54, 723–731. [Google Scholar] [CrossRef]
- China Electric Power Planning and Engineering Institute. Report on China’s Electric Power Development 2017; China Market Press: Beijing, China, 2018; pp. 40–44. [Google Scholar]
- China Electricity Council (CEC). China Power Industry Development Report; China Market Press: Beijing, China, 2018; pp. 78–106. [Google Scholar]
- State Council. Opinions on Further Deepening the Reform of Power System (Document No. 9). (In Chinese). Available online: http://tgs.ndrc.gov.cn/zywj/201601/t20160129_773852.html (accessed on 5 October 2018).
- Vithayasrichareon, P.; Riesz, J.; MacGill, I. Operational flexibility of future generation portfolios with high renewables. Appl. Energy 2017, 206, 32–41. [Google Scholar] [CrossRef]
- International Energy Agency (IEA). Status of Power System Transformation 2018, Advanced Power Plant Flexibility; OECD/IEA: Paris, France, 2018; Available online: https://webstore.iea.org/status-of-power-system-transformation-2018 (accessed on 2 August 2018).
- Agora Energiewende, Flexibility in Thermal Power Plants—With a Focus on Existing Coal-Fired Power Plants. Available online: https://www.agora-energiewende.de/fileadmin2/Projekte/2017/Flexibility_in_thermal_plants/115_flexibility-report-WEB.pdf (accessed on 8 December 2018).
- Thermal Power Plant Flexibility, a Publication under the Clean Energy Ministerial Campaign. Available online: http://www.ea-energianalyse.dk/reports/thermal_power_plant_flexibility_2018_19052018.pdf (accessed on 20 December 2018).
- Schill, W.-P.; Pahle, M.; Gambardella, C. Start-up costs of thermal power plants in markets with increasing shares of variable renewable generation. Nat. Energy 2017, 2, 6. [Google Scholar] [CrossRef]
- Shortt, A.; Kiviluoma, J.; Malley, M.O. Accommodating variability in generation planning. IEEE Trans. Power Syst. 2013, 28, 158–169. [Google Scholar] [CrossRef]
- Gonzalez-Salazar, M.A.; Kirsten, T.; Prchlik, L. Review of the operational flexibility and emissions of gas- and coal-fired power plants in a future with growing renewables. Renew. Sustain. Energy Rev. 2018, 82, 1497–1513. [Google Scholar] [CrossRef]
- Garðarsdóttir, S.Ó.; Göransson, L.; Normann, F.; Johnsson, F. Improving the flexibility of coal-fired power generators: Impact on the composition of a cost-optimal electricity system. Appl. Energy 2018, 209, 277–289. [Google Scholar] [CrossRef]
- Brinkman, G.; Kumar, N.; Besuner, P.; Agan, D.; Lefton, S. Impacts of Wind and Solar on Fossil-Fueled Generators; National Renewable Energy Laboratory (NREL): Oak Ridge, TN, USA, 2012. Available online: https://www.nrel.gov/docs/fy12osti/53504.pdf (accessed on 21 December 2018).
- Brinckerhoff Parsons. Technical Assessment of the Operation of Coal & Gas Fired Plants; Deparment of Energy and Climate Change (DECC): London, UK, 2014. Available online: https://assets.publishing.service.gov.uk/government/uploads/system/uploads/attachment_data/file/387566/Technical_Assessment_of_the_Operation_of_Coal_and_Gas_Plant_PB_Power_FIN....pdf (accessed on 2 December 2018).
- IEAGHG. Operating Flexibility of Power Plants with CCS, 2012/6; IEAGHG: Cheltenham, UK, 2012; Available online: https://hub.globalccsinstitute.com/sites/default/files/publications/104631/operating-flexibility-power-plants-ccs.pdf (accessed on 15 June 2018).
- Kumar, N.; Besuner, O.; Lefton, S.A.; Agan, D.; Hilleman, D. Power Plant Cycling Costs. Subcontract Report NREL/SR-5500-55433; National Renewable Energy Laboratory: Golden, CO, USA, 2012. Available online: https://www.nrel.gov/docs/fy12osti/55433.pdf (accessed on 15 October 2018).
- Zhao, Y.; Wang, C.; Liu, M.; Chong, D.; Yan, J. Improving operational flexibility by regulating extraction steam of high-pressure heaters on a 660 MW supercritical coal-fired power plant: A dynamic simulation. Appl. Energy 2018, 212, 1295–1309. [Google Scholar] [CrossRef]
- Viswanathan, V.; Gray, D. Damage to Power Plants Due to Cycling; EPRI: Palo Alto, CA, USA, 2001; Available online: https://www.epri.com/#/pages/product/1001507/?lang=en-US (accessed on 17 June 2018).
- Schröder, A.; Kunz, F.; Meiss, J.; Mendelevitch, R.; von Hirschhausen, C. Current and Prospective Costs of Electricity Generation Until 2050; Deutsches Institut für Wirtschaftsforschung (DIW): Berlin, Germany, 2013; Available online: https://www.diw.de/documents/publikationen/73/diw_01.c.424566.de/diw_datadoc_ 2013-068.pdf (accessed on 20 June 2018).
- Göransson, L.; Goop, J.; Odenberger, M.; Johnsson, F. Impact of thermal plant cycling on the cost-optimal composition of a regional electricity generation system. Appl. Energy 2017, 197, 230–240. [Google Scholar] [CrossRef]
- Lefton, S.; Hilleman, D. The Cost of Cycling Coal Fired Power Plants. Coal Power Magazine Winter 2006. Available online: http://www.pserc.cornell.edu/empire/100_CoalPowerWinterMag16-20.pdf (accessed on 18 June 2018).
- Schill, W.; Pahle, M.; Gambardella, C. On Start-up Costs of Thermal Power Plants in Markets with Increasing Shares of Fluctuating Renewables; Deutsches Institut für Wirtschaftsforschung (DIW): Berlin, Germany, 2016; Available online: https://www.diw.de/documents/publikationen/73/diw_01.c.524200.de/ dp1540.pdf (accessed on 25 June 2018).
- International Energy Agency (IEA). Status of Power System Transformation 2018—Technical Annexes; OECD/IEA: Paris, France, 2018; Available online: https://webstore.iea.org/status-of-power-system-transformation-2018 -technical-annexes (accessed on 3 August 2018).
- Yin, S.Y.; Zhang, S.F.; Andrews-Speed, P.; Li, W. Economic and environmental effects of peak regulation using coal-fired power for the priority dispatch of wind power in China. J. Clean. Product. 2017, 162, 361–370. [Google Scholar] [CrossRef]
- Papaefthymiou, G.; Dragoon, K. Towards 100% renewable energy systems: Uncapping power system flexibility. Energy Policy 2016, 92, 69–82. [Google Scholar] [CrossRef]
- De Jonghe, C.; Delarue, E.; Belmans, R.; D’Haeseleer, W. Determining optimal electricity technology mix with high level of wind power penetration. Appl. Energy 2011, 88, 2231–2238. [Google Scholar] [CrossRef] [Green Version]
- Brouwer, A.S.; van den Broek, M.; Seebregts, A.; Faaij, A. Operational flexibility and economics of power plants in future low-carbon power systems. Appl. Energy 2015, 156, 107–128. [Google Scholar] [CrossRef] [Green Version]
- Kondziella, H.; Bruckner, T. Flexibility requirements of renewable energy based electricity systems—A review of research results and methodologies. Renew. Sustain. Energy Rev. 2016, 53, 10–22. [Google Scholar] [CrossRef]
- Lund, P.D.; Lindgren, J.; Mikkola, J.; Salpakari, J. Review of energy system flexibility measures to enable high levels of variable renewable electricity. Renew. Sustain. Energy Rev. 2015, 45, 785–807. [Google Scholar] [CrossRef] [Green Version]
- International Energy Agency (IEA). Insights Series 2018—Power Sector Reform in China; OECD/IEA: Paris, France, 2018; Available online: https://webstore.iea.org/insights-series-2018-power-sector-reform-in-china (accessed on 23 December 2018).
- Zhang, N.; Hu, Z.; Shen, B.; Dang, S.; Zhang, J.; Zhou, Y. A source-grid-load coordinated power planning model considering the integration of wind power generation. Appl. Energy 2016, 168, 13–24. [Google Scholar] [CrossRef]
- Arroyo, J.M.; Conejo, A.J. Optimal response of a thermal unit to an electricity spot market. IEEE Trans. Power Syst. 2000, 15, 1098–1104. [Google Scholar] [CrossRef]
- Arroyo, J.M.; Conejo, A.J. Modeling of start-up and shut-down power trajectories of thermal units. IEEE Trans. Power Syst. 2004, 19, 1562–1568. [Google Scholar] [CrossRef]
- Zhao, C.X. Technical Manual for Steam Turbine Units; China Market Press: Beijing, China, 2007; pp. 325–330. (In Chinese) [Google Scholar]
- The Norm of Energy Consumption Per Unit Product of General Coal-Fired Power Set. (In Chinese). Available online: http://www.cspress.com.cn/biaozhunziliao/1553.html (accessed on 20 December 2018).
- The Norm of Energy Consumption Per Unit Product of Combined Heat and Power Generation. (In Chinese). Available online: http://www.cspress.com.cn/biaozhunziliao/40862.html (accessed on 20 December 2018).
- Convertino, M.; Valverde, L.J. Portfolio decision analysis framework for value-focused ecosystem management. PLoS ONE 2013, 8, e65056. [Google Scholar] [CrossRef] [PubMed]
- Saltelli, A.; Ratto, M.; Andres, T.; Campolongo, F.; Cariboni, J.; Gatelli, D.; Saisana, M.; Tarantola, S. Global Sensitivity Analysis. The Primer, Global Sensitivity Analysis. The Primer. Available online: https://doi.org/10.1002/9780470725184 (accessed on 19 May 2019).
- The National Development and Reform Commission (NDRC); National Energy Administration (NEA). The 13th FYP for Power Development. (In Chinese). Available online: http://www.gov.cn/xinwen /2016-12/22/5151549/files/696e98c57ecd49c289968ae2d77ed583.pdf (accessed on 21 February 2018).
- Holcombe, R.G. Public Sector Economics: The Role of Government in the American American Economy; China Renmin University Press: Beijing, China, 2012; pp. 75–77. [Google Scholar]
- The National Development and Reform Commission (NDRC); National Energy Administration (NEA). The Trial Measures for Priority Generation of Units Providing Peak Regulation Services for Renewable Energy. (In Chinese). Available online: http://www.nea.gov.cn/135533225_14691795237461n.pdf (accessed on 22 February 2018).
Figure 1.
Shares of electricity generation by sources.

Figure 2.
Capacity shares of units by fuel sources respectively in the regional grids.

Figure 3.
Detail of total dispatch cost.

Figure 4.
System load profile of the regional power system on a typical day.

Figure 5.
Wind capacity factors on a typical day in the regional power system.

Figure 6.
Average fuel consumption rate curves of typical coal fired units.

Figure 7.
Average load rates of coal fired units on a typical day in the baseline scenario.

Figure 8.
The correlation among the integration ratio of wind power, its curtailment rate, and total dispatch cost of the power system.
Figure 8.
The correlation among the integration ratio of wind power, its curtailment rate, and total dispatch cost of the power system.

Figure 9.
The total average load rates of coal fired units with the integration of wind power.

Figure 10.
Numbers of start-ups of coal fired units with the integration of wind power.

Figure 11.
Numbers of deep-down regulations of coal fired units with the integration of wind power.

Figure 12.
Start-up costs of coal fired units with the integration of wind power.

Figure 13.
Operation costs of deep-down regulations of coal fired units with the integration of wind power.
Figure 13.
Operation costs of deep-down regulations of coal fired units with the integration of wind power.

Figure 14.
The correlation among curtailment costs of wind power, overall startup costs, operation costs of deep-down regulated units, and total dispatch cost of the power system.
Figure 14.
The correlation among curtailment costs of wind power, overall startup costs, operation costs of deep-down regulated units, and total dispatch cost of the power system.

Figure 15.
The correlation between the net benefit of the power system and the energy saving and environmental benefit.
Figure 15.
The correlation between the net benefit of the power system and the energy saving and environmental benefit.

Figure 16.
The net benefit of the power system at the different penalty rates of the wind power curtailment.
Figure 16.
The net benefit of the power system at the different penalty rates of the wind power curtailment.

Table 1.
Capacities of the coal fired units in the regional grid.
| Units | Total Capacity/MW | CHP Capacity/MW |
|---|---|---|
| ≥1000 MW | 4000 | 0 |
| [600,1000) MW | 20940 | 4920 |
| [300,600) MW | 20204 | 16970 |
| [200,300) MW | 4680 | 3840 |
| [100,200) MW | 601 | 601 |
Table 2.
Overall average load rate of the coal fired units on a typical day in the baseline scenario.
Table 2.
Overall average load rate of the coal fired units on a typical day in the baseline scenario.
| Units | Overall Average Load Rate |
|---|---|
| ≥1000 MW | 0.832 |
| [600,1000) MW | 0.747 |
| [300,600) MW | 0.742 |
| [200,300) MW | 0.748 |
| [100,200) MW | 0.732 |
Table 3.
Overall average load rate of the coal fired units in the regional grid.
| Change of Coal Price | Change of Total Dispatch Cost | The Net Benefit Change of Wind Power Integration |
|---|---|---|
| −10% | −8.19% | −11.26% |
| −5% | −4.06% | −5.84% |
| 5% | 4.24% | 4.84% |
| 10% | 8.36% | 10.40% |
Table 4.
Overall average load rate of the coal fired units in the regional grid.
| Change of CO2 Price | Change of Total Dispatch Cost | The Net Benefit Change of Wind Power Integration |
|---|---|---|
| −10% | −1.26% | −1.64% |
| −5% | −0.51% | −1.47% |
| 5% | 0.60% | 1.00% |
| 10% | 1.35% | 1.14% |
© 2019 by the authors. Licensee MDPI, Basel, Switzerland. This article is an open access article distributed under the terms and conditions of the Creative Commons Attribution (CC BY) license (http://creativecommons.org/licenses/by/4.0/).
Share and Cite
MDPI and ACS Style
Zhao, J.; Shen, B. The Strategies for Improving Energy Efficiency of Power System with Increasing Share of Wind Power in China. Energies 2019, 12, 2376. https://doi.org/10.3390/en12122376
AMA Style
Zhao J, Shen B. The Strategies for Improving Energy Efficiency of Power System with Increasing Share of Wind Power in China. Energies. 2019; 12(12):2376. https://doi.org/10.3390/en12122376
Chicago/Turabian StyleZhao, Jun, and Bo Shen. 2019. "The Strategies for Improving Energy Efficiency of Power System with Increasing Share of Wind Power in China" Energies 12, no. 12: 2376. https://doi.org/10.3390/en12122376
Note that from the first issue of 2016, this journal uses article numbers instead of page numbers. See further details here.