Distributed Charging Prioritization Methodology Based on Evolutionary Computation and Virtual Power Plants to Integrate Electric Vehicle Fleets on Smart Grids

 , ,
, ,  ,
,
Abstract
:1. Introduction
2. Background
3. Architecture View
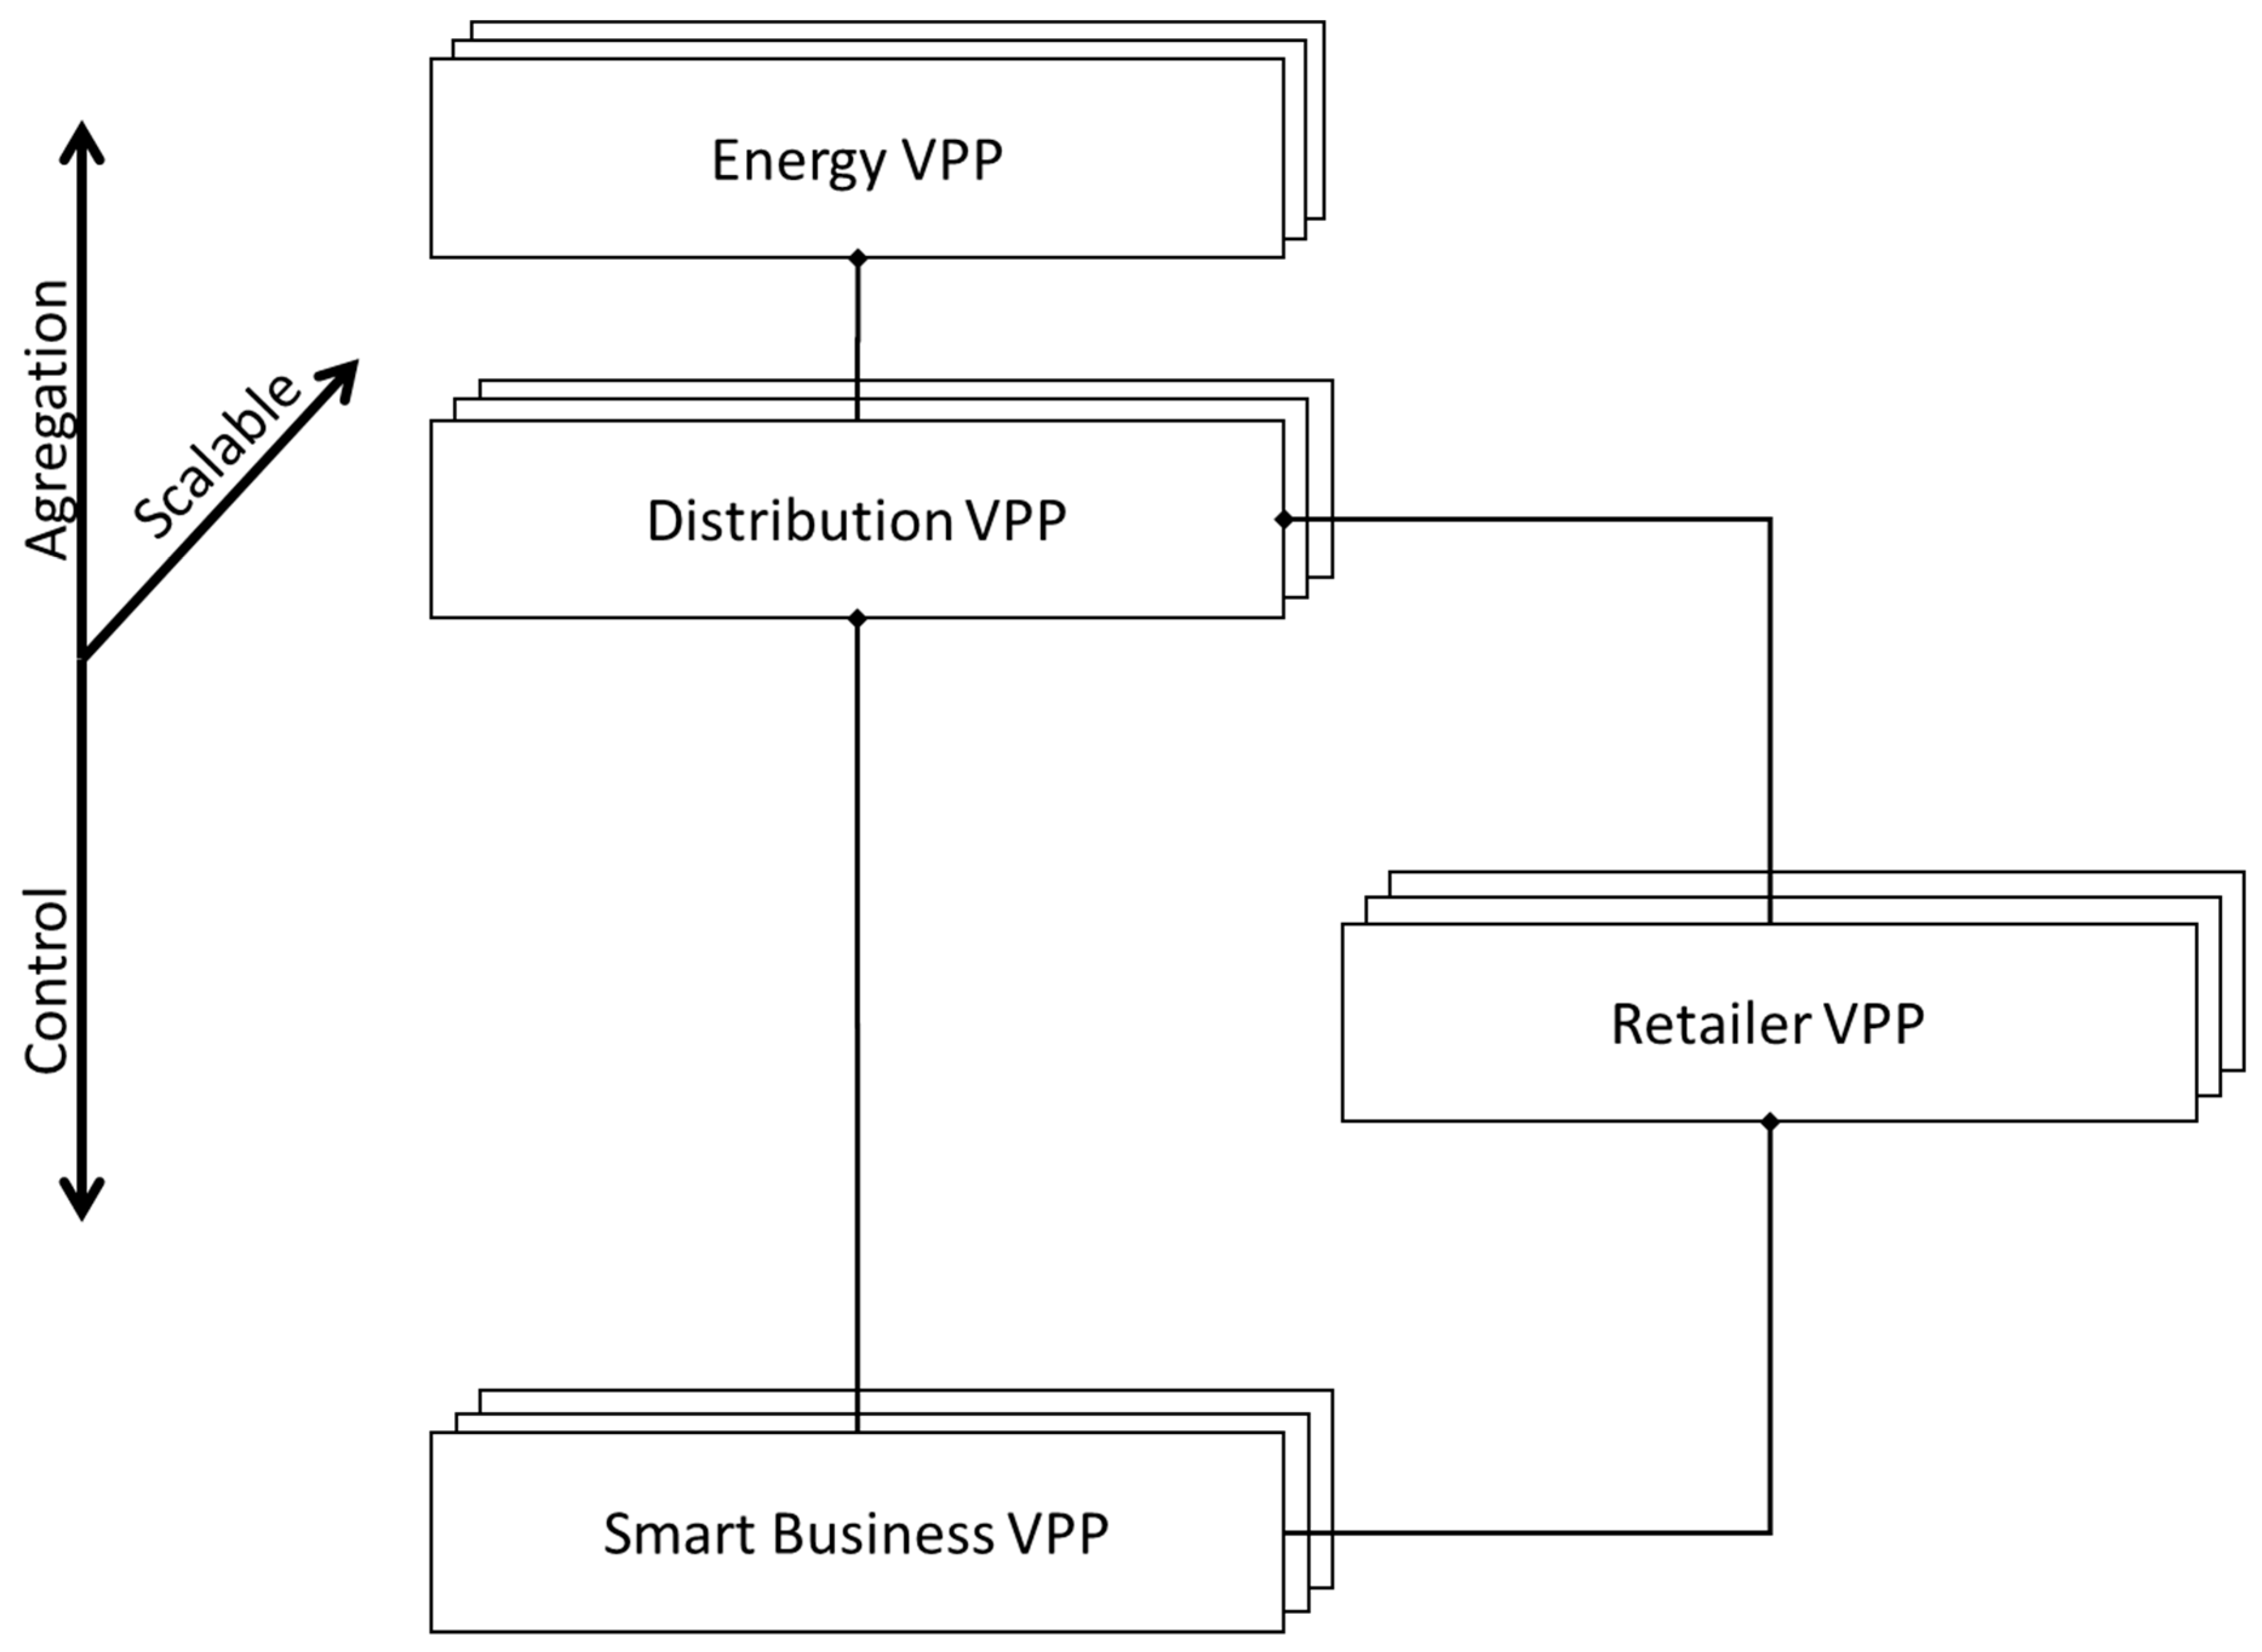
- Smart business VPP (SBVPP). This is the lowest level. At this level, all information about vehicles, routes, and drivers from the same company is available. Thus, the charging prioritization of the charging stations of the company is treated at this level. The state of charge (SoC) is also calculated at this level. Some routes may be very long, which may cause a vehicle to use a charging station that is located outside of the company. This charging station may be administered by another company or the corresponding power distribution company. In this case, the algorithm sends the restrictions to higher VPP levels to obtain a solution for the charging needs.
- Distribution VPP (DVPP). At this level, information is aggregated from lower levels, and information about retailers and the presence of charging stations is stored. This information is sent to higher levels, such as an energy VPP (EVPP). Additionally, the restrictions from an EVPP to the corresponding retailer and SBVPP are addressed at this level.
- Retailer VPP (RVPP). At this level, a retailer needs to know when vehicles require charging at any point outside of the company points. The retailer can use this information to offer different tariffs to a company. This level acts as an intermediate between the charging stations of different companies.
- Energy VPP (EVPP). In this paper, the vehicles represent mobile loads. Thus, if an energy management system has information about the expected charging stations, it may take advantage of this information to improve the load flow forecasting algorithms. Load flow forecasting algorithm is not an objective of this paper. This paper proposes a distributed prioritization algorithm based on the VPP concept for SGs. The prioritization algorithm that is performed at this level treats the total load and establishes possible restrictions at any point of the grid.
- The evolutionary algorithm in an SBVPP. This algorithm sorts the vehicles with their drivers according to the SoC and expected route. If the algorithm cannot include any vehicle, the algorithm classifies the vehicle as an external charge and sends the request to higher VPPs. The SBVPP can receive commands and warnings from the DVPP and RVPP. The higher VPP commands and warnings are considered to be external restrictions. Additionally, the RVPP commands and warnings can take effect over different elements of customer power facilities when the customer that implements a SBVPP has contracted additional services from a retailer to manage the customer power facilities.
- The evolutionary algorithm in a DVPP. The DVPP gathers all requests from all SBVPPs. This information is employed in an evolutionary algorithm to prioritize charging in available charging stations. The prioritization of different vehicles is sent to the corresponding RVPP. The prioritization of all vehicles is aggregated and sent to the EVPP.
- The EVPP gathers all information about the charging processes to provide information to the energy flow algorithm. The EVPP can send commands or warnings to the DVPP to notify changes in the prioritization.
- The RVPP gathers all information about vehicles that may have contractual relationships with a retailer. The retailer can use this information to offer new services to clients. If any problems arise in the client contract, the retailer can send a command or alarm to change the prioritization for one or more vehicles and/or charging stations.
- If any command or warning exists, the prioritization is re-calculated, which adds new restrictions. If no command or warning exists, the charging prioritization in the external charging stations is notified to the SBVPP.
4. The Distributed Evolutionary Prioritization Framework
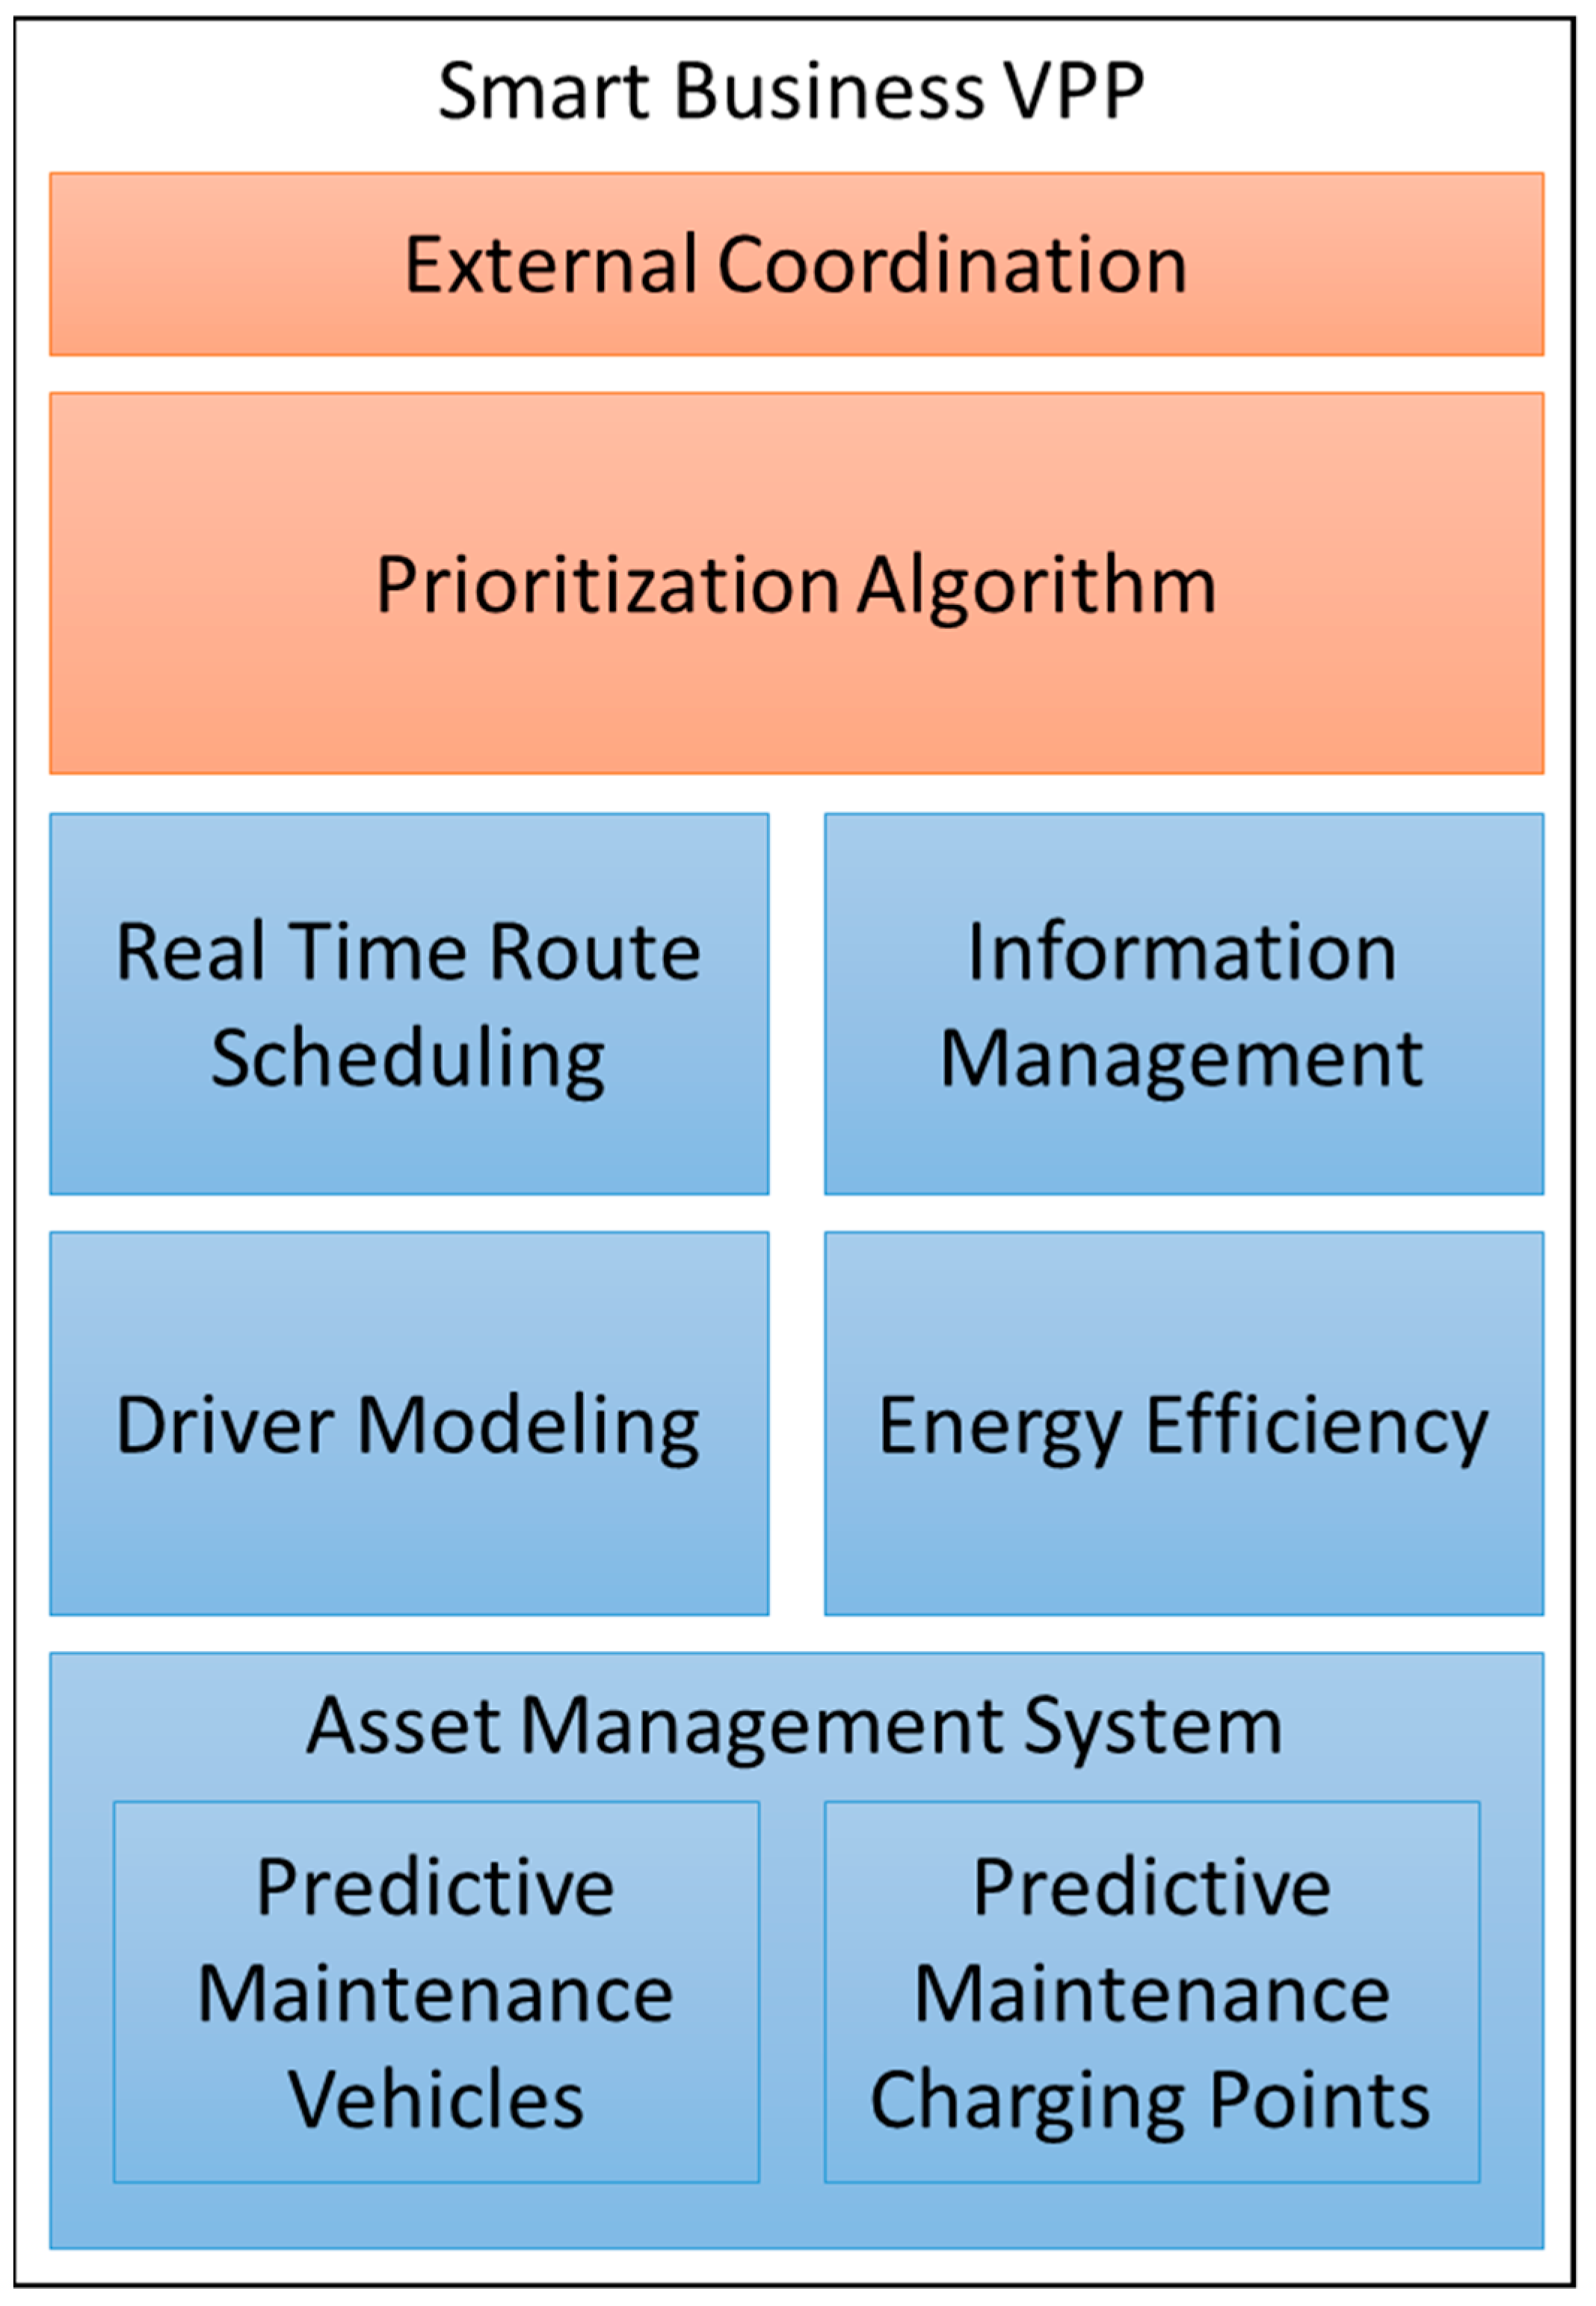
- Asset Management System. The asset management system is based on the predictive maintenance of vehicles and charging stations. These modules establish the maintenance periods and register the usage of all equipment (vehicles and charging stations).
- Driver Modeling. This module executes a modeling process of driver behavior. This module provides a driver pattern which is used to schedule the routes.
- Energy Efficiency. This module applies different techniques to optimize the energy consumption and reduce the maintenance periods and economic impact.
- Real-Time Route Scheduling. This module manages all information about vehicles, routes, drivers, and external conditions to establish better prioritization in each charging station.
- Information Management. This module manages all information of this VPP for reporting and visualization.
- Prioritization Algorithm. The prioritization algorithm in this layer is based on swarm intelligence.
- External Coordination. This module sends information to higher layers and gathers information about external requirements or vehicles to charge.
4.1. Available Information for SBVPP
4.2. Driver Patterns
4.3. Real-Time Route Scheduling
- Driver and EV availability. On a route, a driver (or EV) may have an accident or a driver (or EV) may notify temporary unavailability. In this case, the module updates the calendar for the driver (or EV). This new condition takes effect in the prioritization process by a fitness function of evolutionary algorithms. Sometimes, the temporal unavailability of an EV can be notified by the asset management module.
- Route modifications. Three types of route modifications are possible:
- ○
- Adding a new stop.
- ○
- Adding a new stop to charge an EV.
- ○
- Adding a new stop to change drivers.
- Traffic and roadwork. The traffic and work road modeling are translated into a penalty coefficient for different sections of a route. In this case, the route scheduling algorithm may provide the route with lesser penalties. These penalties take effect on the calculated SoC and the driver selection. The penalty coefficient is stored for each geographical zone and is associated with driver information. If a driver has a very high deviation from the original predicted value, the penalty is increased. This pattern did not consider any information about the origin of the traffic load. The pattern only assigns a penalty coefficient according to the fluidity of traffic.
- Weather conditions. The weather conditions would take effect over the SoC module, prioritization algorithm, and asset management module.
- Charging station availability. If the higher VPPs can send commands or instructions to limit the consumption or availability of the power supply. In this case, this module updates the unavailability periods of the corresponding charging stations.
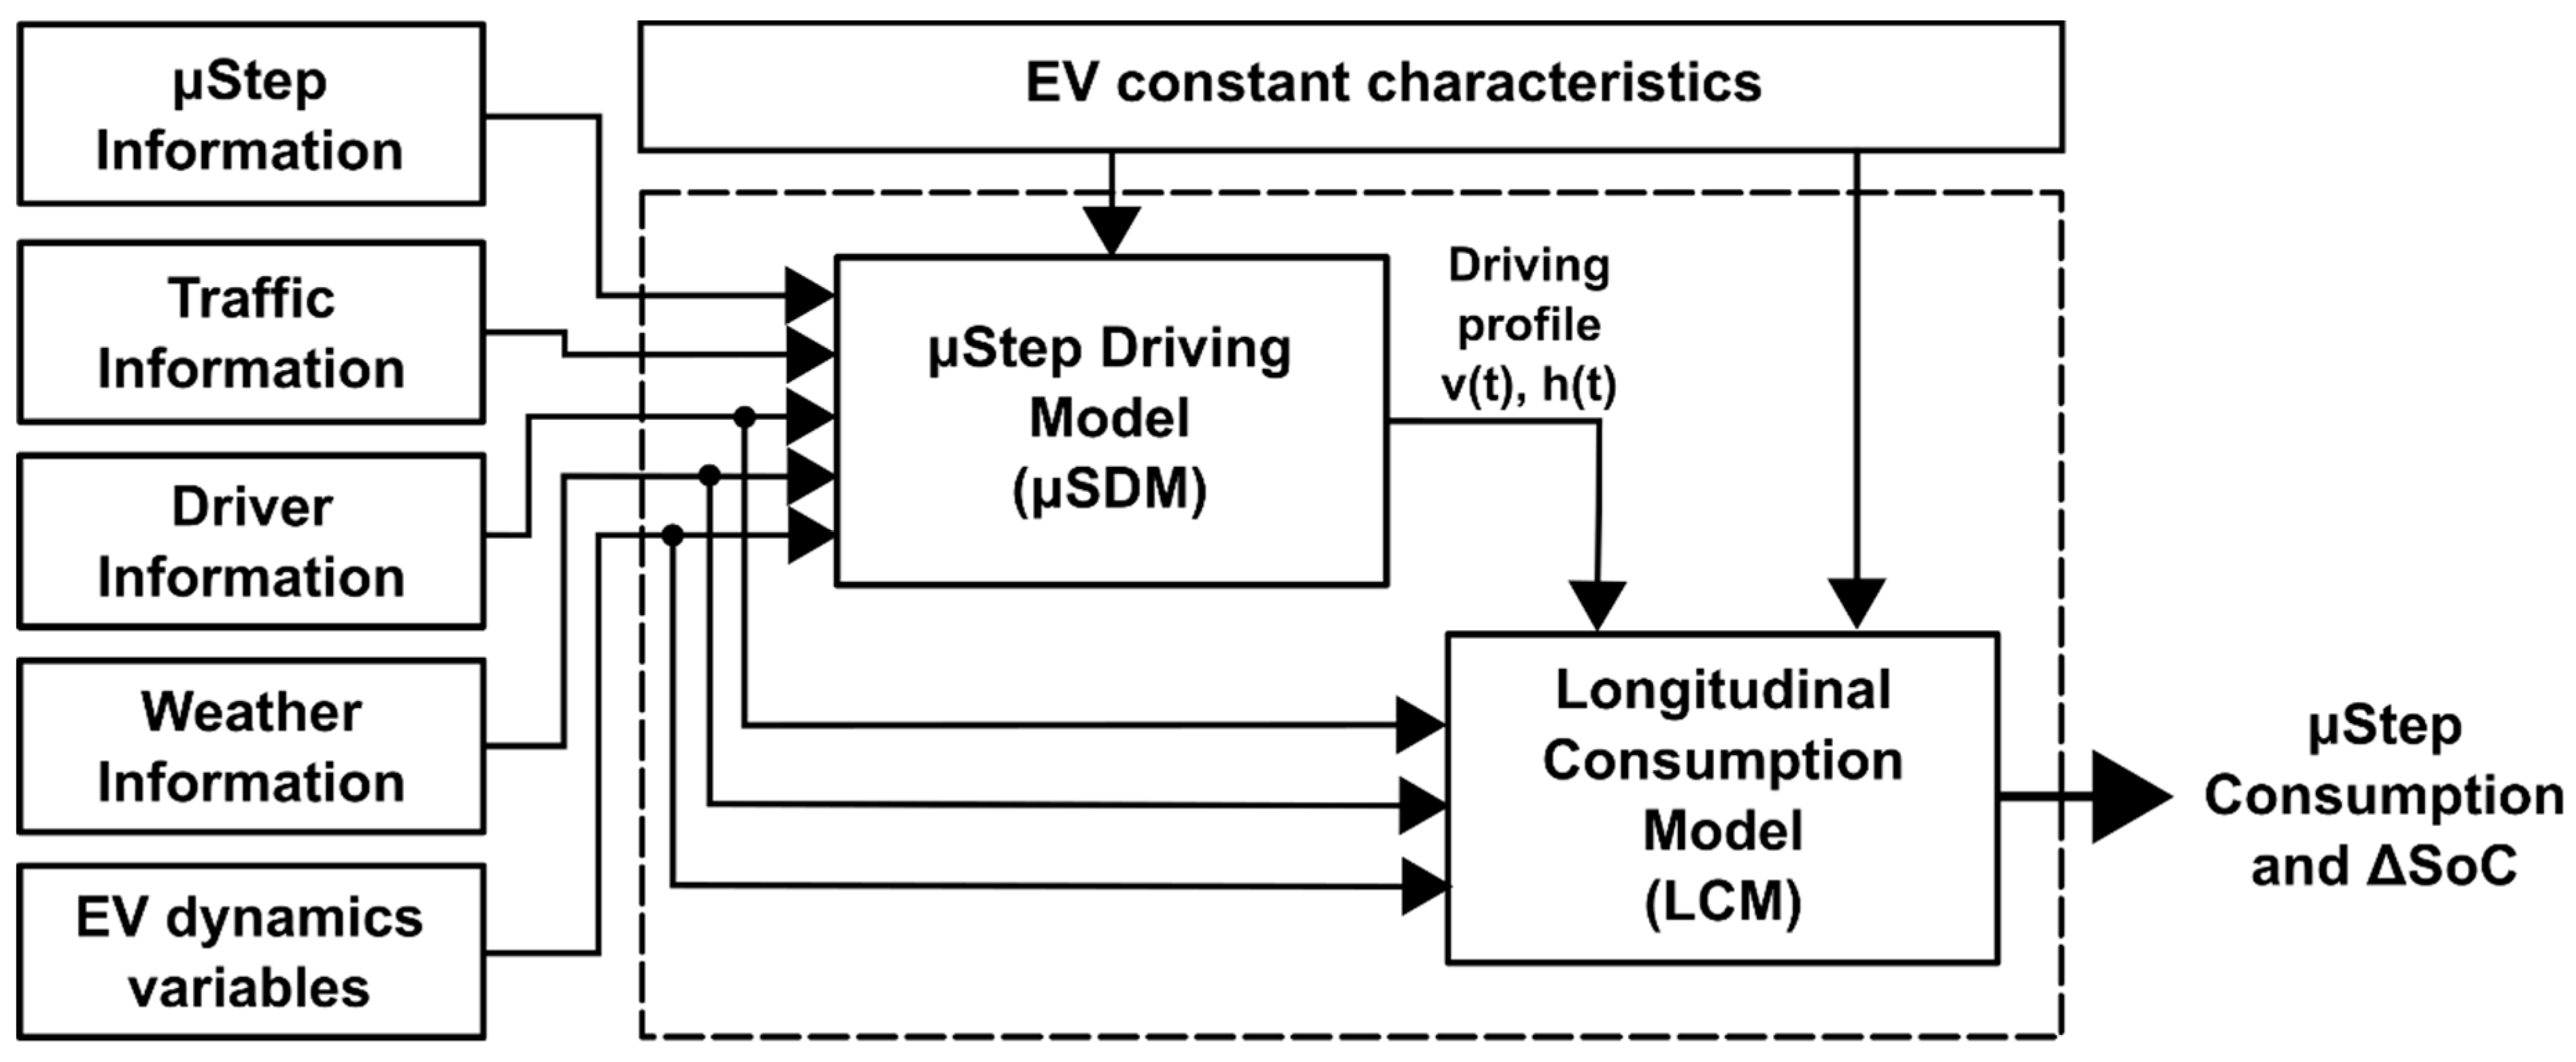
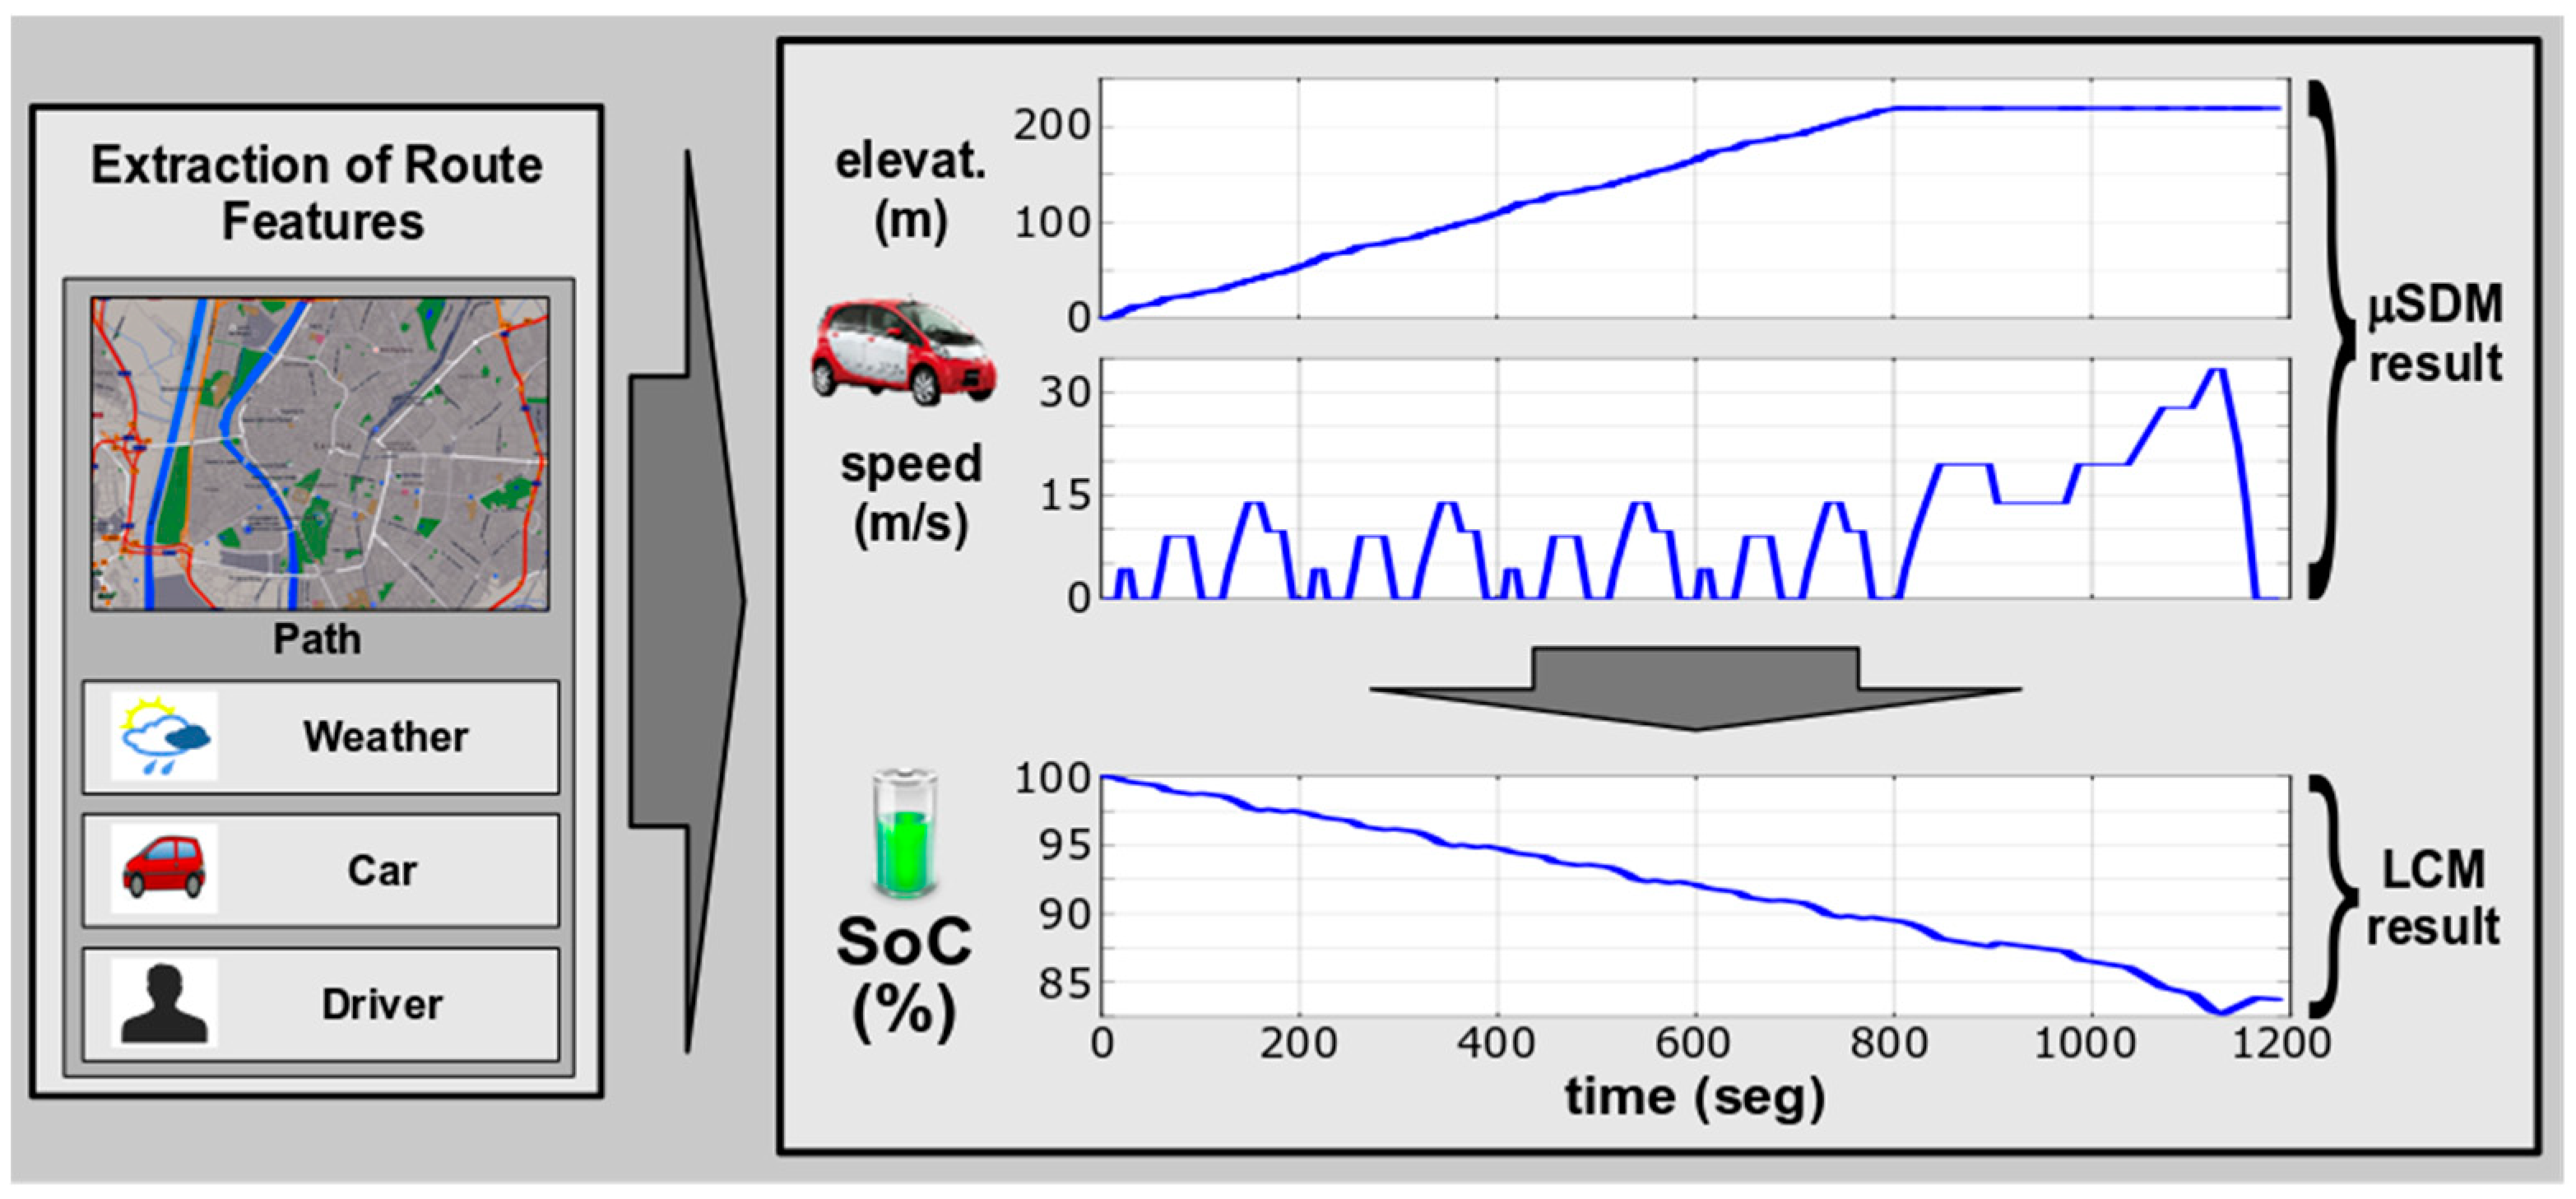
4.4. SoC Module: Estimation of EV Consumption
- Knowledge-based models are the most common approach. This type of model performs a consumption characterization based on records of vehicle operations using computational intelligence techniques, such as artificial neural networks (ANNs) [45] and fuzzy neural networks (FNNs) [46]. However, these techniques have the disadvantage of requiring a large amount of data which must contain different conditions to model realistic vehicle behaviors in as many situations as possible.
- There are analytical models (also known as longitudinal models) that study the necessary energy to move a vehicle by analyzing the losses along its different mechanical and electronic elements [47,48]. Thus, these models are typically more complex than knowledge-based models. However, analytical models do not require as much information as knowledge-based models because their parameters can be characterized based on information provided by a manufacturer (i.e., New European Driving Cycle (NEDC) standards test [49]).
5. Prioritization Algorithm
- Genetic algorithm (GA).
- Genetic algorithm with evolution control (GAEC) based on fitness evolution curve.
- Swarm intelligence based on particle swarm optimization (PSO).
- The routes are sorted by starting timestamp, route distance, and ending timestamp.
- The vehicles are sorted by range or battery capacity.
- The drivers are sorted according to the difference between the real and expected routes, in ascending order. The new drivers or drivers without historical information are positioned in first place.
- The charging stations are ordered by connector type according to the estimated charging period.
5.1. Genetic Algorithm (GA)
| Algorithm 1. Genetic Algorithm (GA): size p of population (P(t)), rate q of elitism, rate c of crossover (default 0,9), and rate m of mutation (default 0,1). |
|
5.2. Genetic Algorithm with Evolution Control (GAEC) Based on Fitness Evolution Curve
| Algorithm 2. Genetic Algorithm with Evolution Control (GAEC): size p of the population (P(t)), rate q of elitism. |
|
5.3. Particle Swarm Optimization (PSO) Algorithm
| Algorithm 3. PSO Algorithm |
|
5.4. Configuration of Prioritization Algorithms
- Time interval to prioritize (one day by default).
- External charging. The system may accept a charging request from the DVPP.
- External charging priority. The system will assign the first available slot in the queues to the external vehicles; however, the system moves the vehicles of the SBVPP (if possible).
- Partial charging. The prioritization algorithm may accept the queue calculation based on the energy needs of a route. This option takes effect over the asset management system and the predictive maintenance of vehicles.
- Possibility of reuse drivers. A driver may be assigned to one or more routes and vehicles on the same day. The routes must be separated by time.
- Possibility of specifying periods of unavailability of charging stations. Time periods at the charging stations may be established or reserved. This option is employed by the predictive maintenance of the charging stations of the asset management system to establish non-periodical maintenance.
- Possibility of specifying periods of unavailability of vehicles. Time periods of the vehicles may be established or reserved. This option is employed by the predictive maintenance of the vehicles of the asset management system to establish non-periodical maintenance.
- Possibility of specifying periods of unavailability of drivers. Time periods for drivers may be established in case of time off for sick or medical leave.
- Driver rest periods along a route. Driver rest periods along routes are set to two hours by default.
- Driver rest periods between different routes. This period is dependent on the reuse driver parameter and the driver rest periods along a route. Thus, this time considers the last rest period for a driver along a route.
- Rest periods between vehicles that charge at charging stations. This time is configured in the system to establish the time invested in disconnecting a vehicle and connect the next vehicle.
- Maintenance periods for charging stations. The periods specified for this parameter are periodically performed.
- Maintenance periods for vehicles. The periods specified for this parameter are periodically performed.
- Usage balancing of charging stations. The calculated queues are calculated to balance the usage of charging stations.
- Assignation prioritization of external charge. If this option is enabled, the prioritization algorithm gives precedence to charging vehicles at charging stations that are outside of the company area.
- Possibility of several vehicles per route.
- Maximum number of iterations: the optimization process is terminated after a fixed number of iterations.
- Number of iterations without improvements: the optimization process is terminated after a fixed number of interactions without any iterations without any improvement.
- Minimum objective function error: the error between the obtained objective function value and the best fitness value is less than a prefixed anticipated threshold.
- Maximum number of particles (swarm size or number of neighbors). This parameter establishes the maximum number of particles that are generated in the prioritization algorithm based on the particle swarm optimization (PSO) algorithm.
- Maximum velocity (vmax) for the PSO algorithm [52] to ensure convergence. If this parameter is set to 0, a maximum velocity will not be obtained.
- Maximum particle position (xi,max) for the PSO algorithm [52] to retain the value of the particle position between [−xi,max, xi,max]. If this parameter is set to 0, a maximum position will not be obtained.
- Inertia weight (w) for PSO algorithm. A large inertia weight favors a global search, whereas a small inertia weigh favors a local search. If inertia is applied, it is sometimes linearly decreased during the iteration of the algorithm, beginning at an initial value that is close to 1.
- Modifiers for random number generation.
- Self-recognition component (must be a positive value).
- Coefficient of the social component (must be a positive value).
- Maximum and minimum velocity. These values establish the maximum variation of the solution.
- Population size.
- Only in a GA, the operator probabilities (mutation and crossover). These operators have a default value (0,1 for mutation and 0,9 for crossover); different values can be set.
5.5. Fitness Function
- The number of routes that have been assigned a vehicle and driver for the time requirements to perform the route. The first routes in time will have greater weight than the other routes.
- The number of routes that are assigned a vehicle and driver but exceed the time requirements to perform the route are significantly penalized.
- Queue balancing of a charging station. Standard deviation but with the total number of vehicles assigned to a route divided by the total number of charging stations.
- External charging. If external charging is configured, the system multiplies the fitness value by the total number of vehicles with external charging divided by the total number of vehicles assigned to a route.
- External charging priority. If external charging is permitted.
- Reuse of vehicles.
- Reuse of drivers.
- Assignation prioritization of external charging.
- Several vehicles per route.
- Instructions from higher VPPs.
6. Experimental Results
- Two smart business parks (A and B) with separate EV fleets. Company A is a company in the logistics sector, and company B is a company in the transport sector.
- Three public charging stations.
- Five private EVs.
- Two power retail companies. The first retailer has a contract for supply to company A. The second retailer has a contract for supply to company B. The retailer has three contracts for supply to private consumers.
- One power distribution company.
- An EMS is simulated. This system is configured to randomly generate a power consumption command in the EVPP. This power consumption command takes effect on 343 routes: 137 routes from company A and 206 routes from company B. This power consumption will be generated after a solution is obtained to assess the algorithm and address any changes in conditions.
- Companies A and B have an SBVPP. The characteristics of these companies are listed in Table 4. For each driver, EV, and charging station, some periods of unavailability are defined to check the capability of the algorithms to manage these contingencies.
- In this case, the private consumers are managed by the RVPP. In future research (refer to Section 8), the system will attempt to include a consumer VPP.
- Using only evolutionary algorithms based on GA.
- Using only evolutionary algorithms based on GAEC.
- Using only evolutionary algorithms based on PSO.
- Hybrid solution. All possible combinations (81 cases) were tested; however, only the best hybrid solution is shown in this paper. The best hybrid solution applies PSO in SBVPP and GAEC in the higher VPPs.
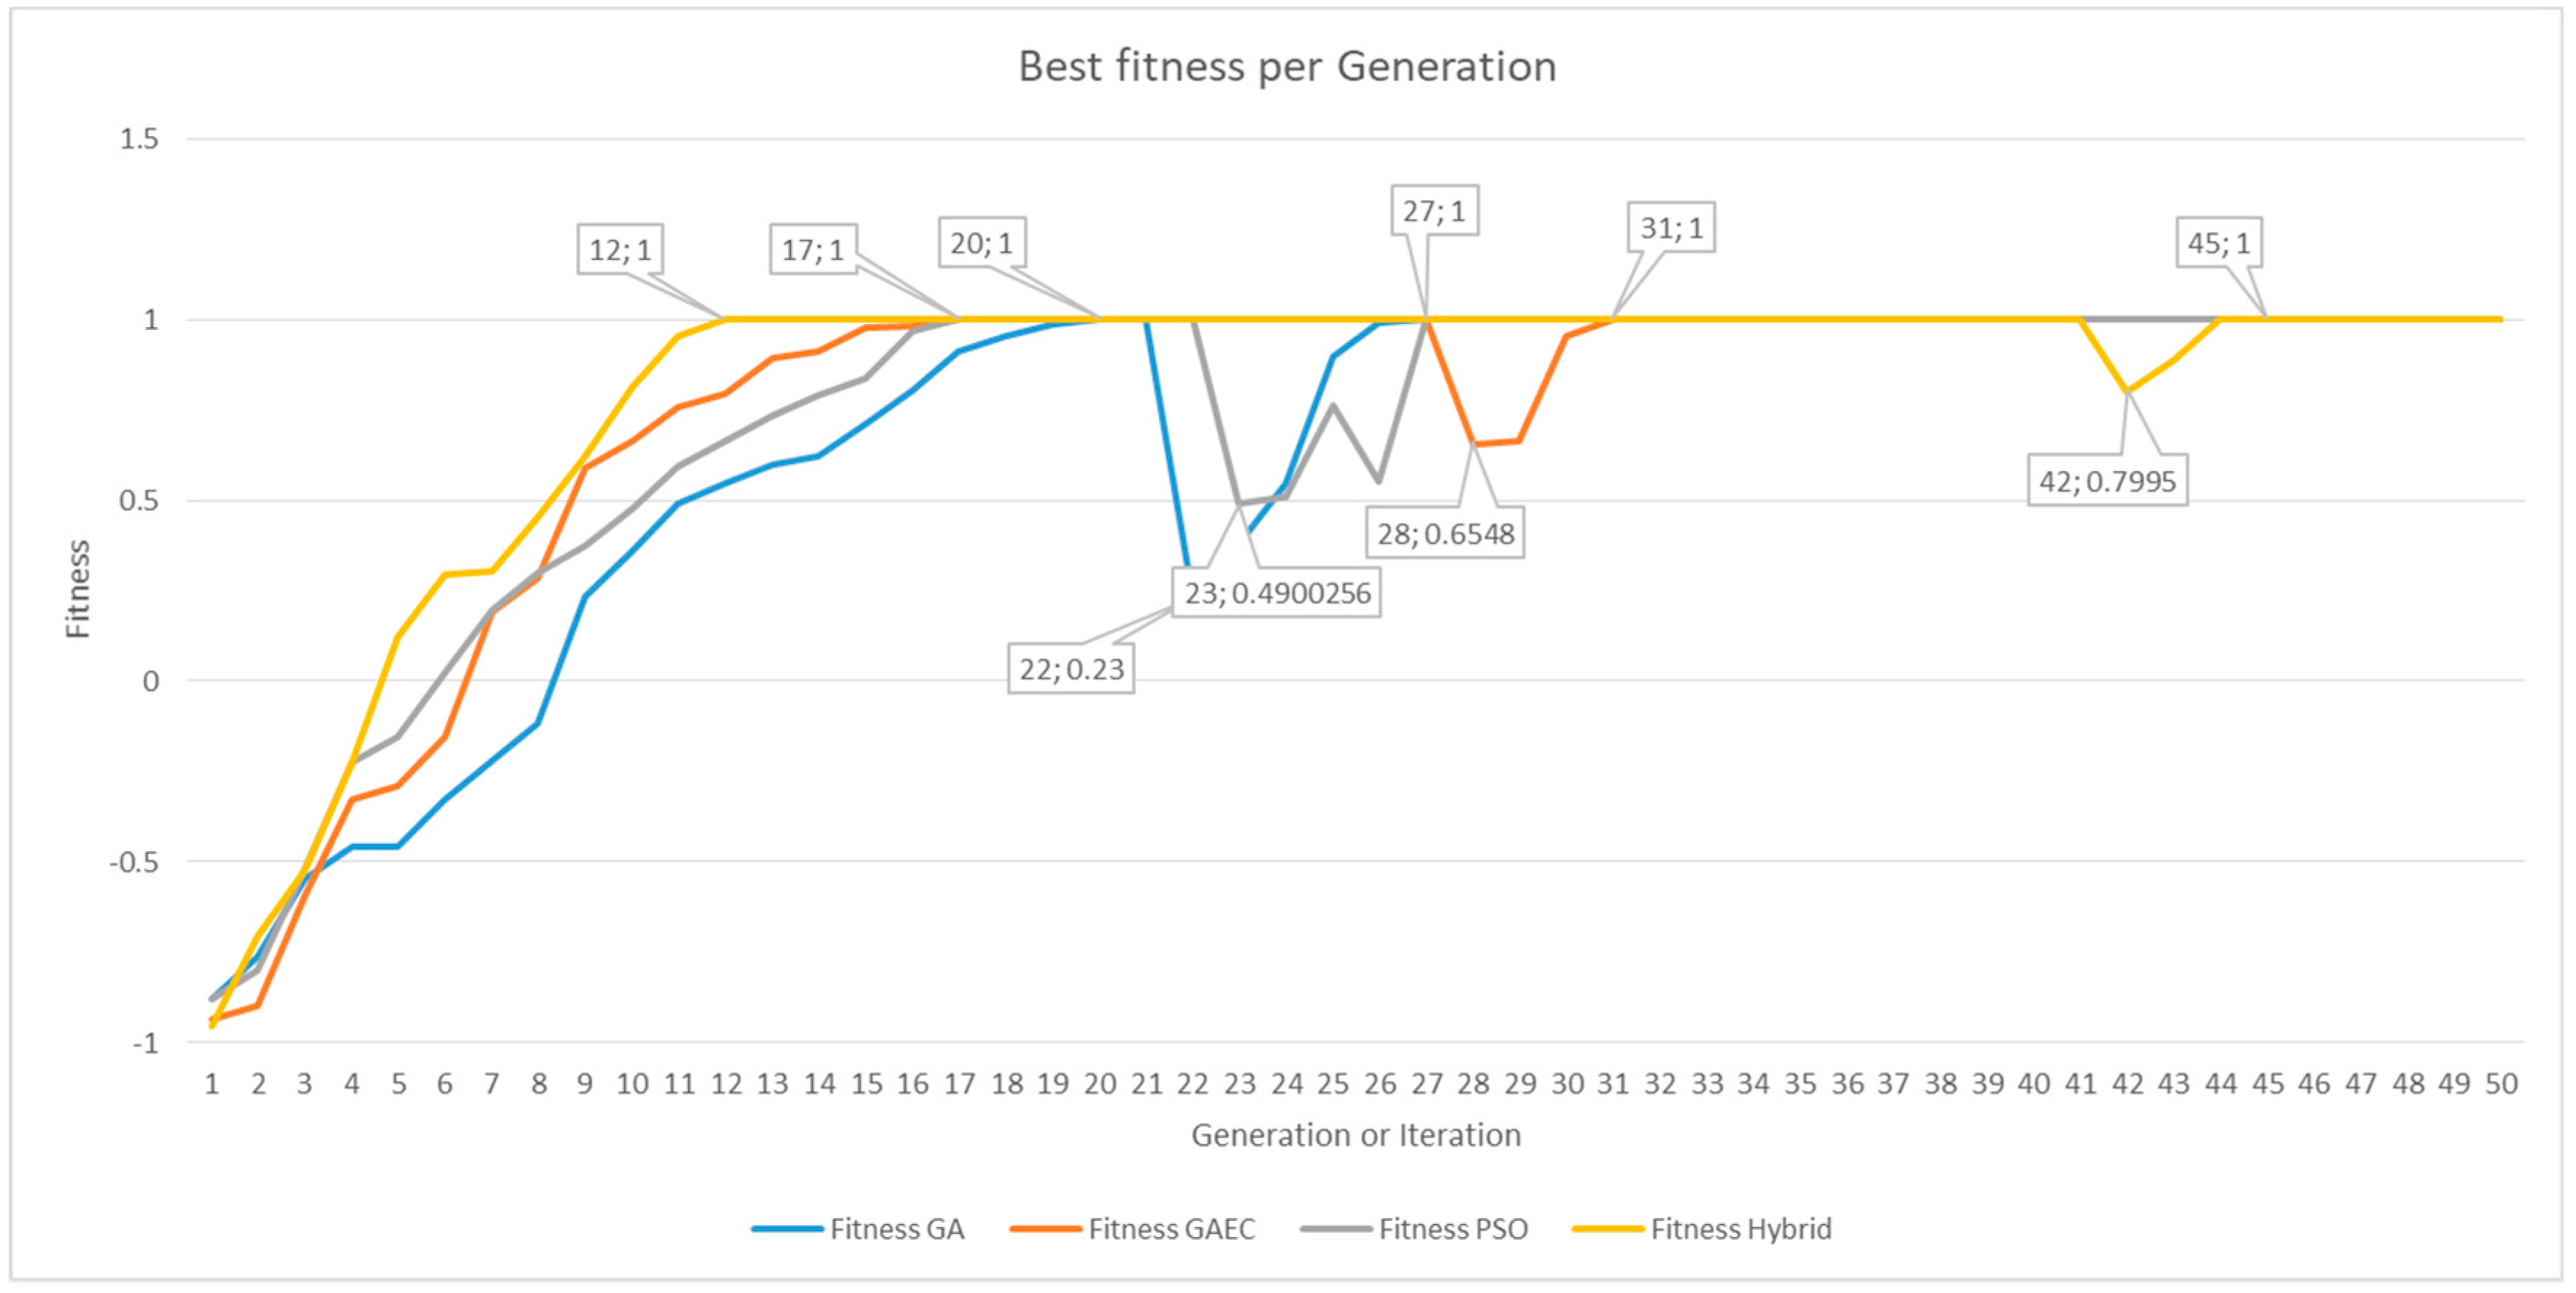
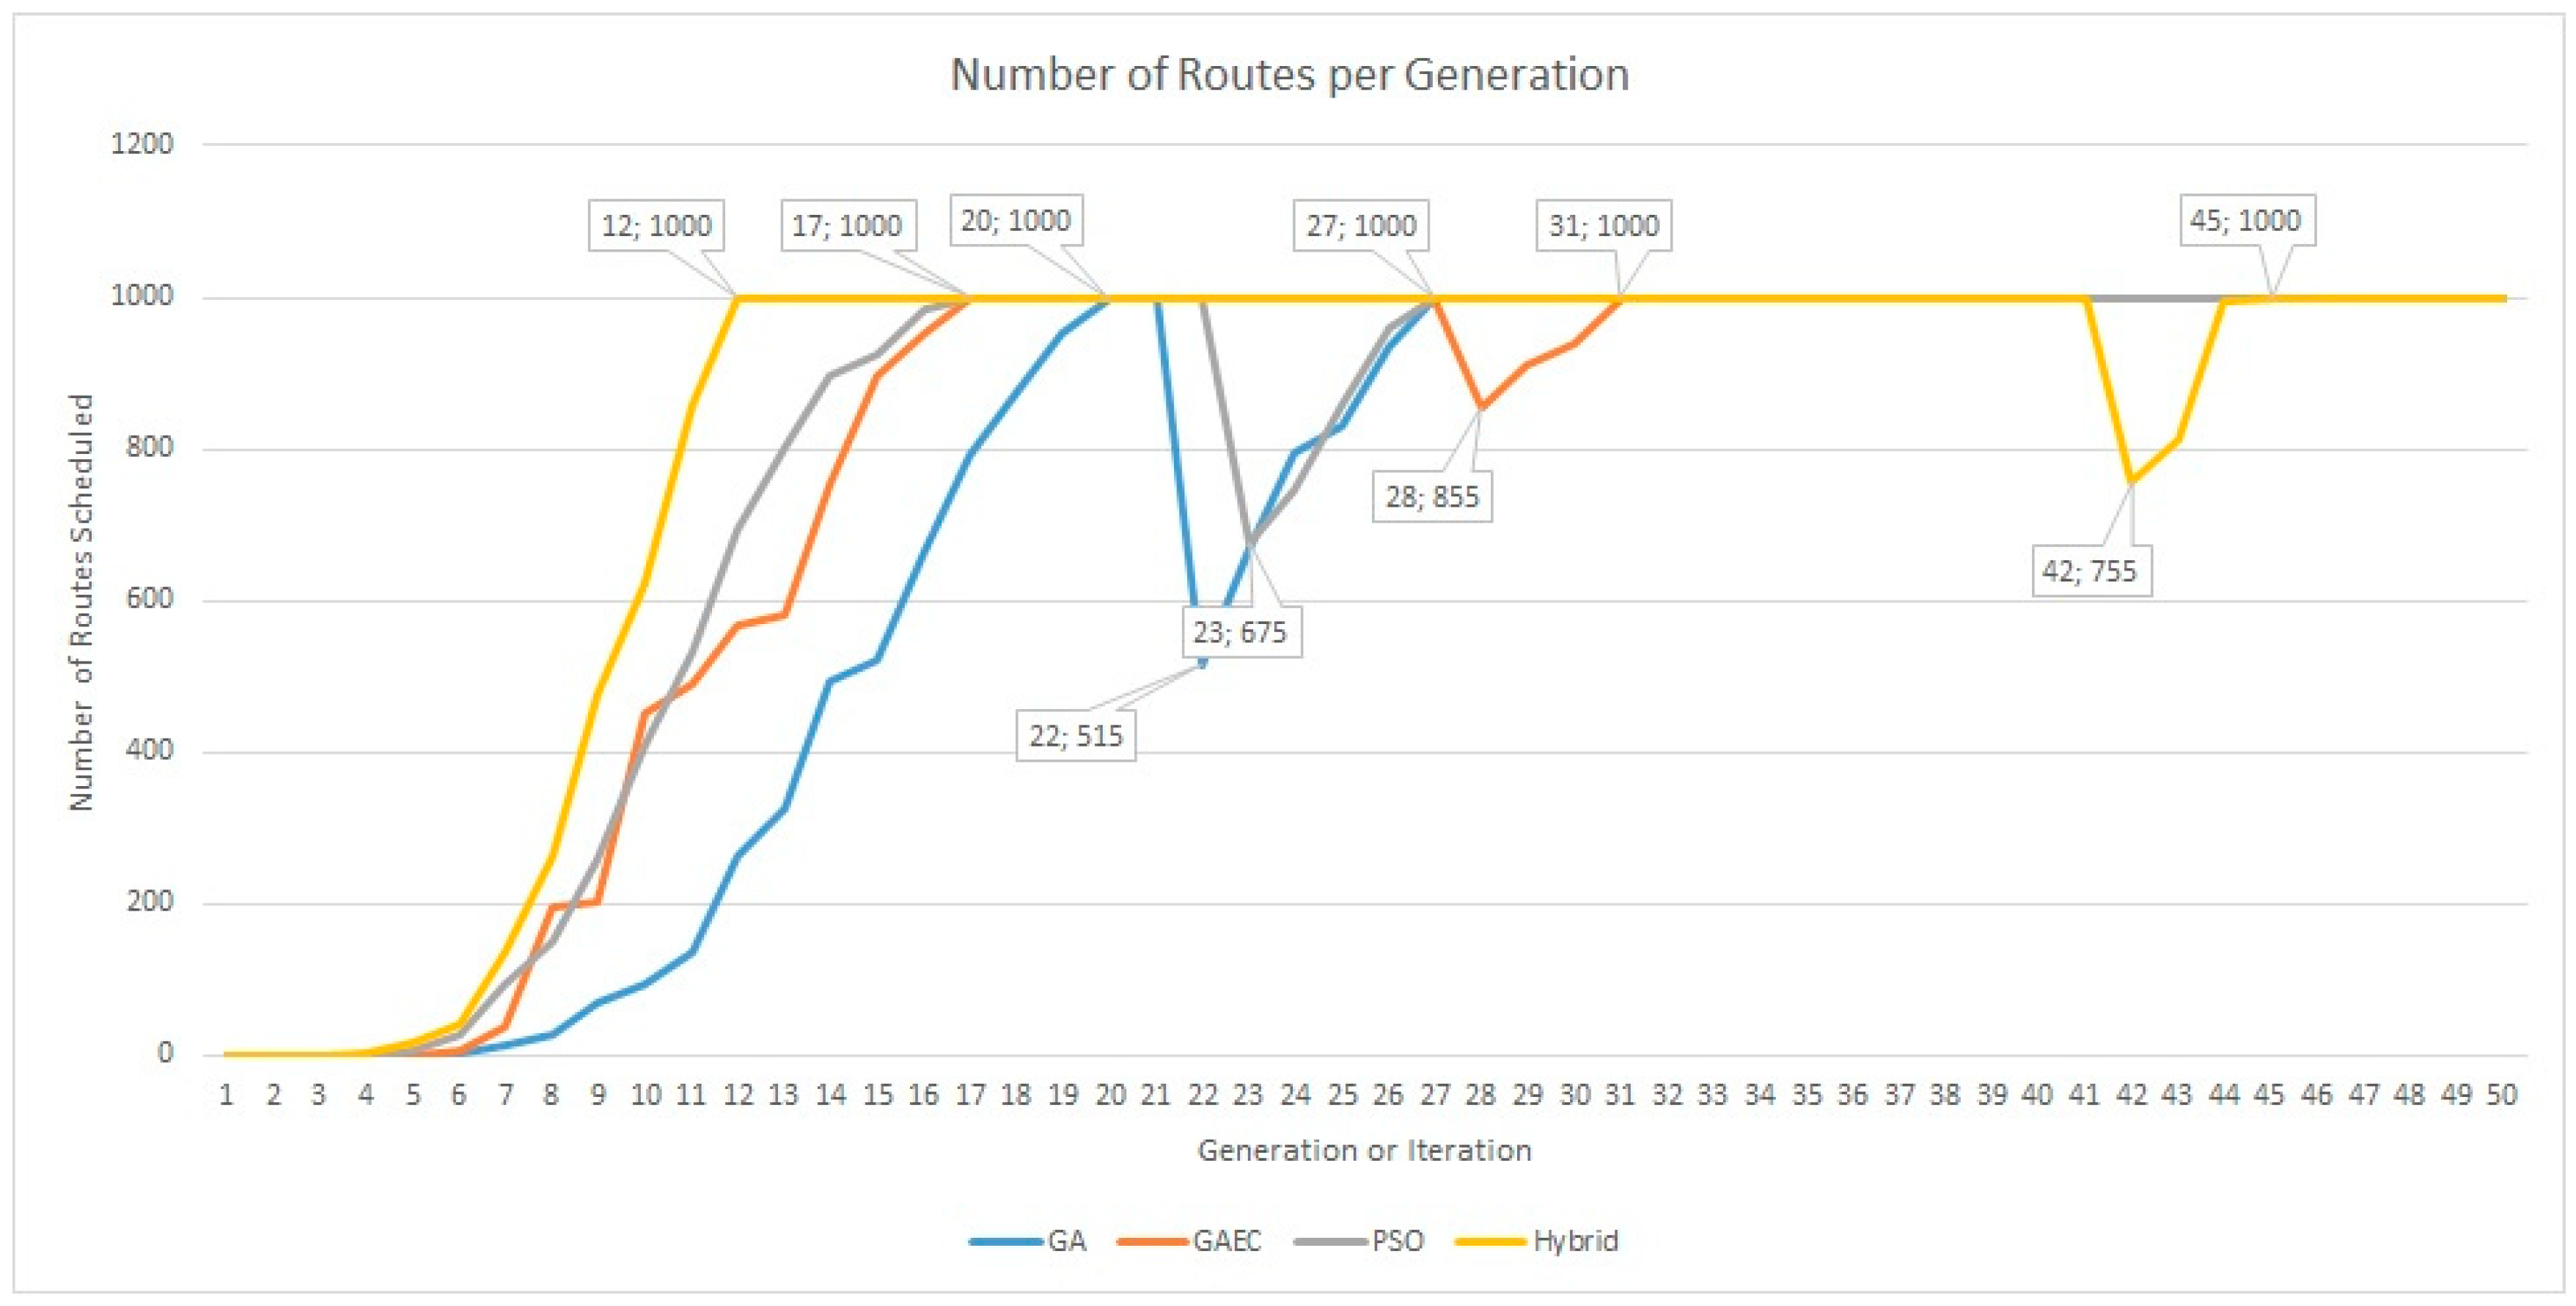
- Convergence time (tc). Time to reach a solution. The convergence time is measured in number of generations.
- Transient time (tt). Time to obtain a new solution when changes occur in the conditions of the problem. The transient time is measured in number of generations.
- GA and PSO exhibit the best trend.
- GAEC performs better in transient situations.
- The hybrid solution obtains better results because it takes advantage of all evolutionary algorithms.
7. Conclusions
- A model for the implementation of VPP, based on the interaction between different roles in the power supply: transportation, distribution, commercialization, and consumption (especially in the case of companies with EV fleets).
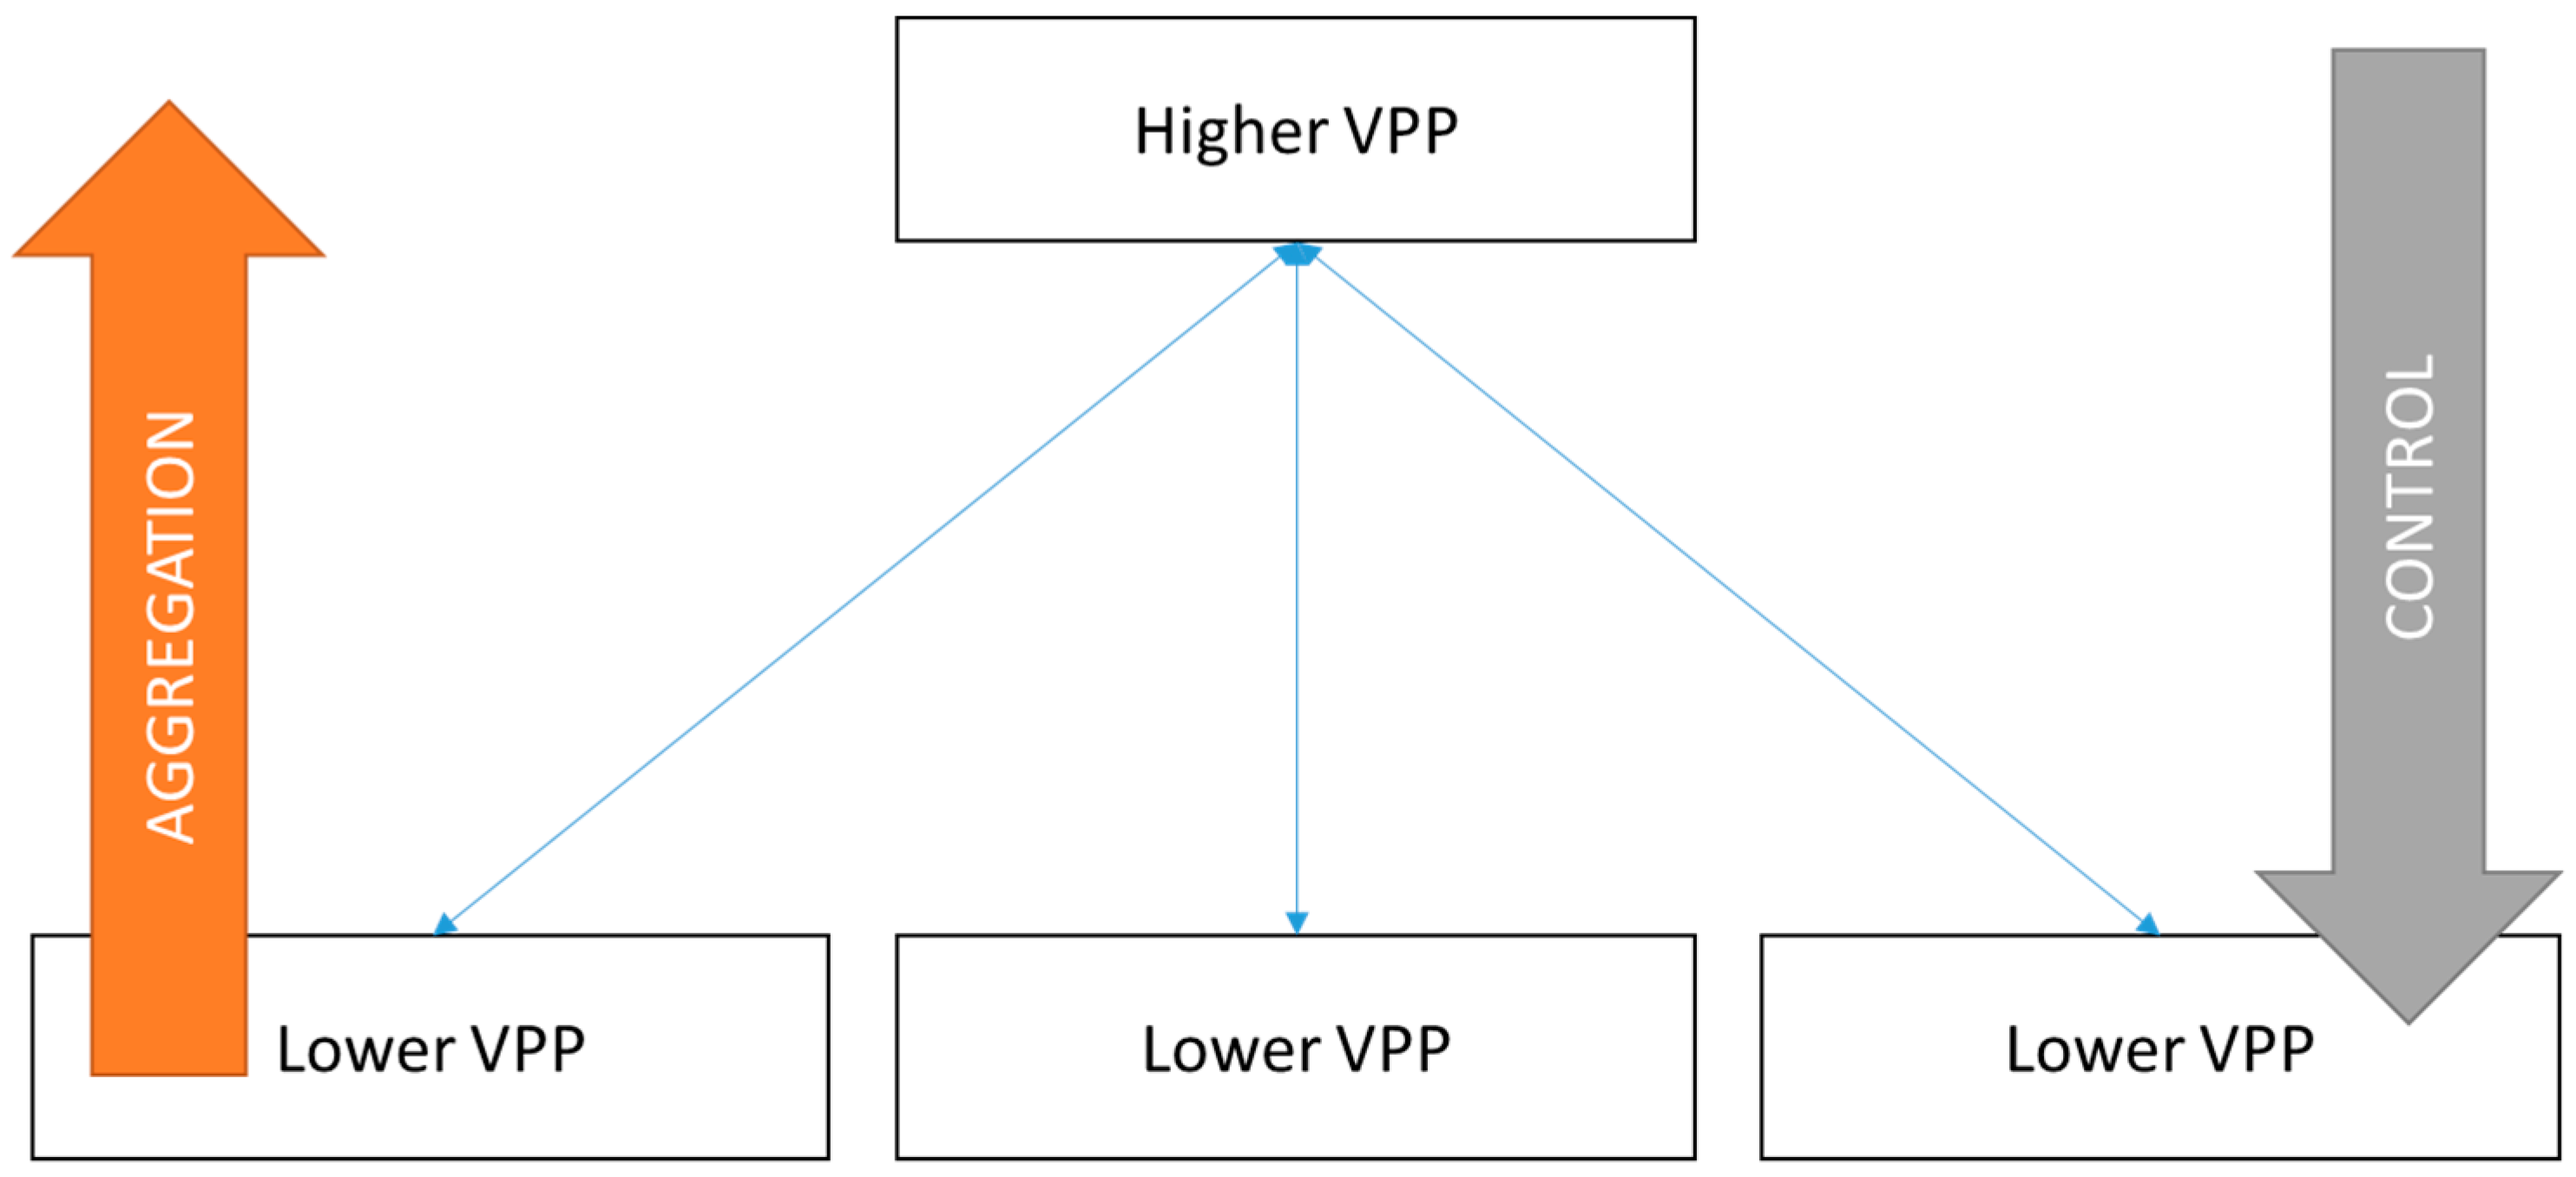
- Organizational chart functionality according to the level of VPP.
- Several distributed prioritization algorithms to manage the queues for private and public charging stations.
- A scalable framework to manage the EV fleet, to improve the efficiency in its management.
- A model of mobile load inside a power grid. The algorithm provides a load forecasting of mobile loads (storage or resources) and it calculate again in real time in case of unexpected incident or an additional EV is added.
- The reductions of emissions by vehicle fleet are about 75.2% compared with the conventional vehicles with fossil combustible. Additionally, the forecasting of mobile loads provided to the energy management systems could reduce the peaks in demand curve, decreasing the emissions by using cycled combined (which usually are based in fossil combustibles).
- The comparison between different energy management scenarios showing the Hybrid solution as the best solution to different scenarios.
- The aggregation in different levels decrease the response time of system at different levels, allowing to respond in real time. On the consumer side, the EV is charging with minimized waiting periods. On the retailer side, the retailer can offer different rates and services according to the demand forecasting. In the distribution and energy side, the asset management, the energy flow, and the demand peak shaving are simplified based on demand forecasting.
- The reduction of waiting time to charge the EV. The prioritization considers the minimization of the waiting time.
8. Future Research
- Develop an asset management system.
- Test the solution for personal EV vehicles in the prioritization process. The consumer VPP for an EV is in development.
- Update the fitness function to provide additional functionality in the emergency mode of the power grid.
- Develop a new algorithm to provide the best configuration options for the corresponding VPP.
- Develop a demand response management system to integrate an energy and capacity market based on blockchain and big data technologies.
Author Contributions
Conflicts of Interest
Acronyms
| Acronym | Definition |
| ANN | artificial neural network |
| CHP | combined heat and power |
| CIM | common information model |
| CIS | component interface specification |
| DEPF | distributed evolutionary prioritization framework |
| DER | distributed energy resources |
| DERMS | distributed energy resources management system |
| DRMS | Demand Response Management System |
| DSO | distribution system operators |
| DVPP | distribution virtual power plant |
| E-FSMFTW | electric fleet size and mix vehicle routing problem with time windows and recharging Stations |
| EV | electric vehicle |
| EVPP | energy virtual power plant |
| FNN | fuzzy neural network |
| GA | genetic algorithm |
| GAEC | genetic algorithm with evolution control |
| GVPP | generic virtual power plant |
| HEV | hybrid electric vehicle |
| ICT | information and communication technologies |
| IEC | international electrotechnical commission |
| LCM | longitudinal consumption model |
| NEDC | new European driving cycle |
| NIST | National Institute of Standards and Technology |
| PHEV | plug-in hybrid electric vehicle |
| PSO | particle swarm optimization |
| RDBMS | relational database management system |
| RVPP | retailer virtual power plant |
| SBVPP | smart business virtual power plant |
| SG | smart grid |
| SOA | service-oriented architecture |
| SoC | state of charge |
| TVPP | technical virtual power plant |
| V2G | vehicle to grid |
| VPP | virtual power plant |
| μSDM | μStep driving model |
References
- Meissner, E.; Richter, G. Battery Monitoring and Electrical Energy Management: Precondition for future vehicle electric power systems. J. Power Sources 2003, 116, 79–98. [Google Scholar] [CrossRef]
- Chau, K.T.; Wong, Y.S.; Chan, C.C. An overview of energy sources for electric vehicles. Energy Convers. Manag. 1999, 40, 1021–1039. [Google Scholar] [CrossRef]
- Nelson, R.F. Power requirements for batteries in hybrid electric vehicles. J. Power Sources 2000, 91, 2–26. [Google Scholar] [CrossRef]
- Gerssen-Gondelach, S.J.; Faaij, A.P.C. Performance of batteries for electric vehicles on short and longer term. J. Power Sources 2012, 212, 111–129. [Google Scholar] [CrossRef]
- Martel, F.; Dubé, Y.; Kelouwani, S.; Jaguemont, J.; Agbossou, K. Long-term assessment of economic plug-in hybrid electric vehicle battery lifetime degradation management through near optimal fuel cell load sharing. J. Power Sources 2016, 318, 270–282. [Google Scholar] [CrossRef]
- Marra, F.; Sacchetti, D.; Træholt, C.; Larsen, E. Electric vehicle requirements for operation in smart grids. In Proceedings of the 2011 2nd IEEE PES International Conference and Exhibition on Innovative Smart Grid Technologies (ISGT Europe), Manchester, UK, 5–7 December 2011; pp. 1–7. [Google Scholar]
- Masuch, N.; Keiser, J.; Lützenberger, M.; Albayrak, S. Wind power-aware vehicle-to-grid algorithms for sustainable EV energy management systems. In Proceedings of the Electric Vehicle Conference (IEVC), Greenville, SC, USA, 4–8 March 2012; pp. 1–7. [Google Scholar]
- Valentine, K.; Temple, W.; Thomas, R.J.; Zhang, K.M. Relationship between wind power, electric vehicles and charger infrastructure in a two-settlement energy market. Int. J. Electr. Power Energy Syst. 2016, 82, 225–232. [Google Scholar] [CrossRef] [Green Version]
- Giannouli, M.; Yianoulis, P. Study on the incorporation of photovoltaic systems as an auxiliary power source for hybrid and electric vehicles. Sol. Energy 2012, 86, 441–451. [Google Scholar] [CrossRef]
- Romero-Ruiz, J.; Pérez-Ruiz, J.; Martin, S.; Aguado, J.A.; De la Torre, S. Probabilistic congestion management using EVs in a smart grid with intermittent renewable generation. Electr. Power Syst. Res. 2016, 137, 155–162. [Google Scholar] [CrossRef]
- Ross, S.M. 8—Queueing Theory. In Introduction to Probability Models, 12th ed.; Ross, S.M., Ed.; Academic Press: Cambridge, MA, USA, 2019; pp. 507–589. ISBN 978-0-12-814346-9. [Google Scholar]
- Bachmat, E. Airplane boarding meets express line queues. Eur. J. Oper. Res. 2019, 275, 1165–1177. [Google Scholar] [CrossRef]
- Strielkina, A.; Uzun, D.; Kharchenko, V. Modelling of healthcare IoT using the queueing theory. In Proceedings of the 2017 9th IEEE International Conference on Intelligent Data Acquisition and Advanced Computing Systems: Technology and Applications (IDAACS), Bucharest, Romania, 21–23 September 2017; Volume 2, pp. 849–852. [Google Scholar]
- Lakshmi, C.; Appa Iyer, S. Application of queueing theory in health care: A literature review. Oper. Res. Health Care 2013, 2, 25–39. [Google Scholar]
- Pourvaziri, H.; Pierreval, H. Dynamic facility layout problem based on open queuing network theory. Eur. J. Oper. Res. 2017, 259, 538–553. [Google Scholar] [CrossRef]
- Babicheva, T.S. The Use of Queuing Theory at Research and Optimization of Traffic on the Signal-controlled Road Intersections. Procedia Comput. Sci. 2015, 55, 469–478. [Google Scholar] [CrossRef] [Green Version]
- Fedorenko, V.; Fedorenko, I.; Sukmanov, A.; Samoylenko, V.; Shlaev, D.; Atanov, I. Modeling of data acquisition systems using the queueing theory. Aeu-Int. J. Electron. Commun. 2017, 74, 83–87. [Google Scholar] [CrossRef]
- Apte, V. Performance Analysis of Distributed Software Systems: Approaches Based on Queueing Theory. In Proceedings of the 2007 Working IEEE/IFIP Conference on Software Architecture (WICSA’07), Mumbai, India, 6–9 January 2007; p. 39. [Google Scholar]
- Dielmann, K.; van der Velden, A. Virtual power plants (VPP)—A new perspective for energy generation? In Proceedings of the 9th International Scientific and Practical Conference of Students, Post-graduates Modern Techniques and Technologies, Tomsk, Russia, 7–11 April 2003; 18–20; pp. 18–20. [Google Scholar]
- Schulz, C.; Roder, G.; Kurrat, M. Virtual power plants with combined heat and power micro-units. In Proceedings of the 2005 International Conference on Future Power Systems, Amsterdam, The Netherlands, 16–18 November 2005; 2005; p. 5. [Google Scholar]
- Dimeas, A.L.; Hatziargyriou, N.D. Agent based control of Virtual Power Plants. In Proceedings of the International Conference on Intelligent Systems Applications to Power Systems, Kaohsiung, Taiwan, 5–8 November 2007; pp. 1–6. [Google Scholar]
- Pudjianto, D.; Ramsay, C.; Strbac, G. Virtual power plant and system integration of distributed energy resources. IET Renew. Power Gener. 2007, 1, 10–16. [Google Scholar] [CrossRef]
- Andersen, P.B.; Poulsen, B.; Decker, M.; Traeholt, C.; Ostergaard, J. Evaluation of a Generic Virtual Power Plant framework using service oriented architecture. In Proceedings of the Power and Energy Conference, Langkawi, Malaysia, 2–4 April 2008; pp. 1212–1217. [Google Scholar]
- Andersen, P.B.; Poulsen, B.; Træholt, C.; Østergaard, J. Using Service Oriented Architecture in a Generic Virtual Power Plant. In Proceedings of the Sixth International Conference on Information Technology: New Generations, ITNG (’09), Las Vegas, NV, USA, 27–29 April 2009; pp. 1621–1622. [Google Scholar]
- Kieny, C.; Berseneff, B.; Hadjsaid, N.; Besanger, Y.; Maire, J. On the concept and the interest of virtual power plant: Some results from the European project Fenix. In Proceedings of the IEEE Power Energy Society General Meeting (PES ’09), Calgary, AB, Canada, 26–30 July 2009; pp. 1–6. [Google Scholar]
- Mashhour, E.; Moghaddas-Tafreshi, S.M. The opportunities for future virtual power plant in the power market, a view point. In Proceedings of the 2009 International Conference on Clean Electrical Power, Capri, Italy, 9–11 June 2009; pp. 448–452. [Google Scholar]
- You, S.; Træholt, C.; Poulsen, B. Generic Virtual Power Plants: Management of distributed energy resources under liberalized electricity market. In Proceedings of the 8th International Conference on Advances in Power System Control, Operation and Management (APSCOM), Hong Kong, China, 8–11 November 2009; pp. 1–6. [Google Scholar]
- Binding, C.; Gantenbein, D.; Jansen, B.; Sundström, O.; Andersen, P.B.; Marra, F.; Poulsen, B.; Træholt, C. Electric vehicle fleet integration in the danish EDISON project—A virtual power plant on the island of Bornholm. In Proceedings of the IEEE PES General Meeting 2010, Minneapolis, MI, USA, 25–29 July 2010; pp. 1–8. [Google Scholar]
- Jansen, B.; Binding, C.; Sundstrom, O.; Gantenbein, D. Architecture and Communication of an Electric Vehicle Virtual Power Plant. In Proceedings of the 2010 First IEEE International Conference on Smart Grid Communications (SmartGridComm), Gaithersburg, MD, USA, 4–6 October 2010; pp. 149–154. [Google Scholar]
- Musio, M.; Lombardi, P.; Damiano, A. Vehicles to grid (V2G) concept applied to a Virtual Power Plant structure. In Proceedings of the 2010 XIX International Conference on Electrical Machines (ICEM), Rome, Italy, 6–8 September 2010; pp. 1–6. [Google Scholar]
- Skarvelis-Kazakos, S.; Papadopoulos, P.; Grau, I.; Gerber, A.; Cipcigan, L.M.; Jenkins, N.; Carradore, L. Carbon optimized Virtual Power Plant with Electric Vehicles. In Proceedings of the 45th International on Universities Power Engineering Conference (UPEC), Cardiff, UK, 31 August–3 September 2010; pp. 1–6. [Google Scholar]
- Raab, A.F.; Ferdowsi, M.; Karfopoulos, E.; Unda, I.G.; Skarvelis-Kazakos, S.; Papadopoulos, P.; Abbasi, E.; Cipcigan, L.M.; Jenkins, N.; Hatziargyriou, N.; et al. Virtual Power Plant Control concepts with Electric Vehicles. In Proceedings of the 2011 16th International Conference on Intelligent System Application to Power Systems (ISAP); IEEE: Piscataway, NJ, USA, 2011; pp. 1–6. [Google Scholar]
- Sanduleac, M.; Eremia, M.; Toma, L.; Borza, P. Integrating the Electrical Vehicles in the Smart Grid through unbundled Smart Metering and multi-objective Virtual Power Plants. In Proceedings of the 2011 2nd IEEE PES International Conference and Exhibition on Innovative Smart Grid Technologies (ISGT Europe), Manchester, UK, 5–7 December 2011; pp. 1–8. [Google Scholar]
- Marra, F.; Sacchetti, D.; Pedersen, A.B.; Andersen, P.B.; Traholt, C.; Larsen, E. Implementation of an Electric Vehicle test bed controlled by a Virtual Power Plant for contributing to regulating power reserves. In Proceedings of the 2012 IEEE Power and Energy Society General Meeting, San Diego, CA, USA, 22–26 July 2012; pp. 1–7. [Google Scholar]
- He, Y.; Chowdhury, M.; Ma, Y.; Pisu, P. Merging mobility and energy vision with hybrid electric vehicles and vehicle infrastructure integration. Energy Policy 2012, 41, 599–609. [Google Scholar] [CrossRef]
- Mansour, S.; Harrabi, I.; Maier, M.; Joós, G. Co-simulation study of performance trade-offs between centralised, distributed, and hybrid adaptive PEV charging algorithms. Comput. Netw. 2015, 93, 153–165. [Google Scholar] [CrossRef]
- Hiermann, G.; Puchinger, J.; Ropke, S.; Hartl, R.F. The Electric Fleet Size and Mix Vehicle Routing Problem with Time Windows and Recharging Stations. Eur. J. Oper. Res. 2016, 252, 995–1018. [Google Scholar] [CrossRef] [Green Version]
- Hu, J.; Morais, H.; Sousa, T.; Lind, M. Electric vehicle fleet management in smart grids: A review of services, optimization and control aspects. Renew. Sustain. Energy Rev. 2016, 56, 1207–1226. [Google Scholar] [CrossRef] [Green Version]
- Wu, X.; Aviquzzaman, Md.; Lin, Z. Analysis of plug-in hybrid electric vehicles’ utility factors using GPS-based longitudinal travel data. Transp. Res. Part C Emerg. Technol. 2015, 57, 1–12. [Google Scholar] [CrossRef]
- De Cauwer, C.; Van Mierlo, J.; Coosemans, T. Energy Consumption Prediction for Electric Vehicles Based on Real-World Data. Energies 2015, 8, 8573–8593. [Google Scholar] [CrossRef]
- Shankar, R.; Marco, J. Method for estimating the energy consumption of electric vehicles and plug-in hybrid electric vehicles under real-world driving conditions. IET Intell. Transp. Syst. 2013, 7, 138–150. [Google Scholar] [CrossRef]
- Park, J.; Chen, Z.; Kiliaris, L.; Kuang, M.L.; Masrur, M.A.; Phillips, A.M.; Murphey, Y.L. Intelligent Vehicle Power Control Based on Machine Learning of Optimal Control Parameters and Prediction of Road Type and Traffic Congestion. IEEE Trans. Veh. Technol. 2009, 58, 4741–4756. [Google Scholar] [CrossRef]
- Boriboonsomsin, K.; Barth, M.J.; Zhu, W.; Vu, A. Eco-Routing Navigation System Based on Multisource Historical and Real-Time Traffic Information. IEEE Trans. Intell. Transp. Syst. 2012, 13, 1694–1704. [Google Scholar] [CrossRef]
- Bingham, C.; Walsh, C.; Carroll, S. Impact of driving characteristics on electric vehicle energy consumption and range. IET Intell. Transp. Syst. 2012, 6, 29–35. [Google Scholar] [CrossRef]
- Lee, J.; Kang, M.-J.; Park, G.-L. Battery Consumption Modeling for Electric Vehicles Based on Artificial Neural Networks. Lect. Notes Comput. Sci. 2014, 733–742. [Google Scholar]
- Lee, D.-T.; Shiah, S.-J.; Lee, C.-M.; Wang, Y.-C. State-of-Charge Estimation for Electric Scooters by Using Learning Mechanisms. Ieee Trans. Veh. Technol. 2007, 56, 544–556. [Google Scholar] [CrossRef]
- Schaltz, E. Electrical Vehicle Design and Modeling. Electr. Veh.-Model. Simul. 2011. [Google Scholar] [Green Version]
- Chan, C.C.; Bouscayrol, A.; Chen, K. Electric, Hybrid, and Fuel-Cell Vehicles: Architectures and Modeling. IEEE Trans. Veh. Technol. 2010, 59, 589–598. [Google Scholar] [CrossRef]
- Regulation No 101 of the Economic Commission for Europe of the United Nations (UN/ECE). Off. J. Eur. Union 2007, 158, 34–105.
- Holland, J.H. Adaptation in Natural and Artificial Systems: An Introductory Analysis with Applications to Biology, Control and Artificial Intelligence; MIT Press: Cambridge, MA, USA, 1992; ISBN 978-0-262-08213-6. [Google Scholar]
- Goldberg, D.E. Genetic Algorithms in Search, Optimization and Machine Learning, 1st ed.; Addison-Wesley Longman Publishing Co., Inc.: Boston, MA, USA, 1989; ISBN 978-0-201-15767-3. [Google Scholar]
- Clerc, M.; Kennedy, J. The particle swarm—Explosion, stability, and convergence in a multidimensional complex space. IEEE Trans. Evol. Comput. 2002, 6, 58–73. [Google Scholar] [CrossRef]


| Entity | Description |
|---|---|
| Vehicle | Technical information about vehicles and their batteries. |
| Driver | Information about driver patterns. |
| Asset | Information about asset management. |
| Charging station | Technical information about charging stations. |
| Routes | Information about pending and assigned routes. |
| Charging configuration | Current configuration for prioritization algorithm. |
| Connection types | Parametric information about technical characteristics of different connection types for vehicles and charging stations. |
| Periods | Establishes the expected periods of availability and non-availability for each vehicle and charging station. |
| Measurement | Different measures gathered from charging stations and power register. |
| External contingencies | Information about traffic, roadwork, and topology. |
| Additional Entities | Description |
|---|---|
| Historical vehicles | Historical information about vehicles: mechanical problems and statistics. |
| Historical charging prioritization | Historical information about calculated charging prioritization and real information about charging stations. This information is stored to determine the difference between the expected charging process and the real charging process. This information will be useful to improve models for charging prioritization. |
| Historical routes | Historical information about different routes stored in the system, and statistical information. |
| Historical drivers | Historical information about drivers will be used in the driver pattern modeling. |
| Historical charging stations | Historical information about usage of charging stations. |
| Historical configurations | Historical information about configuration of prioritization. |
| Historical periods | Historical information about periods configured in the system. |
| Historical information about external contingencies | Historical information about traffic and roadwork. |
| Historical information about the weather | Information about weather conditions. |
| Historical information about traffic | Information about traffic conditions and accidents. |
| Historical information about the execution and configurations | Information about the execution, configuration, and results of configurations. |
| Parameter | Group | Associated to |
|---|---|---|
| μStep distance | μStep information | μSDM |
| μStep start elevation | μSDM | |
| μStep final elevation | μSDM | |
| μStep estimated time | μSDM | |
| Traffic congestion level | Traffic information | μSDM |
| Driver style | Driver information | μSDM, LCM |
| Precipitation level | Weather information | μSDM, LCM |
| Average temperature | μSDM, LCM | |
| Sunrise/sunset time | μSDM, LCM | |
| ECO mode state | EV dynamics variables | μSDM, LCM |
| Additional mass (passengers, baggage, etc.) | LCM | |
| Initial SoC | LCM | |
| Vehicle mass | EV constant characteristics | LCM |
| Eq. mass of rotating parts | LCM | |
| Maximum acceleration | μSDM, LCM | |
| Frontal area | LCM | |
| Friction resistance coefficient | LCM | |
| Drag coefficient | LCM | |
| Performance internal systems (inverter + engine + transmission) | LCM | |
| A/C consumption | LCM | |
| Heating consumption | LCM | |
| Cooling consumption | LCM | |
| Light consumption | LCM | |
| Power steering consumption | LCM | |
| Secondary consumptions (light panels, control systems, etc.) | LCM | |
| Battery performance | LCM | |
| Battery capacity | LCM | |
| Battery voltage | LCM | |
| Maximum recovery capacity | LCM |
| Characteristics | Company A | Company B |
|---|---|---|
| Number of routes | 400 | 600 |
| Number of EVs | 6 | 10 |
| Number of drivers | 5 | 7 |
| Number of charging stations | 2 | 2 |
| Number of plugs by charging station | 2 | 3 |
| Power of charging stations | DC 50 kW/AC 43 kVA | DC 50 kW/AC 43 kVA |
| Time of fast-charge (0–80%) | 30 minutes | 30 minutes |
| Test Scenarios | tc (Number of Generations) | tt (Number of Generations) |
|---|---|---|
| Only GA | 20 | 5 |
| Only GAEC | 17 | 3 |
| Only PSO | 17 | 4 |
| Hybrid Solution | 12 | 3 |
© 2019 by the authors. Licensee MDPI, Basel, Switzerland. This article is an open access article distributed under the terms and conditions of the Creative Commons Attribution (CC BY) license (http://creativecommons.org/licenses/by/4.0/).
Share and Cite
Guerrero, J.I.; Personal, E.; García, A.; Parejo, A.; Pérez, F.; León, C. Distributed Charging Prioritization Methodology Based on Evolutionary Computation and Virtual Power Plants to Integrate Electric Vehicle Fleets on Smart Grids. Energies 2019, 12, 2402. https://doi.org/10.3390/en12122402
Guerrero JI, Personal E, García A, Parejo A, Pérez F, León C. Distributed Charging Prioritization Methodology Based on Evolutionary Computation and Virtual Power Plants to Integrate Electric Vehicle Fleets on Smart Grids. Energies. 2019; 12(12):2402. https://doi.org/10.3390/en12122402
Chicago/Turabian StyleGuerrero, J.I., Enrique Personal, Antonio García, Antonio Parejo, Francisco Pérez, and Carlos León. 2019. "Distributed Charging Prioritization Methodology Based on Evolutionary Computation and Virtual Power Plants to Integrate Electric Vehicle Fleets on Smart Grids" Energies 12, no. 12: 2402. https://doi.org/10.3390/en12122402