A Novel Analytical Modeling of a Loop Heat Pipe Employing Thin-Film Theory: Part II—Experimental Validation


1
Department of Fire & Disaster Prevention Engineering, Changshin University, 262 Palyong-ro, Masanhoewon-gu, Changwon-si, Gyeongsangnam-do 51532, Korea
2
School of Aerospace and Mechanical Engineering, Korea Aerospace University, Hwajeon, Goyang, Gyeonggi-do 10540, Korea
*
Author to whom correspondence should be addressed.
Energies 2019, 12(12), 2403; https://doi.org/10.3390/en12122403
Submission received: 18 April 2019
/
Revised: 11 June 2019
/
Accepted: 19 June 2019
/
Published: 22 June 2019
(This article belongs to the Collection Advances in Heat Transfer Enhancement)
Abstract
:Part I of this study introduced a mathematical model capable of predicting the steady-state performance of a loop heat pipe (LHP) with enhanced rationality and accuracy. Additionally, investigation of the effect of design parameters on the LHP thermal performance was also reported in Part I. The objective of Part II is to experimentally verify the utility of the steady-state analytical model proposed in Part I. To this end, an experimental device comprising a flat-evaporator LHP (FLHP) was designed and fabricated. Methanol was used as the working fluid, and stainless steel as the wall and tubing-system material. The capillary structure in the evaporator was made of polypropylene wick of porosity 47%. To provide vapor removal passages, axial grooves with inverted trapezoidal cross-section were machined at the inner wall of the flat evaporator. Both the evaporator and condenser components measure 40 × 50 mm (W × L). The inner diameters of the tubes constituting the liquid- and vapor-transport lines measure 2 mm and 4 mm, respectively, and the lengths of these lines are 0.5 m. The maximum input thermal load was 90 W in the horizontal alignment with a coolant temperature of 10 °C. Validity of the said steady-state analysis model was verified for both the flat and cylindrical evaporator LHP (CLHP) models in the light of experimental results. The observed difference in temperature values between the proposed model and experiment was less than 4% based on the absolute temperature. Correspondingly, a maximum error of 6% was observed with regard to thermal resistance. The proposed model is considered capable of providing more accurate performance prediction of an LHP.
1. Introduction
Since the original development in the early 1970s, a loop heat pipe (LHP) has been found to be a highly useful means not only for the realization of reliable temperature control in advanced space applications but also for efficient cooling of electronic devices in various commercial and industrial applications [1]. LHPs can be classified as two-phase heat transfer devices that offer advantages of superior heat transfer performance, long-distance heat transport with minimal pressure losses, excellent performance against gravity, and flexible utility across a wide range of applications when compared with conventional heat pipes. A number of studies has been performed on the design and fabrication of different LHP evaporator shapes, such as flat, cylindrical, and disk, as typically found in refs. [1,2,3,4]. On the other hand, the condenser was designed and manufactured in a variety of ways to facilitate flexibility of use in cooling and other practical applications [1,2]. Recent applications include employment of LHP systems to enhance renewable energy conversion efficiencies: the relevant studies can be found in solar photovoltaic cooling applications [3,4,5,6], solar thermal energy for hot-water production [7,8], and solar power generation systems [9]. Their use also serves to enhance the heat-exchange performance in HVAC systems [10,11,12].
Although LHP systems have been developed and fabricated in various shapes to suit numerous purposes and industrial applications, their basic operating principle is identical to that of the conventional heat pipe, as described in detail in several studies [1,2,3]. A brief summary of the LHP operation can be described as follows. When a certain input thermal load is applied at the heating surface of the evaporator, thermal energy is first transferred to the capillary structure via the vapor-removal groove. Subsequent to heat transfer to the capillary structure, liquid–vapor interfaces are created within pores therein, and the surface tension of the liquid results in creation of the capillary pressure responsible for circulation of the working fluid along the entire loop and subsequent transfer of vapor to the condenser inlet. As vapor flows along the condenser path, it is transformed into a condensed and cooled liquid, which in turn, is transferred back to the evaporator after being returned to the liquid reservoir, thereby completing the LHP operating cycle.
Recent studies concerning LHP fabrication have highlighted the use of prospective methods for enhancement of their heat-transfer performance. Typically, quite a few studies concerning bi-porous wick structures have been reported [13,14,15], to facilitate realization of improvement in capillary force. In the bi-porous wick structure, the smaller pore wicks were placed in the region adjacent to the heating surface, while the larger pore wicks were placed in regions adjacent to the liquid reservoir to reduce resistance to liquid flow through the wick structure. In these studies, a screen-mesh wick was additionally used as a secondary wick to ensure tight contact between the primary wick and hot surface, along with adequate expansion of the evaporator active zone. Xu et al. [16] reported fabrication of a porous structure with three different pore sizes to be used in combination with LHPs with a view to reducing the flow resistance and enhancing the effect of the capillary force. Corresponding experimental results have also been reported. He et al. [17] designed and tested a strengthened ribbed-plate structure for preventing the deformation of flat evaporators, which otherwise are vulnerable to high vapor pressures of working fluids, such as ammonia. Chernysheva and Maydanik [18] presented an analytical model concerning an evaporator with a flat-disk shape for use when the wick structure became completely wet. In particular, they demonstrated accurate prediction of the temperature distribution within the evaporator under conditions wherein the heat and mass flows occur in the opposite directions.
Up to the present time, a more elaborate model has yet to be developed that is capable of accurately predicting the overall operating performance of the entire LHP system. At the same time, the developed model should prove its validity through corresponding experiments.
The purpose of this study is to experimentally verify the utility of the proposed steady-state mathematical model, developed in Part I of this research, for use in numerical analysis and simulation of LHP systems. To this end, a flat evaporator LHP (FLHP) was fabricated as a test device to be used during experiments. The corresponding results obtained via experiments and numerical predictions were compared with each other, and similarities and discrepancies therein are accordingly discussed.
2. Experimental Setup and Procedure
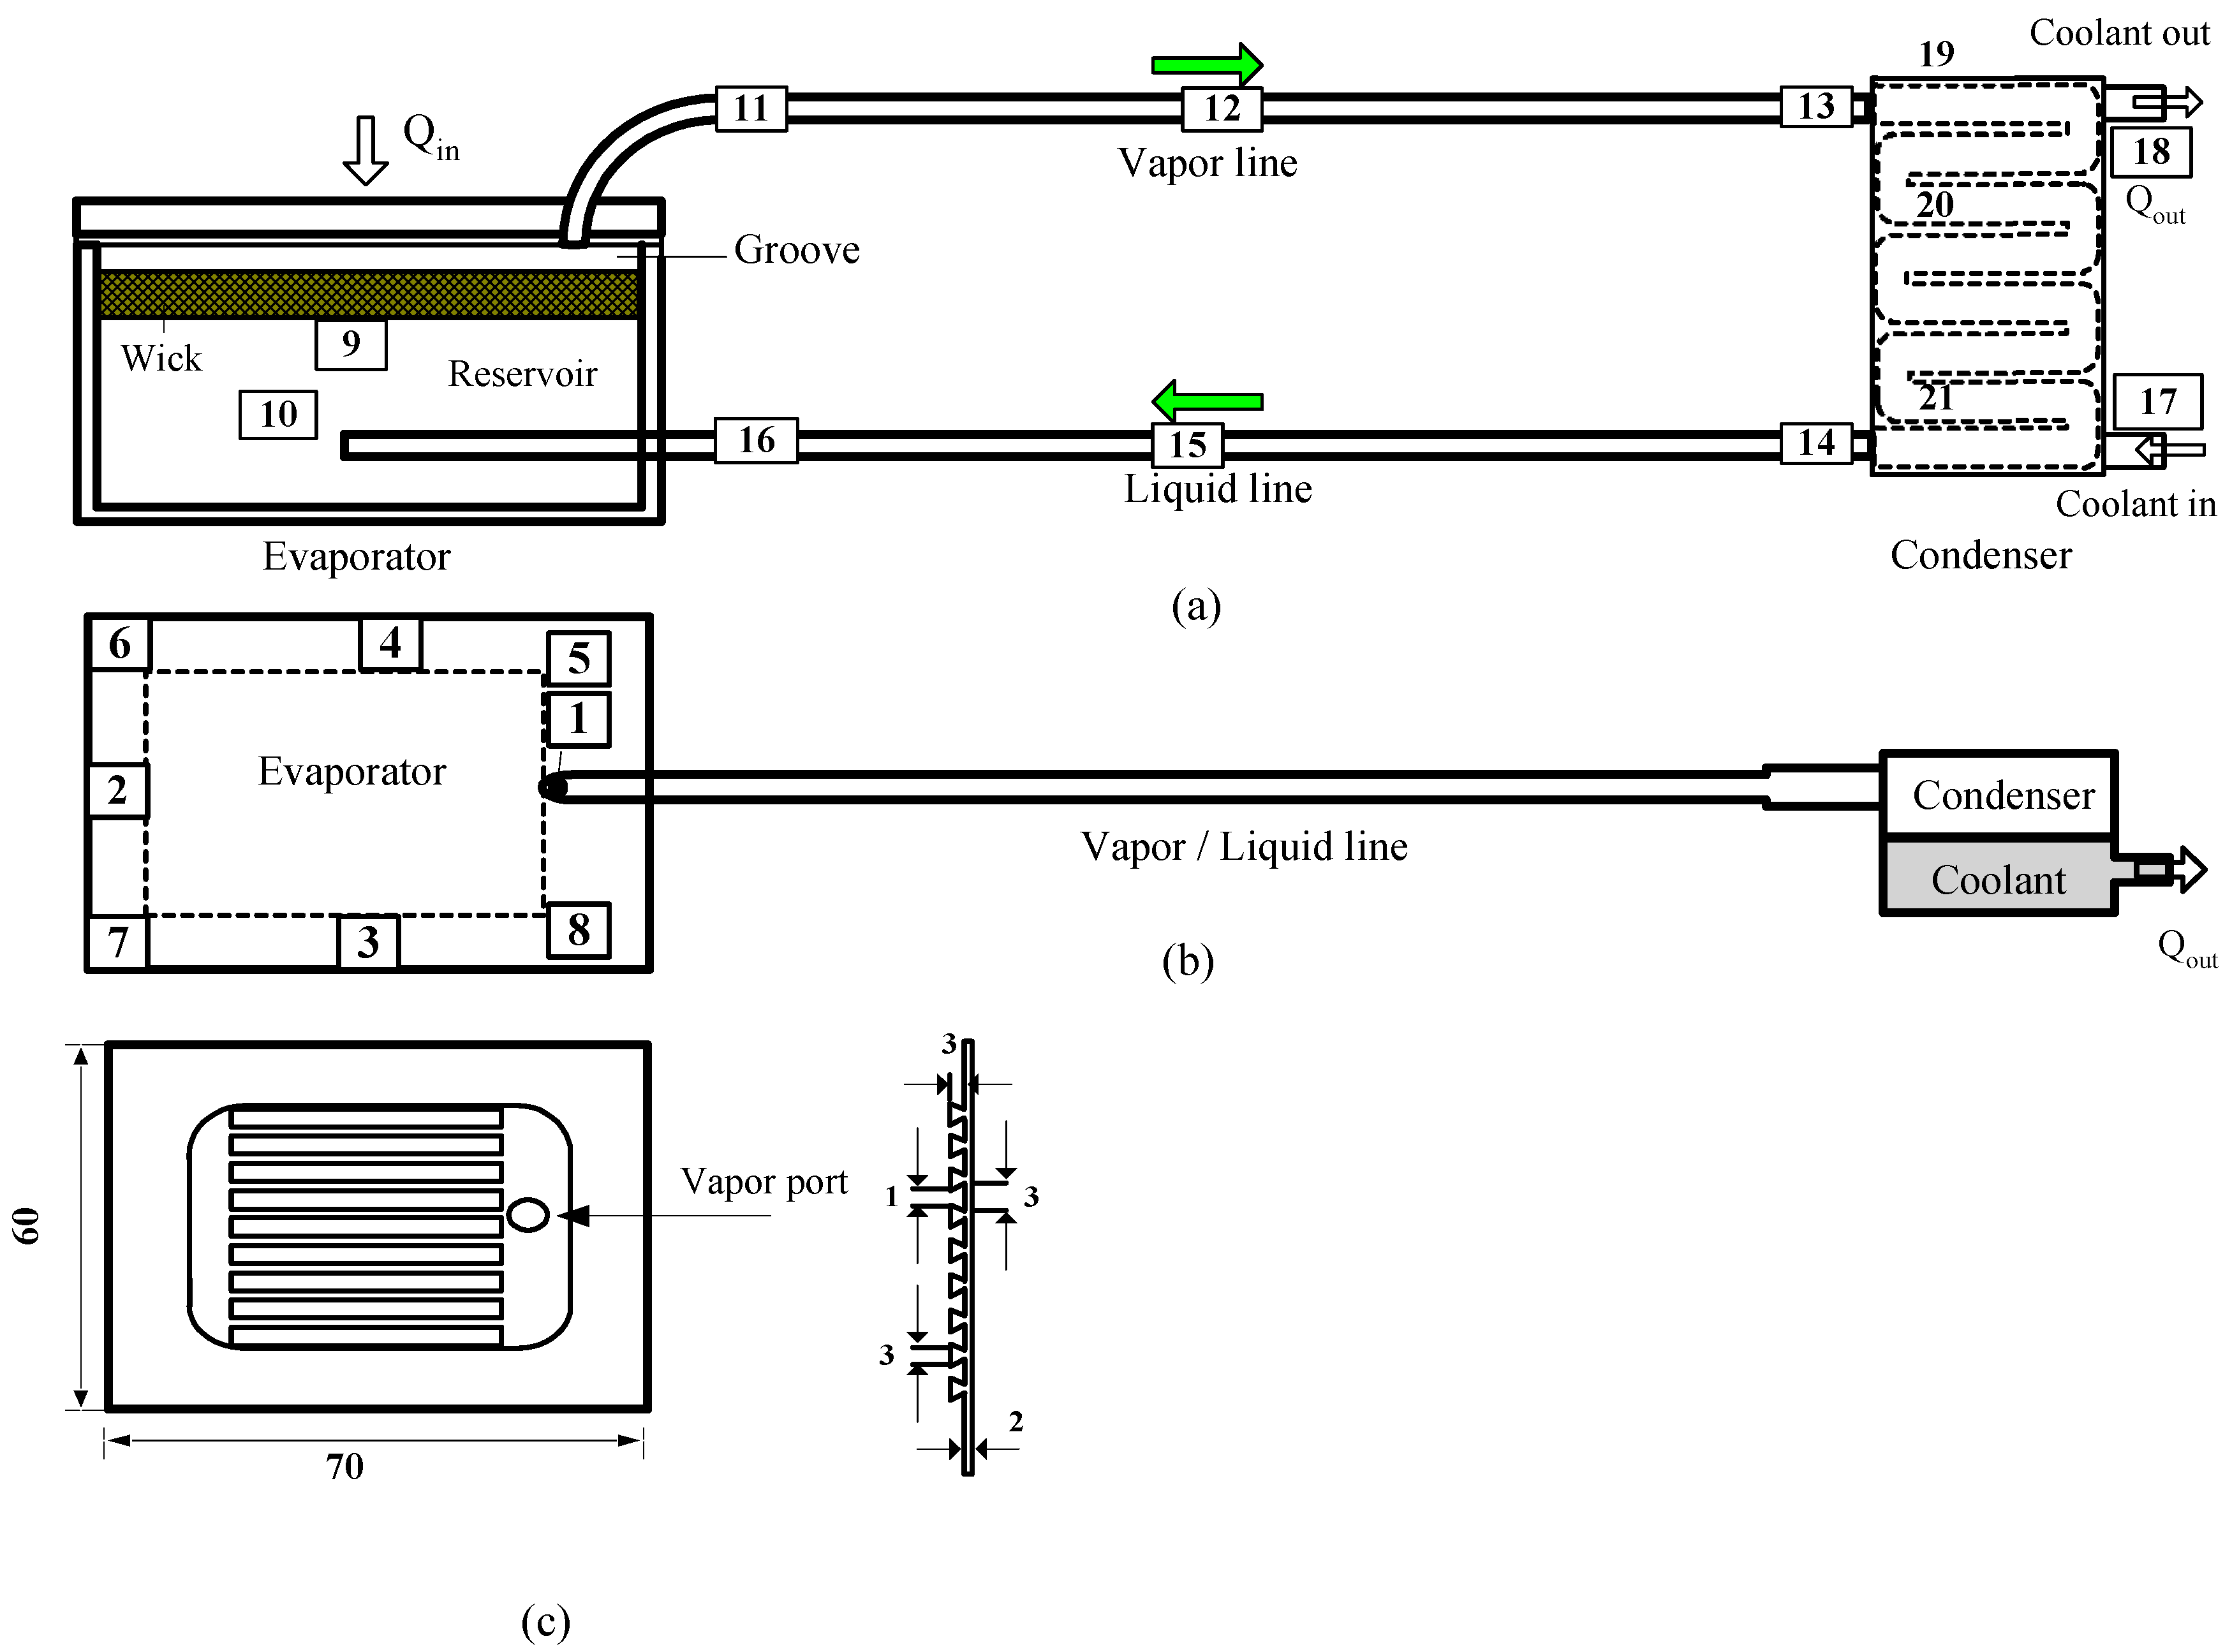
The experimental device in this study was identical to the model described in ref. [19]. Figure 1 depicts a schematic of the LHP, including thermocouple locations. The container and tubing were made of stainless steel, with methanol as the working fluid. Experimental results for the thermal performance of the basic LHP are extensively provided in ref. [19]. However, a series of experiments was independently conducted through this study to compare with the prediction model.
The evaporator of the FLHP configuration considered in this study was of a type suitable for use in local-temperature control and cooling of electronic devices. External dimensions of the evaporator attached to the liquid reservoir measured 40 × 50 × 30 mm (W × L × H). The heating area measured 35 × 35 mm2. Nine axial grooves with trapezoidal cross-sections were designed within the flat evaporator to serve as vapor passages. A heater block comprising three cartridge-type heaters was used as the heat source. The geometric size of the LHP fabricated in this study was determined in accordance with the analytical theory presented in previous studies [20,21] published by the authors. Equations were deduced in this study to predict working temperatures based on sizes of the evaporator, condenser, and heating area. The finalized LHP size was confirmed as the one that ensured a working-fluid temperature of 100 °C corresponding to an input thermal load of 150 W.
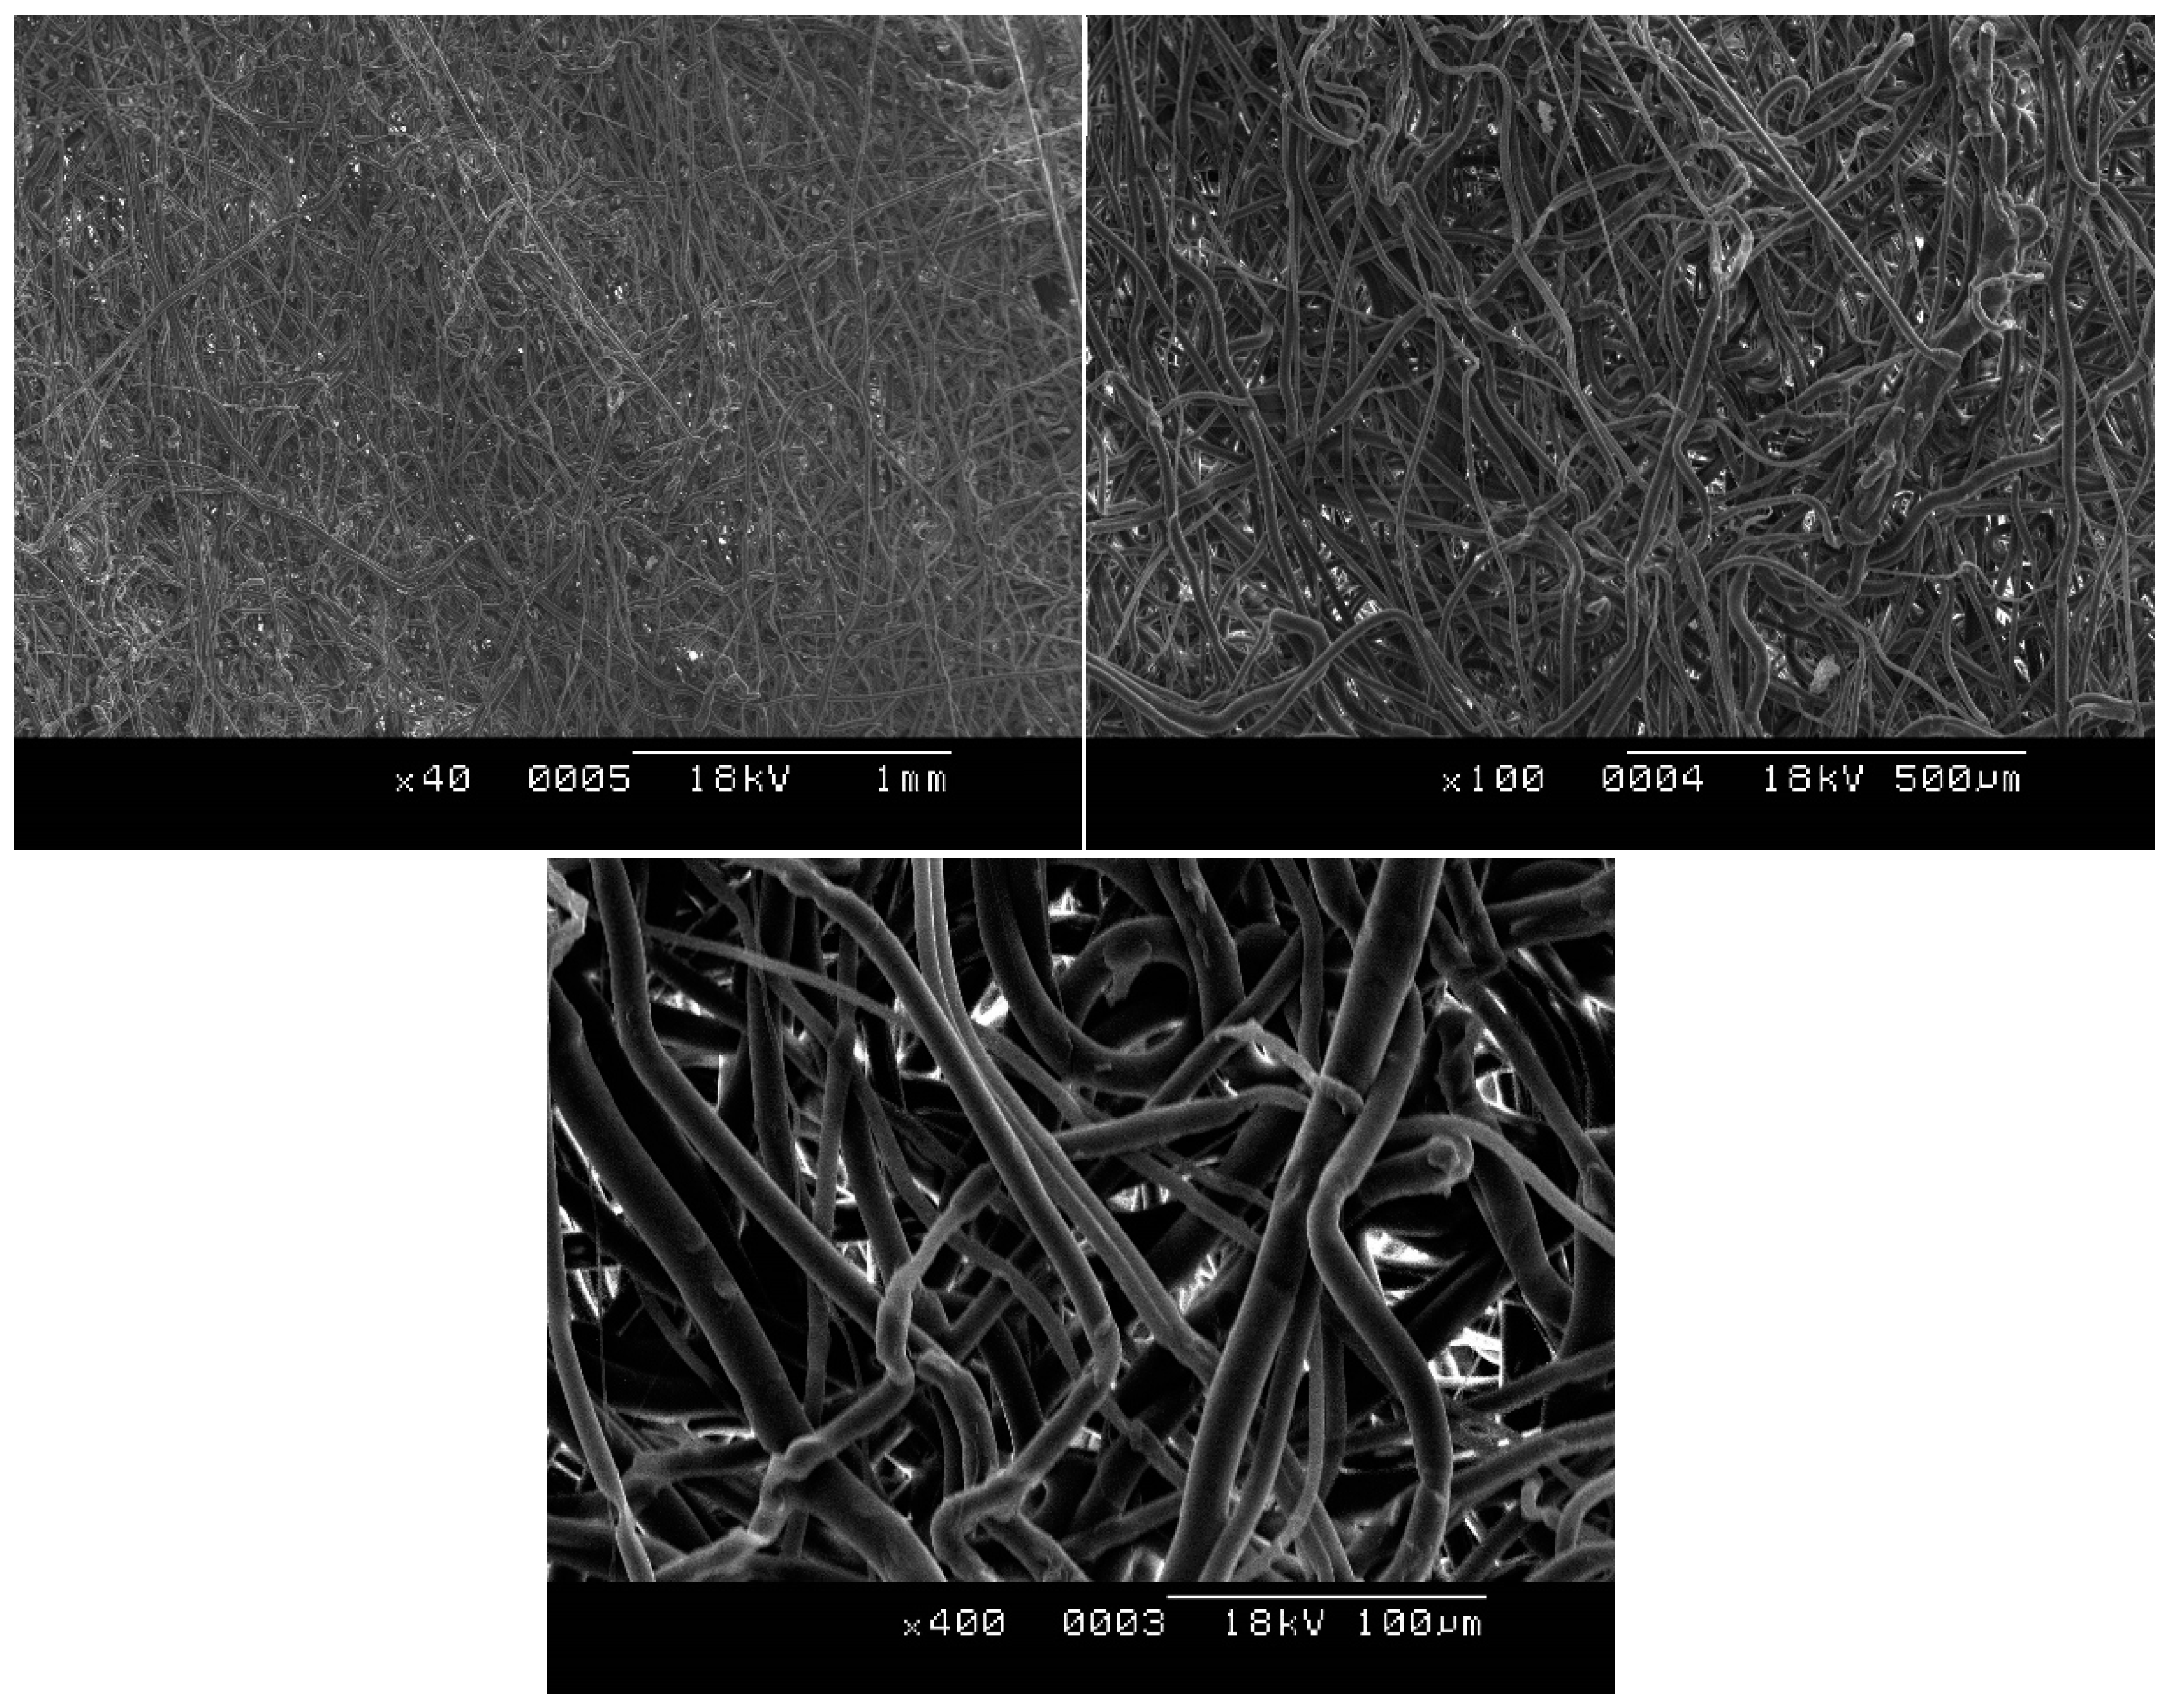
Internal volumes of components constituting the proposed LHP are listed in Table 1. The capillary structure within the evaporator comprised a 5-mm-thick polypropylene-fiber wick. Figure 2 depicts scanning electron microscopy (SEM) images of the said wick. As can be observed in the figure, the capillary structure has a nominal pore size of 0.5 μm (Figure 2a). In accordance with the nominal-pore-size concept, 93% of all particles having the designated size can be filtered out by the capillary structure. The wick porosity was set at 0.47, whereas the thermal conductivity of bulk polypropylene was determined to be 0.2 W/m-°C. The effect of pore size on the thermal performance of a baseline LHP configuration was investigated and described in detail in extant studies [19]. To ensure cooling-fluid circulation, 10 serpentine channels with a square cross-section were machined within the condenser, and the planar dimensions of the said channels measured 4 × 5 cm.
Inner and outer diameters of the liquid- and vapor-transport lines measured 2.0 mm and 4.0 mm, respectively, and their lengths were 0.5 m each. The fill-charge ratio concerning the working fluid, as defined in previous studies [19,22], was calculated using Equation (1) in accordance with the room temperature. The corresponding fill-charge ratio (α) was determined to be 36.5 mL, and its value was found to be dependent on the liquid-reservoir volume. A working-fluid fill-charge value of 36.4 mL corresponds to roughly 61% of the liquid reservoir volume and a filling ratio (α) of 47.8%. Additionally, use of the above-mentioned fill-charge value assumes the vapor density to be negligible compared to that of the liquid at the given operating temperature. Experimental results concerning the effect of fill-charge ratio on the basic thermal performance of LHPs were analyzed in detail in [19].
where M, V, and ρ denote the mass [kg], volume [m3], and density [kg/m3] of the working fluid.
Figure 1 depicts 8 (numbers 1–8) and 3 (numbers 19–21) thermocouples soldered onto exterior walls of the evaporator and condenser, respectively. Additionally, arithmetic means of respective thermocouple measurements were considered indicative of the resulting wall temperatures corresponding to these components. Two of the remaining thermocouples (numbers 12 and 15) were soldered at the centers of the liquid and vapor passages to facilitate determination of the tube-wall temperature, and the rest were placed at locations depicted in Figure 1 for accurate measurement of the working-fluid temperature. All thermocouples employed in this experiment were of the T-type, and measured 0.254 mm (30 AWG) in diameter with a measurement uncertainty of ±0.5 °C. Prior to data acquisition, the said thermocouples were calibrated to a temperature range of 0–100 °C. The entire LHP system was thermally insulated with ceramic wool, and any heat loss was predicted to be less than 10% in accordance with the energy balance between the input thermal load and heat collected by the coolant flowing through the condenser. The input thermal load was supplied by the electrical resistance heater, in which cartridge-type heating elements were embedded. The thermal energy generation through ohmic heating can be calculated by Qin = Ve2/Re, where Ve and Re are the electric voltage and resistance, respectively, measured by a high-accuracy digital multimeter. The voltage was controlled by a voltage regulator, and the input thermal load was also measured by a wattmeter with a full-scale uncertainty of 0.5%.
The input thermal load was controlled using a voltage regulator, and input thermal load was measured using a wattmeter with a full-scale uncertainty of 0.5%. The cooling-source temperature and flow rate were controlled using a thermal bath. During the experiment, the coolant flow rate was maintained at 5 gallons per hour, thereby corresponding to a flow velocity of 1.05 m/s, and the same monitored using a rotameter with maximum full-scale uncertainty of 4%. Table 2 provides the uncertainty of the experimental setup for the LHP system in this study. The overall heat loss was observed to measure less than 10% in accordance with the energy balance between the thermal load and heat collected by the condenser-cooling source.
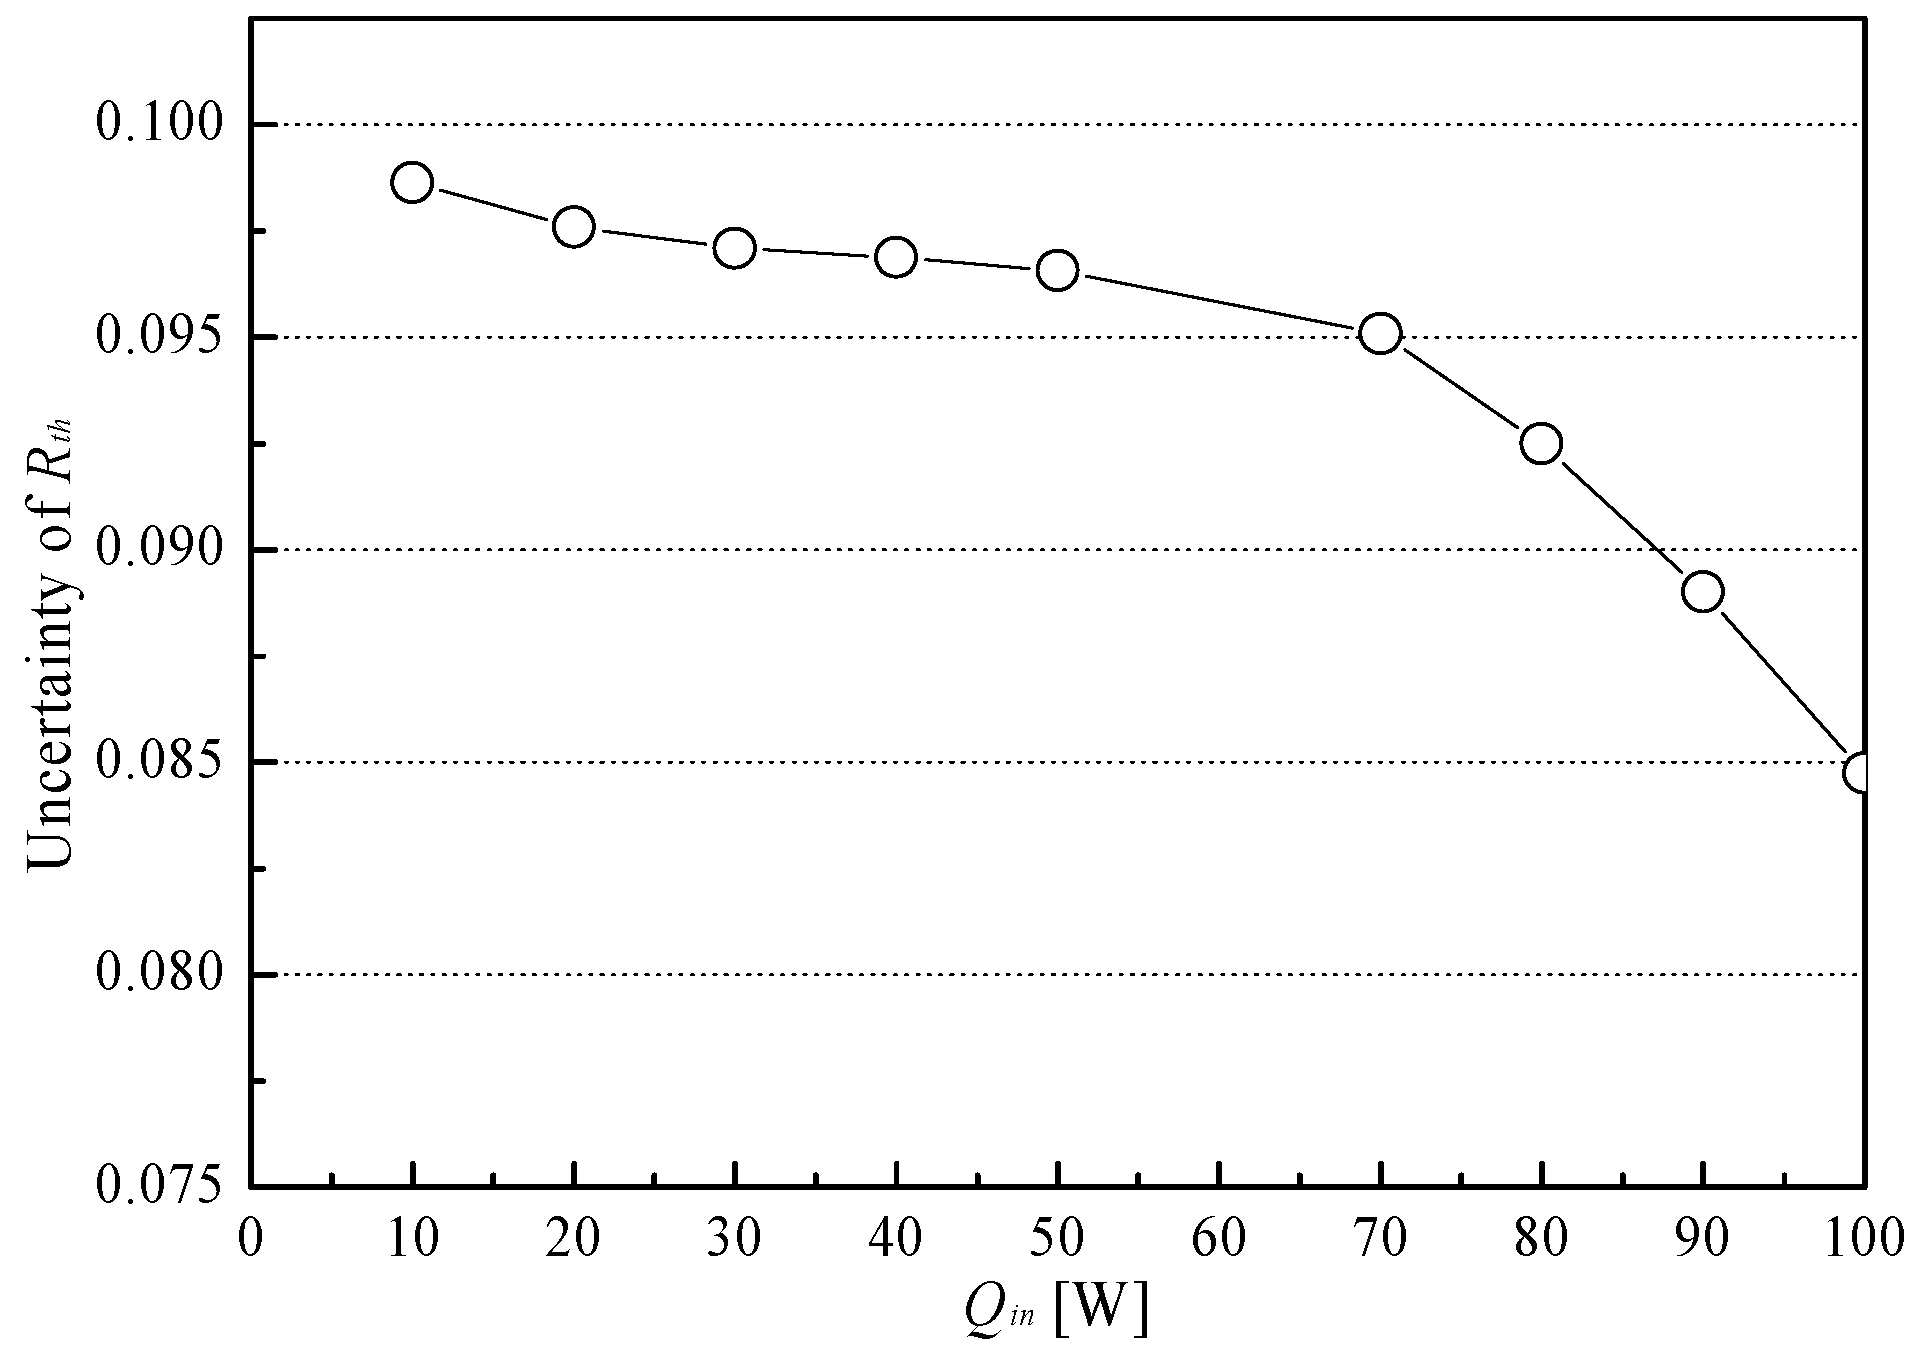
Uncertainty of the thermal resistance was evaluated by the method described in ref. [23], and the results are shown in Figure 3. The pertaining thermal resistance values were calculated by Equation (3), using experimentally measured temperatures. As shown in Figure 3, the uncertainty decreased as the input thermal load increased. The uncertainty ranged from 8.4% to 9.8% over the entire thermal load range (10–100 W).
Using an appropriate data-acquisition system, relevant experimental data were collected every 2 s. The primary focus of this study was to validate the usefulness of the mathematical model deduced in Part I. To this end, experiments were performed in this study under three different cases of LHP orientation—horizontal, preferred orientation of 7°, and adverse orientation of 10°. To prevent drop in quality of the working fluid, the maximum allowable operating temperature of the test device was set to 100 °C. Thus, as the evaporator-wall temperature approached 100 °C, both the start-up time and steady-state performance of LHP were analyzed between input-thermal-load values of 10 W and 120 W. No dry-out failures were observed at the said input-thermal-load and temperature values.
In this study, the thermal resistance of both LHP and the system—RLHP and RSYS, respectively—could be expressed using Equations (2) and (3), respectively, as follows.
In the above equations, , , and denote average temperatures corresponding to the evaporator wall, coolant at the inlet and outlet, and working fluid at the condenser inlet and outlet, respectively. Using the units of °C and W for the average temperature and heat load, respectively, the resultant thermal resistance is determined in [°C/W].
3. Results and Discussion
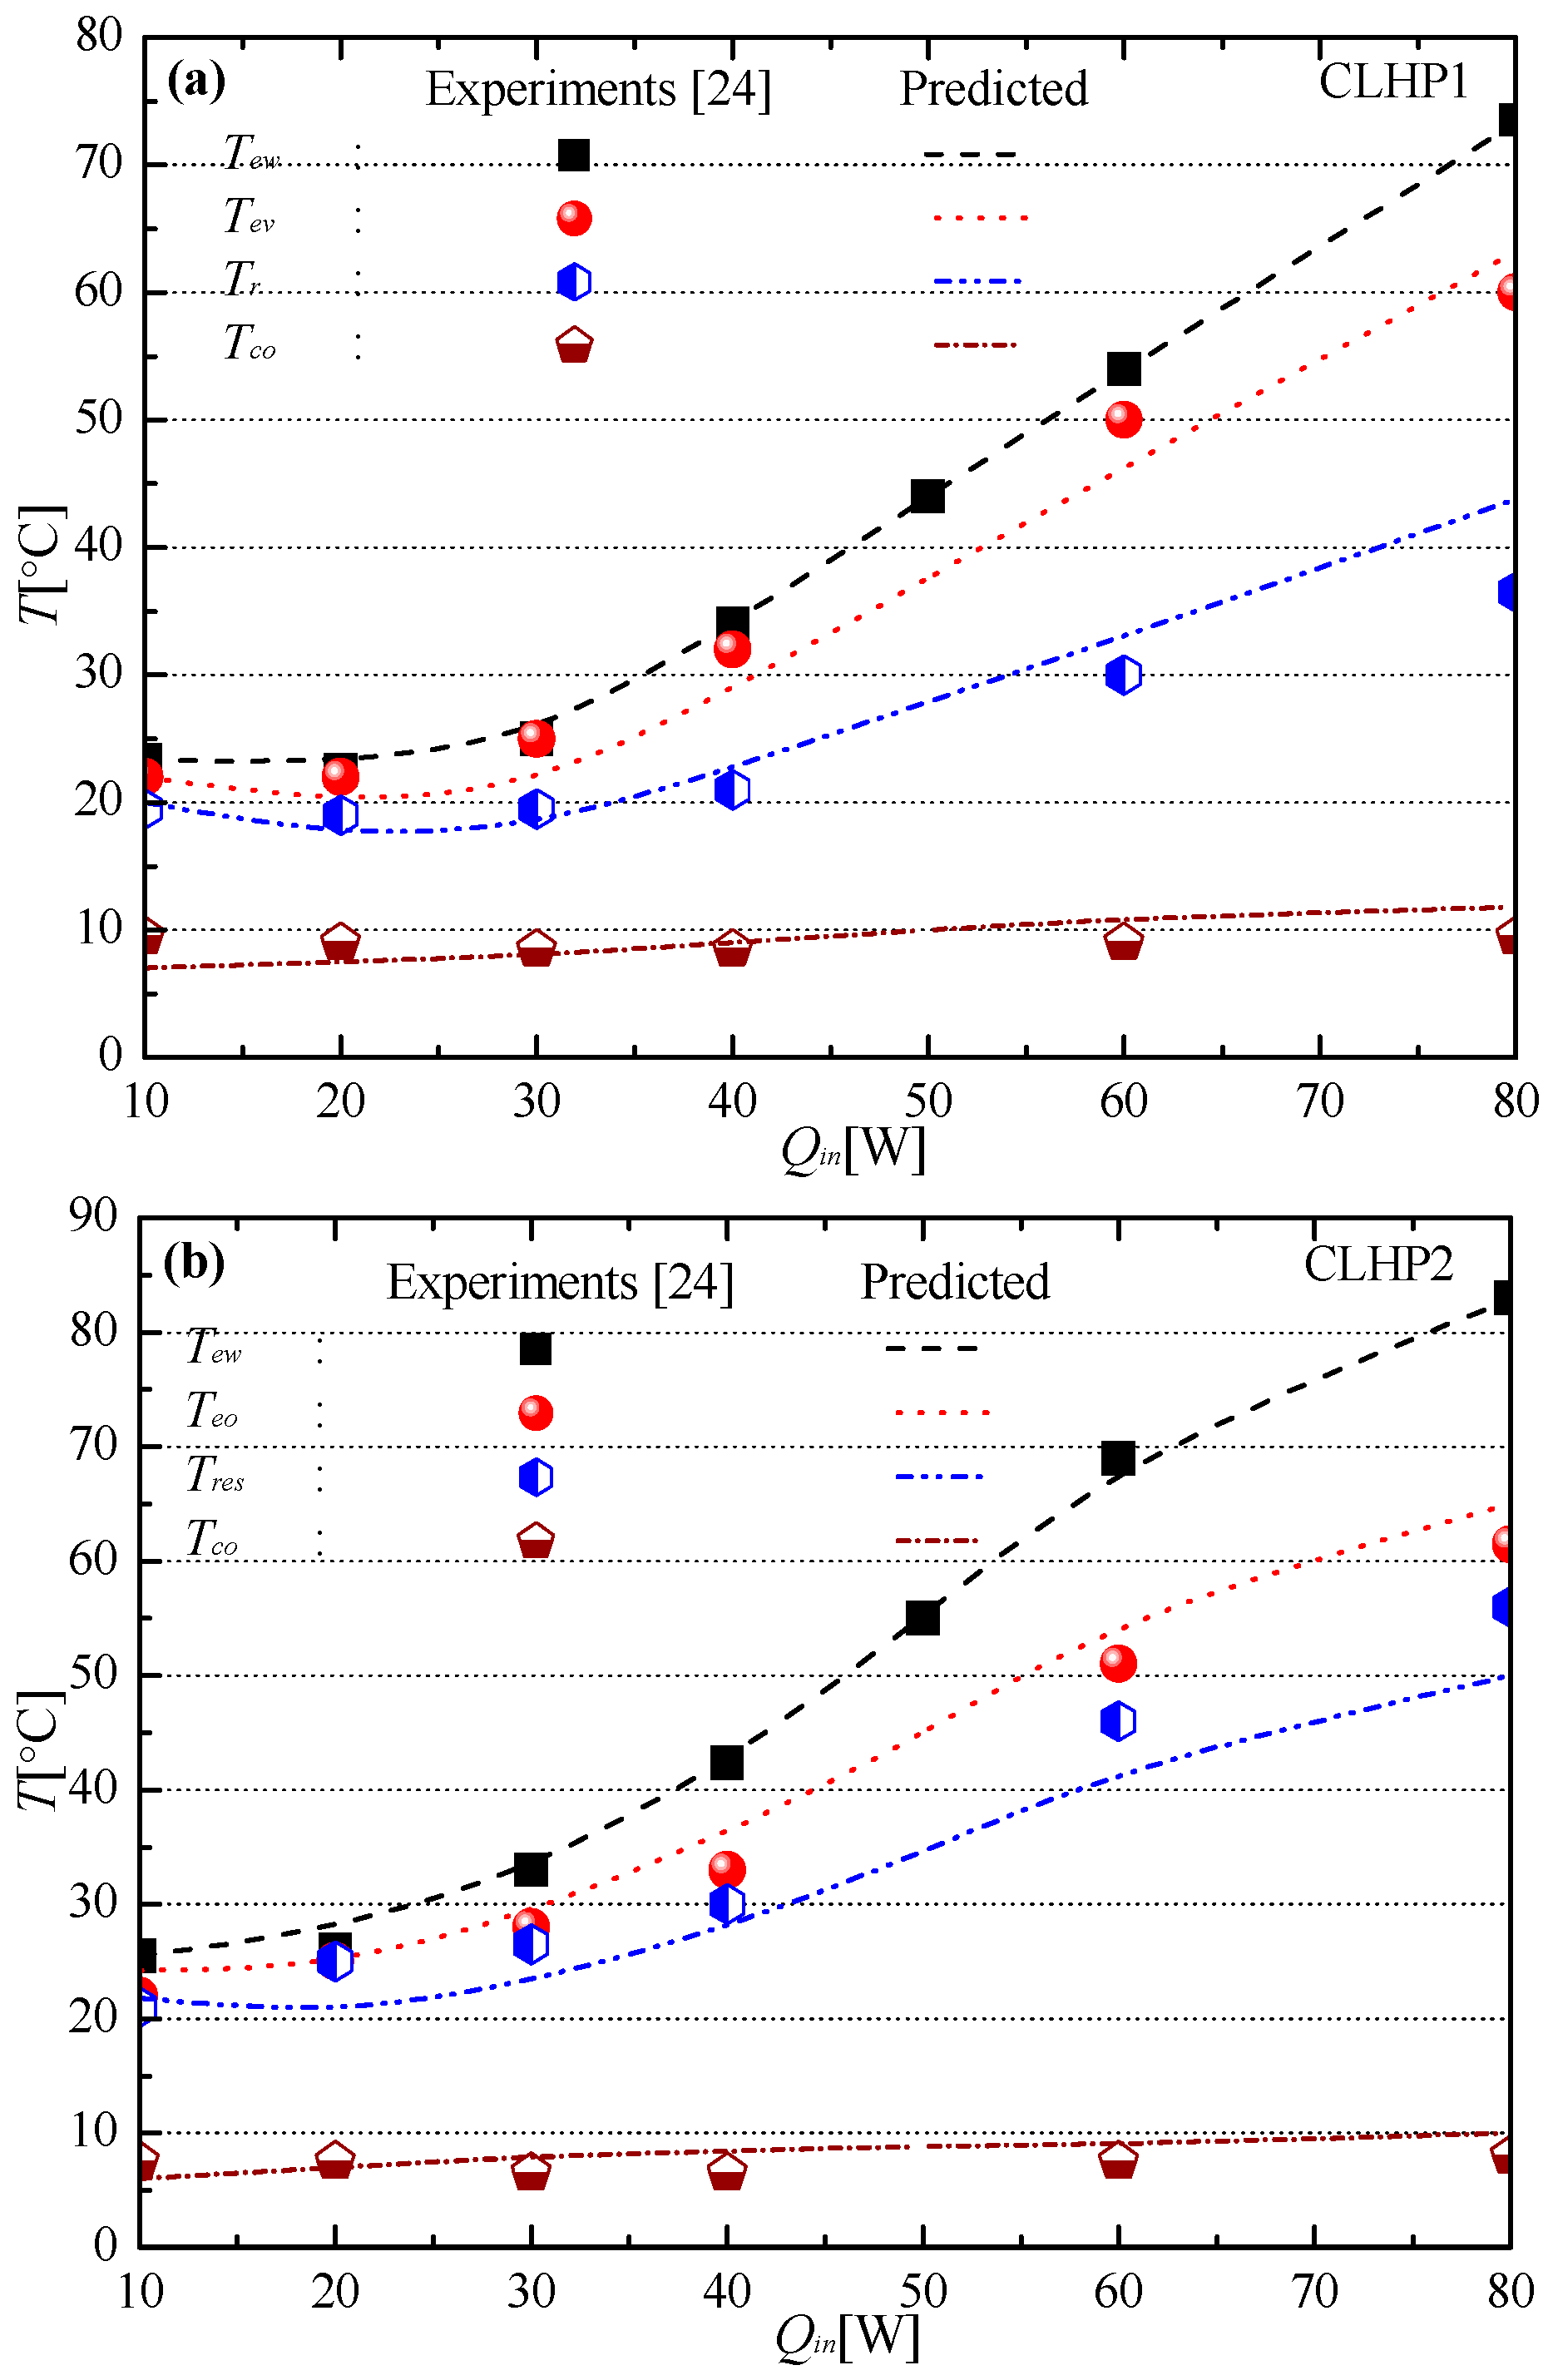
Figure 4 and Figure 5 demonstrate the comparison between results obtained via experimental data [24] and use of the model proposed in Part I of this research for two different CLHP configurations—CLHP1 and CLHP2. With the exception of the geometric configuration of the compensation chamber, no differences existed between CLHP1 and CLHP2. While compensation chambers employed in the CLHP1 and CLHP2 configurations occupied identical volumes in space, their corresponding diameters and lengths were largely different. As shown in Part I, the heat transfer model reflects analysis of the phase change interface of the evaporator and condenser in the lumped technique. Therefore, even though the geometric sizes of the compensation chambers are the same, such as CLHP1 and CLHP2, the model has the limitation that it could not predict the difference in heat transfer performance caused by the shape change of the compensation chamber or other components. Experimental results concerning the two above-mentioned CLHP configurations have been reported in ref. [24]. When performing analytical predictions using the model presented in Part I of this research, the convective heat-transfer coefficient (Uam) between the evaporator outer wall and ambient air was calculated using experiment data reported in ref. [24]. Acetone was considered to be the working fluid. The error incurred between the measured and predicted temperature values was analyzed based on the absolute temperature.
Figure 4a,b depicts comparison trends between experimental and prediction results obtained for configurations CLHP1 and CLHP2, respectively, with regard to the evaporator-wall temperature (Tew), vapor temperature (Tev), compensation-chamber temperature (Tr), and liquid temperature (Tco) of the condenser outlet. The said results were obtained for input-thermal-load values in the range of 10–80 W. The following observations were made concerning the CLHP1 configuration via comparison of relative errors between the measured and predicted values of the different temperatures. The maximum error concerning Tew evaluation was less than 0.2% (corresponding to a thermal load of 20 W). The corresponding error during Tev evaluation was relatively high; however, and did not exceed 2%. The maximum error concerning Tev evaluation equaled 1.3% (at a thermal load of 30 W), whereas the corresponding minimum value was predicted to be 0.7% (at a thermal load of 20 W). The error incurred during evaluation of Tr remained under 3% for the most part, and at the input-thermal-load value of 80 W, its maximum value equaled 2.4%. With regard to Tco evaluation, the error incurred was observed in general to remain within 1%. At an input thermal load of 10 W, a relatively high error value of 0.8% was observed, whereas in the thermal-load range of 20–50 W, the error incurred was observed to be maintained under 0.2%. Similarly, with regard to the CLHP2 configuration, the following observations were made under identical conditions. The maximum error incurred during Tew evaluation equaled 0.6% at a thermal load of 20 W. During Tev evaluation, although the observed error was relatively high, its value did not exceed 1%. The maximum error in this case was observed to be 0.8% corresponding to a thermal load of 10 W, whereas its corresponding minimum value equaled 0.2% at a thermal load of 20 W. The error concerning Tr evaluation was, in general, maintained under 2%; however, at an input-thermal load of 30 W, its maximum value of 1.6% was observed. As regards Tco evaluation, the observed error value consistently remained within 0.2% in the thermal-load range of 10–30 W. However, at thermal loads beyond this range, the observed error values exceeded 0.7%.
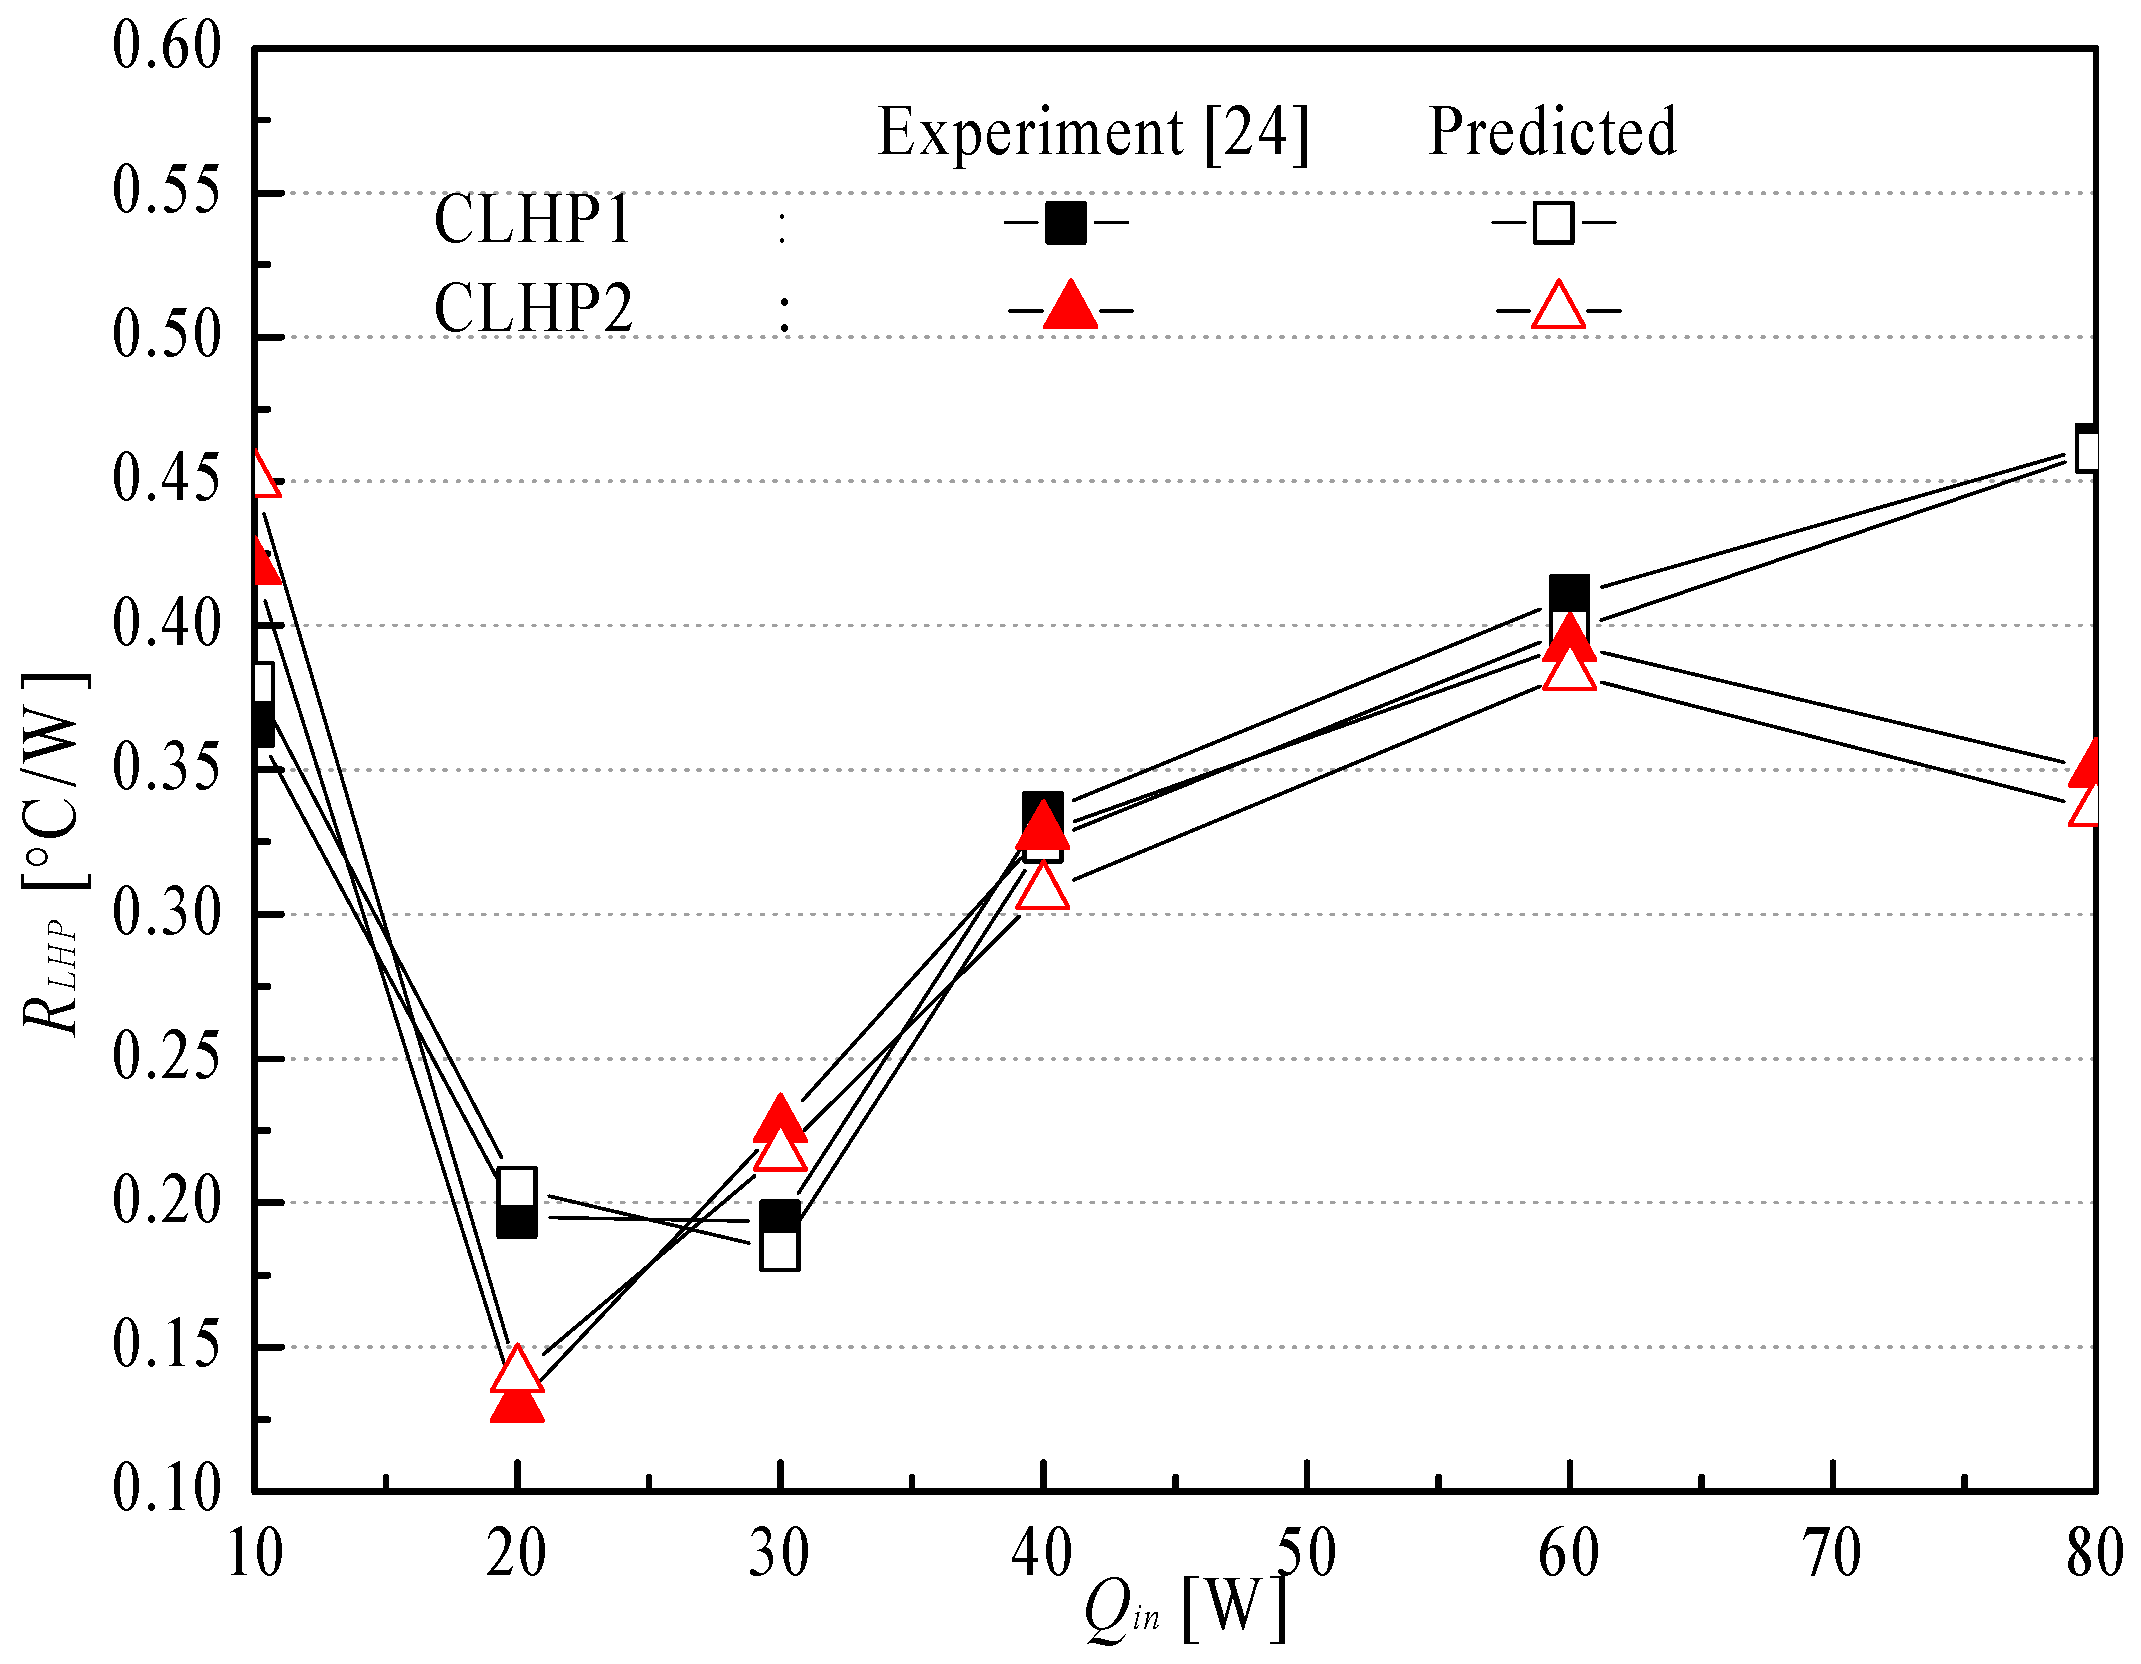
Figure 5 depicts the comparison between experimentally obtained and predicted values of the thermal resistance concerning CLHP1 and CLHP2 configurations. The said thermal resistances were calculated using Equation (2). As regards the CLHP1 configuration, the error concerning the thermal-resistance evaluation was maintained under 5%, and excellent consistency was observed across the range of input-thermal loads. However, at a thermal load of 20 W, the corresponding error value equaled 5.2%. In the CLHP2 configuration, the error in the thermal-resistance evaluation was observed to be maintained under 8%, which obviously exceeded that observed in the CLHP1 configuration. At an input-thermal load of 20 W for CLHP2, a maximum error value of 7.7% was observed.
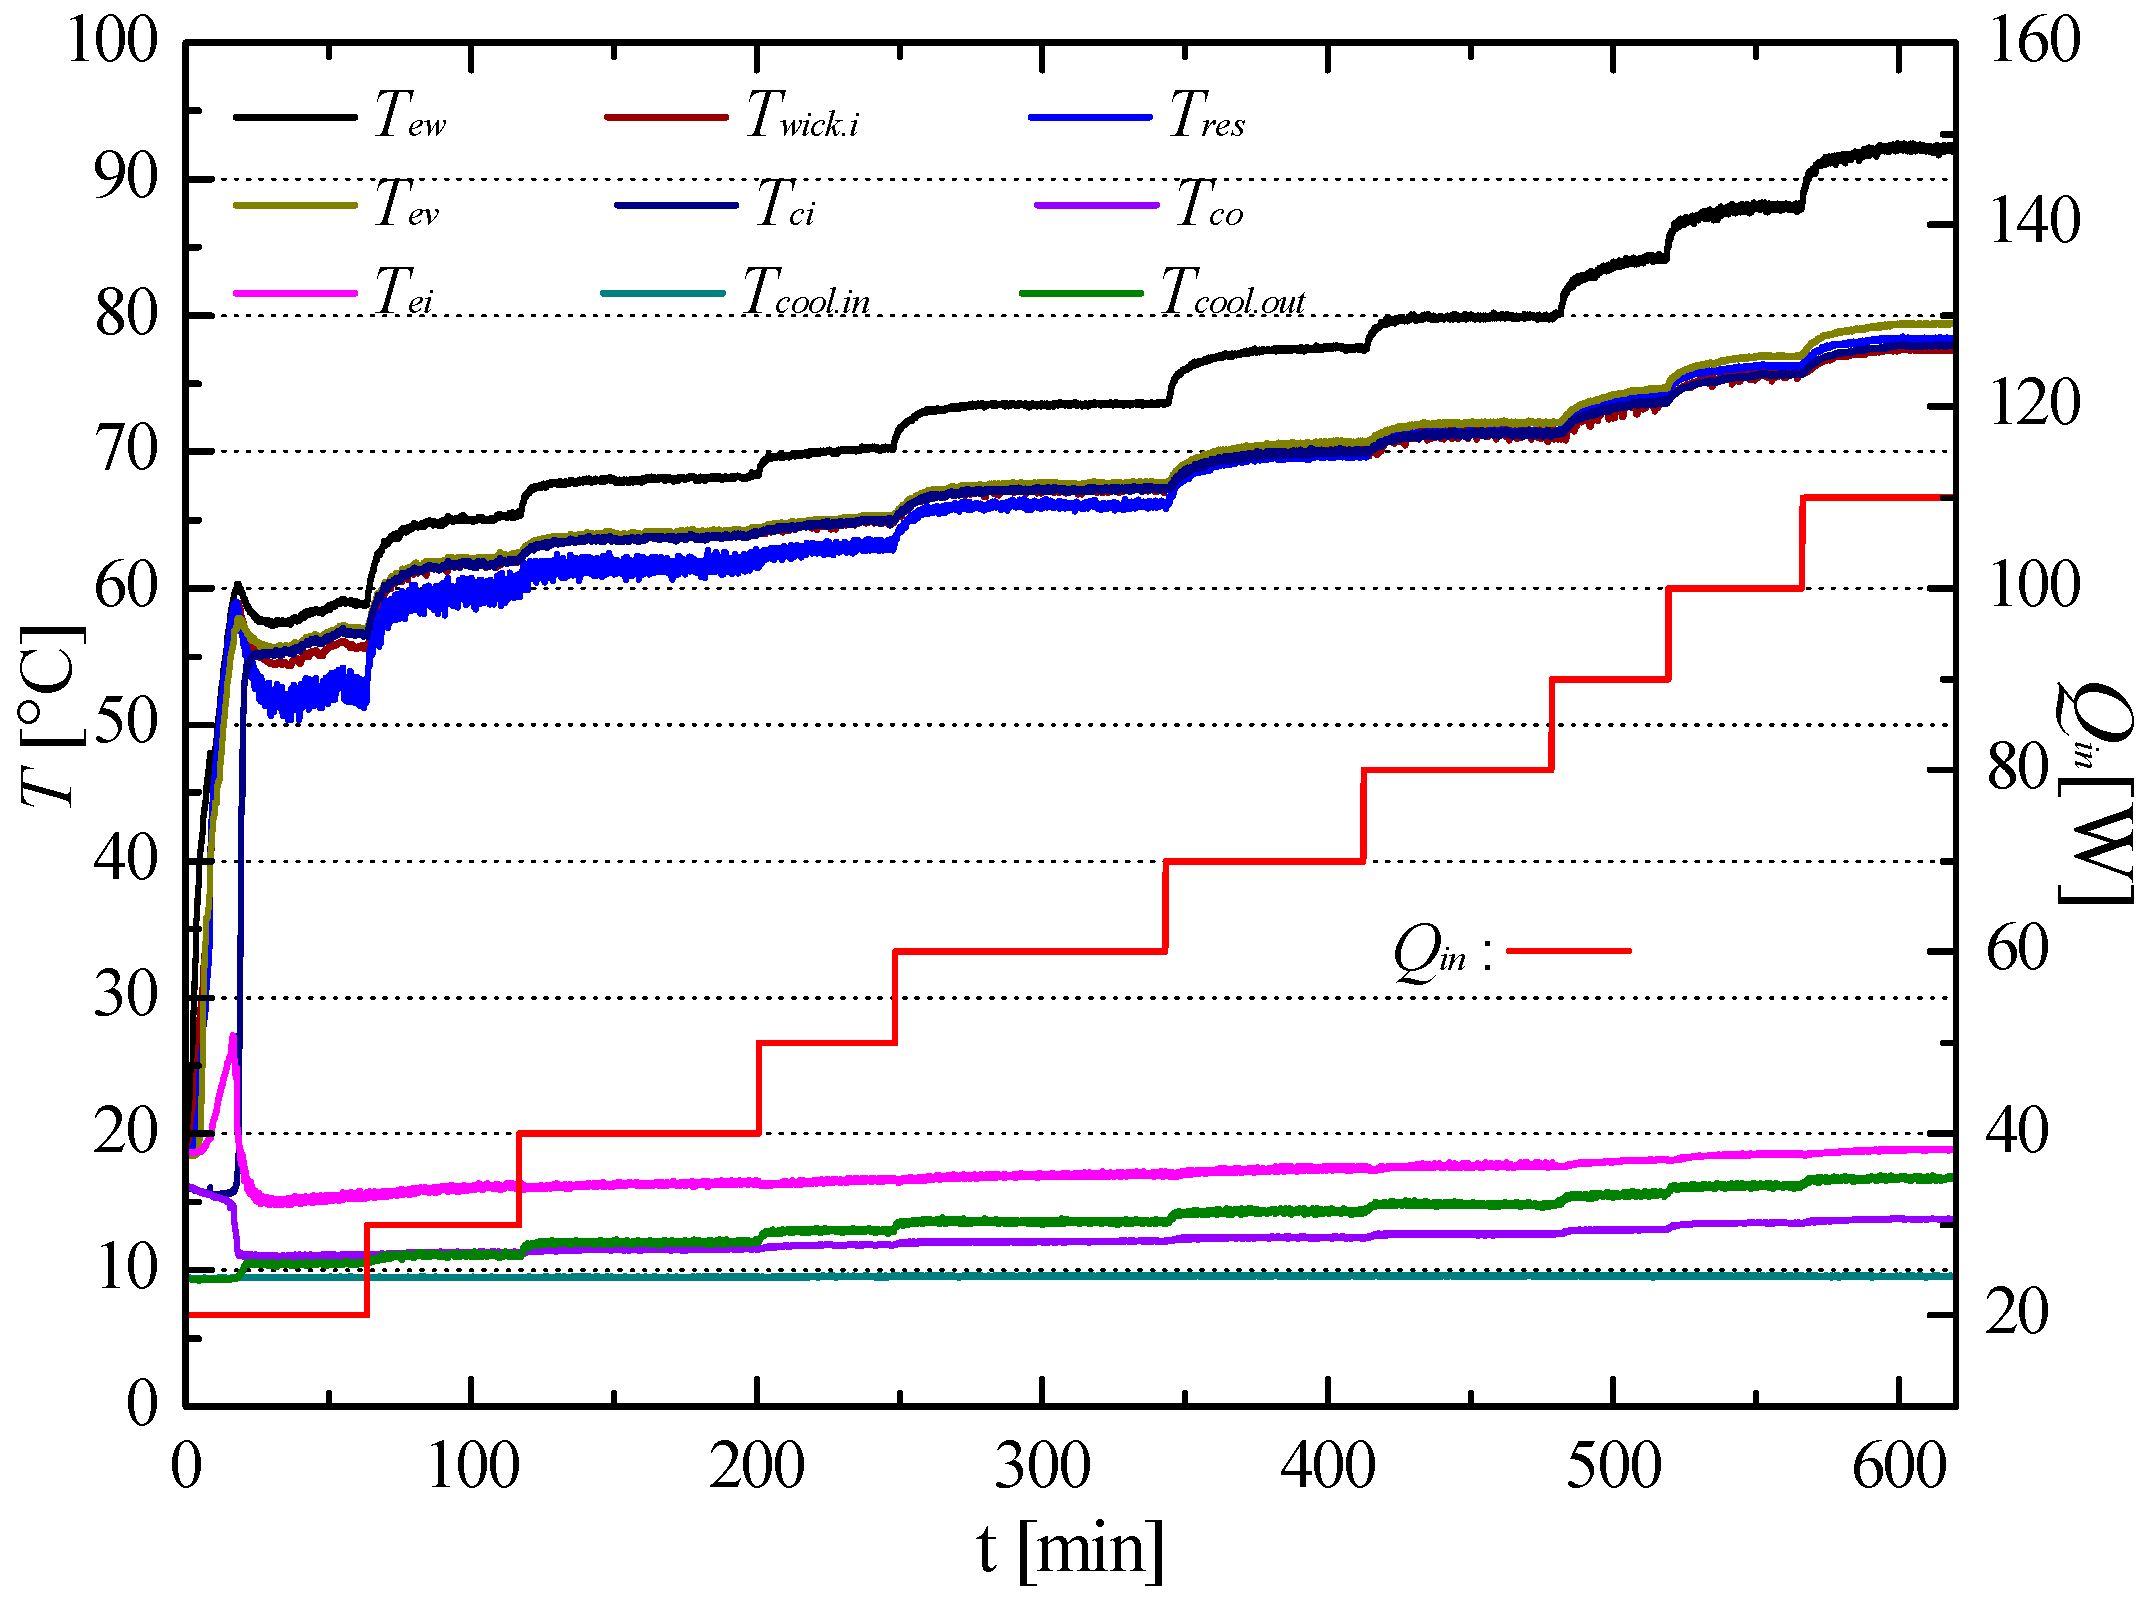
Figure 6, Figure 7, Figure 8, Figure 9, Figure 10, Figure 11, Figure 12, Figure 13 and Figure 14 demonstrate the thermal response of the FHLP configuration in terms of discrepancies between experimentally obtained and predicted values of temperatures at typical points within the LHP structure. The input thermal load and FLHP orientations were considered primary variables in this analysis. With regard to the FLHP orientation with the condenser located above the evaporator, the working fluid was aided by gravity, and this was determined to be the preferred orientation for LHP operation. However, with the condenser located below the evaporator, the vapor must flow against gravity, and therefore, the corresponding orientation was deemed adverse. Figure 6 depicts trends concerning temperature values at critical points within the FLHP structure and values of the input thermal load with the setup aligned horizontally. In this analysis, upon attainment of the steady state, the input thermal load was increased in 10-W intervals starting from 10 W. Temperature values were measured at thermocouple locations depicted in Figure 1. As depicted in Figure 6, the experiment lasted 600 min, and an input thermal-load range of 20–110 W was considered. At a thermal load of 20 W, the value of Tew under steady-state operation measured 59 °C, and as the thermal load increased to 110 W, Tew was observed to increase to 96 °C. At an input thermal load of 110 W, the evaporator-vapor temperature (Tev) measured approximately 80 °C. In all cases, the difference between Tev and Tr measured less than 3 °C. Owing to insulation of the vapor-transport tube, the observed difference in vapor temperature between the evaporator outlet (Tev) and condenser inlet (Tci) was observed to be very low at less than 1 °C.
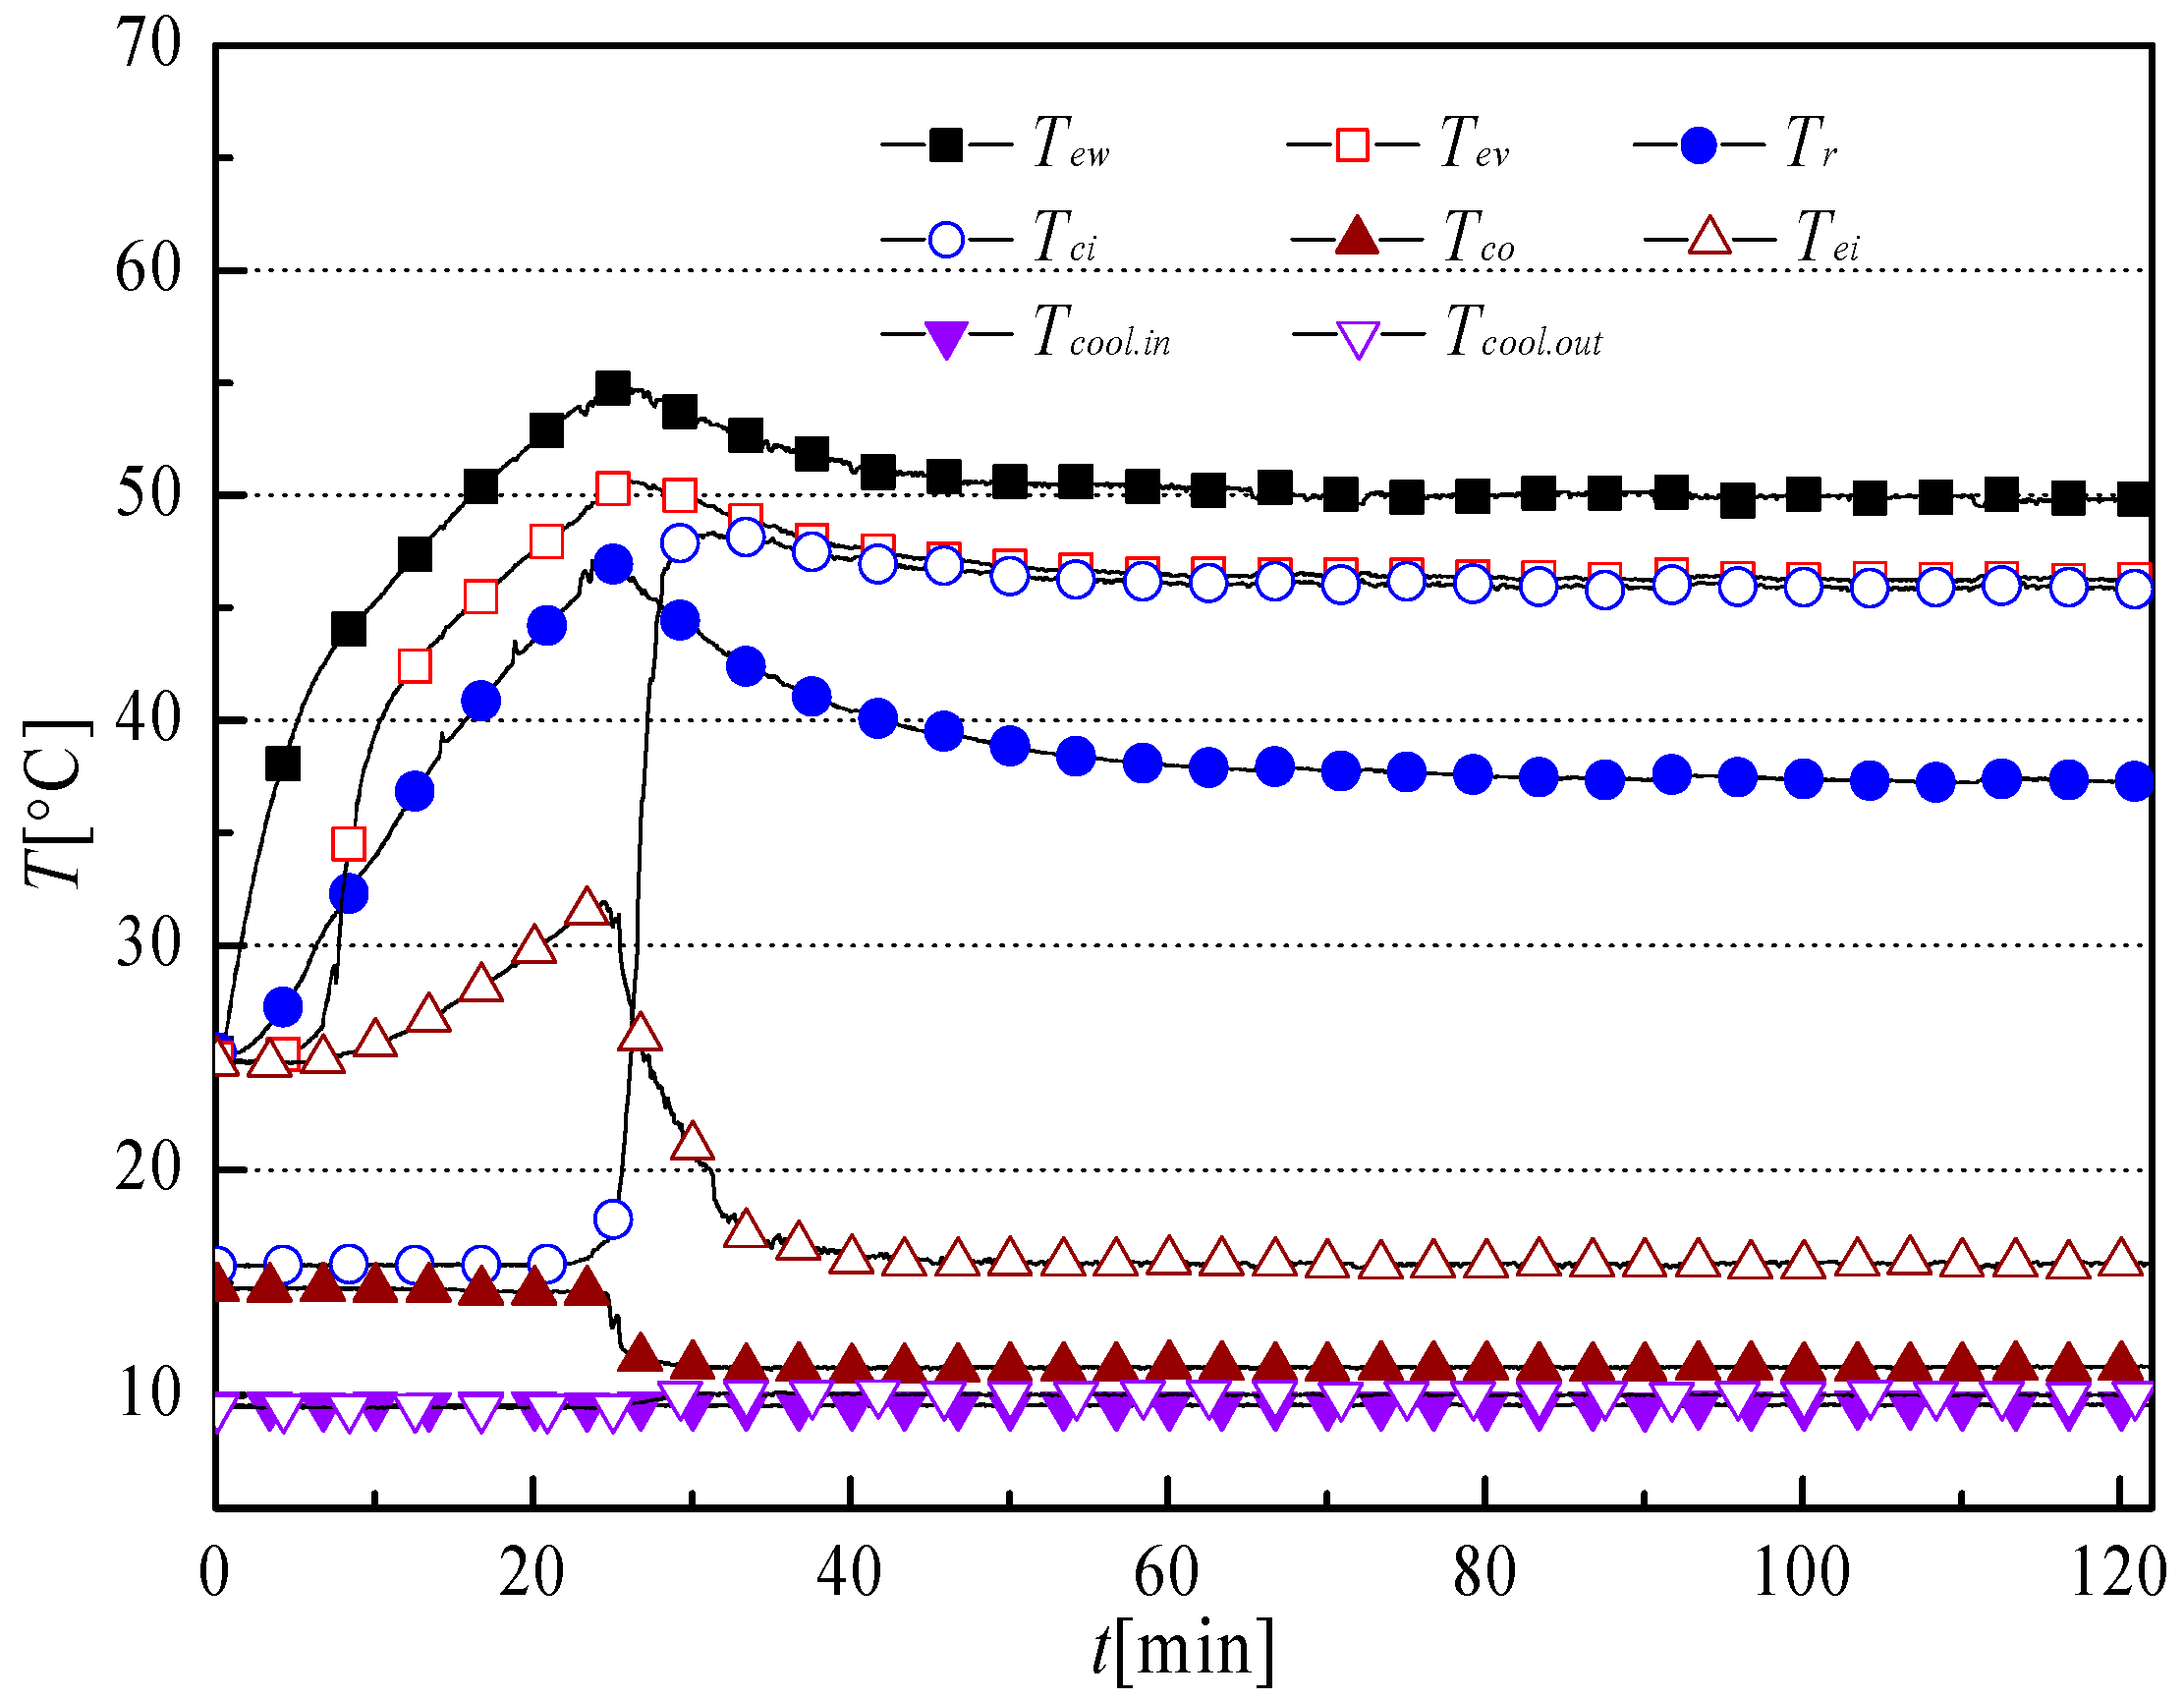
Figure 7 depicts transient- and steady-state-temperature behaviors at critical points over a 120-min duration at an input thermal load of 10 W with the FLHP setup aligned horizontally. During device start-up, a temperature overshoot was observed at the evaporator wall. During steady-state operation, Tew measured 49.8 °C. The time taken by vapor to arrive at the condenser inlet equaled 29.3 min, whereas that taken for liquid within the condenser to arrive at the evaporator inlet equaled approximately 30.3 min. Under steady-state operation, Tev measured 46.5 °C, whereas Tco and Tr measured 11 °C and 36.9 °C, respectively.
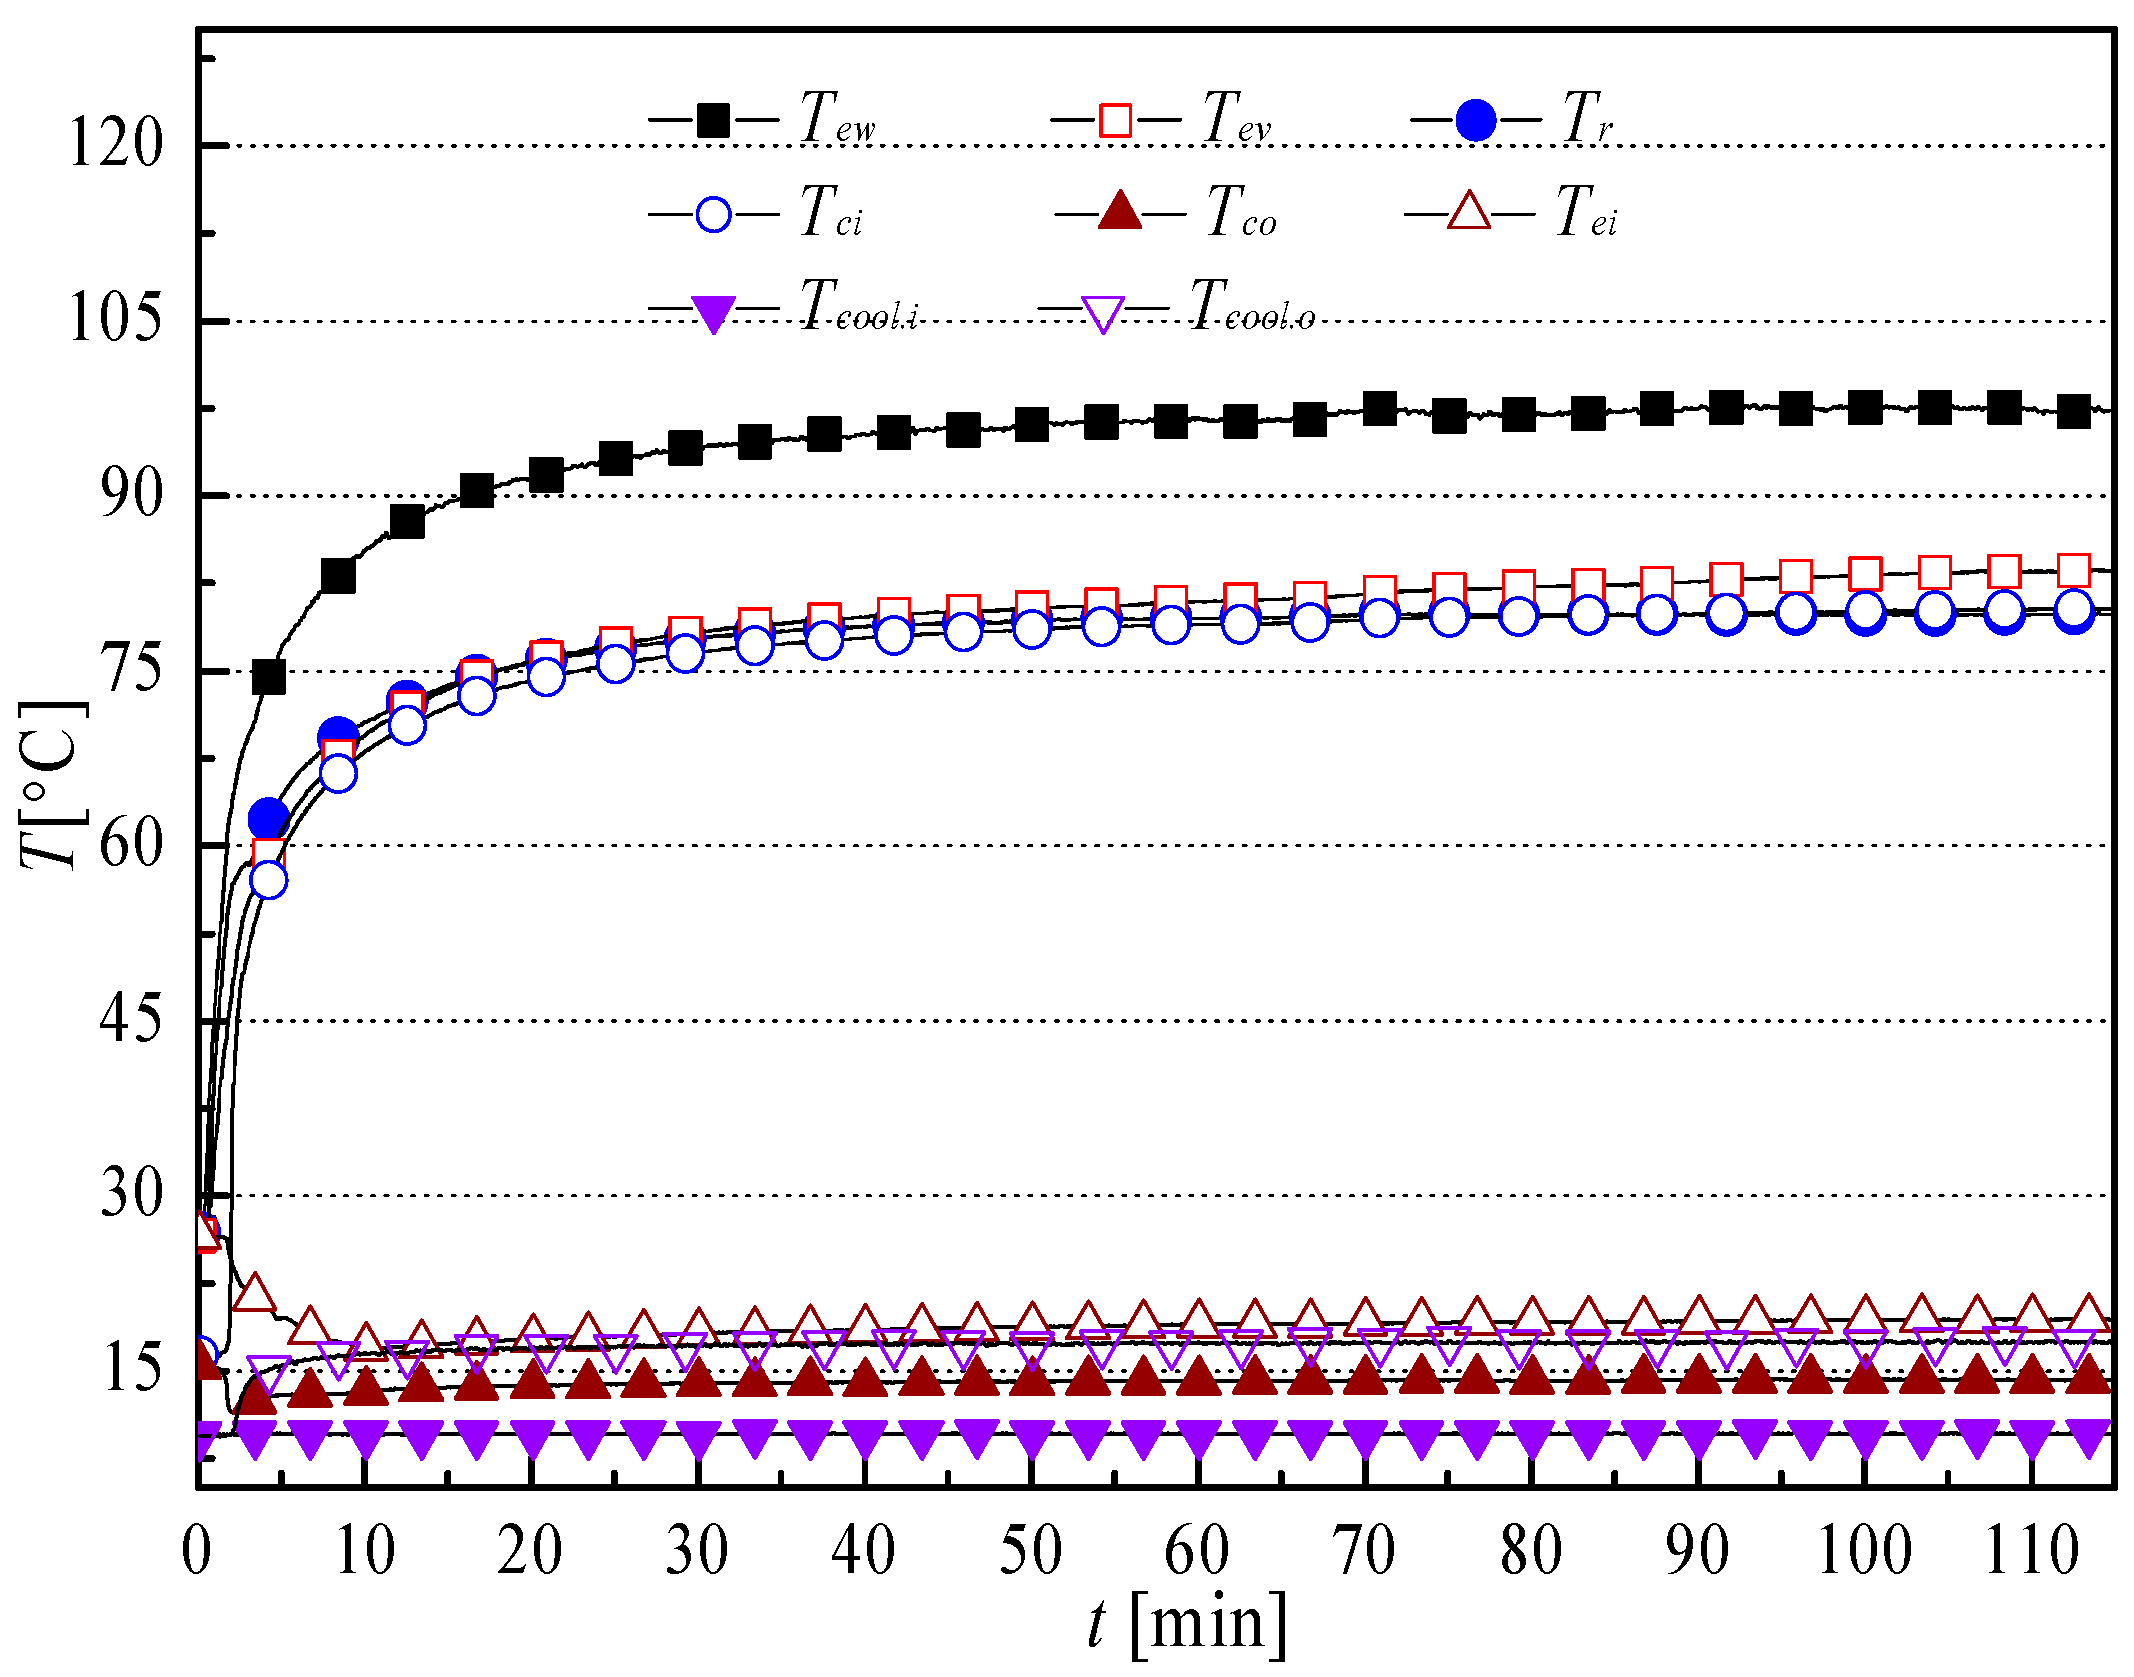
Figure 8 shows transient- and steady-state-temperature behaviors at critical points over a 115-min duration at an input thermal load of 120 W with the FLHP setup aligned horizontally. During start-up, no temperature overshoot was observed at the evaporator wall in this case, whereas under steady-state operation, Tew measured 97 °C. The time taken for vapor to arrive at the condenser inlet equaled approximately 2 min, whereas that taken by liquid at the condenser outlet to arrive at the evaporator inlet equaled roughly 2.58 min. Under steady-state operation, Tev measured 83.5 °C, whereas Tco and Tr equaled 14 °C and 80.2 °C, respectively.
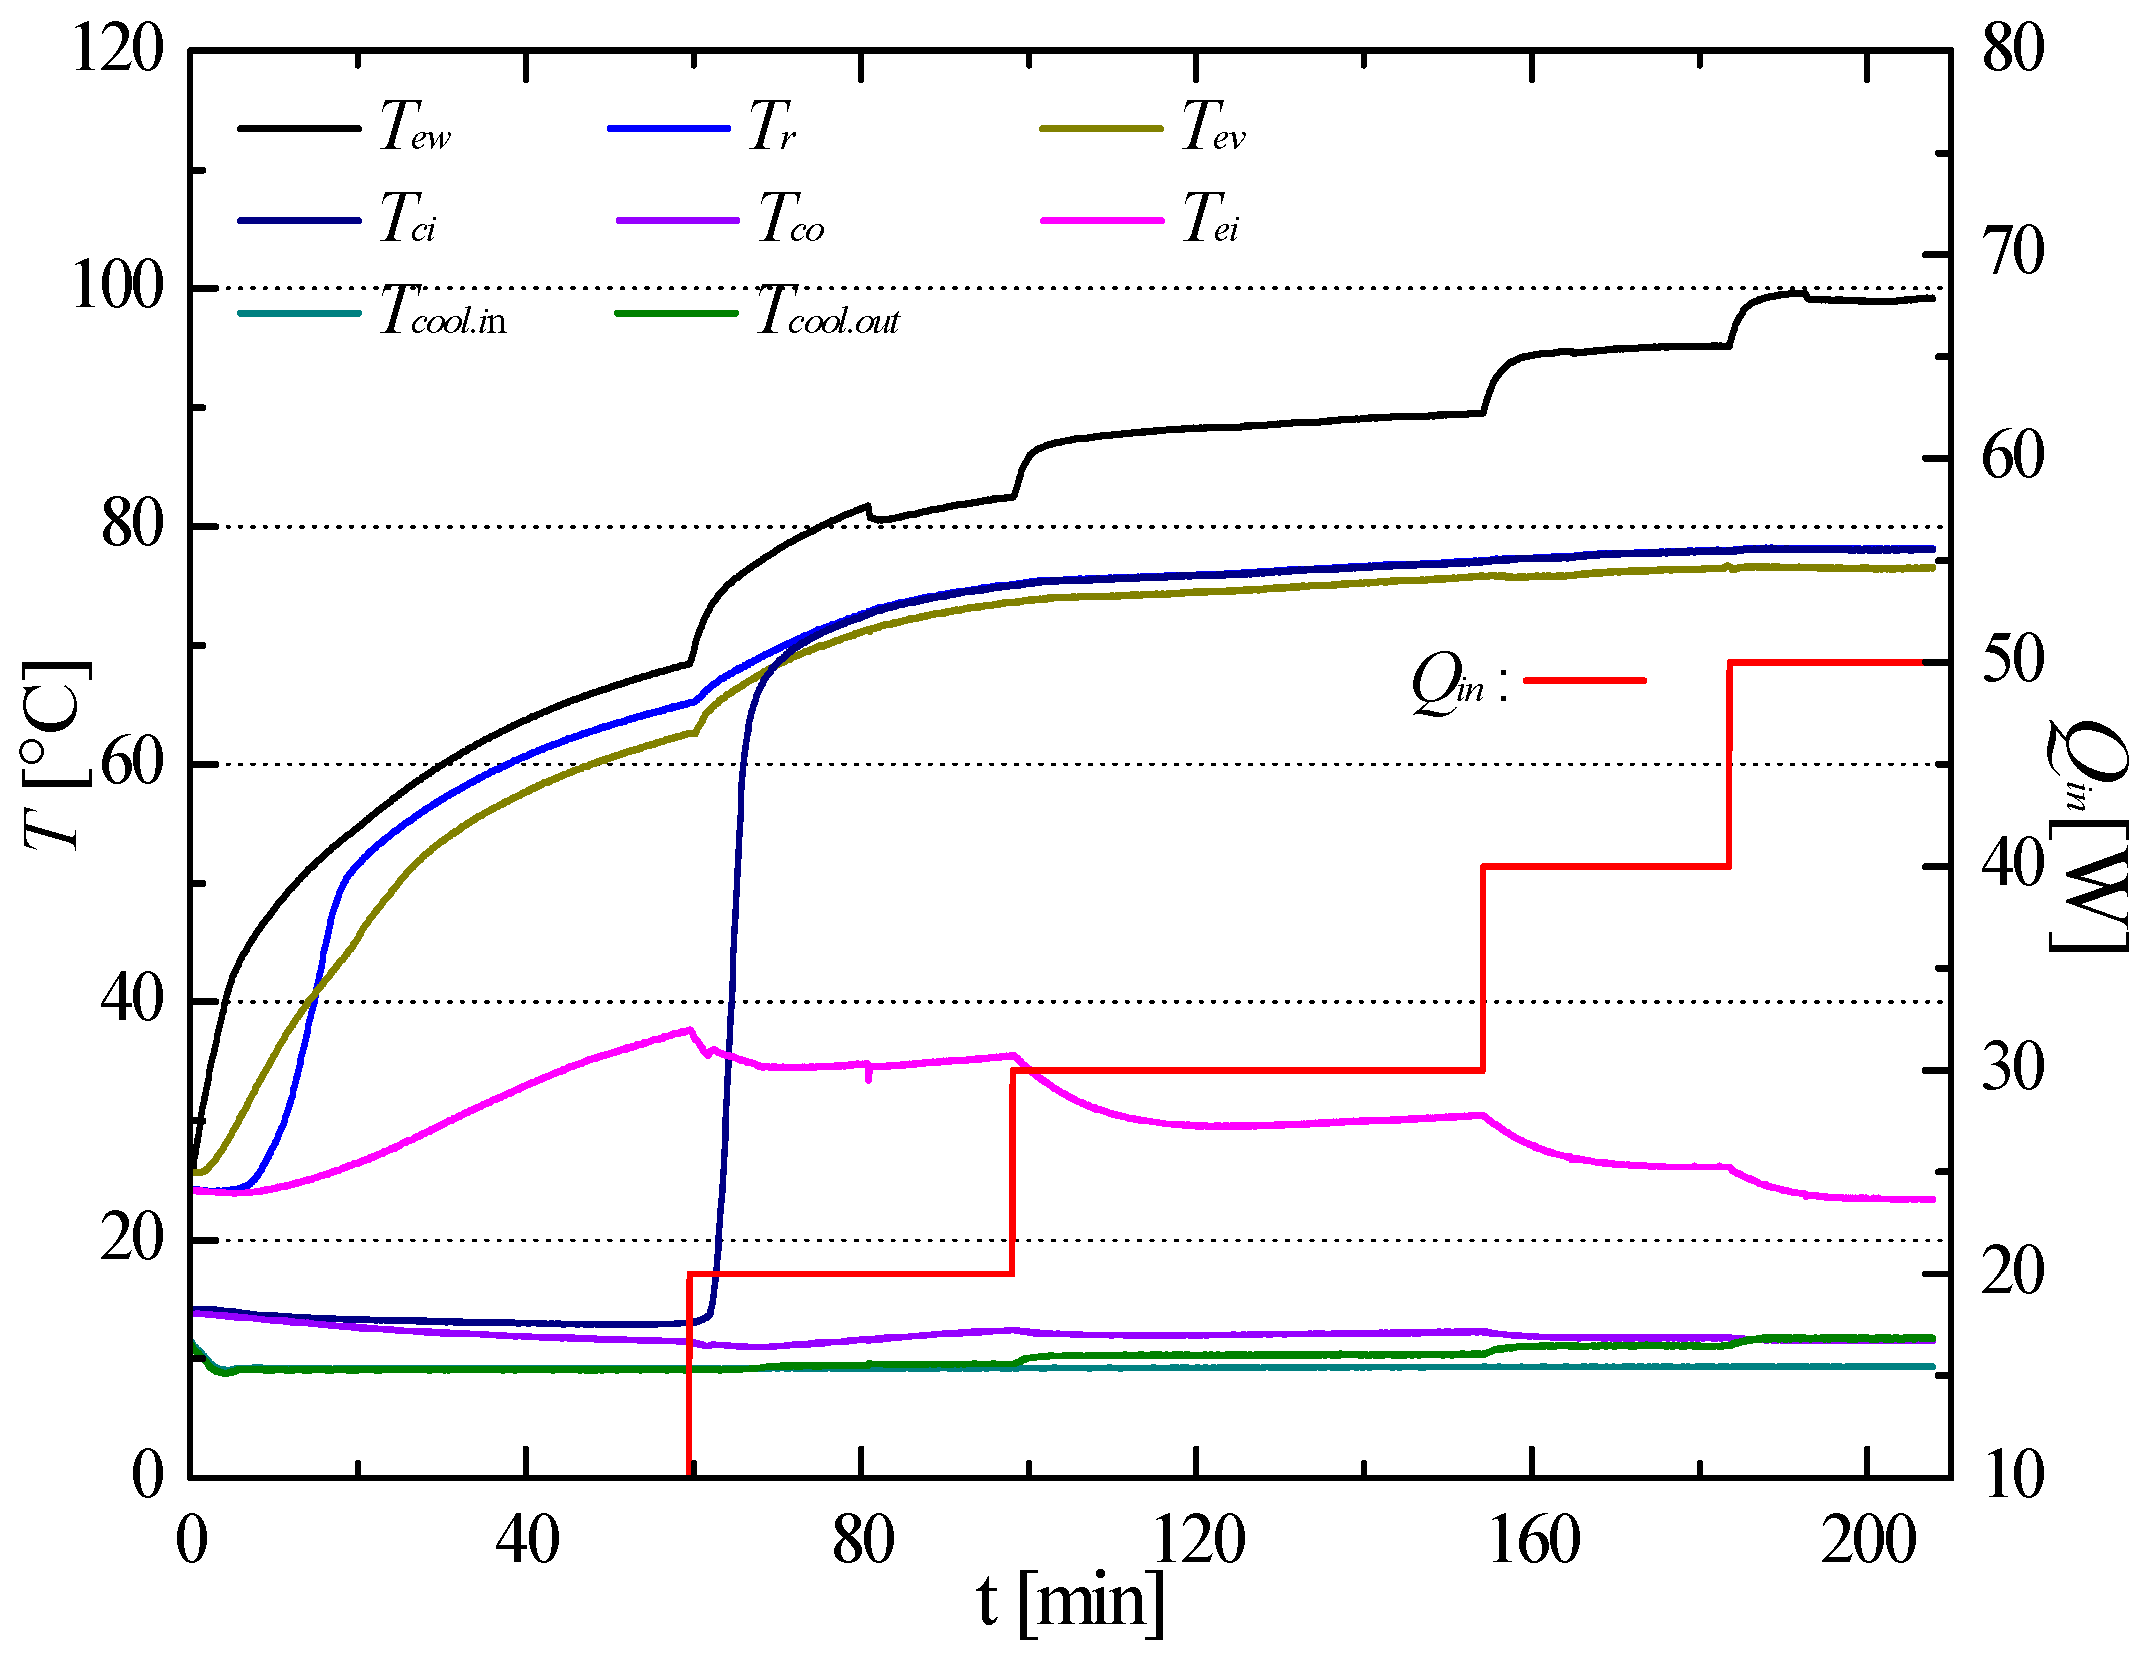
Figure 9 depicts trends concerning the different temperatures at critical points within the FLHP structure and values of input thermal loads when the setup was aligned at the adverse angle of 10°. Once steady-state operation was established, the input thermal load was increased in steps of 10 W over an initial value of 10 W. Temperature measurements were performed at thermocouple locations depicted in Figure 1. As depicted in Figure 9, the experiment lasted 207 min, and the values of the input thermal load considered were observed to lie within the range of 10–50 W. At an input thermal load of 10 W, Tew measured 50 °C. When the thermal load was increased to 50 W, Tew measured 99 °C. During start-up, corresponding to an input thermal load of 10 W, Tci measured 13.4 °C for 68 min, thereby rendering the start-up impossible. As the thermal load was increased to 20 W, the value of Tci correspondingly increased to 69.6 °C, whereas that of Tei decreased as start-up was achieved. At an input thermal load of 50 W, Tev measured 78.2 °C. In all cases, the temperature difference between Tev and Tr measured less than 3 °C.
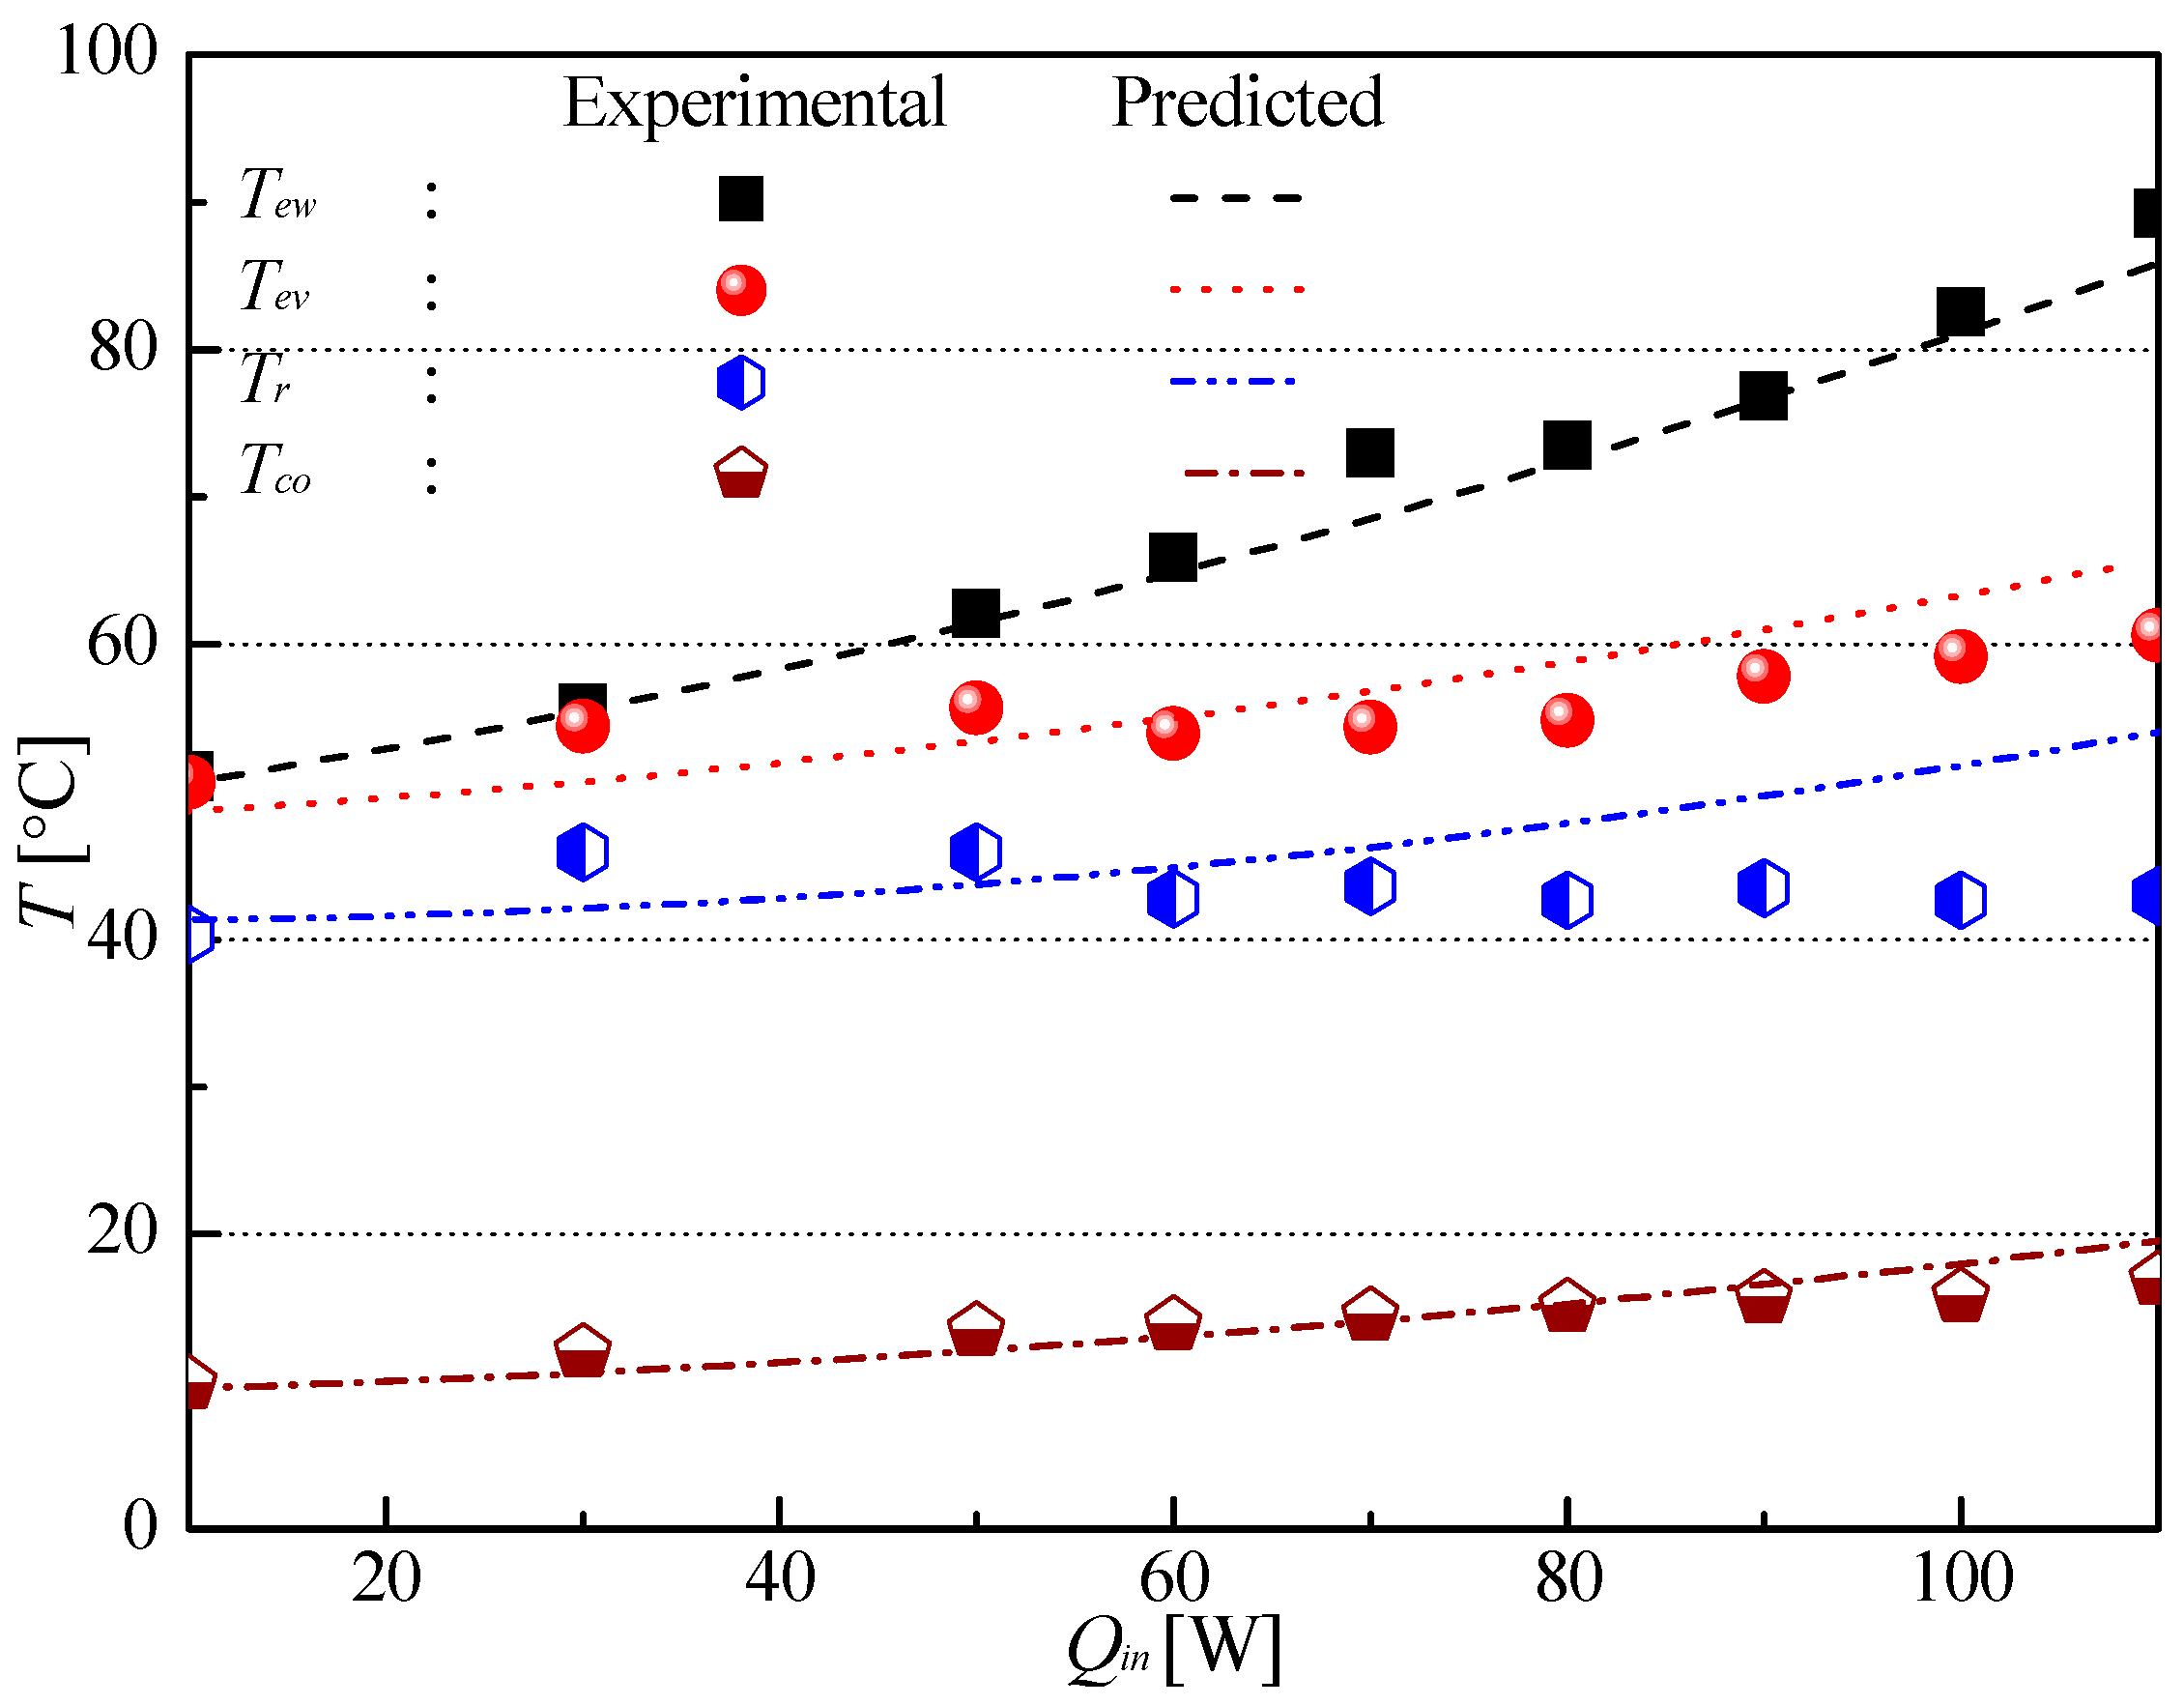
Figure 10 illustrates a comparison between experimentally obtained and numerically predicted values of Tew, Tev, Tr, and Tco when the FLHP setup was aligned horizontally. Input thermal loads considered in this analysis lay within the range of 10–130 W. As regards relative errors between experimental data and predicted values, the error associated with Tew evaluation was observed to be less than 0.8% at a thermal load of 130 W. With regard to Tev, the observed error was relatively high with a maximum value of 1.6% corresponding to a thermal load of 80 W. The corresponding minimum error value equaled 0.1% at a thermal load of 10 W. The error associated with Tr, in general, measured less than 2.3%, and its maximum value of 2.3% was found to correspond to an input thermal load of 100 W. The error associated with Tco was observed to remain within approximately 1.3% for the most part. At a thermal load of 130 W, the said error value equaled 1.3%. Corresponding to thermal loads in the range of 70–90 W as well as at 120 W, the observed relative error measured less than 1%, and very good agreement was observed between the experimentally obtained and predicted results.
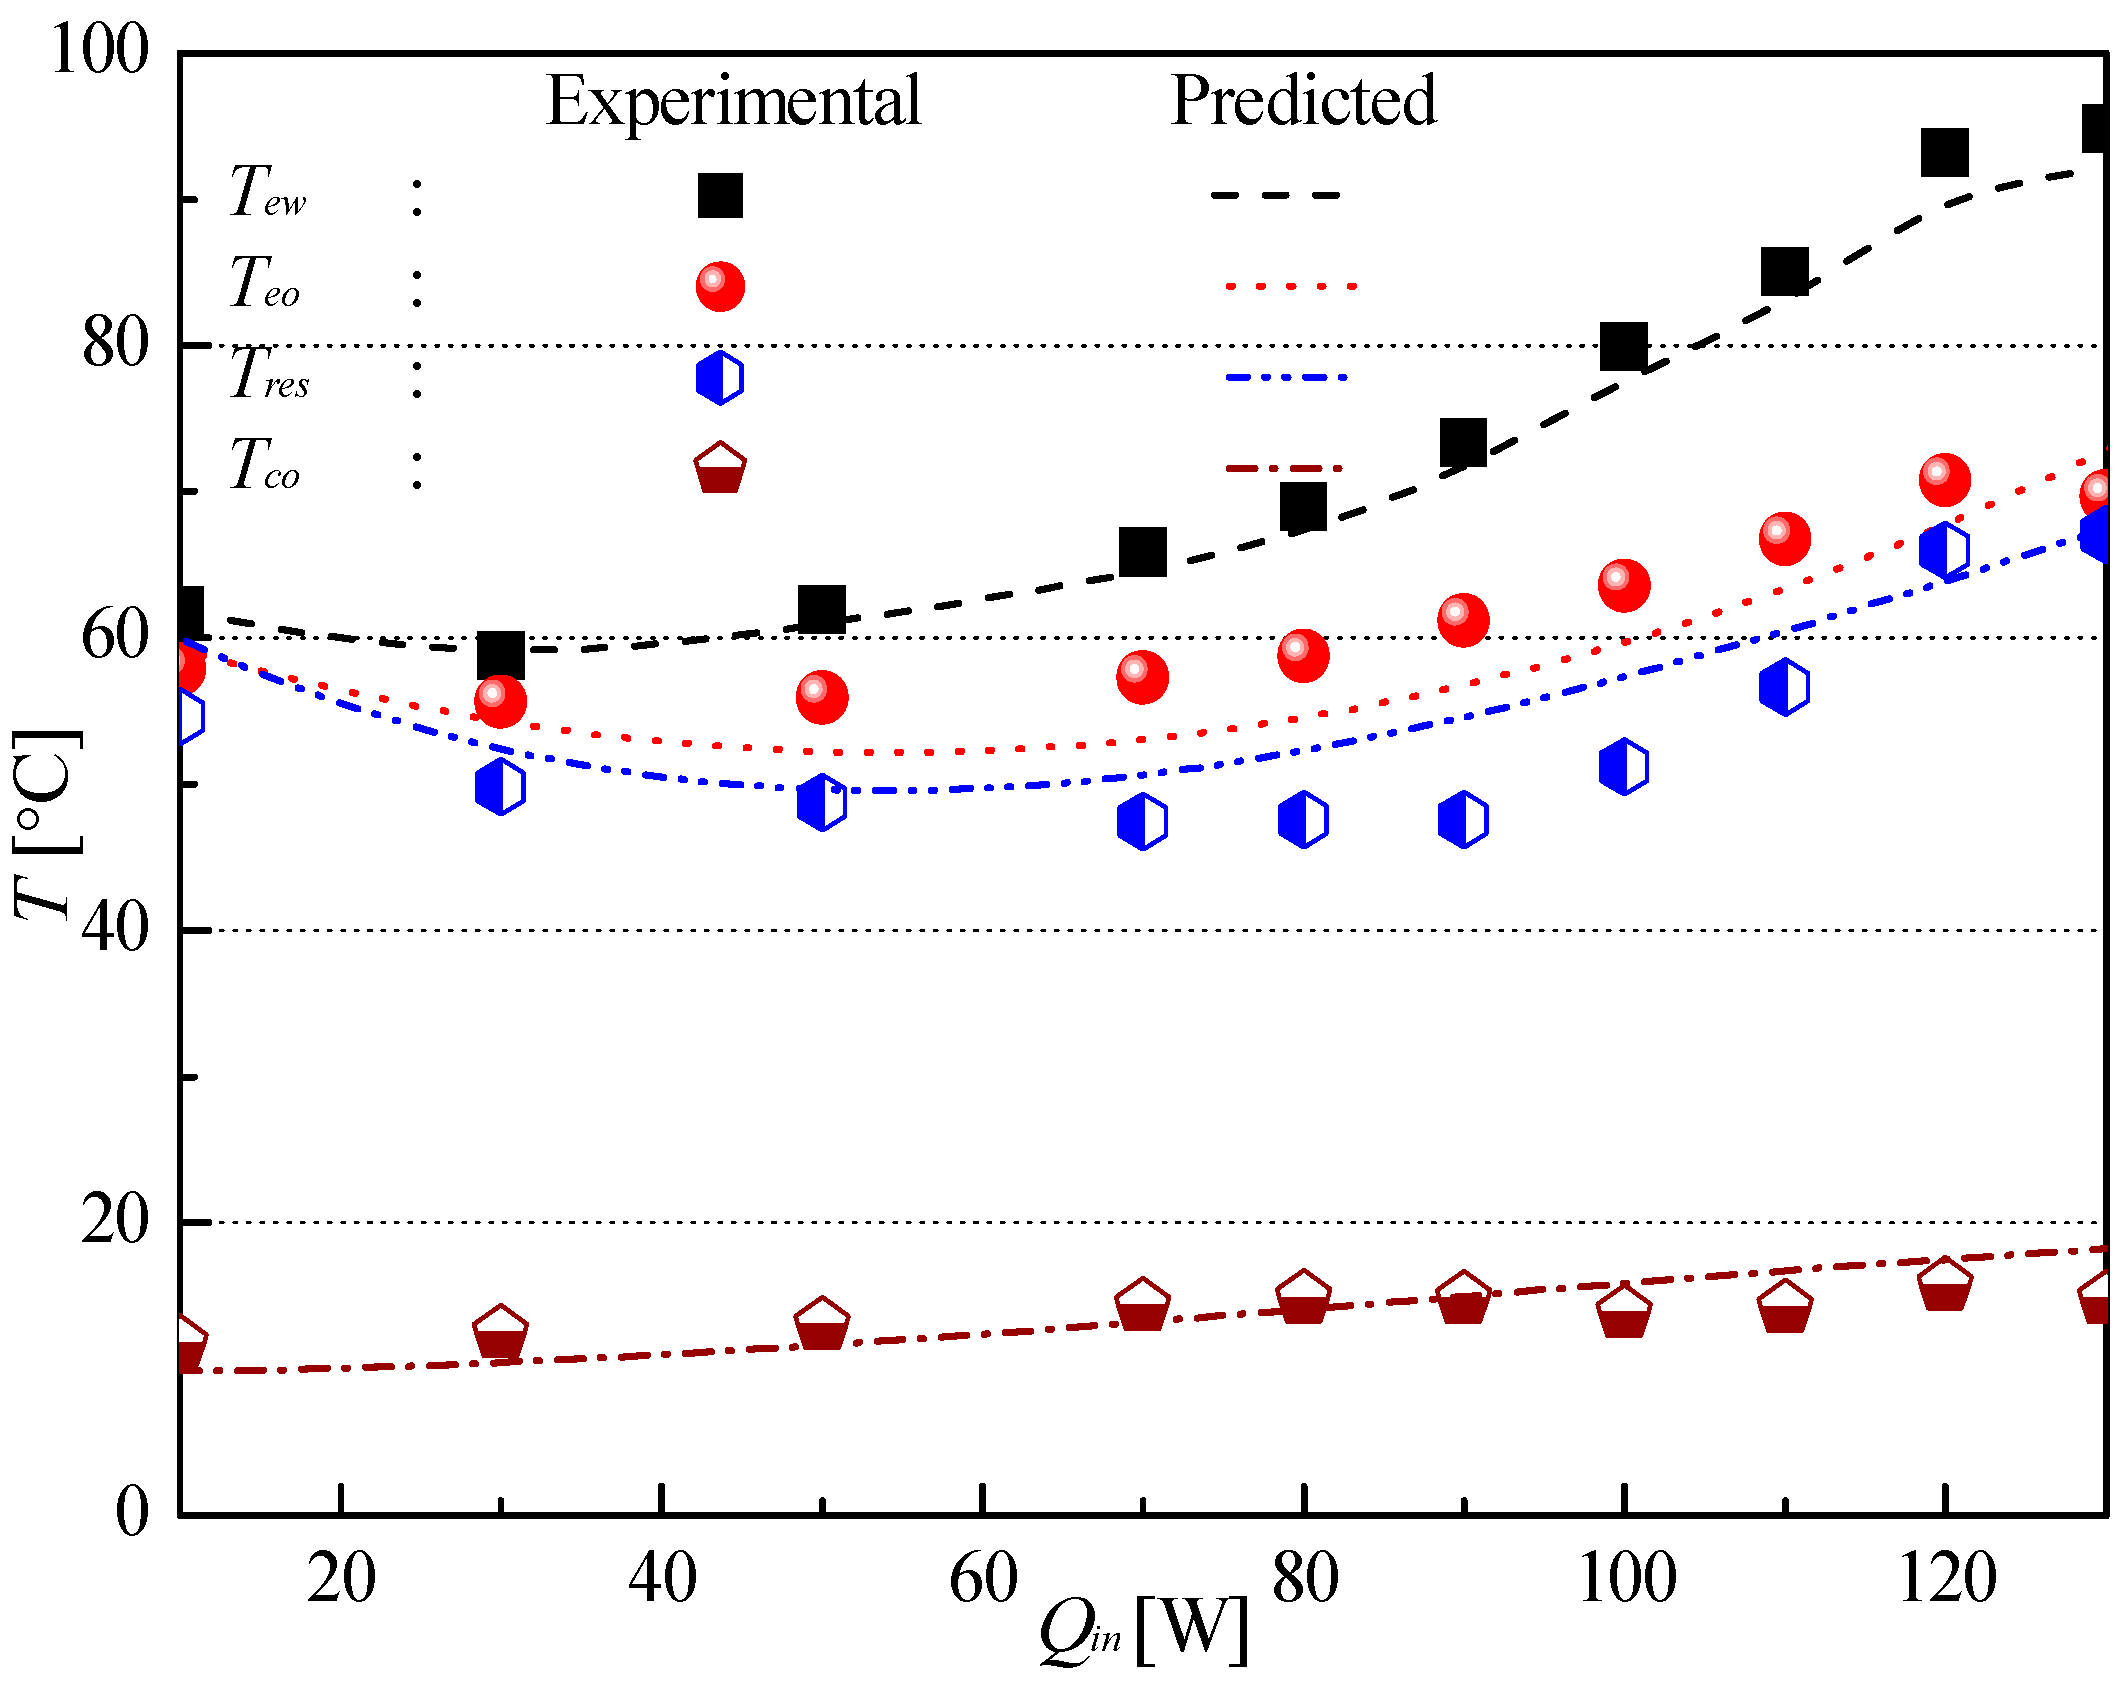
Figure 11 represents the comparison between experimentally obtained and numerically predicted values of temperatures Tew, Tev, Tr, and Tco when the FLHP setup was set at the preferred orientation of 7°. Input thermal loads considered in this analysis were in the range of 10–110 W. As can be realized from Figure 11, the observed error between experimental and predicted values of Tew equaled less than 1.4% corresponding to a thermal load of 70 W. With regard to Tev, the said error was relatively high, albeit not exceeding 2%. The observed maximum and minimum errors associated with Tev evaluation equaled 1.5% (at a thermal load of 110 W) and 0.6% (at a thermal load of 10 W), respectively. The error associated with Tr was, in generally, observed to be less than 4%, and its maximum value of 3.8% was observed at an input thermal load of 110 W. The error concerning Tco evaluation generally equaled less than 0.9%. At a heat load of 100 W, the value of the said error equaled 0.8%, whereas at a thermal load of 10 W, the corresponding error equaled 0.07%, thereby demonstrating excellent agreement between the experimental data and the predicted results.
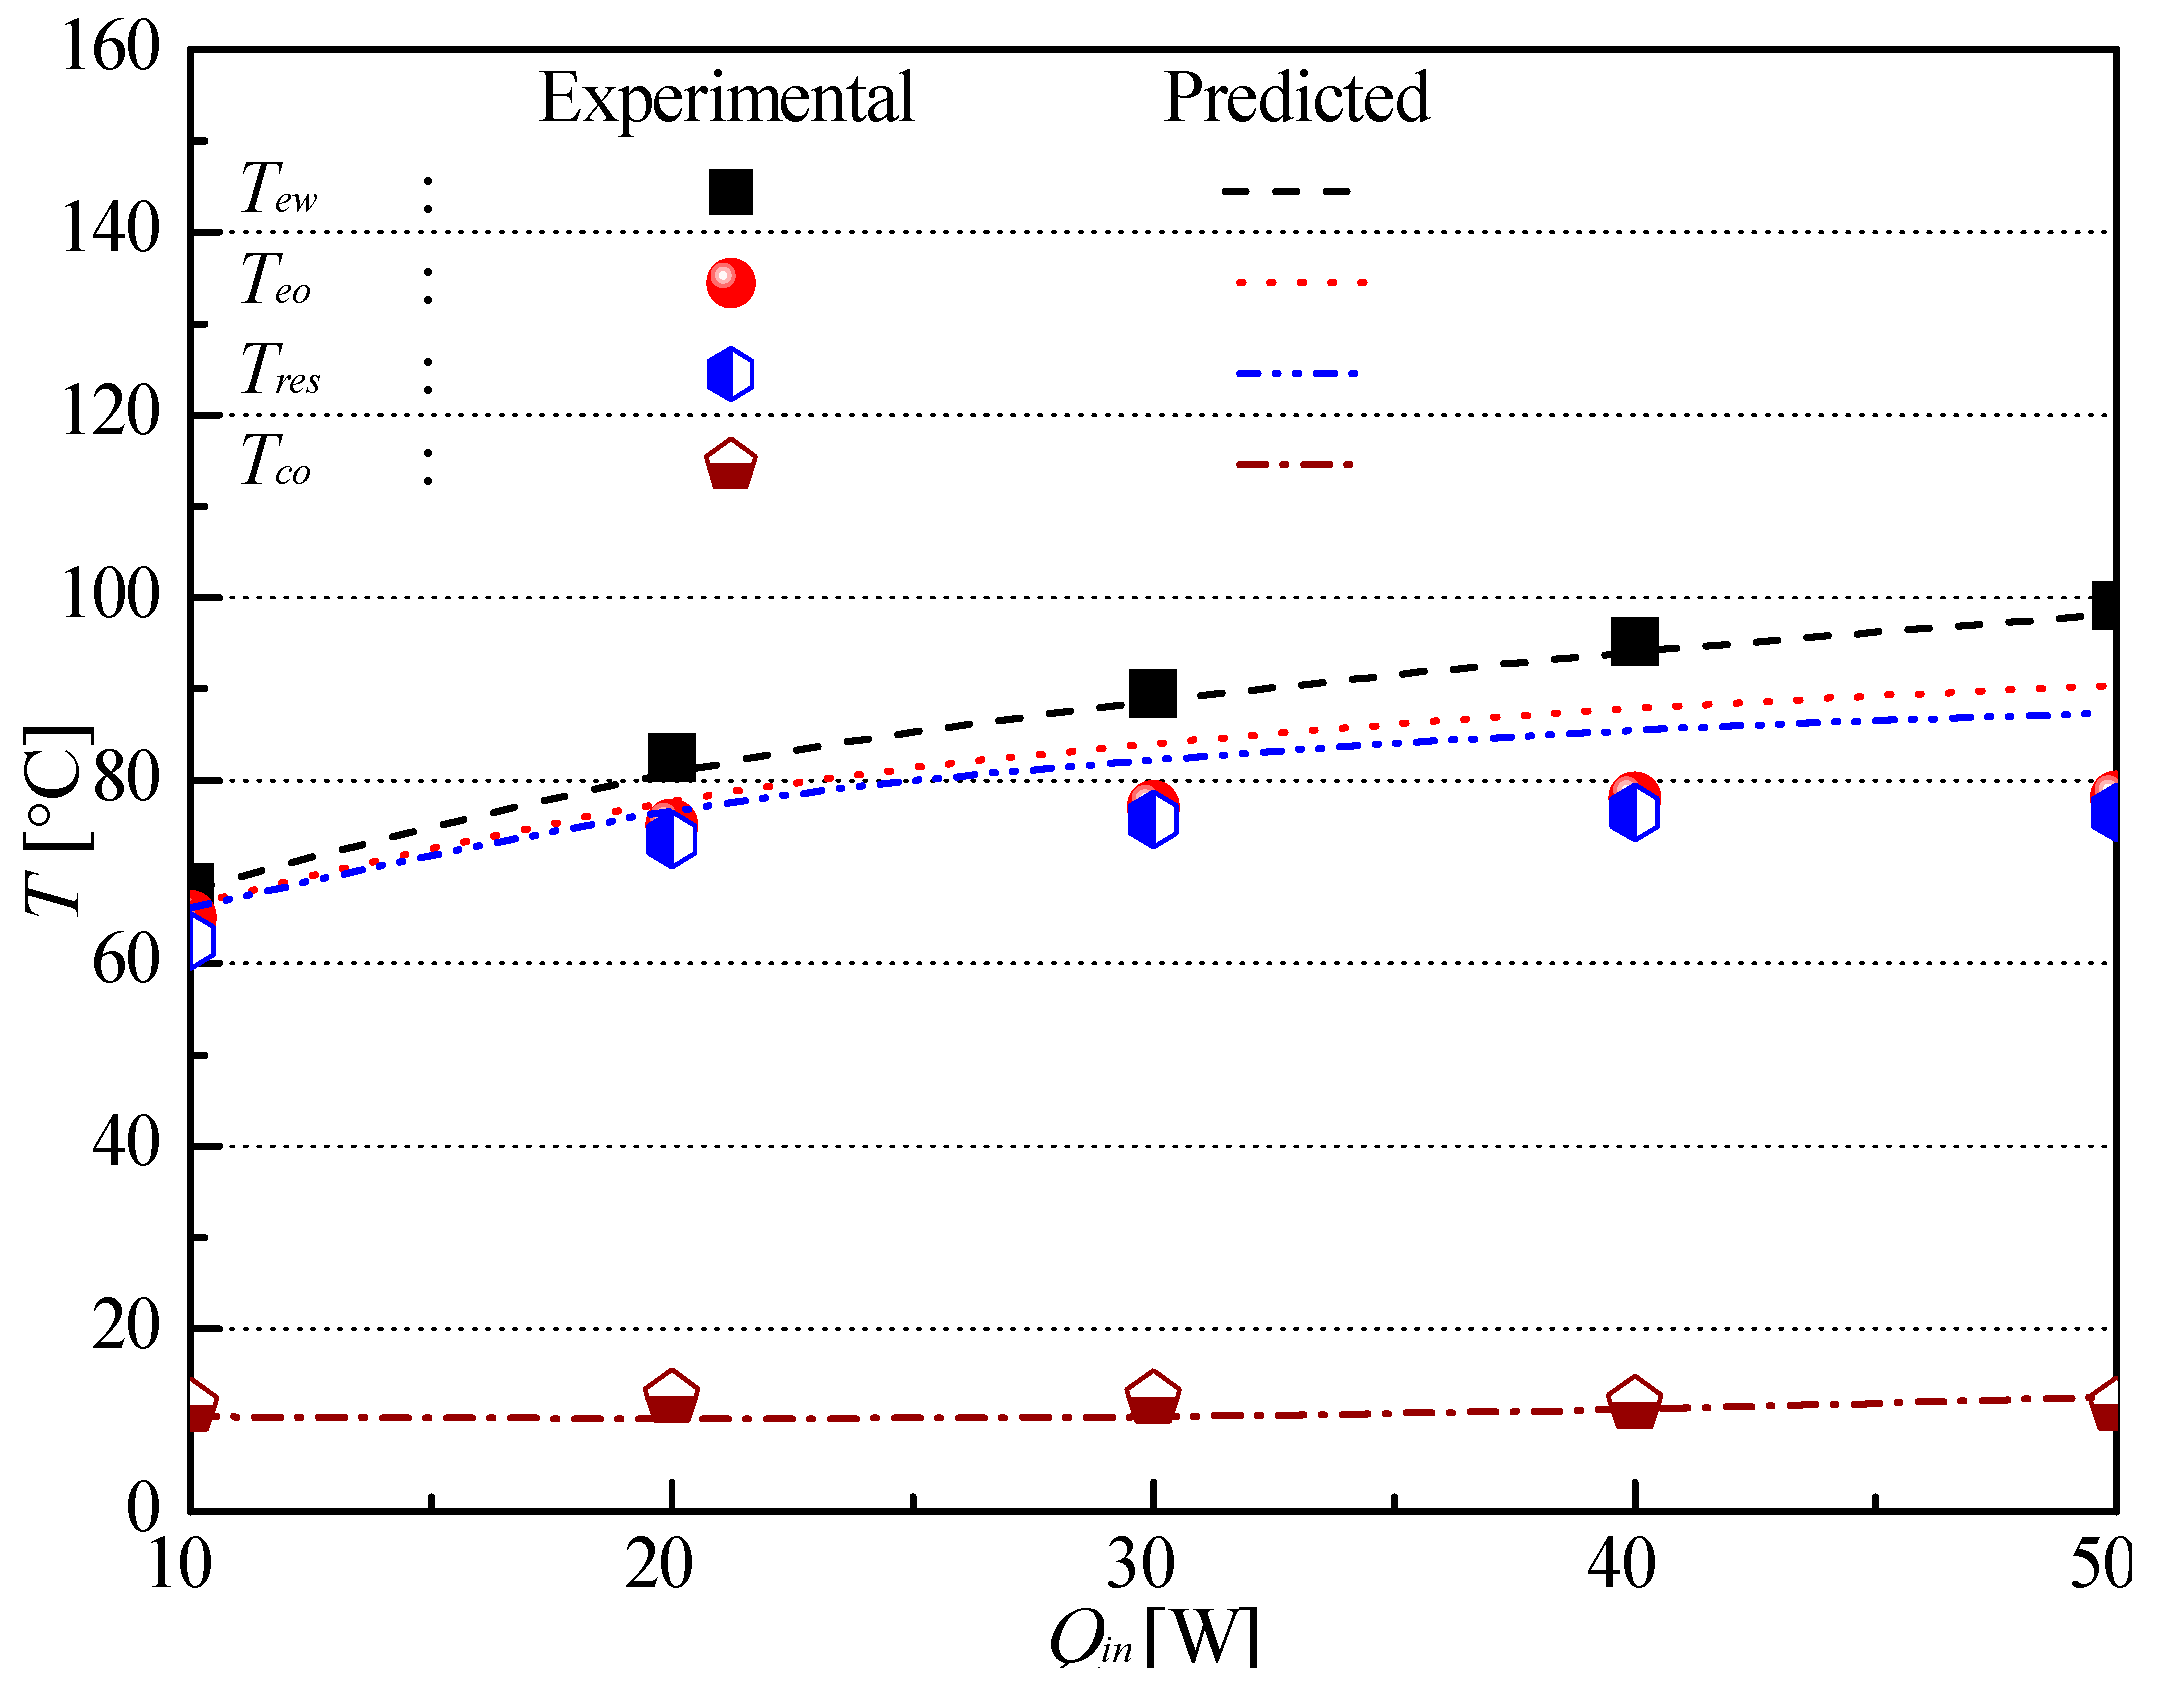
Figure 12 summarizes the comparison between experimental data and predicted values of temperatures Tew, Tev, Tr, and Tco with the FLHP structure being set at the 10° adverse orientation. Input thermal loads considered in this analysis lay in the range 10–50 W. As depicted in Figure 12, the error concerning Tew evaluation was observed to be less than 0.3% (maximum value) at a thermal load of 110 W. With regard to Tev, the said error demonstrated a high value, albeit not exceeding 4%. The maximum error concerning Tev evaluation equaled 3.5% at a thermal load of 50 W, whereas the corresponding minimum value equaled 0.4% at a thermal load of 10 W. The error concerning Tr evaluation generally equaled less than 3.2%, and its maximum value of 3.1% was observed at an input thermal load of 50 W. The error concerning Tco evaluation was observed for the most part to be less than 0.9%. At a thermal load of 20 W, the observed error was seen to be relatively high at 0.8%, and as the thermal load increased to 40 W, the said error was reduced to 0.3%, thereby demonstrating good agreement between experimental and predicted data.
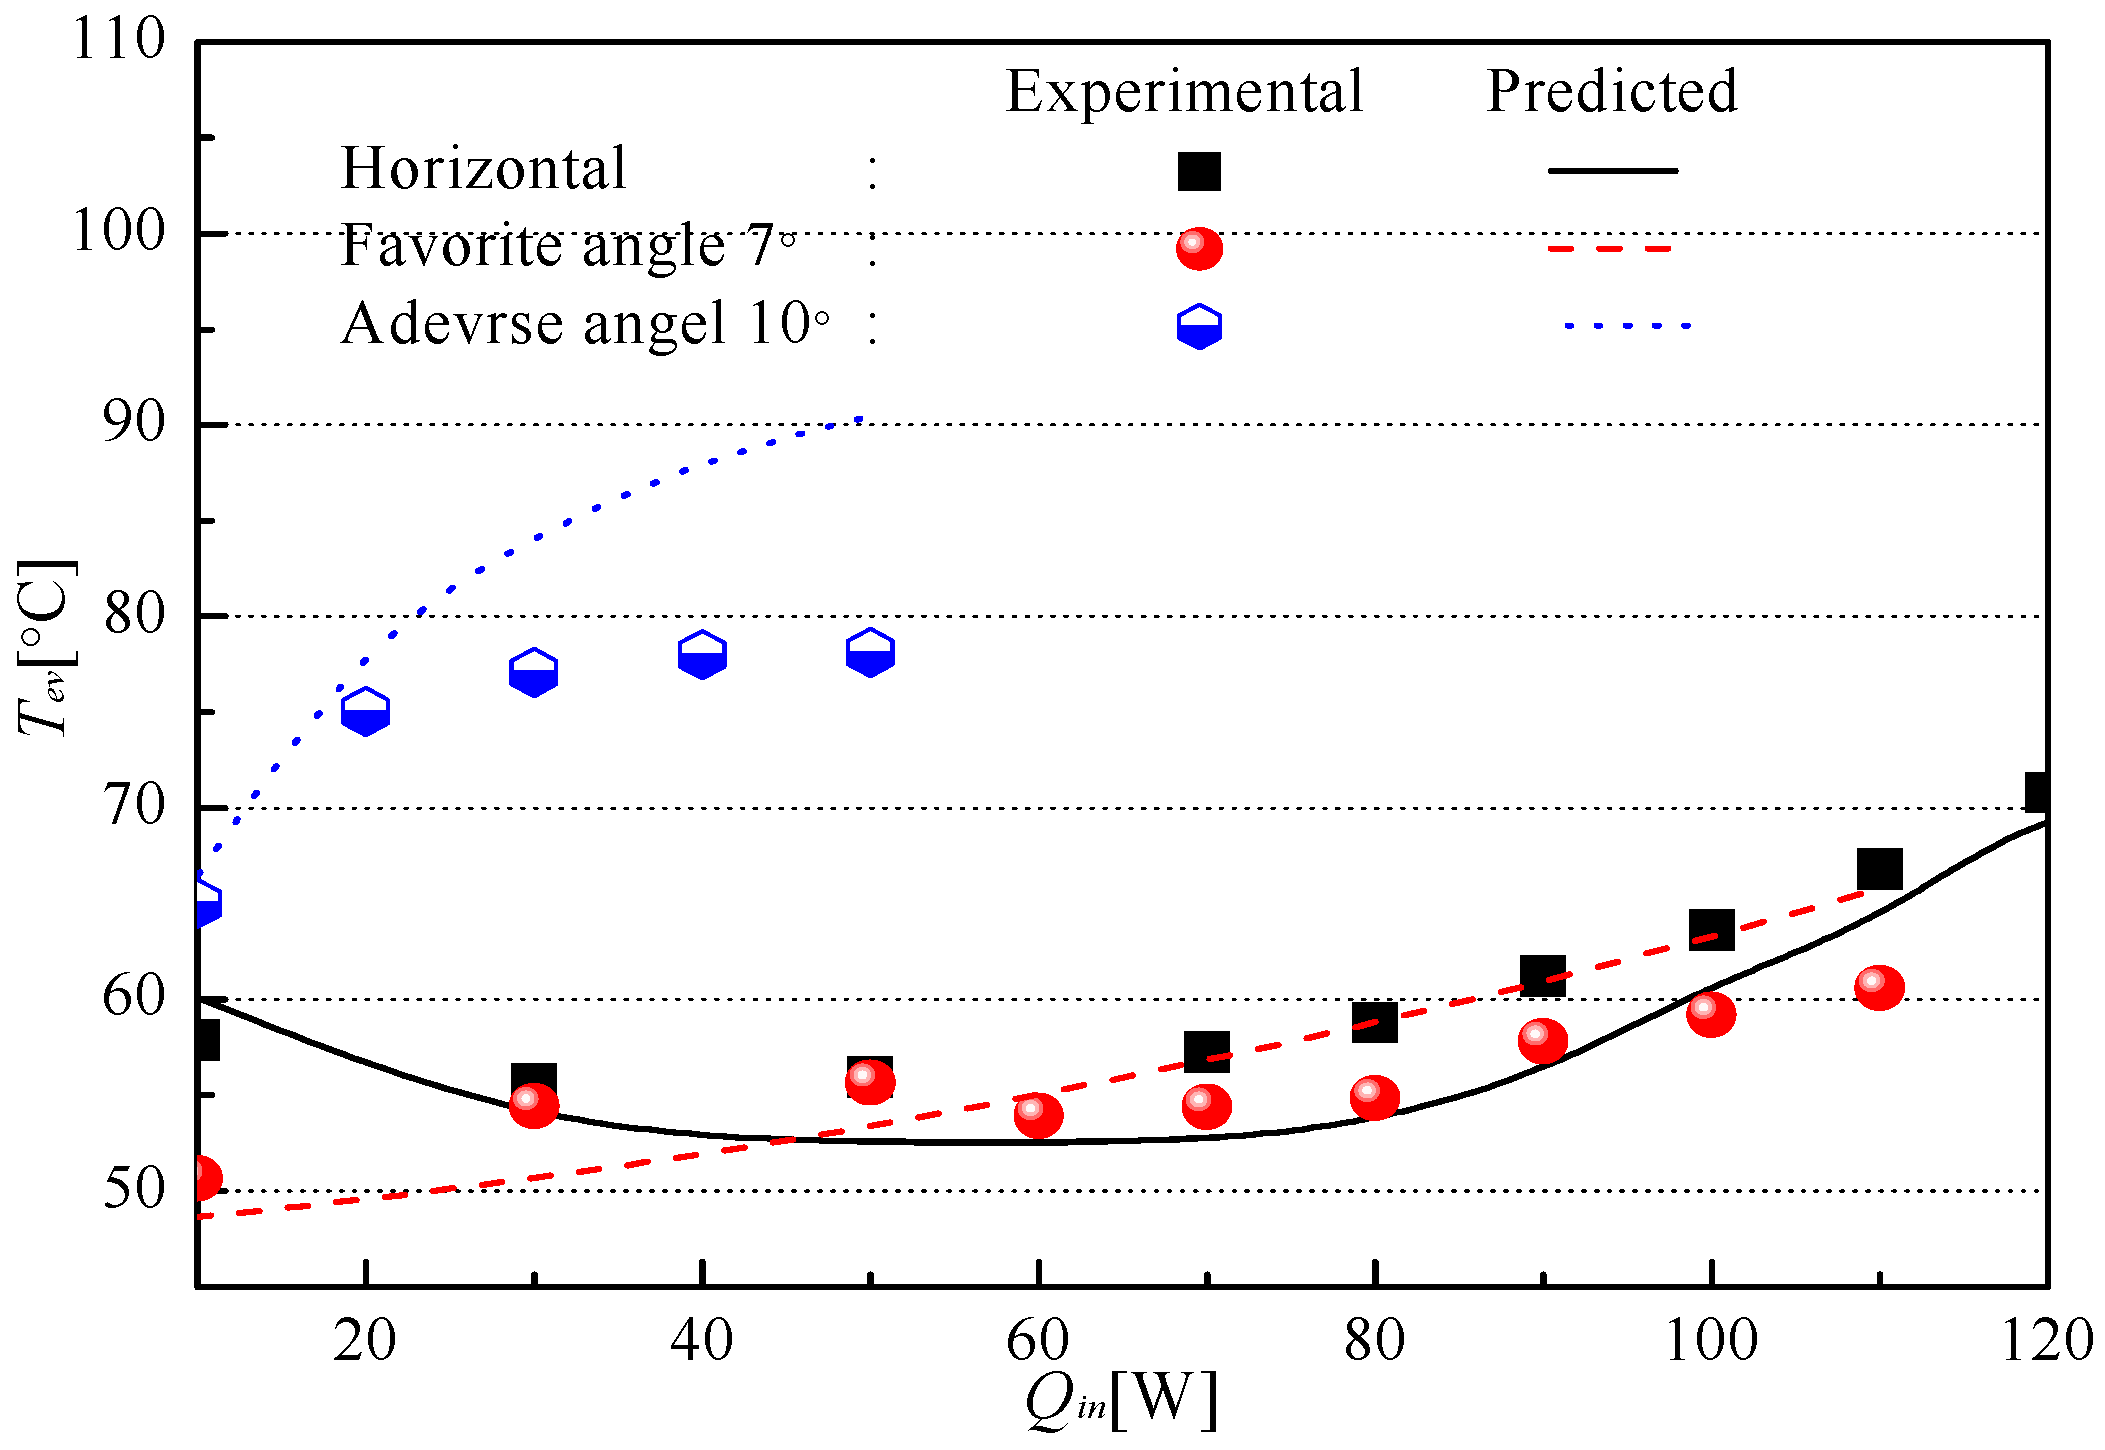
Figure 13 depicts the comparison between experimental data and predicted results concerning Tev when employing the three above-mentioned FLHP orientations. As described in Part I of this research, the proposed steady-state mathematical model does not account for the effects of orientation, and the horizontal alignment was defined based on the analysis reported in Part II. As can be observed in in Figure 13, the error between the experimental data and the predicted values of Tev in the horizontal alignment was smaller compared to that corresponding to other orientations. For example, when employing the 10° adverse orientation, the observed maximum error value equaled 39% at an input thermal load of 50 W, whereas its corresponding minimum value equaled 12.5% at a thermal load of 10 W. When employing the preferred 7° orientation, the observed error was low compared to the horizontal-alignment case with a maximum value of 12.5% at an input thermal load of 10 W and minimum of 12% at a thermal load of 50 W.
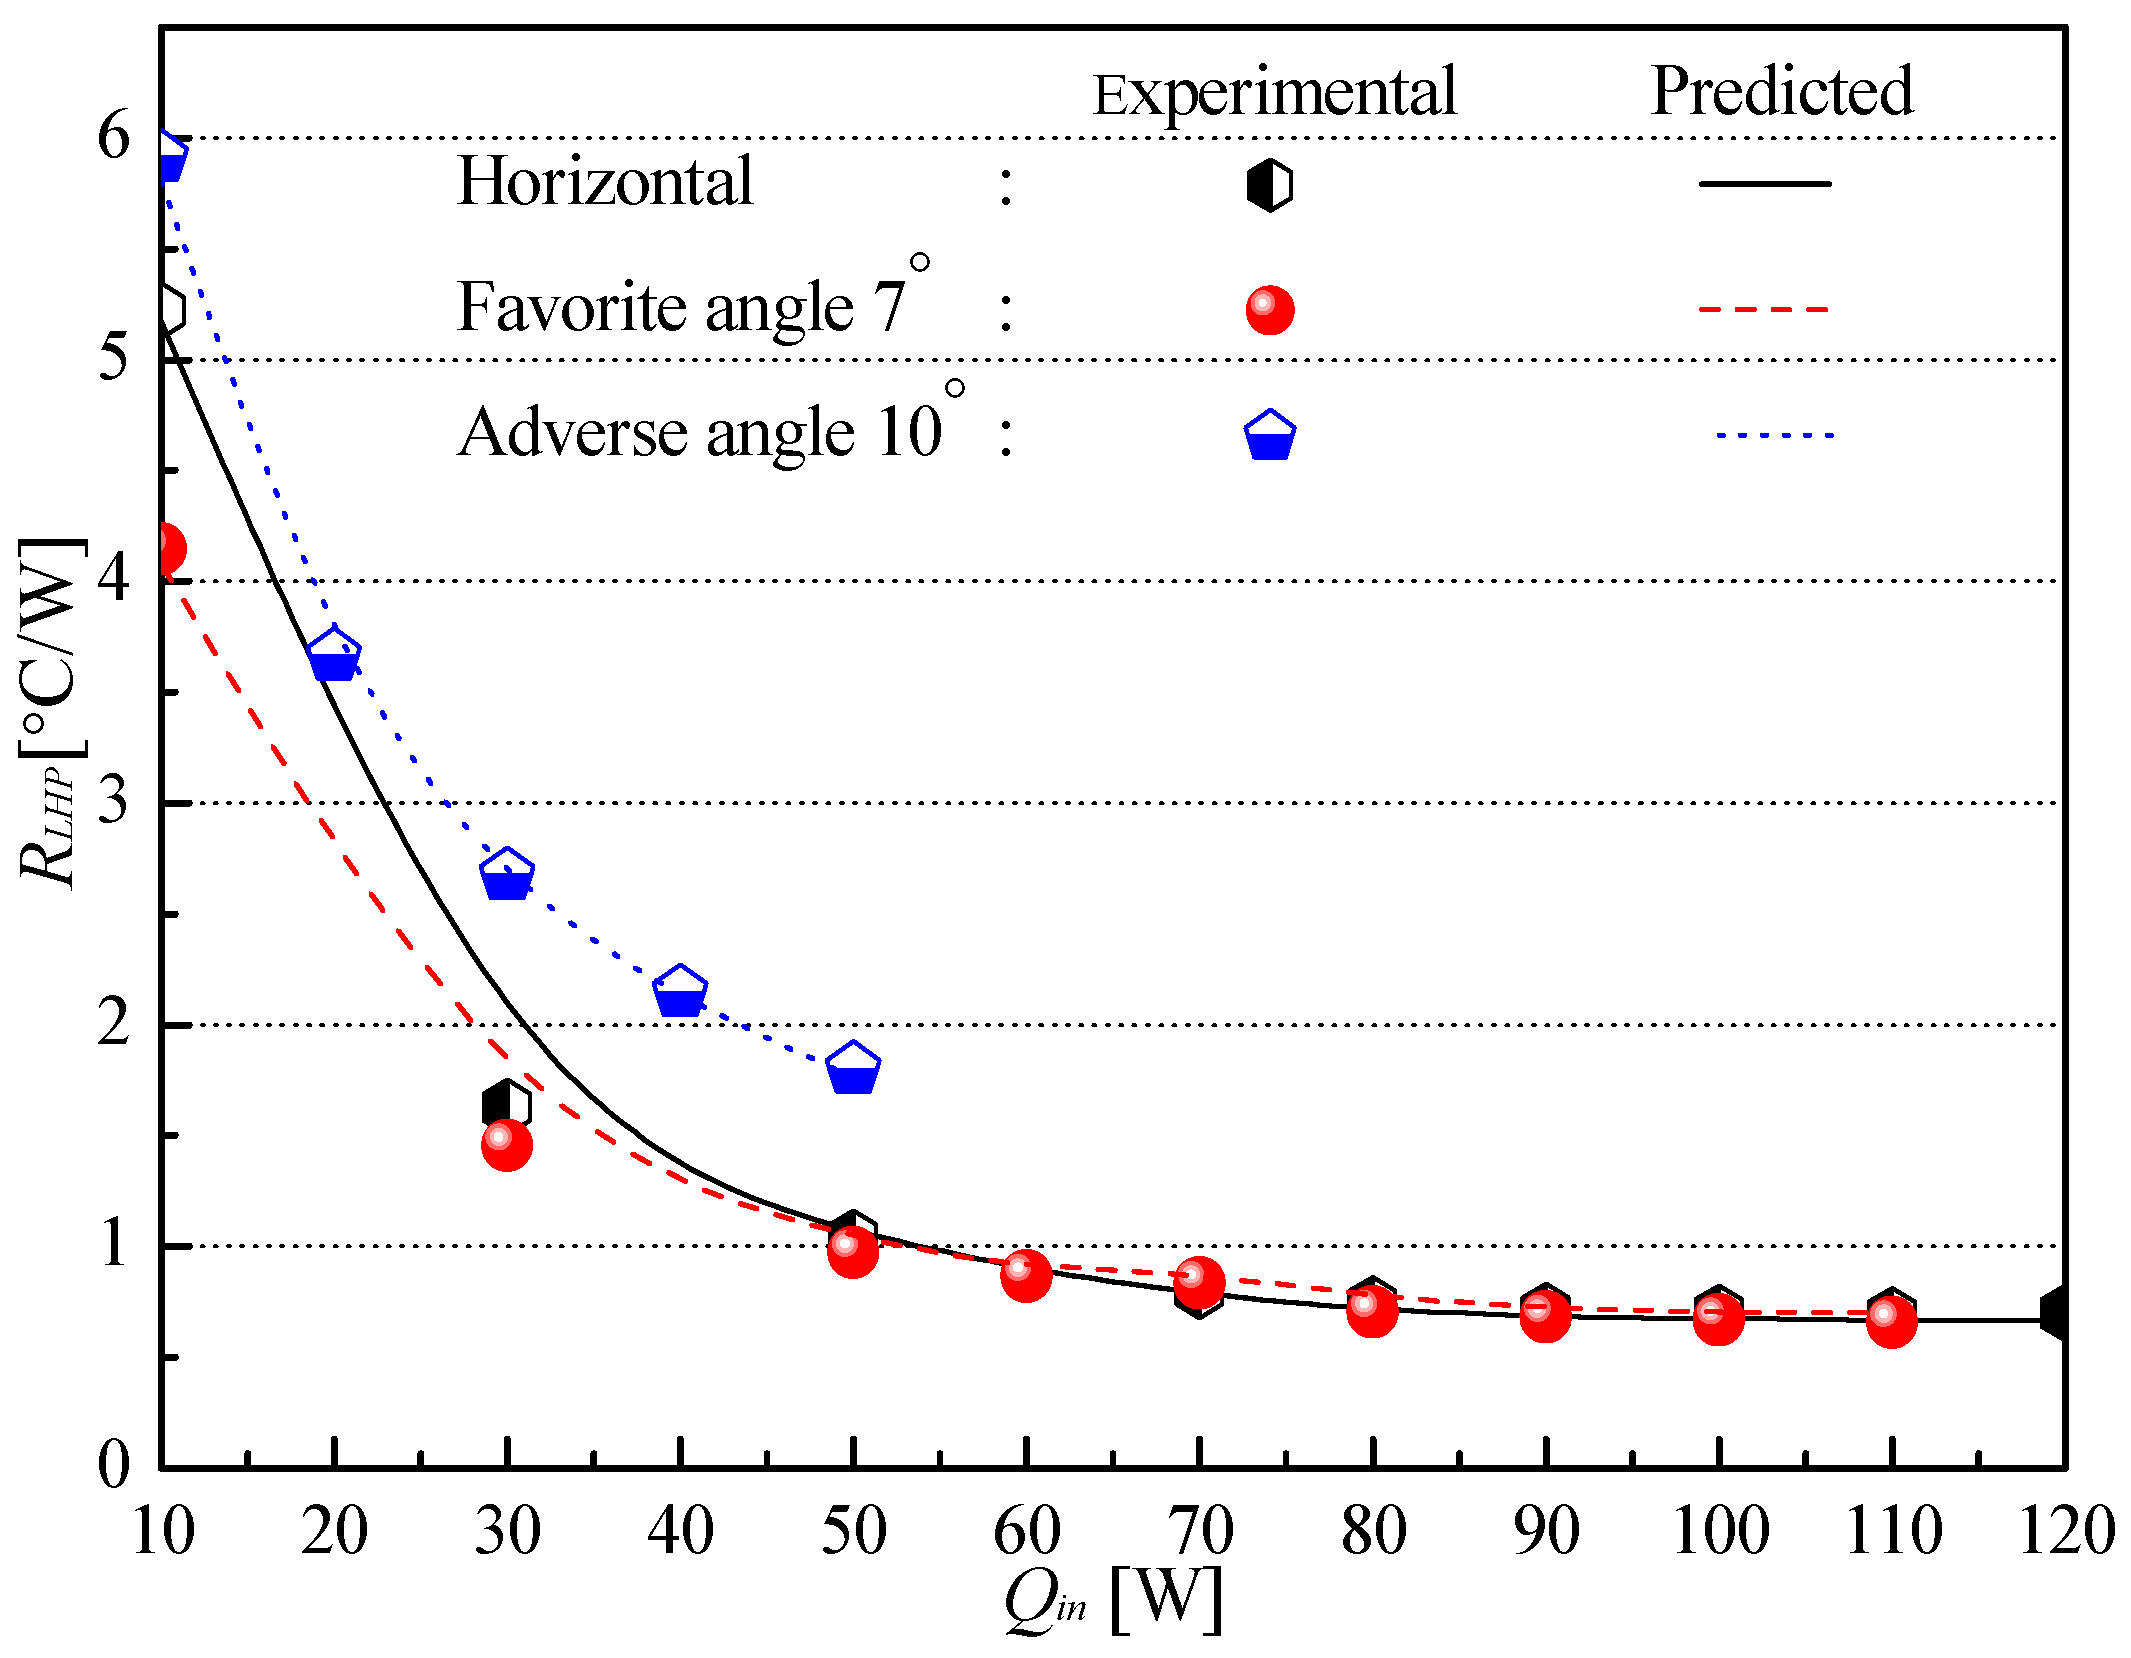
Finally, Figure 14 represents the comparison between the experimental data and the predicted results concerning the thermal resistances observed for the three FLHP orientations. Predicted values of the said thermal resistance were obtained using Equation (3). As depicted in Figure 14, the observed error between the experimentally obtained and predicted thermal-resistance values generally equaled less than 5% in the horizontal-alignment case. The corresponding maximum and minimum values equaled 4.3% (at an input thermal load of 130 W), and 0.9% (at a thermal load of 10 W), respectively. When employing the 10° adverse orientation, the observed error generally equaled less than 10% (higher compared to the horizontal orientation) with corresponding maximum and minimum values of 9.5% (at an input thermal load of 80 W) and 1.6% (at an input thermal load of 10 W), respectively. When employing the preferred 7° orientation, the observed error in thermal-resistance values generally equaled less than 2% with corresponding maximum and minimum error values of 1.8% (at an input thermal load of 50 W) and 1.6% (at an input thermal load of 30 W), respectively.
4. Conclusions
To verify the accuracy of the steady-state analytical model proposed in Part I of this research, an FLHP configuration was fabricated. Additionally, the analytical model concerning the CLHP configuration was verified in the light of experimental results reported in extant studies. Discrepancies between measured and predicted temperatures concerning the CLHP configuration were evaluated based on the absolute temperature, and as observed, overall error values associated with temperature evaluation generally equaled less than 3%. Correspondingly, errors associated with temperature evaluation concerning the FLHP configuration were also analyzed in terms of absolute temperatures. With regard to the FLHP configuration, the experimental data and prediction results were compared for three different orientations of the LHP structure—horizontal, preferred, and adverse. As observed, at all orientations, the relative error between the experimental data and the analytical predictions equaled less than 3%. In some cases, however, the observed error was observed to be up to 4%. Its maximum value, however, did not exceed 5%. As regards the LHP thermal resistance, the observed relative error between the experimental data and predicted values equaled less than 6%. The proposed study, therefore, verifies the validity of the mathematical model established in Part I, and the authors believe the said model to be useful with regard to prediction of the LHP heat-transfer performance within a fixed error range.
Author Contributions
E.G.J. performed the experiments and analysis. J.H.B. provided a supervisory role and generally managed the research.
Funding
This research was supported the National Research Foundation of Korea (NRF) grant funded by the Korea government (MSIT) (No. NRF-2016R1A2B4014933 and No. NRF- 2018R1D1A1B07040929).
Conflicts of Interest
The authors declare no conflict of interest.
Nomenclature
| A | Area [m2] |
| F | Thermal conductance [W/°C] |
| h | Convective heat transfer coefficient [W/m2] |
| M | Mass of the working fluid [kg] |
| Q | Thermal load (W) |
| R | Thermal resistance (°C/W) |
| T | Temperature (°C) |
| Average temperature (°C) | |
| U | Overall heat transfer coefficient [kg/m2] |
| V | Volume (mL) |
| α | Fill-charge ratio |
| ρ | Density (kg/m3) |
Subscripts
| am | Ambient |
| am-ew | Between ambient and evaporator wall |
| bl | Bypass line (or auxiliary loop) |
| c | Condenser |
| charge | Charge rate |
| ci | Condenser inlet |
| cl | Condenser liquid |
| co | Condenser outlet |
| cond | Condenser wall (average) |
| cool. in | Coolant inlet |
| cool. out | Coolant outlet |
| cv | Condenser vapor |
| cw | Condenser wall |
| e | Evaporator |
| ew | Evaporator wall (average) |
| ew-g | Between evaporator wall and vapor removal groove |
| ev | Evaporator vapor |
| eo | Evaporator outlet |
| ei | Evaporator inlet |
| g-w | Between vapor removal groove and wick |
| in | Inlet, input |
| l | Liquid |
| lv | Evaporation process |
| ll | Liquid line |
| r | Reservoir |
| start | Start-up |
| SYS | System |
| th | Thermal |
| v | Vapor |
| vl | Vapor line |
| w | Wall or wick |
| wick.i | Wick inlet |
| w-wi | Between wick and wick inlet |
References
- Maidanik, Y.F. Loop heat pipes. Appl. Therm. Eng. 2005, 25, 635–657. [Google Scholar] [CrossRef]
- Valeri, V.V.; Roger, R.R. Mathematical model of a loop heat pipe with cylindrical evaporator and integrated reservoir. Appl. Therm. Eng. 2008, 28, 942–953. [Google Scholar]
- Zhang, X.; Zhao, X.; Shen, J.; Xu, J.; Yu, X. Dynamic performance of a novel solar photovoltaic/loop-heat-pipe heat pump system. Appl. Energy 2014, 114, 335–352. [Google Scholar] [CrossRef]
- Zhang, X.; Shen, J.; Xu, P.; Zhao, X.; Xu, Y. Socio-economic performance of a novel solar photovoltaic/loop-heat-pipe heat pump water heating system in three different climatic regions. Appl. Energy 2014, 135, 20–34. [Google Scholar] [CrossRef]
- Zhang, X.; Zhao, X.; Xu, J.; Yu, X. Characterization of a solar photovoltaic/loop-heat-pipe heat pump water heating system. Appl. Energy 2013, 102, 1229–1245. [Google Scholar] [CrossRef]
- Diallo, T.M.O.; Yu, M.; Zhou, J.; Zhao, X.; Shittu, S.; Li, G.; Ji, J.; Hardy, D. Energy performance analysis of a novel solar PVT loop heat pipe employing a microchannel heat pipe evaporator and a PCM triple heat exchanger. Energy 2019, 167, 866–888. [Google Scholar] [CrossRef]
- Yu, M.; Diallo, T.M.O.; Zhao, X.; Zhou, J.; Du, Z.; Ji, J.; Cheng, Y. Analytical study of impact of the wick’s fractal parameters on the heat transfer capacity of a novel micro-channel loop heat pipe. Energy 2018, 158, 746–759. [Google Scholar] [CrossRef]
- He, W.; Hong, X.; Zhao, X.; Zhang, X.; Shen, J.; Ji, J. Operational performance of a novel heat pump assisted solar façade loop-heat-pipe water heating system. Appl. Energy 2015, 146, 371–382. [Google Scholar] [CrossRef]
- Liao, Z.; Xu, C.; Ren, Y.; Gao, F.; Ju, X.; Du, X. Thermal analysis of a conceptual loop heat pipe for solar central receivers. Energy 2018, 158, 709–718. [Google Scholar] [CrossRef]
- Jouhara, H.; Meskimmon, R. An investigation into the use of water as a working fluid in wraparound loop heat pipe heat exchanger for applications in energy efficient HVAC systems. Energy 2018, 156, 597–605. [Google Scholar] [CrossRef]
- Jouhara, H.; Ezzuddin, H. Thermal performance characteristics of a wraparound loop heat pipe (WLHP) charged with R134A. Energy 2013, 61, 128–138. [Google Scholar] [CrossRef]
- Jouhara, H.; Meskimmon, R. Experimental investigation of wraparound loop heat pipe heat exchanger used in energy efficient air handling units. Energy 2010, 35, 4592–4599. [Google Scholar] [CrossRef]
- Wang, D.; Liu, Z.; He, S.; Yang, J.; Liu, W. Operational characteristics of a loop heat pipe with a flat evaporator and two primary biporous wicks. Int. J. Heat Mass Transf. 2015, 89, 33–41. [Google Scholar] [CrossRef]
- Liu, Z.; Wang, D.; Jiang, C.; Yang, J.; Liu, W. Experimental study on loop heat pipe with two-wick flat evaporator. Int. J. Therm. Sci. 2015, 94, 9–17. [Google Scholar] [CrossRef]
- He, S.; Liu, Z.-C.; Zhao, J.; Jiang, C.; Yang, J.-G.; Liu, W. Experimental study of an ammonia loop heat pipe with a flat plate Evaporator. Int. J. Heat Mass Transf. 2016, 102, 1050–1055. [Google Scholar] [CrossRef]
- Xu, J.; Ji, X.; Yang, W.; Zhao, Z. Modulated porous wick evaporator for loop heat pipes: Experiment. Int. J. Heat Mass Transf. 2014, 72, 163–176. [Google Scholar] [CrossRef]
- He, S.; Zhao, J.; Liu, Z.; Wei, T.; Yang, J.; Liu, W. Experimental investigation of loop heat pipe with a large squared evaporator for cooling electronics. Appl. Therm. Eng. 2018, 144, 383–391. [Google Scholar] [CrossRef]
- Chernysheva, M.A.; Maydanik, Y.F. Effect of liquid filtration in a wick on thermal processes in a flat disk-shaped evaporator of a loop heat pipe. Int. J. Heat Mass Transf. 2017, 106, 222–231. [Google Scholar] [CrossRef]
- Boo, J.H.; Chung, W.B. Experimental study on the thermal performance of small-scale loop heat pipe with polypropylene wick. J. Mech. Sci. Technol. 2005, 19, 1052–1061. [Google Scholar] [CrossRef]
- Jung, E.G. Heat Transfer Analysis and Experimental Study of the Loop Heat Pipe Employing Thin-Film Theory. Ph.D. Thesis, Korea Aerospace University, Goyang, Korea, 2009. [Google Scholar]
- Jung, E.G.; Boo, J.H. Analytical modeling of a loop heat pipe with a flat evaporator by applying thin-film theory. Trans. KSME B 2010, 34, 1079–1085. [Google Scholar] [CrossRef]
- Mohammed, H.; Debra, C.; Praveen, M.; Ahmed, S.; Frank, M.G.; Henderson, H.T.; Golliher, E.; Mellott, K.; Moore, C. Loop Heat Pipe (LHP) Development by Utilizing Coherent Porous Silicon (CPS) wicks. In Proceedings of the Eighth Intersociety Conference on Thermal and Thermomechanical Phenomena in Electronic Systems, San Diego, CA, USA, 30 May–1 June 2002; pp. 457–463. [Google Scholar]
- Holman, J.P. Experimental Methods for Engineers, 8th ed.; McGraw-Hill: New York, NY, USA, 2012; pp. 64–74. [Google Scholar]
- Riehl, R.R.; Siqueira, T.C.P.A. Heat transport capability and compensation chamber influence in loop heat pipes performance. Appl. Therm. Eng. 2006, 26, 1158–1168. [Google Scholar] [CrossRef]
Figure 1.
Schematic of the loop heat pipe (LHP) fabricated in this study and location of thermocouples: (a) Side view; (b) Plane view; (c) Vapor removal groove (units: mm); Thermocouple locations: 1–8: evaporator wall (Tew), 9: wick inlet (Twick.i), 10: liquid reservoir (Tr), 11: evaporator outlet (Tev), 12: vapor line (Tvl), 13: condenser inlet (Tci), 14: condenser outlet (Tco), 15: liquid line (Tll), 16: evaporator inlet (Tei), 17: coolant inlet (Tcool. in), 18: coolant outlet (Tcool. out), 19–21: condenser wall (Tcw).

Figure 2.
Scanning electron microscope (SEM) images of the polypropylene fiber wick structure with pore size of 0.5 μm: (a) normal magnification: of 40×; (b) normal magnification: of 100×; (c) normal magnification: of 400×.
Figure 2.
Scanning electron microscope (SEM) images of the polypropylene fiber wick structure with pore size of 0.5 μm: (a) normal magnification: of 40×; (b) normal magnification: of 100×; (c) normal magnification: of 400×.

Figure 3.
Uncertainty of the thermal resistance in the LHP experiment.

Figure 4.
Comparison between temperature values reported in [24] and those obtained using the steady-state analytical model: (a) CLHP1; (b) CLHP2.
Figure 4.
Comparison between temperature values reported in [24] and those obtained using the steady-state analytical model: (a) CLHP1; (b) CLHP2.

Figure 5.
Comparison between thermal-resistance values based on the temperature data reported in ref. [24] and those obtained using the steady-state analytical model.
Figure 5.
Comparison between thermal-resistance values based on the temperature data reported in ref. [24] and those obtained using the steady-state analytical model.

Figure 6.
Trends concerning temperature change with step increase in evaporator thermal load when LHP setup was aligned horizontally.
Figure 6.
Trends concerning temperature change with step increase in evaporator thermal load when LHP setup was aligned horizontally.

Figure 7.
Start-up of the LHP with evaporator thermal load of 10 W in horizontal alignment.

Figure 8.
Start-up at evaporator thermal load of 120 W with horizontal alignment.

Figure 9.
Trends concerning temperature change with step increase in evaporator thermal load at adverse 10° orientation.
Figure 9.
Trends concerning temperature change with step increase in evaporator thermal load at adverse 10° orientation.

Figure 10.
Comparison between experimental and analytical results concerning typical temperatures at horizontal alignment.
Figure 10.
Comparison between experimental and analytical results concerning typical temperatures at horizontal alignment.

Figure 11.
Comparison between the experimental and analytical results concerning typical temperatures at the preferred 7° orientation.
Figure 11.
Comparison between the experimental and analytical results concerning typical temperatures at the preferred 7° orientation.

Figure 12.
Comparison between experimental and analytical results concerning typical temperatures at the adverse 10° orientation.
Figure 12.
Comparison between experimental and analytical results concerning typical temperatures at the adverse 10° orientation.

Figure 13.
Comparison between experimental and analytical results concerning vapor temperature in the three orientations.
Figure 13.
Comparison between experimental and analytical results concerning vapor temperature in the three orientations.

Figure 14.
Comparison between experimental and analytical results concerning LHP thermal resistance in the three orientations.
Figure 14.
Comparison between experimental and analytical results concerning LHP thermal resistance in the three orientations.


Table 1.
Internal volumes of loop heat pipe (LHP) elements.
| LHP Element | Volume (mL) | Phase |
|---|---|---|
| condenser, Vc | 5.7 | vapor/liquid |
| evaporator, Ve | 4.1 | groove |
| wick, Vw | 4.5 | vapor/Liquid |
| reservoir, Vr | 35.5 | vapor/liquid |
| liquid transport line, Vl | 1.57 | liquid |
| vapor transport line, Vv | 6.28 | vapor |
Table 2.
Uncertainties of the experimental setup for the LHP System in this study.
| Independent Variable | Error (Gauge) | Uncertainty |
|---|---|---|
| thermocouple (Omega Engineering, T-type, 30 AWG) | 0.5 °C | 0.00175 |
| thermal load (ISM, HD-301M) | 0.50% | 0.005 |
| isothermal bath (Neslab, RTE-111) | 0.1 °C | 0.0004 |
| data acquisition system (Fluke, NetDAQ2640A) | 0.01% | 0.0001 |
| flow meter (Dwyer, RMA-2) | 0.5 cc | 0.04 |
| thermal resistance | 0.076 |
© 2019 by the authors. Licensee MDPI, Basel, Switzerland. This article is an open access article distributed under the terms and conditions of the Creative Commons Attribution (CC BY) license (http://creativecommons.org/licenses/by/4.0/).
Share and Cite
MDPI and ACS Style
Jung, E.G.; Boo, J.H. A Novel Analytical Modeling of a Loop Heat Pipe Employing Thin-Film Theory: Part II—Experimental Validation. Energies 2019, 12, 2403. https://doi.org/10.3390/en12122403
AMA Style
Jung EG, Boo JH. A Novel Analytical Modeling of a Loop Heat Pipe Employing Thin-Film Theory: Part II—Experimental Validation. Energies. 2019; 12(12):2403. https://doi.org/10.3390/en12122403
Chicago/Turabian StyleJung, Eui Guk, and Joon Hong Boo. 2019. "A Novel Analytical Modeling of a Loop Heat Pipe Employing Thin-Film Theory: Part II—Experimental Validation" Energies 12, no. 12: 2403. https://doi.org/10.3390/en12122403
Note that from the first issue of 2016, this journal uses article numbers instead of page numbers. See further details here.