Article

Determination of the Lignocellulosic Components of Olive Tree Pruning Biomass by Near Infrared Spectroscopy

by
José Luis Fernández
1,
Felicia Sáez
1,
Eulogio Castro
2,
Paloma Manzanares
1,
Mercedes Ballesteros
1 and
María José Negro
1,*
1
Biofuels Unit, Energy Department, Research Centre for Energy, Environment and Technology (CIEMAT), Complutense Av, 22, 28040 Madrid, Spain
2
Department of Chemical, Environmental and Materials Engineering, University of Jaén, Campus Las Lagunillas, 23071 Jaén, Spain
*
Author to whom correspondence should be addressed.
Energies 2019, 12(13), 2497; https://doi.org/10.3390/en12132497
Submission received: 30 May 2019 / Revised: 25 June 2019 / Accepted: 26 June 2019 / Published: 28 June 2019
(This article belongs to the Special Issue Biorefinery Based on Olive Biomass)

Abstract

:
The determination of chemical composition of lignocellulose biomass by wet chemistry analysis is labor-intensive, expensive, and time consuming. Near infrared (NIR) spectroscopy coupled with multivariate calibration offers a rapid and no-destructive alternative method. The objective of this work is to develop a NIR calibration model for olive tree lignocellulosic biomass as a rapid tool and alternative method for chemical characterization of olive tree pruning over current wet methods. In this study, 79 milled olive tree pruning samples were analyzed for extractives, lignin, cellulose, hemicellulose, and ash content. These samples were scanned by reflectance diffuse near infrared techniques and a predictive model based on partial least squares (PLS) multivariate calibration method was developed. Five parameters were calibrated: Lignin, cellulose, hemicellulose, ash, and extractives. NIR models obtained were able to predict main components composition with R2cv values over 0.5, except for lignin which showed lowest prediction accuracy.

1. Introduction

Within the last two decades, components of biomass materials such as lignocellulosic residues have increasingly received more attention in the science community due to their potential for the production of biofuels, as well as new value-added compounds and biomaterials utilizing a “biorefinery” approach.
Olive trees are usually native to the Mediterranean countries, but cultivation has spread globally during the past two decades due to healthy benefits attributed to olive oil consumption. Currently, olive trees are cultivated in more than 40 countries, and the total dedicated surface is about 10.8 million ha in 2017 [1]. Olive tree pruning (OTP) biomass takes place immediately after fruit collection and is an essential operation performed every two years after fruit harvesting. In the Mediterranean region, residual biomass from olive tree pruning yield ranges from 1 to 5 and from 4 to 11 oven dry t ha−1 respectively for Spanish and Italian orchards [2]. Older branches are cut down, gathered into to the center of each row of trees, and further treated. This agricultural residue must be promptly eliminated from the cultivation fields; otherwise a risk for vegetal diseases may arise. Currently, two different applications for this pruning biomass exist, either grinding it or scattering the chips over the field or direct burning. Direct burning represents the most common method of disposal, which puts the field at risk of an uncontrollable fire and thus an economic cost, although some initiatives are being carried out to develop collecting techniques [3]. It has been proposed to use this waste as raw material for obtaining a broad range of products [4,5], including energy, biofuels as bioethanol [6,7,8,9], antioxidant compounds [10,11], oligosaccharides [12], and others [13].
For any application of olive tree pruning residue it is essential to know its chemical composition in order to establish the most adequate conversion process. Moreover, the ratio of main structural components i.e., cellulose, hemicellulose, and lignin, as well as other minor components in a particular biomass, is of crucial importance to determine the potential markets applications. The current methods of chemical characterization of the composition of biomass feedstock are labor-intensive and time consuming, and thus do not meet industrial requirements for providing quick measurements. Moreover, they are often based on wet-laboratory analysis, during which the integrity and structure of the material is destroyed [14]. By contrast, the non-destructive spectroscopy techniques provides analytical information without damaging the sample and in most of the cases, in addition, sample treatment is not required. Vibrational techniques such as IR spectroscopy are amongst the non-destructive spectroscopy techniques that have attracted more interest in the last years [15,16]. Additionally, infrared spectroscopy techniques are fast, accurate, and low-cost analytical methods with high potential in biomass composition analysis [17,18]. In this context, diffuse reflectance near infrared spectroscopy (NIR) has been suggested as a re- and non-destructive method to replace reference methods for determination of lignocellulosic components of feedstock and capacity for bioethanol production [19]. In fact, near-infrared spectroscopic scanning (NIR) coupled with multivariate calibration methods have been developed to characterize different herbaceous feedstocks [20], switchgrass [21], pine [22], yellow-poplar [23], willow [24], Miscanthus [25], and bamboo [26]. NIR technique application for olive residues has been reported to analyze solid fuels for heat and power generation [27]. However, to date, there is no literature on NIR application to determine chemical composition of olive tree pruning biomass for liquid biofuels such as bioethanol or other valuable products.
This work attempts to demonstrate the effectiveness of near infrared diffuse reflectance spectroscopy (NIR) as a rapid and non-destructive method as an alternative to the wet chemical analysis methods for the determination of structural carbohydrates, lignin, and ash in olive tree pruning biomass.

2. Materials and Methods

2.1. Raw Material

Olive tree pruning was collected from different locations in Andalusia (Spain) after fruit harvesting. A total of 79 samples were gathered, 64 of which were used for calibration models, and 15 for external validation. Samples used in this work were collected manually, using a pruning shear, and corresponded to shoots less than 3 cm diameter with approximately 70% of leaves and 30% thin steams by weight. All samples were air-dried at room temperature to equilibrium moisture content of about 10% and milled using a centrifugal mill (Retsch ZM200, Retsch, Ins., Haan, Germany) to 2 mm particle size. A sub-sample of milled olive tree pruning was used for analysis of chemical composition (cellulose, hemicellulose, total lignin, extractives, and ash) and another sub-sample for NIR spectroscopy.

2.2. Wet Chemical Composition Analysis

Chemical composition of the olive tree pruning was determined according to (National Renewable Energy Laboratory (NREL) procedures for biomass composition analysis [28]. Firstly, extractives content was determined by Dionex Accelerated Solvent Extractor System (ASE 200). Extraction was performed in water and ethanol. After extraction, cellulose and hemicellulose content was measured based on monomers content after a two-step acid hydrolysis procedure to fractionate the fiber. A first step with 72% (w/w) sulphuric acid at 30 °C for 60 min was used, followed by a second step in which the reaction mixture was diluted to 4% sulphuric acid and autoclaved at 121 °C for 1 h. Sugars concentration was determined by high-performance liquid chromatography (HPLC) in a Waters 2695 liquid chromatograph with refractive index detector. A CARBOSep CHO-682 LEAD column (Transgenomic, Omaha, NE, USA) operating at 75 °C with Milli-Q water (Millipore Corporation, Billerica, MA, USA) as mobile-phase (0.5 mL/min) was used. Anhydrous correction was applied to the quantification results of monomeric sugars to calculate the polymer of carbohydrates. The factor used to convert sugars monomers to anhydromonomers were 0.90 for glucose to glucan, galactose to galactan, mannose to mannan and 0.88 for xylose to xylan, arabinose to arabinan. Hemicellulose was calculated as the sum of xylan, arabinan, galactan, and mannan concentrations. Total lignin was calculated as the sum of acid soluble and acid insoluble lignin. All measurements were done in triplicate and results are presented as percentage on an oven-dry weight basis. Results from wet chemical analysis were used for calibration and validation of the near infrared method.

2.3. NIR Spectroscopy

A total of 79 samples of whole biomass samples, ground to 2 mm particle size, were analyzed. The biomass samples were dried in oven at 40 °C for 48 h before testing. NIR spectra were measured in spinning Petri dishes, using a Perkin Elmer NIR Spectrometer; model Spectrum One NTS (Perkin Elmer Inc., Beaconsfield, UK), with diffuse reflectance accessory.
The spectra were collected by averaging 70 scans, six spectra were measured, and a mean spectrum of each sample was calculated for the construction of the predictive models. The spectral range selected for analysis was 10,000 to 4000 cm−1 and spectral resolution of 8 cm−1.

2.4. Development of NIR Calibration

The spectral and wet chemical data were processed with Spectrum Quant+ software, version 4.51 (Perkin Elmer Inc., Billerica, MA, USA) for chemometric analysis. This includes reduction of number of variables by principal component analysis (PCA) and multiple regressions. A partial least square (PLS) multivariate calibration model was developed. To improve the correlation between the spectra and concentration data, a number of preprocessing techniques for spectral data have been utilized. To minimize baseline deviations caused by dispersion effect, the smoothing according to Savitzky–Golay algorithm [29] has been applied. The first and second derivatives were applied to remove additive and sloped baseline drifts, and finally, normalization methods like multiplicative signal correction (MSC) and standard normal variate (SNV) remove the multiplicative signal effects produced by differences of particle size in samples. The two pre-processing methods can also be combined, first and second derivative with SNV or MSC, to obtain better results. All of these pretreatments were tested.

2.5. Analysis and Validation of Calibration Models

The application of PLS process allows building a linear regression model based on the relation between the spectral data matrix and analyte concentration matrix. The calibration results were assessed by statistic parameters, which decide how adequately the calibration fits the data and how adequately the calibration will predict external samples. The root mean square error of calibration (RMSEC) parameter was used to evaluate the calibration and it is a statistical term that measures the standard deviation of residuals (differences between observed and predicted values) in the regression equation and measures precision of fit between data and the calibration model.
The model validation in the present study included both full-cross validation (leave-one-out) and independent validation. Cross-validation (leave-one-out method, LOO) was used as a basis to calculate the optimal range of principal components and compare the prediction ability of different calibration models. In full cross-validation procedure, for a dataset on n samples, one sample is left out and the rest of (n–1) samples are calibrated using PLS to generate a subset model. The full cross-validation results were expressed using the term root mean square error of cross-validation (RMSECV), and cross-validation coefficient of determination (R2cv). On the other hand, 15 samples were selected randomly from the entire set, to be used for an external validation of the best calibration models chosen by the cross validation criterion. The result of the external validation is defined by the statistic parameter root mean square error of prediction (RMSEP) and external validation coefficient of determination (R2ext).
A key factor in determining the quality of a model is the optimum number of principal components (PCs) (or PLS factors) to include in the model. Too many PCs results in overfitting and too few PCs result in a low accurate model. There are various criteria to select the appropriate number of PCs; based on the variation of the eigenvalues with the number of PCs [30]; based on minimum value of RMSECV or an optimal RMSECV value that uses the significance F-test, according to Haaland and Thomas criteria [31]. In this work, the latter criterion was chosen.

3. Results and Discussion

3.1. Wet Chemical Composition

The chemical composition of olive pruning biomass is presented in Table 1. Results include mean value of composition, standard deviation (SD), coefficient of variation (CV), and concentration range.
In OTP biomass, cellulose content is in the range of 8.6–19.8% (w/w). Hemicellulose, lignin content, and ash content from OTP samples are in the range of 9.4–16.3%, 15.0–19.9%, and 5.1–10.0% (w/w), respectively. It is worthwhile to mention that this lignocellulosic residue has an extractive content close to 40% (range 32.5–46.7%, w/w). The coefficient of variation (CV) expresses the variation as a percentage of the mean and is often preferred as a measure of data dispersion (SD), since SD increases in proportion to concentration values. It is important to notice the low value of the coefficient of variation for lignin and extractives. The compositional variance is a factor to consider in order to achieve robust models.
The proportion of the extractive fraction was greater than that reported for olive tree pruning; extractive contents ranged from 23.3% (w/w) [32] to 31.4% (w/w) [33]. The variability of composition was attributed mainly to the heterogeneity of the residue (changing proportions of small branches and leaves). The high proportion of extractives could be related to a higher content of leaves in the original samples; high content in extractives in olive leaves (38.8% dry weight) have been reported by other authors [34].
The summative mass closure gives a value of 88.3%; the remaining percentage (11.7%) may be attributed to other minor compounds such as acetyl groups (from hemicellulose fraction), crude protein, and other unanalyzed components, like pectins.

3.2. NIR Calibration

3.2.1. Selection of Wavenumber Regions

The NIR radiation covers a wavelength range between 750 and 2500 nm (13,000 to 4000 cm−1 in wavenumber units). This range includes first, second, third overtones, and a combination of the fundamental bands. As the spectral information is redundant, the wavenumber selection can improve the robustness of multivariate calibration models if the right choices are made. The use of derivative filters was explored as a tool for spectral resolution enhancement. A set of reflectance spectra (expressed in absorbance unities vs. wavenumber) of olive tree pruning samples are shown in Figure bands between 10,000 cm−1 and 7500 cm−1 have been associated with third overtones and their low intensity and excessive noise makes them less suitable to calibration process (He and Hu, 2013). The greatest variability between spectra is observed in the range 7500–4200 cm−1. We can observe this variability in first derivative spectra represented in Figure 1B. There are three interesting zones: 7100 to 6900 cm−1, 6000 to 5600 cm−1 (associated with lignin and extractives first overtones bands), and the region between 5500 and 4000 cm−1. The latter includes the main band of water at approximately 5200 cm−1 and combination bands associated with stretching vibrations of CH, CH2, and CH3 bonds of carbohydrates, although the spectral noise in this range is high. In Figure 1C, we can observe the second derivative. There are two well-resolved bands in the second derivative associated with phenolic compounds at 6900 and 5980 cm−1. However, care should be taken when choosing the wavenumber range, in order to avoid a loss of information. A reduced wavenumber region (7500–5500 cm−1) was also selected to create calibration models and compare the results with those obtained from the full spectral range studies. This range mainly includes the first overtone bands, corresponding to OH stretching vibrations associated with carbohydrates and phenolic groups, and CH stretching vibrations of both aliphatic and aromatic bonds [35]. The reduced spectral range excludes water principal band extending between 5200 and 5000 cm−1, which consists of multiple overlapping bands. The apparent location of these bands changes as the spectra are measured from one to another.

3.2.2. NIR Calibration Development

PLS regression was performed on the near infrared spectra by using spectral preprocessing methods and using different spectra ranges. Results of the best prediction models of chemical components of OTP using full spectra (10,000–4000 cm−1) and selected spectra region (7500–5500 cm1), respectively, are presented in Table 2. The results show how the calibration quality varies with the wavenumber range and spectral mathematical treatments. In all cases, the application of Savitzky–Golay derivation with smoothing step (five points) is essential to reach good correlations. The MSC and SNV were compared as normalization methods (either alone or in combination with first derivative filter). The two preprocessing methods gave similar results.
Regarding cellulose and extractives content, the models based on the restricted wavenumber 7500–5500 cm−1 gave the best results using first derivative with SNV for cellulose and first derivative with SNV as pretreatment for extractives. The coefficient of determination for calibration (R2cal) indicates a good linear fit (0.95 for cellulose and 0.91 for extractives), while lower errors of prediction (RMSECV) were found for the restricted range model: 1.75 for extractives and 0.94 for cellulose. The coefficients of determination (R2cv) also give the best results in restricted-range models (0.80 for cellulose and 0.65 for extractives).
For hemicellulose and lignin content, the models based on the restricted wavenumber 7500–5500 cm−1 gave similar results to those obtained with full spectra range, which indicates that reduction of wavenumber range does not improve the calibration results. For hemicellulose content, the statistics of fit were also equivalent (0.72 and 0.73). The same is true for validation parameters, RMSECV give 0.88 and R2cv 0.72 for reduced range and 0.89 and 0.71 for full spectrum, respectively.
For total lignin, although the R2cal values (0.56) indicate some degree of fit, it is remarkable the relatively low correlation in all models studied and the rapid increase of prediction errors when introduce a greater number of principal components in model. The data pretreatment in the two wavenumber ranges (full and restricted) was the second derivative. Good fits with low number of PCs are achieved, but the prediction quality becomes noticeably worse and RMSECV values are higher than the other calibration models.
Organic nitrogenous compounds present in this agricultural waste biomass, in addition to an insufficient organic nitrogenous compounds extraction, can cause interference with the wet chemical characterization method used [36]. The interference with the acid insoluble lignin values caused by the presence of organic nitrogen compounds has been explained by the Maillard reactions. Indeed, with the wet chemical method utilized, during the second hydrolysis step (121 °C, 1 h), a fraction of the organic nitrogen compounds that was not removed during extraction step, could react with sugars produced during cellulose and hemicellulose, forming insoluble substances that could cause an overestimation of the lignin values.
For ash content, prediction models for OTP developed with the full spectra regions exhibited the best correlation values (R2cal of 0.96). The RMSECV (0.52), clearly indicate a best predictive power compared to reduced spectral range models (0.74).
The predictive power data represented in Table 2 give poor results in some cases. There are various factors that account for these results. First, the variability of the biomass composition data, expressed as standard deviation of the mean or coefficient of variation, was particularly low in the case of hemicellulose and lignin. The calibration and prediction results obtained are similar to those tested by other authors on biomass feedstocks, as yellow poplar [23], Miscanthus [25], or a mixture of biomasses [21]. The relatively poor values of calibration and external validation statistics associated with lignin have been also described for other complex biomass such as Eucalyptus [37].
Figure 2 provides a graphical representation of the prediction ability for the five parameters according to cross validation and external samples analysis.

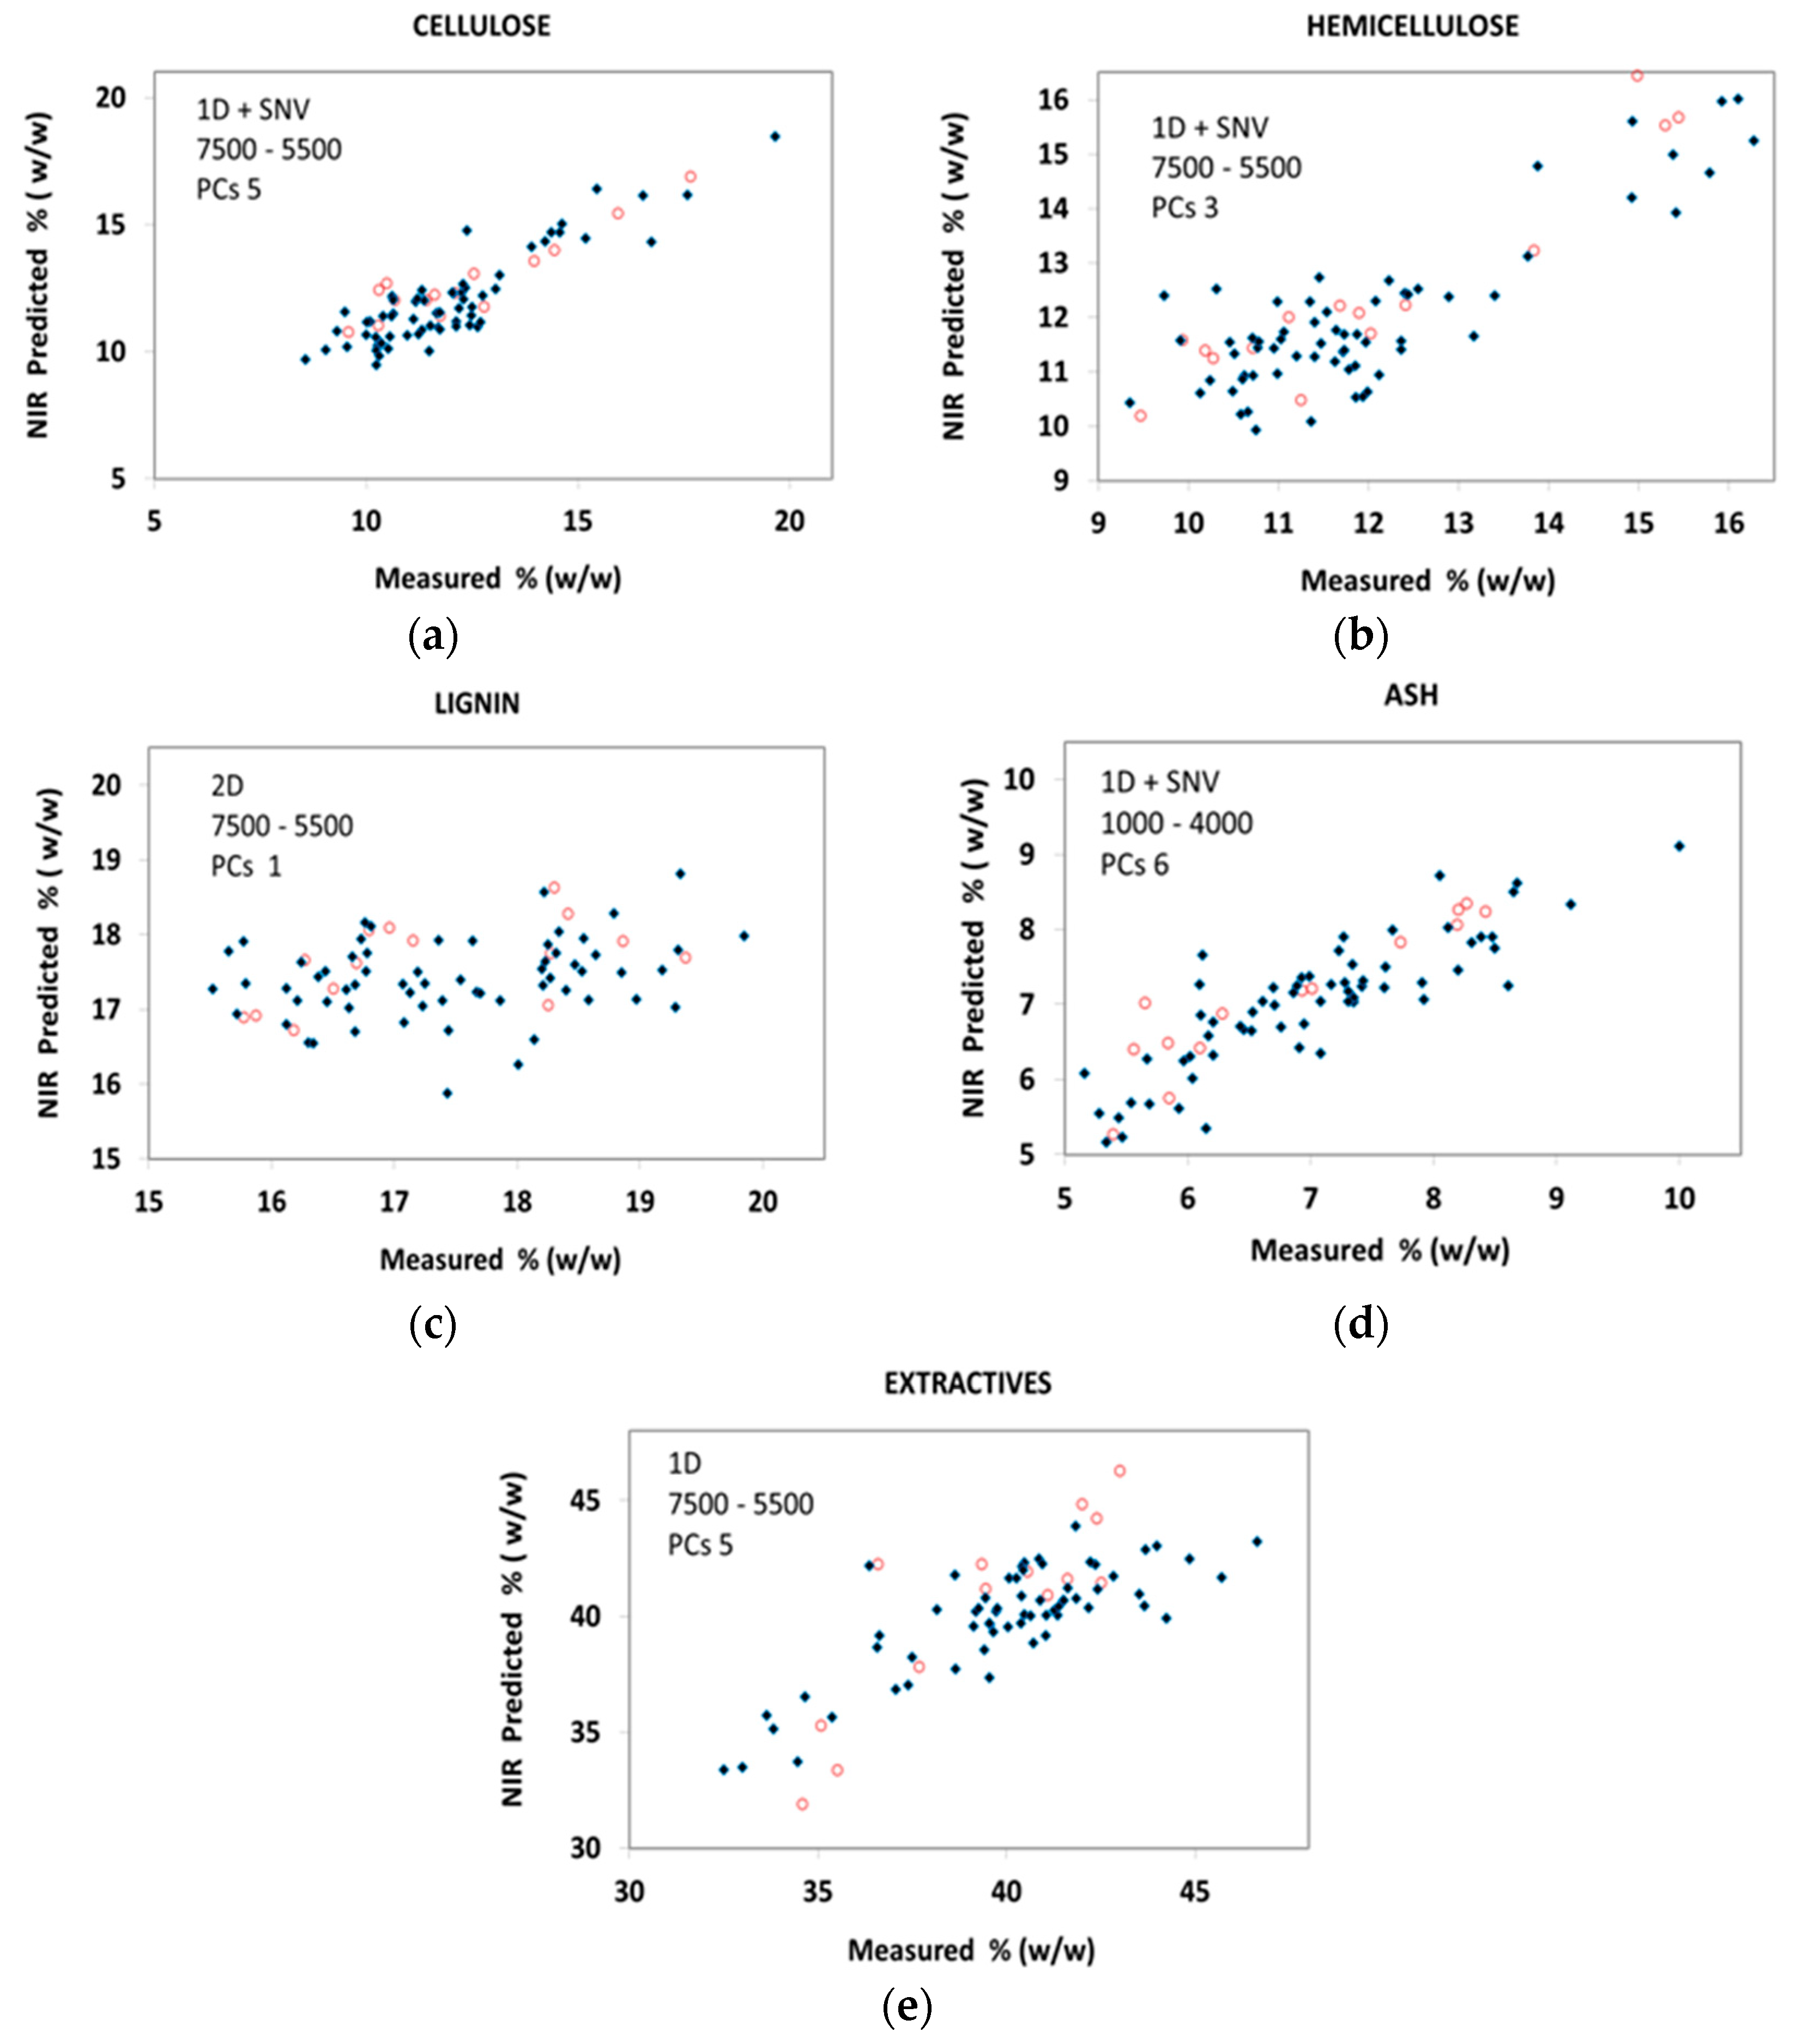
3.2.3. External Validation of Model

The 15 samples not included in calibration model were used for external validation. These samples were chosen so that the mean and standard deviation are very similar to the calibration samples. Figure 2 shows also the prediction results for cellulose, hemicellulose, lignin, ash, and extractives corresponding to 15 samples of OTP according to the best model for each parameter depicted in Table 2. The correlation between predicted composition and measured composition is based on the optimal calibration applied over every analyte (Table 2). The predictive ability of the model to these external samples is defined in this work by the root mean square error of prediction (RMSEP), which is a measure of the variability of the difference between the predicted and reference values for a set of validation samples. The RMSEP values are shown in Table 2, and the RMSEP values found for the five parameters for whole range wavenumber method are: 1.75 for cellulose, 0.95 for hemicellulose, 2.25 for extractives, 1.38 for lignin, and 0.51 for ash. This RMSEP values are comparable to cross-validation values, although in the case of cellulose, the RMSEP value is about 60 percent larger than the RMSECV one. For the models constructed using reduced spectral range, RMSEP give the following values: Extractives 2.33, cellulose 1.06, hemicellulose 0.84, lignin 1.00, and ash 0.80. Nevertheless, coefficient of determination (R2ext) for external validation shows higher values than cross-validation coefficients.
As a summary of the discussion above, it can be stated that the analyses of statistical data collected give an idea of the predictive capacity of the models. The RMSEC values indicate a good fit, but RMSECV values denote only discrete ability of prediction. Some other criteria are also available for this purpose. There are references about 0.5 as a threshold value of R2cv in LOO cross validation; values over 0.5 are indicative of good prediction capacity [38], although it is true that LOO procedure utility as goodness of prediction has been questioned [39]. But, in any case, the calibration models of this work have values over 0.5 except for lignin. It is not easy to explain this poor behavior for lignin. On the one hand, it must be pointed out that the high content in extractives of this biomass may be interfering with spectral data analysis associated with lignin, only partly resolved applying the second derivative. On the other hand, it is important to consider that the total lignin content value comprises both the insoluble and the acid soluble lignin, and the later measurement method may imply errors associated with the use of an absorptivity coefficient not specifically determined for OTP. Moreover, the acid insoluble lignin could be overestimated by using the wet chemical analysis due to condensation reaction of relatively high concentration of protein found in OTP samples (around 8%, w/w) [40].
For ash content measurement, previous studies have shown that is possible to determine inorganic compounds using NIR spectroscopy [41]. Simple inorganic constituents will not absorb directly in NIR region, and the ash content was indirectly determined through correlation with NIR absorbing organic compounds. The influence of inorganic elements on organic compounds NIR bands is expected to occur over full spectrum and not only in the NIR range of 7500–5500 cm−1. The monatomic ions can be coordinated with C–H, N–H, and O–H bonds, which produce absorption bands across the whole NIR spectrum.
Finally, the comparison between coefficients of determination calculated for the two methods of validation (internal and external), reflects a best fit of the external sample set, but taking into account the relatively low number of samples available, the use of cross validation as a reference evaluation of calibration models is justified.

4. Conclusions

Results show that near infrared spectroscopy combined with multivariate calibration can be useful as a predictive technique for olive tree pruning biomass analysis, despite its specific compositional features characterized by its high content and variability of the extractives fraction. The predictability of the models in this study is, in principle, limited for the low number of available samples and low compositional variability of calibration set. In spite of this, the biomass components analyzed and predicted with the best model exhibit R2cal values of 0.9 or near of 0.9, and acceptable values of prediction errors. The exception was total lignin, which exhibit a poor linear fit (R2cal < 0.6) and greater prediction errors. Thus, further work is needed in order to improve its potential as a prediction tool and this implies that to increase the number and compositional variability of the sample set, both calibration and external validation are needed.

Author Contributions

Conceptualization, M.J.N. and E.C.; methodology, M.J.N., J.L.F.; validation, J.L.F.; formal analysis, F.S.; investigation, M.J.N., M.B., F.S., J.L.F.; writing—original draft preparation, M.J.N., P.M.; writing—review and editing, P.M., M.J.N.

Funding

This research was partially funded by Ministerio de Economía y Competitividad (MINECO) (Spain) Reference ENE2011-29112-C02-01 and ENE2011-29112-C02-02 including FEDER funds and EN2017-85819-C2-2-R (AEI/UE).

Acknowledgments

Authors would like to thank to MINECO (Spain) Reference ENE2011-29112 including FEDER funds.

Conflicts of Interest

The authors declare no conflict of interest.

References

  1. Faostat. Available online: http://www.fao.org/faostat/en/#home (accessed on 19 February 2019).
  2. Spinelli, R.; Picchi, G. Industrial harvesting of olive tree pruning residue for energy biomass. Bioresour. Technol. 2010, 101, 730–735. [Google Scholar] [CrossRef] [PubMed]
  3. Pari, L.; Suardi, A.; Frąckowak, P.; Adamczyk, F.; Szaroleta, M.; Santangelo, E.; Bergonzoli, S.; Del Giudice, A.; Dyjakon, A. Two innovative prototypes for collecting pruning biomass: Early performance tests and assessment of the work quality. Biomass Bioenergy 2018, 117, 96–101. [Google Scholar] [CrossRef]
  4. Romero-García, J.M.; Niño, L.; Martínez-Patiño, C.; Álvarez, C.; Castro, E.; Negro, M.J. Biorefinery based on olive biomass. State of the art and future trends. Bioresour. Technol. 2014, 159, 421–432. [Google Scholar] [CrossRef] [PubMed]
  5. Negro, M.J.; Manzanares, P.; Ruiz, E.; Castro, E.; Ballesteros, M. The biorefinery concept for the industrial valorization of residues from olive oil industry. In Olive Mill Waste; Galanakis, C.M., Ed.; Academic Press: London, UK, 2017; pp. 57–78. [Google Scholar]
  6. Manzanares, P.; Negro, M.J.; Oliva, J.M.; Saéz, F.; Ballesteros, I.; Ballesteros, M.; Cara, C.; Castro, E.; Ruiz, E. Different process configurations for bioethanol production from pretreated olive pruning biomass. J. Chem. Technol. Biotechnol. 2011, 86, 881–887. [Google Scholar] [CrossRef]
  7. Negro, M.J.; Alvarez, C.; Ballesteros, I.; Romero, I.; Ballesteros, M.; Castro, E.; Manzanares, P.; Moya, M.; Oliva, J.M. Ethanol production from glucose and xylose obtained from steam exploded water-extracted olive tree pruning using phosphoric acid as catalyst. Bioresour. Technol. 2014, 153, 101–107. [Google Scholar] [CrossRef] [PubMed]
  8. Toledano, A.; Alegría, I.; Labidi, J. Biorefining of olive tree (Olea europea) pruning. Biomass Bioenergy 2013, 59, 503–511. [Google Scholar] [CrossRef]
  9. Solarte-Toro, J.C.; Romero-Garcia, J.M.; Lopez-Linares, J.C.; Ramos, E.R.; Castro, E.; Alzate, C.A.C. Simulation approach through the biorefinery concept of the antioxidants, lignin and ethanol production using olive leaves as raw material. Chem. Eng. Trans. 2018, 24, 1395–1406. [Google Scholar]
  10. Castro, E.; Conde, E.; Moure, A.; Falqué, E.; Cara, C.; Ruiz, E.; Domínguez, H. Antioxidant activity of liquors from steam explosion of Olea europea wood. Wood Sci. Technol. 2008, 42, 579–592. [Google Scholar] [CrossRef]
  11. Martínez-Patiño, J.C.; Gullón, B.; Romero, I.; Ruiz, E.; Brnčić, M.; Žlabur, J.Š.; Castro, E. Optimization of ultrasound-assisted extraction of biomass from olive trees using response surface methodology. Ultrason. Sonochem. 2019, 51, 487–495. [Google Scholar] [CrossRef]
  12. Cara, C.; Ruiz, E.; Carvalheiro, F.; Moura, P.; Ballesteros, I.; Castro, E.; Gírio, F. Production, purification and characterisation of oligosaccharides from olive tree pruning autohydrolysis. Ind. Crops Prod. 2012, 40, 225–231. [Google Scholar] [CrossRef] [Green Version]
  13. Toledano, A.; Serrano, L.; Labidi, J. Process for olive tree pruning lignin revalorisation. Chem. Eng. J. 2012, 193–194, 396–403. [Google Scholar] [CrossRef]
  14. Krongtaew, C.; Messner, K.; Ters, T.; Fackler, K. Characterization of key parameters for biotechnological lignocellulose conversion assessed by FT-NIR spectroscopy. Part I: qualitative analysis of pretreated straw. BioResources 2010, 5, 2063–2080. [Google Scholar]
  15. Gredilla, A.; Fdez-Ortiz de Vallejuelo, S.; Elejoste, N.; de Diego, A.; Madariaga, J.M. Non-destructive Spectroscopy combined with chemometrics as a tool for green chemical analysis of environmental samples: A review. Trends Anal. Chem. 2016, 76, 30–39. [Google Scholar] [CrossRef]
  16. Skvaril, J.; Kyprianidis, K.G.; Dahlquist, E. Applications of near-infrared spectroscopy (NIRS) in biomass energy conversion processes: a review. Appl. Spectrosc. Rev. 2017, 52, 675–728. [Google Scholar] [CrossRef]
  17. Xu, F.; Yu, J.; Tesso, T.; Dowell, F.; Wang, D. Qualitative and quantitative analysis of lignocellulosic biomass using infrared techniques: A mini-review. Appl. Energy 2013, 104, 801–809. [Google Scholar] [CrossRef] [Green Version]
  18. Lupoi, J.S.; Singh, S.; Simmons, B.A.; Henry, R.J. Assessment of lignocellulosic biomass using analytical spectroscopy: an evolution to high-throughput techniques. BioEnergy Res. 2014, 7, 1–23. [Google Scholar] [CrossRef]
  19. Sanderson, M.A.; Agblevor, F.; Collins, M.; Johnson, D.K. Compositional analysis of biomass feedstocks by near infrared reflectance spectroscopy. Biomass Bioenergy 1996, 11, 365–370. [Google Scholar] [CrossRef]
  20. Payne, C.E.; Wolfrum, E.J. Rapid analysis of composition and reactivity in cellulosic biomass feedstocks with near-infrared spectroscopy. Biotechnol. Biofuels 2015, 8, 43. [Google Scholar] [CrossRef] [PubMed]
  21. Liu, L.; Ye, X.P.; Womac, A.R.; Sokhansanj, S. Variability of biomass chemical composition and rapid analysis using FT-NIR techniques. Carbohydr. Polym 2010, 81, 820–829. [Google Scholar] [CrossRef]
  22. Alves, A.; Santos, A.; Rozenberg, P.; Pâques, L.E.; Charpentier, J.-P.; Schwanninger, M.; Rodrigues, J. A common near infrared–based partial least squares regression model for the prediction of wood density of Pinus pinaster and Larix eurolepis. Wood Sci. Technol. 2012, 46, 157–175. [Google Scholar] [CrossRef]
  23. Nkansah, K.; Dawson-Andoh, B.; Slahor, J. Rapid characterization of biomass using near infrared spectroscopy coupled with multivariate data analysis: Part 1 yellow-poplar (Liriodendron tulipifera L.). Bioresour. Technol. 2010, 101, 4570–4576. [Google Scholar] [CrossRef] [PubMed]
  24. Sandak, J.; Sandak, A. Fourier transform near infrared assessment of biomass composition of shrub willow clones (salix sp.) for optimal bio-conversion processing. J. Near Infrared Spec. 2011, 19, 309–318. [Google Scholar] [CrossRef]
  25. Hayes, D.J.M. Development of near infrared spectroscopy models for the quantitative prediction of the lignocellulosic components of wet Miscanthus samples. Bioresour. Technol. 2012, 119, 393–405. [Google Scholar] [CrossRef] [PubMed]
  26. Yang, Z.; Li, K.; Zhang, M.; Xin, D.; Zhang, J. Rapid determination of chemical composition and classification of bamboo fractions using visible–near infrared spectroscopy coupled with multivariate data analysis. Biotechnol. Biofuels 2016, 9, 35. [Google Scholar] [CrossRef] [PubMed]
  27. Mata Sánchez, J.; Pérez Jiménez, J.A.; Díaz Villanueva, M.J.; Serrano, A.; Núñez, N.; López Giménez, J. Assessment of near infrared spectroscopy for energetic characterization of olive byproducts. Renew. Energy 2015, 74, 599–605. [Google Scholar] [CrossRef]
  28. Sluiter, J.B.; Ruiz, R.O.; Scarlata, C.J.; Sluiter, A.D.; Templeton, D.W. Compositional analysis of lignocellulosic feedstocks. 1. review and description of methods. J. Agric. Food Chem. 2010, 58, 9043–9053. [Google Scholar] [CrossRef] [PubMed]
  29. Savitzky, A.; Golay, M.J.E. Smoothing and differentiation of data by simplified least squares procedures. Anal. Chem. 1964, 36, 1627–1639. [Google Scholar] [CrossRef]
  30. Kaiser, H.F. The application of electronic computers to factor analysis. Educ. Psychol. Meas. 1960, 20, 141–151. [Google Scholar] [CrossRef]
  31. Haaland, D.M.; Thomas, E.V. Partial least-squares methods for spectral analyses. 2. Application to simulated and glass spectral data. Anal. Chem. 1988, 60, 1202–1208. [Google Scholar] [CrossRef]
  32. Ballesteros, I.; Ballesteros, M.; Cara, C.; Sáez, F.; Castro, E.; Manzanares, P.; Negro, M.J.; Oliva, J.M. Effect of water extraction on sugars recovery from steam exploded olive tree pruning. Bioresour. Technol. 2011, 102, 6611–6616. [Google Scholar] [CrossRef] [PubMed]
  33. Cara, C.; Ruiz, E.; Oliva, J.M.; Sáez, F.; Castro, E. Conversion of olive tree biomass into fermentable sugars by dilute acid pretreatment and enzymatic saccharification. Bioresour. Technol. 2008, 99, 1869–1876. [Google Scholar] [CrossRef] [PubMed]
  34. Romero-García, J.M.; Lama-Muñoz, A.; Rodríguez-Gutiérrez, G.; Moya, M.; Ruiz, E.; Fernández-Bolaños, J.; Castro, E. Obtaining sugars and natural antioxidants from olive leaves by steam-explosion. Food Chem. 2016, 210, 457–465. [Google Scholar] [CrossRef] [PubMed]
  35. Schwanninger, M.; Rodrigues, J.C.; Fackler, K. A review of band assignments in near infrared spectra of wood and wood components. J. Near Infrared Spec. 2011, 19, 287–308. [Google Scholar] [CrossRef]
  36. Adjalle, K.; Larose, L.V.; Bley, J.; Barnabé, S. The effect of organic nitrogenous compound content and different pretreatments on agricultural lignocellulosic biomass characterization methods. Cellulose 2017, 24, 1395–1406. [Google Scholar] [CrossRef]
  37. Poke, F.S.; Wright, J.K.; Raymond, C.A. Predicting extractives and lignin contents in Eucalyptus globulus using Near Infrared Reflectance Analysis. J. Wood Chem. Technol. 2005, 24, 55–67. [Google Scholar] [CrossRef]
  38. Roy, K.; Kar, S.; Das, R.N. A Primer on QSAR/QSPR Modelling; Roy, K., Das, R.N., Eds.; Springer International Publishing: New York, NY, USA, 2015; pp. 37–39. [Google Scholar]
  39. Veerasamy, R.; Rajak, H.; Jain, A.; Sivadasan, S.; Varghese, C.; Agrawal, R. Validation of QSAR models—Strategies and importance. Int. J. Drug Design Discovery 2011, 2, 511–519. [Google Scholar]
  40. Kelly, S.S.; Rowell, R.M.; Davis, M.; Jurich, C.K.; Ibach, R. Rapid analysis of the chemical composition of agricultural fibers using near infrared spectroscopy and pyrolysis molecular beam mass spectroscopy. Biomass Bioenergy 2004, 27, 77–88. [Google Scholar] [CrossRef]
  41. Chen, J.Y.; Matsunaga, R.; Ishikawa, K.; Zhang, H. Main inorganic component measurement of seawater using near-infrared spectroscopy. Appl. Spectrosc. 2003, 57, 1399–1406. [Google Scholar] [CrossRef]
Figure 1. Near infrared spectra of olive tree pruning samples: (A) Raw spectra, (B) first derivative spectra; and (C) second derivative spectra.
Energies 12 02497 g001
Figure 2. Near infrared (NIR)-predicted vs. measured plot of cellulose (a), hemicellulose (b), lignin (c), ash (d) and extractives (e) content in olive tree pruning: () cross validation and () external validation.
Energies 12 02497 g002
Table 1. Summary of chemical composition of calibration set. All data (% w/w) are on a moisture-free basis.
ComponentsExtractivesCelluloseHemicelluloseLigninAsh
Mean40.012.012.017.47.0
SD3.02.11.71.11.1
CV7.517.513.96.415.2
Range32.5–46.78.6–19.89.4–16.315.0–19.95.1–10.0
Table 2. Results of PLS1 calibration and prediction models developed for chemical composition of olive pruning biomass (% w/w).
Components Wavenumber (cm−1)Data PreprocessingPCsR2calRMSECR2cvRMSECVR2extRMSEP
Extractives7500—55001st derivative50.910.930.651.750.792.33
10,000—40001st der + SNV40.821.300.452.050.692.25
Cellulose7500—55001st der + SNV50.950.510.800.940.841.06
10,000—40001st derivative30.830.890.731.080.701.75
Hemicellulose7500—55001st der + SNV30.820.720.720.880.870.84
10,000—40001st derivative30.820.730.710.890.830.95
Lignin7500—55002nd derivative10.560.750.051.080.291.00
10,000—40002nd derivative10.560.750.011.110.041.38
Ash7500—55001st derivative50.850.420.520.740.850.80
10,000—40001st der + SNV60.960.210.760.520.850.51

