Article

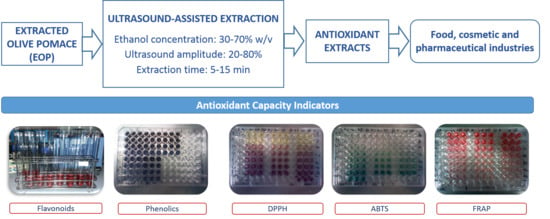
Ultrasound-Assisted Extraction as a First Step in a Biorefinery Strategy for Valorisation of Extracted Olive Pomace

by
José Carlos Martínez-Patiño
1,
Irene Gómez-Cruz
1,
Inmaculada Romero
1,*,
Beatriz Gullón
2,
Encarnación Ruiz
1,
Mladen Brnčić
3 and
Eulogio Castro
1
1
Department of Chemical, Environmental and Materials Engineering, Universidad de Jaén, Campus Las Lagunillas, 23071 Jaén, Spain
2
Department of Chemical Engineering, Institute of Technology, Universidade de Santiago de Compostela, 15782 Santiago de Compostela, Spain
3
Department of Process Engineering, Faculty of Food Technology and Biotechnology, University of Zagreb, Pierottijeva 6, HR-10000 Zagreb, Croatia
*
Author to whom correspondence should be addressed.
Energies 2019, 12(14), 2679; https://doi.org/10.3390/en12142679
Submission received: 29 May 2019 / Revised: 4 July 2019 / Accepted: 10 July 2019 / Published: 12 July 2019
(This article belongs to the Special Issue Biorefinery Based on Olive Biomass)

Abstract

:
Currently, interest in finding new feedstock as sources of natural food antioxidants is growing. The extracted olive pomace (EOP), which is an agro-industrial residue from the olive pomace extracting industries, is generated yearly in big amounts, mainly in the Mediterranean countries. EOP was subjected to an ultrasound assisted extraction with ethanol-water mixtures. The effect of main parameters, such as ethanol concentration (30–70% v/v), ultrasound amplitude (20–80%), and extraction time (5–15 min), on the extraction of antioxidant compounds was evaluated according to a Box–Behnken experimental design. The antioxidant capacity of the resulting extracts was determined by measuring their content in total phenolic compounds (TPC) and flavonoids (TFC), as well as their antioxidant activity by DPPH, ferric reducing antioxidant power (FRAP), and ABTS assays. Considering the simultaneous maximization of these five responses, the optimal conditions were found to be 43.2% ethanol concentration, 70% amplitude, and 15 min. The ultrasound assisted extraction of EOP under these optimized conditions yielded an extract with a phenolic and flavonoid content (per gram of EOP) of 57.5 mg gallic acid equivalent (GAE) and 126.9 mg rutin equivalent (RE), respectively. Likewise, the values for DPPH, ABTS, and FRAP assay (per gram of EOP) of 56.7, 139.1, and 64.9 mg Trolox equivalent, respectively were determined in the optimized extract.

Graphical Abstract

1. Introduction

In recent years, the demand for natural antioxidants as alternatives to synthetic antioxidants has increased. Phenolic compounds, such as flavonoids, phenolic acids, phenolic alcohols, stilbenes, lignans, and tannins, exhibit antioxidant activities and other types of bioactivity (anti-inflammatory, anticarcinogenic, antiviral, hepatoprotective, and neuroprotective activities, among others) [1,2]. These properties make these compounds useful in the food and pharmaceutical industries as food preservatives and biocompounds for human health [3]. The residual biomass from agro-industrial processes could be a cheap and abundant source of high-added value compounds. The valorisation of these by-products within the context of biorefineries that produce biofuels, power, and chemicals within a single installation might help in diversifying the economies of rural areas and developing an industrial complex [4].
Olive oil consumption has become a worldwide phenomenon due to its healthy properties. Olive oil production has important social and economic effects in Mediterranean countries. Spain leads the list of olive oil-producing countries and generated more than six million tons of olives in 2017 [5]. Several by-products and residues are generated during the olive oil production process and they require appropriate disposal. Olive pomace is the major by-product in olive oil mills and it represents nearly 70–80% of the weight of olives [6,7]. Currently, most of this agro-industrial by-product is dried and extracted with an organic solvent, such as hexane, to recover the residual oil that remains in the olive pomace, which represents 1–3% of its total weight [6]. The final solid waste that was produced by olive pomace-extracting industries is called extracted olive pomace (EOP). This biomass represents around 20% of the pomace dry weight, and thus more than one million tons of this waste is produced yearly in Spain. The olive skins, pulp, seeds, and different proportions of pieces of stone form this exhausted solid with a moisture level of approximately 10% [8]. Currently, the stone content in EOP is diminishing, because stone fragments are generally recovered from pomace for use as fuel, mainly in domestic heating systems. With respect to the current use of EOP, the main part of this residue is burnt as a biofuel in small factories or in electric plants. However, different environmental problems that occur during EOP combustion, such as particle emission and hazardous gas generation, hinder this valorisation option [7]. Several phenolic compounds with antioxidant activities have been detected in residual biomass from the olive oil production process, which include hydroxytyrosol, tyrosol, oleuropein, ligustroside, apigenin, luteolin, rutin, vanillic acid, and caffeic acid [9,10]. Therefore, this residue is an interesting source of high-value bioactive compounds. Additionally, the removal of part of the non-structural fraction could improve the further energetic use of the biomass [7].
New extraction technologies have been used to overcome some of the disadvantages of the classical extraction techniques, such as maceration or the use of a Soxhlet extractor. Among these techniques, ultrasound-assisted extraction (UAE) reduces the extraction time and the solvent and energy consumption [11]. Additionally, this method achieves higher extraction yields and it is easy to scale up. UAE induces the formation of bubbles (which growth and collapse) in the irradiated liquid causing cavitation [12]. These phenomena cause mechanic, thermal, and chemical effects inside the samples. Thus, a higher extraction rate is achieved due to the structural changes in the solid sample that enhance mass transport. Moreover, the increase in temperature improves the diffusion and the solubility of the polyphenols [13]. Bath and probe ultrasound devices are the principal types of ultrasound equipment. In an ultrasonic probe system, the energy is applied directly to the sample, the energy losses are therefore minimised, and the extraction yields are increased [14]. Ultrasonic power, frequency, amplitude, extraction time, temperature, liquid-solid ratio, solvent composition, and the matrix properties are the main parameters in the UAE process [15]. The use of a mathematical tool, such as response surface methodology (RSM), can be useful in optimising and studying the effects of different operational parameters of UAE on the responses. RSM has been previously applied to study the UAE of antioxidants from different agro-industrial biomasses [11,13].
In the present work, EOP was subjected to UAE as a first step in a global strategy to valorise olive-derived biomass to produce energy and chemicals via the biorefinery approach. The aim of this work was evaluate the influence of three operational parameters (i.e., water/ethanol ratio, ultrasound amplitude, and extraction time) and to determine their optimal values while using RSM to maximise the flavonoid and phenolic compound contents and the antioxidant activities of the EOP extracts, which were determined by various tests (DPPH, ABTS, and ferric reducing antioxidant power (FRAP)). Additional experiments under the conditions that were optimized by simultaneously considering the five analysed responses were performed to evaluate the adequacy of the model equations. To our best knowledge, this is the first time that real industrial exhausted olive pomace is ultrasound-assisted extracted.

2. Materials and Methods

2.1. Raw Material

EOP was collected during the olive oil season from the olive pomace extracting industry functionary “Oleocastellar S.A.”, which is located in the province of Jaén. The EOP was homogeneized and air-dried until moisture equilibrium was achieved. Afterwards, the EOP was milled with a 1 mm sieve and then stored in a dry place until use.

2.2. Ultrasound-Assisted Extraction (UAE) and Experimental Design

The extraction of the EOP was studied according to the Box–Behnken design, a type of response surface methodology with three levels of each factor, which allows for reducing the number of experiments that are needed to provide enough information for statistically acceptable results. In the Box–Behnken design, each variable or factor adopts three levels and the experiments are distributed at the midpoints of the edges and at the centre of the cube that was formed by the factor levels. It constitutes a typical experimental design when fitting the quadratic models.
The extraction of EOP was carried out in an ultrasound probe device (UP400S, Hielscher, Germany) with a 22 mm diameter sonotrode. The maximum power was 400 W and the ultrasonic frequency was 24 kHz. The ethanol concentration (20, 50, 80%), ultrasound amplitude (30, 50, 70%), and extraction time (5, 10, 15 min) were the three variables studied (Table 1). Table 1 presents the natural and coded values of these factors. The biomass was milled and sieved while using a cutting mill (Ultra Centrifugal Mill Retsch ZM 200, Haan, Germany) to 1 mm particle size, and the liquid-solid ratio was 20 mL/g (i.e., 15 g of EOP and 300 mL of solvent inside a 400 mL beaker). The sonotrode was submerged by 1.5 cm in the samples. The samples were not cooled and therefore the temperatures of the samples increased during the extraction. Once the extraction was completed, the samples were vacuum filtered and the extracts were stored at −18 °C.
The influence of each variable was determined according to a second-order polynomial equation, which relates the independent variables (xi and xj) in the coded values with the response (yi) through the regression coefficients (β0, βi, βij, and βii), as shown in Equation (1).
yj = β0 + ∑ βi ·xi + ∑ βii · xi2 + ∑∑ βij ·xi · xj
The experimental data were analysed with commercial software (Design Expert 7.0.0, Stat-Ease Inc., Minneapolis, MN, USA). The model predicted the optimal UAE conditions that were determined and experimentally tested in triplicate to evaluate its adequacy.

2.3. Antioxidant Capacity Indicators for EOP

The total phenolic compounds were measured by spectrophotometry, following the Folin–Ciocalteu method [16], with some modifications. Briefly, 0.5 mL of diluted extract was added to 3.875 mL of water and 0.125 mL of Folin–Ciocalteu reagent. Subsequently, 0.5 mL of a solution of Na2CO3 (10% w/v) was added and the mixture was homogenised. After 1 h, the absorbance was measured at 765 nm [17]. Gallic acid was used as a reference standard compound and the results are expressed as mg of gallic acid equivalent (GAE)/g EOP.
The flavonoid content was measured according to a colorimetric method that Kim et al., describe [18]. In short, 1 mL of diluted extract was added to 0.3 mL of a solution of NaNO2 (5% w/v), followed by 0.3 mL of 10% AlCl3 solution after 5 min, and the resultant solution was homogenised. Six minutes later, 2 mL of NaOH solution 1 M was added, and the resultant solution was mixed. After 5 min, the absorbance was measured at 510 nm. Rutin was used as the reference standard, and the results are expressed as mg of rutin equivalents (RE)/g EOP. All of the measurements were performed in triplicate and the mean values are reported.
Three different assays widely known, DPPH, ABTS, and FRAP, were performed to know the antioxidant activity of the EOP extracts. In the DPPH radical scavenging assay, 2 mL of 6 × 10⁻⁵ M methanolic solution of DPPH (2,2-diphenyl-1-picrylhydrazyl) was added to a 200 µL of sample. The reduction of absorbance was measured at 517 nm after 15 min.
The TEAC (Trolox equivalent antioxidant capacity) method is based on the scavenging of ABTS radical (2,2’-azino-di(3-ethyl-benzothiazoline-6-sulfonic acid)). ABTS radical cation (ABTS·+) was originated by reacting 7 mM ABTS stock solution with 2.45 mM potassium persulfate, which allowed the mixture to stand at room temperature and protected it from the light for 12–16 h before use. Afterwards, ABTS·+ solution was diluted with phosphate buffer (PBS, pH7.4) to an absorbance of 0.7 at 734 nm. The decrease in absorbance was read at 6 min after the addition of 2.0 mL of diluted ABTS·+ solution to 20 µL of samples.
The FRAP (ferric reducing antioxidant power) reagent was prepared with 200 mmol/L acetate buffer (pH 3.6), 10 mmol/L of 2,4,6-tripyridyl-s-triazine (TPTZ) solution in 40 mmol/L HCl, and 20 mmol/L FeCl3·6H2O in distilled water in the proportion of 10:1:1, respectively. The samples (100 µL) were mixed with the FRAP reagent (3 mL) and the absorbance was measured at 593 nm after 6 min. Trolox was used as the standard and the antioxidant activities are expressed as mg of trolox equivalent (TE)/g EOP. All of the samples were analysed in triplicate.

3. Results and Discussion

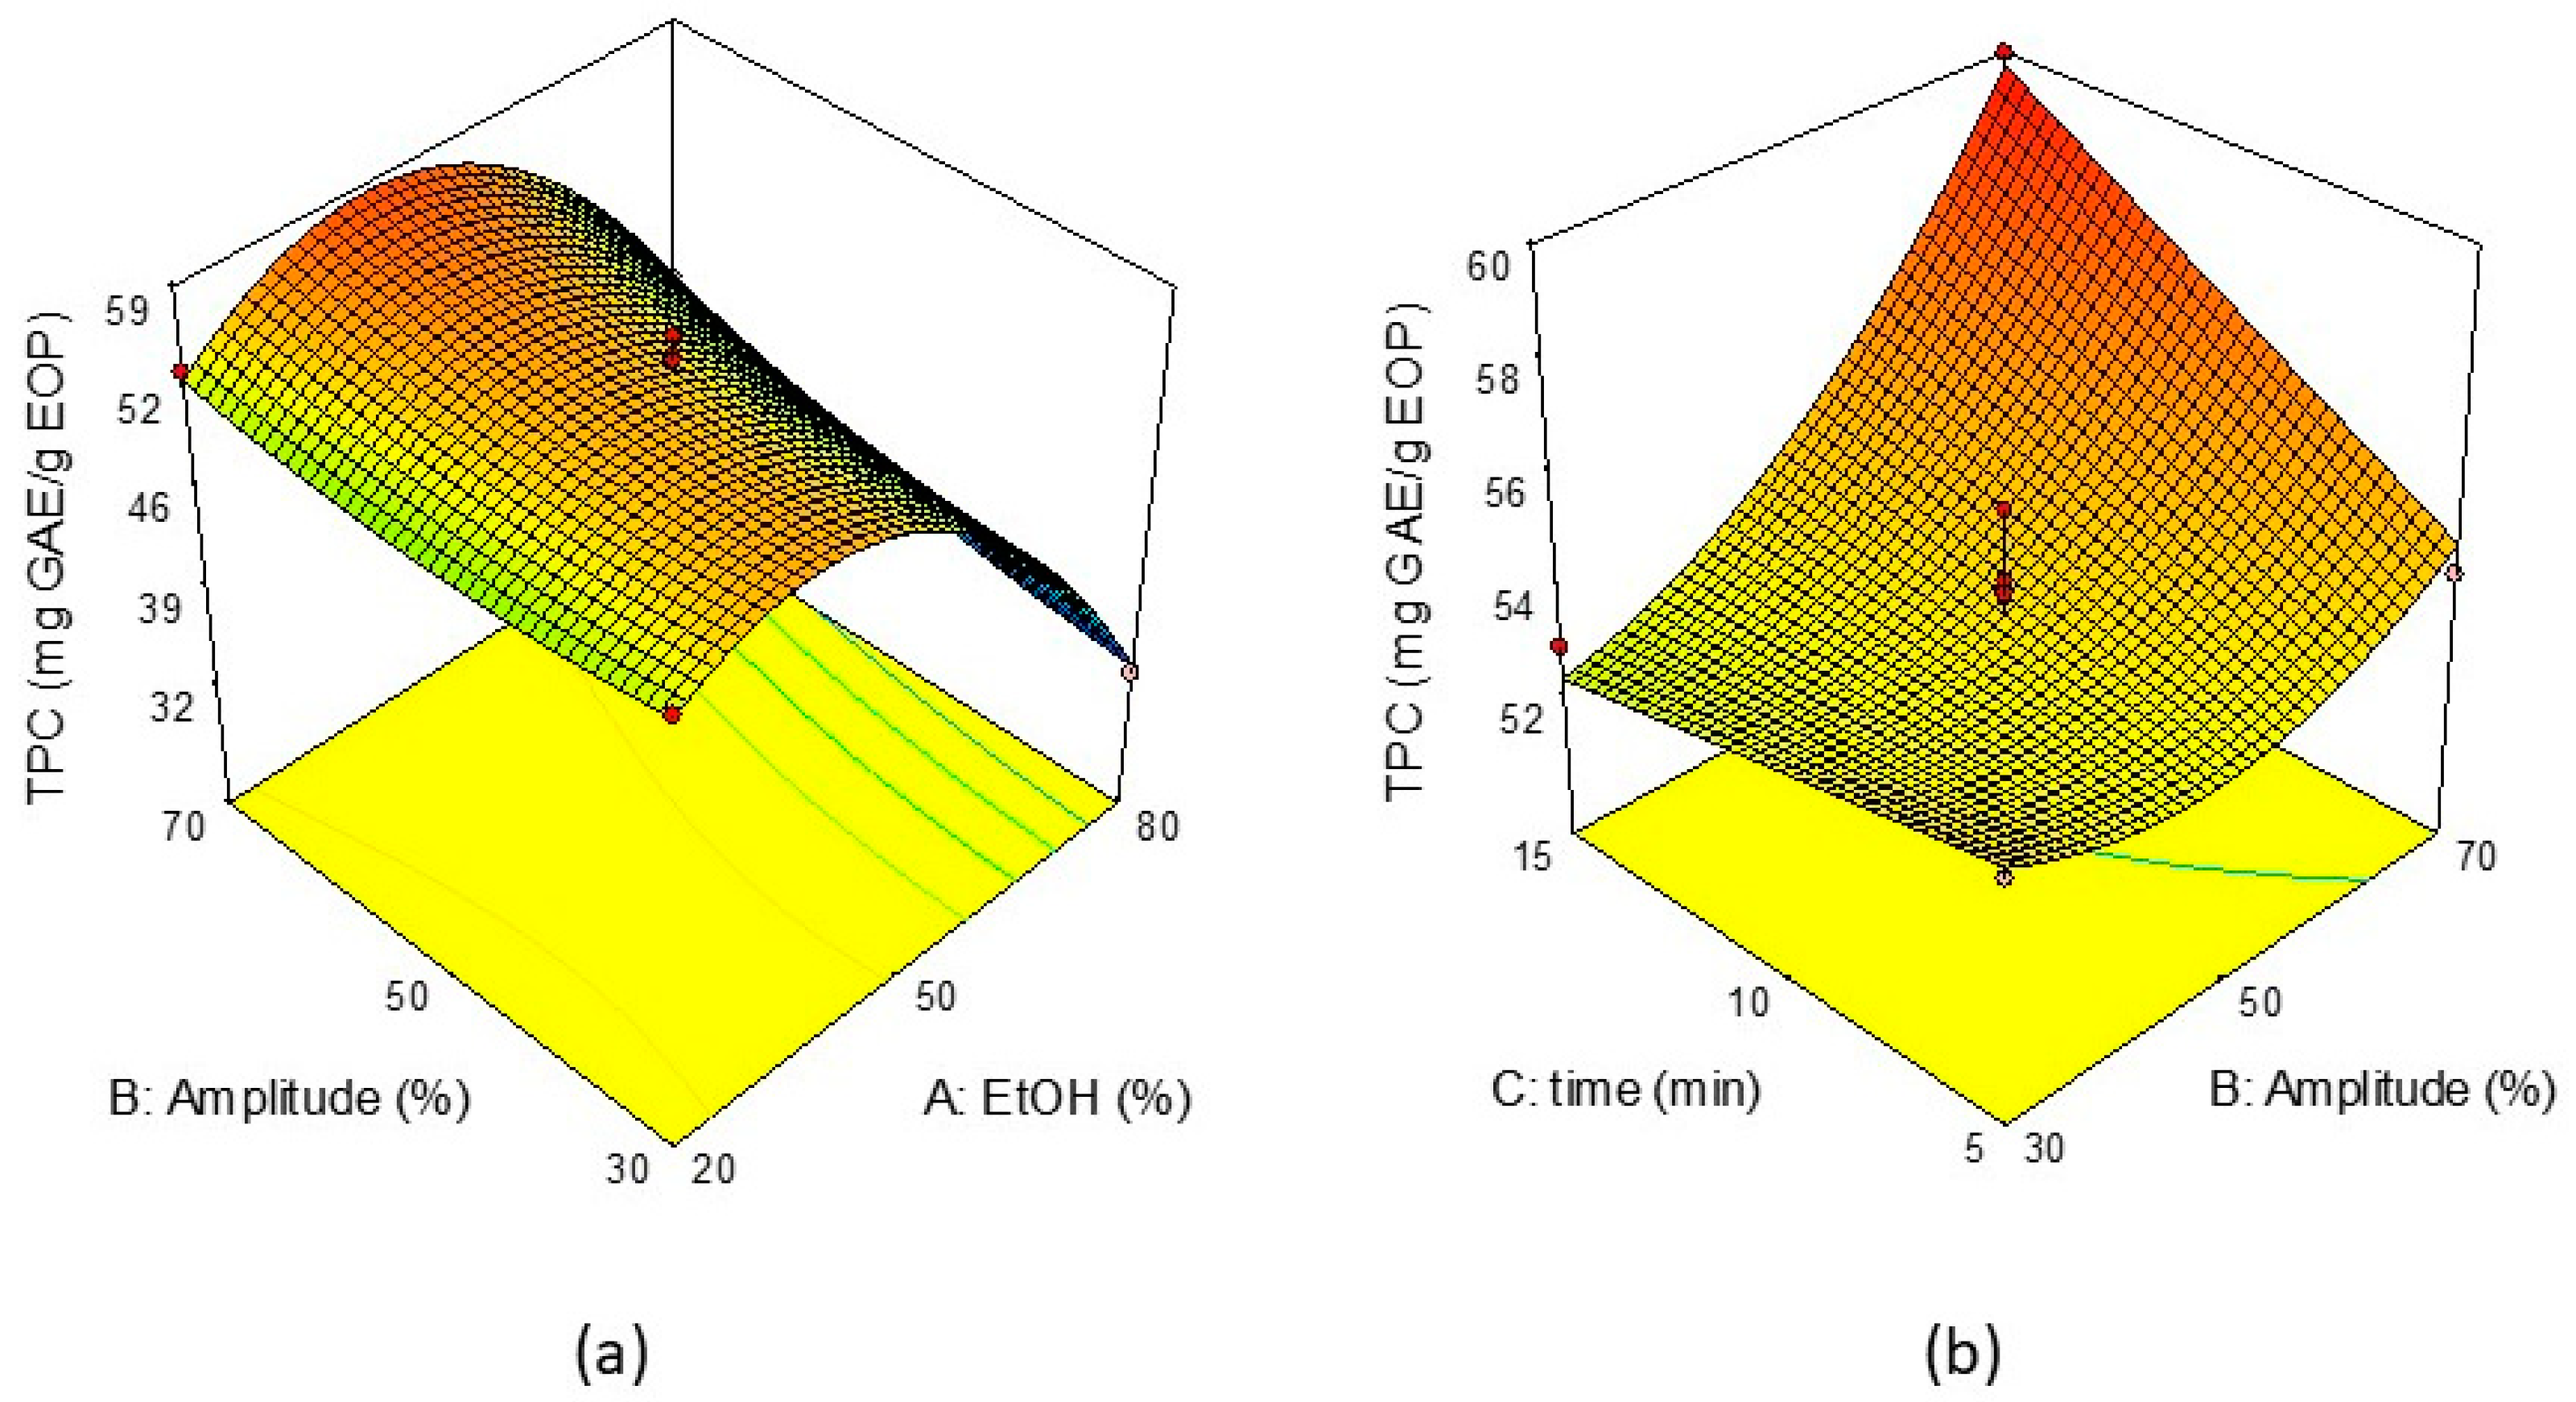
3.1. Influence of the Factors on the UAE of EOP and Model Equations

The Box–Behnken design was applied to study the impact of the three variables (ethanol concentration, amplitude, and ultrasonic time) on the ultrasound-assisted extraction of EOP. A total of 17 experiments, including one point and four replicates at the centre of the domain selected for each factor, were performed in random order (Table 2). Ethanol-water mixtures were selected as the extraction solvents following results that were obtained in our laboratory with other olive residues [17]. Additionally, ethanol is a low-cost and non-toxic solvent that is used in several food applications. Regarding the time and amplitude, the experimental range was not extended to avoid solvent evaporation, as the samples were not refrigerated during the experiment. The final temperature exceeded 75 °C (experiments 3 and 16) in the cases with higher values for both parameters. Table 2 presents the final temperatures of all of the experiments. The values of the fixed variables, such as particle size and the solid-liquid ratio, were selected based on the results of a preliminary screening [17].
Table 3 summarises the different statistical parameters and demonstrates the model adjustment to the experimental data for each model equation. The models that were obtained for each of the responses were statistically significant, with p-values < 0.0001 in all cases, and the dispersions of the experimental results were independent of the pure errors of the models, as indicated by the lack of significance of the p-values for the lack of fit (p > 0.05 in all cases). R2 values that are close to 1 indicate good accuracies of the models and, in all cases, the R2 values were greater than 0.97. Moreover, the good precision and reproducibility of the models were confirmed by the CV values, which were below 3.5% in the five response equations.
The experimental results were adjusted to quadratic regression equations. The equations for the coded values of the independent variables that modelled the five studied responses are presented below, with the non-significant terms (p-values > 0.1) removed.
TPC = 54.28 − 7.73 · EtOH + 2.08 · Amp + 0.84 · t + 1.99 · EtOH · Amp + 1.63 · Amp · t − 10.44 EtOH2 + 1.32 · Amp2
TFC = 118.05 − 12.35 · EtOH + 1.5 · Amp + 4 · t + 2.19 · EtOH · Amp + 2.08 · Amp · t − 19.82 EtOH2
DPPH = 55.94 – 4.60 · EtOH + 1.73 · Amp + 1.45 · t + 1.12 · EtOH · t − 1.34 · Amp · t − 9.27 EtOH2 + 1.16 · t2
ABTS = 126.37 − 17.46 · EtOH + 4.02 · Amp + 6.88 · t + 4.54 · EtOH · Amp − 28.78 EtOH2 + 3.91 · Amp2 − 3.22 · t2
FRAP = 59.13 − 7.11 · EtOH + 2.44 · Amp + 2.52 · t + 2.35 · EtOH · Amp − 11.2 EtOH2 + 1.57 · t2

3.1.1. Total Phenolic Compounds (TPC)

Phenolic compounds are metabolites with antioxidant activities that are present in vegetable sources. These compounds are highly sensitive to environmental factors; therefore, the extraction conditions are very important in recovering high levels of bioactive compounds [1]. As presented in Table 2, the amounts of TPC ranged between 32.8 and 60.4 mg GAE/g EOP in the experiments numbered 14 and 3 of the design. The model equation (Equation (2)) revealed that the ethanol concentration was the most influential factor in this response, as can be deduced from the higher coefficients of the linear and quadratic terms for this variable. Likewise, the influence of the other two factors, ultrasound amplitude and extraction time, as well as the interaction between them, was significant. As an example, Figure 1 shows a close agreement between the predicted and experimental values for TPC.
As presented in Figure 2a, the ethanol concentration had a positive influence that reached a maximum at approximately 40% ethanol and subsequently declined, as indicated by the negative signs of the linear and quadratic terms for this parameter. This behaviour can be explained in accordance with the principle of similarity and intermiscibility; i.e., greater extraction of phenolic compounds is achieved when the solvent and the solute have similar polarity [2]. Notably, the use of a mixture of ethanol and water, as the solvent is more efficient in the phenolic extraction than the use of a pure solvent. Goldsmith et al. [19] optimised the UAE of olive pomace while only using water and achieved a maximum of 19.7 mg GAE/g OP, which is lower than the values that were obtained in the present work. The amplitude and extraction time had a positive effect over the entire range (Figure 2b) and amplitude had the greater positive effect. Thus, the highest TPC (60.9 mg GAE/g EOP) was predicted by the model at an ethanol concentration of 41.7%, an amplitude of 70%, and a time of 15 min.

3.1.2. Total Flavonoid Compounds (TFC)

Flavonoids are a subgroup within the highly diverse group of phenolic compounds, and their specific biological properties depend on their chemical structures. The TFC values ranged between 81.1 (experiment 13) and 125.6 mg RE/g EOP (experiment 3) in the performed experiments (Table 2). These results indicate that the extraction yield of flavonoids increased up to 1.55 times when the extraction was carried out at the intermediate level of ethanol concentration and the highest level of both ultrasound amplitude and time. This shows the importance of optimising the UAE conditions. As expected, taking into account that flavonoids can be considered as phenolic compounds, the predicted model for TFC (Equation (3)) was similar to that obtained for TPC with a significant negative effect of the ethanol concentration in both responses.
Figure 2 depicts the surface of the TPC response as a function of ethanol concentration and amplitude (a) and as a function of amplitude and time (b). The extraction time and amplitude exhibited positive influences over the entire studied range. The TFC level reached a maximum at a solvent composition of approximately 40% ethanol regarding the influence of the ethanol concentration (Figure 3a), and again this was the most important factor. Similar influence of the ethanol concentration in flavonoid extraction has been observed in other biomasses [2,18]. In this work, the model predicted the greatest TFC at 42.3% ethanol concentration, 70% amplitude, and 15 min, which would achieve 126.9 mg RE/g EOP.

3.1.3. Antioxidant Activity

Three methods were applied to determine the antioxidant activities in the EOP extracts. The experimental values (Table 2) varied between 40.5 and 59.9 mg TE/g EOP in the DPPH assay, between 72.1 and 140.5 mg TE/g EOP in the ABTS assay, and between 36.1 and 64.4 mg TE/g EOP in the FRAP assay. The software generated similar model equations for DPPH Equation (4), ABTS Equation (5), and FRAP assays Equation (6).
In the three analytical methods that were applied, the antioxidant activity depended on the three variables studied, with the linear and quadratic terms for the ethanol concentration being the most significant ones with a clear negative influence. It is worth noting that a significant interaction effect between this factor and the ultrasound amplitude was detected for ABTS and FRAP assays, but not for DPPH. In the case of ABTS assay, the negative coefficient for the quadratic term for extraction time was not sufficient to change the trend. Figure 4a,c,e depict the influence of ethanol concentration and amplitude on the DPPH, ABTS, and FRAP assay responses, respectively. Figure 4b,d,f present the surface responses as a function of amplitude and extraction time for the same responses. The three assays of antioxidant activity produced similar influences of the studied variables on the TPC and TFC responses. This behaviour indicates a clear correlation between the presence of phenolic compounds and the antioxidant activity of the EOP extracts. The extraction time and amplitude increased with the values of the responses across the entire studied ranges, and the ethanol concentration produced maximum yield when the liquid was approximately 40% ethanol.

3.2. Process Optimisation and Validation of the Model

An optimisation of the three studied variables was carried out with the objective of simultaneously maximising the five measured responses due to the relationship between phenolic compounds and their antioxidant activity (i.e., TPC, TFC, DPPH, ABTS, and FRAP). The optimal conditions that were predicted by the model that maximised all responses included a 43.2% ethanol concentration, 70% amplitude, and a 15 min extraction time. Table 4 shows the values that were predicted by the model for all of the responses in the optimal conditions and the means of three experiments that were performed in the optimal conditions to test the adequacy of the model. The experimental data were close to the values that were predicted by the model; the error was below 10% in all cases.
Regarding other residues from olive oil production, Martinez-Patiño et al. [17] studied the phenolic content and antioxidant activity of extracts from olive tree pruning (OTP) and olive mill leaves (OML) while also using UAE. The optimised UAE conditions for OTP and OML were similar to those for EOP, but the ethanol concentration was slightly higher (approximately 55%). All of the responses that were determined for the EOP extracts were significantly greater than those of the OTP and OML extracts. Table 5 summarises the increments in the five studied responses in the EOP extracts with respect to OTP and OML. In the case of TPC, the EOP liquids produced results that were 1.85 times greater than those from the OTP extracts and 1.37 times greater than those of the OML extracts.
Other by-products from agro-industrial processes have been studied in terms of obtaining phenolic compounds while also using UAE. For example, waste from sunflower oil production, e.g., sunflower seed cake, reached 17.96 mg GAE/g dry TPC biomass in optimised UAE conditions, 43% ethanol, 70 °C and 86 µm amplitude [20], and the residue from lemon juice production produced 17.97 mg GAE/g dry TPC biomass and an antioxidant activity of 9.4 mg TE/g dry biomass in a FRAP assay of extracts that were obtained with UAE at 50 °C, 45 min and 250 W [21]. In both cases, the reported phenolic compound concentrations are lower than those that were obtained with EOP extracts in this work. Hence, EOP could be considered to be a relevant source for antioxidant compounds, in an olive-derived biorefinery concept.

3.3. Olive Pomace and Extracted Olive Pomace as Sources of Antioxidants

Olive pomace (OP) and extracted olive pomace (EOP), respectively, are the main wastes in the olive mills and the olive pomace extracting industries. Table 6 presents recent references from the literature related to the extraction of phenolic compounds from these agro-industrial residues. OP is the by-product obtained after olive oil separation (by centrifugation), which still contains residual oil and it is described with different names that include alperujo or olive cake while orujillo is the final residue, exhausted, and dry olive pomace. Most of these references used olive pomace from olive mills as raw material. In most of these works, olive pomace from the olive mills was used as raw material, and then it was defatted in the laboratory with an organic solvent prior to antioxidant extraction. Only the present work and that of Caballero et al. [22] used real EOP industrial waste.
Several extraction methods have been studied, including conventional extraction, UAE, microwave-assisted extraction (MAE), high hydrostatic pressure-assisted extraction (HHPAE), supercritical fluid extraction (SFE), and extraction with eutectic solvents. In this body of work, Chanioti and Tzia [23] reported that the use of eutectic solvents improved the phenolic extraction yield from OP with respect to conventional solvents (i.e., solutions of water and ethanol). However, the content of the phenolics that were obtained in the present work with real EOP that was extracted by ultrasound with an ethanol-water mixture of 43% (57.5 mg GAE/g EOP) was higher than that reported by these authors with the use of deep eutectic solvents and ultrasound as the extraction method (20.1 mg GAE/g OP). Caballero et al. (2018) [22] reported a TPC of 14.1 mg GAE from exhausted pomace while using SFE. Seçmeler et al. (2018) [28] proposed the use of steam explosion and other hydrothermal pretreatments, such as subcritical water for the recovery of phenols and reported higher values (69.7–73.3 mg GAE) than those that were obtained in the present research. Regarding the content of specific phenolic compounds, Xie et al., [25] found that UAE resulted in greater extraction efficiencies of hydroxytyrosol, maslinic acid, and oleanolic acid from OP when compared with conventional extraction and MAE. Importantly, the comparison of the results from different works that utilised different extraction techniques is difficult due to the variability of OP and EOP samples (e.g., differences due to the type of cultivation and the variety and maturation of the olives) and the different methods that are used to quantify the phenolic compound content and measure the antioxidant activity. However, the results that were obtained here and in the studies reported in the bibliography suggest that the residual biomass contains noticeable amounts of phenols and high antioxidant activity. Therefore, the extract from olive pomace has potential for use as a natural bioactive ingredient in different industrial applications.

4. Conclusions

Exhausted olive pomace is an interesting source of natural antioxidant compounds, which can be extracted as a first step in a biorefinery strategy for valorisation of this agro-industrial residue. This work investigated the impact of ultrasound assisted extraction conditions on TPC, TFC, and antioxidant activity of EOP while using RSM. The optimal conditions for UAE were determined at 43.2% ethanol concentration, 70% ultrasound amplitude, and 15 min extraction time, yielding an optimal extract with higher phenolic and flavonoid content, as well as higher antioxidant activity than those previously determined for other by-products of the olive oil industries, such olive oil or olive tree pruning also extracted by ultrasound.

Author Contributions

I.R., E.R. and E.C. designed the experiments and revised the manuscript; J.C.M.-P. and I.G.-C. performed the experimental part and wrote the draft version of the manuscript; M.B., B.G. and I.R. supervised the experimental work and analysed and discussed the results. All authors approved the final version.

Funding

This research was funded by the Spanish Ministerio de Economía y Competitividad- Agencia Estatal de Investigación and Fondo Europeo de Desarrollo Regional. Project Reference ENE2017-85819-C2-1-R.

Acknowledgments

José Carlos Martínez Patiño gratefully acknowledges financial support provided by the Universidad de Jaén Doctoral School. Irene Gómez-Cruz expresses her gratitude also to the Universidad de Jaén for financial support (grant R5/04/2017).

Conflicts of Interest

The authors declare no conflict of interest.

References

  1. Medina-Torres, N.; Ayora-Talavera, T.; Espinosa-Andrews, H.; Sánchez-Contreras, A.; Pacheco, N. Ultrasound assisted extraction for the recovery of phenolic compounds from vegetable sources. Agronomy 2017, 7, 47. [Google Scholar] [CrossRef]
  2. Gullón, B.; Gullón, P.; Lú-Chau, T.A.; Moreira, M.T.; Lema, J.M.; Eibes, G. Optimization of solvent extraction of antioxidants from Eucalyptus globulus leaves by response surface methodology: Characterization and assessment of their bioactive properties. Ind. Crops Prod. 2017, 108, 649–659. [Google Scholar] [CrossRef]
  3. Gullón, B.; Eibes, G.; Moreira, M.T.; Herrera, R.; Labidi, J.; Gullón, P. Yerba mate waste: A sustainable resource of antioxidant compounds. Ind. Crop. Prod. 2018, 113, 398–405. [Google Scholar] [CrossRef]
  4. Romero-García, J.M.; Niño, L.; Martínez-Patiño, C.; Álvarez, C.; Castro, E.; Negro, M.J. Biorefinery based on olive biomass. State of the art and future trends. Bioresour. Technol. 2014, 159, 421–432. [Google Scholar] [CrossRef] [PubMed]
  5. Food and Agriculture Organization of the United Nations. FAOSTAT. 2019. Available online: http://faostat3.fao.org/ (accessed on 3 May 2019).
  6. Manzanares, P.; Ruiz, E.; Ballesteros, M.; Negro, M.J.; Gallego, F.J.; López-Linares, J.C.; Castro, E. Residual biomass potential in olive tree cultivation and olive oil industry in Spain: Valorization proposal in a biorefinery context. Span. J. Agric. Res. 2017, 15, 6. [Google Scholar] [CrossRef]
  7. Ruiz, E.; Romero-García, J.M.; Romero, I.; Manzanares, P.; Negro, M.J.; Castro, E. Olive-derived biomass as a source of energy and chemicals. Biofuel Bioprod. Biorefining 2017, 11, 1077–1094. [Google Scholar] [CrossRef]
  8. Berbel, J.; Posadillo, A. Review and analysis of alternatives for the valorisation of agro-industrial olive oil by-products. Sustainability 2018, 10, 237. [Google Scholar] [CrossRef]
  9. Pérez-Bonilla, M.; Salido, S.; Van Beek, T.A.; Waard, P.D.; Linares-Palomino, P.J.; Sánchez, A.; Altarejos, J. Isolation of antioxidative secoiridoids from olive wood (Olea europaea L.) guided by on-line HPLC-DAD-radical scavenging detection. Food Chem. 2011, 124, 36–41. [Google Scholar] [CrossRef]
  10. Gullón, B.; Gullón, P.; Eibes, G.; Cara, C.; De Torres, A.; López-Linares, J.C.; Ruiz, E.; Castro, E. Valorisation of olive agro-industrial by-products as a source of bioactive compounds. Sci. Total Environ. 2018, 645, 533–542. [Google Scholar] [CrossRef]
  11. Hayta, M.; Isçimen, E.M. Optimization of ultrasound-assisted antioxidant compounds extraction from germinated chickpea using response surface methodology. LWT Food Sci. Technol. 2017, 77, 208–216. [Google Scholar] [CrossRef]
  12. Khemakhem, I.; Ahmad-Qasem, M.H.; Catalán, E.B.; Micol, V.; García-Pérez, J.V.; Ayadi, M.A.; Bouaziz, M. Kinetic improvement of olive leaves bioactive compounds extraction by using power ultrasound in a wide temperature range. Ultrason. Sonochem. 2017, 34, 466–473. [Google Scholar] [CrossRef] [PubMed]
  13. Hosseini, H.; Bolourian, S.; Yaghoubi Hamgini, E.; Ghanuni Mahababadi, E. Optimization of heat- and ultrasound-assisted extraction of polyphenols from dried rosemary leaves using response surface methodology. J. Food Process. Preserv. 2018, 42, e13778. [Google Scholar] [CrossRef]
  14. Tiwari, B.K. Ultrasound: A clean, green extraction technology. TrAC Trends Anal. Chem. 2015, 71, 100–109. [Google Scholar] [CrossRef]
  15. Bamba, B.S.B.; Shi, J.; Tranchant, C.C.; Xue, S.J.; Forney, C.F.; Lim, L.T. Influence of extraction conditions on ultrasound-assisted recovery of bioactive phenolics from blueberry pomace and their antioxidant activity. Molecules 2018, 23, 1685. [Google Scholar] [CrossRef] [PubMed]
  16. Singleton, V.L.; Rossi, S.A. Colorimetric of total phenolics with phosphomolibic-phosphotungstic acid reagents. Am. J. Enol. Vitic. 1965, 16, 144–158. [Google Scholar]
  17. Martínez-Patiño, J.C.; Gullón, B.; Romero, I.; Ruiz, E.; Brncic, M.; Žlabur, J.Š.; Castro, E. Optimization of ultrasound-assisted extraction of biomass from olive trees using response surface methodology. Ultrason. Sonochem. 2019, 51, 487–495. [Google Scholar] [CrossRef]
  18. Kim, D.O.; Jeong, S.W.; Lee, C.Y. Antioxidant capacity of phenolic phytochemicals from various cultivars of plums. Food Chem. 2003, 81, 321–326. [Google Scholar] [CrossRef]
  19. Goldsmith, C.D.; Vuong, Q.V.; Stathopoulos, C.E.; Roach, P.D.; Scarlett, C.J. Ultrasound increases the aqueous extraction of phenolic compounds with high antioxidant activity from olive pomace. LWT Food Sci. Technol. 2018, 89, 284–290. [Google Scholar] [CrossRef] [Green Version]
  20. Zardo, I.; de Espíndola Sobczyk, A.; Marczak, L.D.F.; Sarkis, J. Optimization of Ultrasound Assisted Extraction of Phenolic Compounds from Sunflower Seed Cake Using Response Surface Methodology. Waste Biomass Valoris. 2019, 10, 33–44. [Google Scholar] [CrossRef]
  21. Papoutsis, K.; Pristijono, P.; Golding, J.B.; Stathopoulos, C.E.; Bowyer, M.C.; Scarlett, C.J.; Vuong, Q.V. Optimizing a sustainable ultrasound-assisted extraction method for the recovery of polyphenols from lemon by-products: Comparison with hot water and organic solvent extractions. Eur. Food Res. Technol. 2018, 244, 1353–1365. [Google Scholar] [CrossRef]
  22. Caballero, A.S.; Romero-García, J.M.; Castro, E.; Cardona, C.A. Supercritical fluid extraction for enhancing polyphenolic compounds production from olive waste extracts. J. Chem. Technol. Biotechnol. 2019. Available online: https://onlinelibrary.wiley.com/doi/abs/10.1002/jctb.5907/ (accessed on 3 May 2019). [CrossRef]
  23. Chanioti, S.; Tzia, C. Extraction of phenolic compounds from olive pomace by using natural deep eutectic solvents and innovative extraction techniques. Innov. Food Sci. Emerg. Technol. 2018, 48, 228–239. [Google Scholar] [CrossRef]
  24. Albahari, P.; Jug, M.; Radic, K.; Jurmanovic, S.; Brncic, M.; Brncic, S.R.; Vitali Cepo, D. Characterization of olive pomace extract obtained by cyclodextrin-enhanced pulsed ultrasound assisted extraction. LWT Food Sci. Technol. 2018, 92, 22–31. [Google Scholar] [CrossRef]
  25. Xie, P.; Huang, L.; Zhang, C.; Deng, Y.; Wang, X.; Cheng, J. Enhanced extraction of hydroxytyrosol, maslinic acid and oleanolic acid from olive pomace: Process parameters, kinetics and thermodynamics, and greenness assessment. Food Chem. 2019, 276, 662–674. [Google Scholar] [CrossRef] [PubMed]
  26. Antónia Nunes, M.; Pawlowski, S.; Costa, A.S.G.; Alves, R.C.; Oliveira, M.B.P.P.; Velizarov, S. Valorization of olive pomace by a green integrated approach applying sustainable extraction and membrane-assisted concentration. Sci. Total Environ. 2019, 652, 40–47. [Google Scholar] [CrossRef] [PubMed]
  27. Alu’datt, M.H.; Alli, I.; Ereifej, K.; Alhamad, M.; Al-Tawaha, A.R.; Rababah, T. Optimisation, characterisation and quantification of phenolic compounds in olive cake. Food Chem. 2010, 123, 117–122. [Google Scholar] [CrossRef]
  28. Seçmeler, Ö.; Güçlü Üstündag, Ö.; Fernández-Bolaños, J.; Rodríguez-Gutiérrez, G. Effect of subcritical water and steam explosion pretreatments on the recovery of sterols, phenols and oil from olive pomace. Food Chem. 2018, 265, 298–307. [Google Scholar] [CrossRef] [Green Version]
  29. Moudache, M.; Colon, M.; Nerín, C.; Zaidi, F. Phenolic content and antioxidant activity of olive by-products and antioxidant film containing olive leaf extract. Food Chem. 2016, 212, 521–527. [Google Scholar] [CrossRef] [PubMed]
  30. Rubio-Senent, F.; Fernández-Bolaños, J.; García-Borrego, A.; Lama-Muñoz, A.; Rodríguez-Gutiérrez, G. Influence of pH on the antioxidant phenols solubilised from hydrothermally treated olive oil by-product (alperujo). Food Chem. 2017, 219, 339–345. [Google Scholar] [CrossRef]
  31. Uribe, E.; Pasten, A.; Lemus-Mondaca, R.; Vega-Gálvez, A.; Quispe-Fuentes, I.; Ortiz, J.; Di Scala, K. Comparison of Chemical Composition, Bioactive Compounds and Antioxidant Activity of Three Olive-Waste Cakes. J. Food Biochem. 2015, 39, 189–198. [Google Scholar] [CrossRef]
Figure 1. Predicted versus experimental values for total phenolic compounds (TPC) content in the EOP extracts.
Energies 12 02679 g001
Figure 2. Response surfaces of the total phenolic compounds (TFC) as functions of the (a) ethanol concentration and amplitude (time: 10 min) and the (b) amplitude and extraction time (ethanol concentration: 50%).
Energies 12 02679 g002
Figure 3. Response surface plots of the total flavonoid content (TFC) as a function of (a) the ethanol concentration and amplitude (time: 10 min) and (b) the amplitude and time (ethanol concentration: 50%).
Energies 12 02679 g003
Figure 4. Response surfaces of the antioxidant activity of the extracted olive pomace (EOP) extracts. (a,b) DPPH assay; (c,d) ABTS assay; and, (e,f) FRAP assay.
Energies 12 02679 g004
Table 1. Uncoded and coded values of the factors.
Independent VariableNomenclatureUnitsValue
(−1)0(+1)
Ethanol concentrationEtOH%v/v205080
AmplitudeAmp%305070
Extraction timetmin51015
Table 2. Experimental conditions for ultrasound-assisted extraction (UAE) for extracted olive pomace (EOP) and experimental data for the responses.
Exp.EtOH (%v/v)Amp (%)Time (min)T (°C)TPC (mg GAE/g EOP)TFC (mg RE/g EOP)DPPH (mg TE/g EOP)ABTS (mg TE/g EOP)FRAP (mg TE/g EOP)
15050105955.8119.753.6126.058.9
22030104753.0113.950.7121.656.9
35070157660.4125.659.9140.564.4
45050105854.5118.256.6128.061.0
5205054451.1105.251.8103.651.6
65050105854.2117.455.8124.358.3
7503054154.1113.252.3116.751.8
85030155753.3116.058.3128.257.5
9507055454.7114.559.3122.957.7
105050105954.3119.456.1125.257.5
118050156437.391.245.384.843.2
128070106941.388.044.090.444.2
13805054435.781.140.572.136.6
148030104432.883.140.874.636.1
155050105952.5118.456.1128.358.8
162070107453.5110.052.7119.355.6
172050156451.3113.252.1116.952.8
GAE: gallic acid equivalent; RE: rutin equivalent; TE: trolox equivalent.
Table 3. Statistical parameters of the five model equations.
CoefficientTPCTFCDPPHABTSFRAP
F-value147.14166.6776.85192.1260.44
p-value<0.0001<0.0001<0.0001<0.0001<0.0001
R20.99130.99010.98350.99340.9734
Adj R2 0.98430.98420.97070.98820.9571
C.V1.981.612.001.963.24
Lack of fit (p-value)0.80470.07060.67510.24250.2274
Table 4. Predicted and experimental ultrasound-assisted etraction (UAE) values of EOP in the optimal conditions that simultaneously maximised the five responses.
ValuesTPC (mg GAE/g EOP)TFC (mg RE/g EOP)DPPH (mg TE/g EOP)ABTS (mg TE/g EOP)FRAP (mg TE/g EOP)
Predicted value60.9126.959.3139.463.0
Experimental value57.5 ± 0.3139.6 ± 2.356.7 ± 1.5139.1 ± 4.764.9 ± 0.6
Error5.9%9.1%4.6%0.2%2.9%
Table 5. Comparison of the main antioxidant activity indicators for EOP and other olive oil production residues.
Residue RatioTPCTFCDPPHABTSFRAP
EOP/OTP1.851.881.792.091.78
EOP/OML1.371.451.331.451.31
Table 6. Antioxidant capacity indicators for olive pomace extracts.
MaterialMethodConditionsCharacterization of the ExtractsRef.
Olive pomaceUltrasound assisted extractionWater, 30 °C, 75 minTPC: 19.7 mg GAE/g
DPPH: 31.2 mg TE/g;
CUPRAC: 73.5 mg TE/g
[19]
Orujillo (exhausted pomace)Supercritical fluid extractionEthanol (60%), pressure 200, 250 and 300 barTPC: 14.0 mg GAE/g
DPPH: 85.3 µg TE/mL
[22]
Olive pomaceHomogenate (HAE), microwave (MAE), ultrasound (UAE) and high hydrostatic pressure (HHPAE) assisted extractionNatural deep eutectic solvents: [23]
HAE (60 °C, 30 min, 12,000 rpm)TPC: 34 mg GAE/g; 28 g d.w/g DPPH
MAE (60 °C, 30 min, 200 W)TPC: 29.6 mg GAE/g; 36.7 g d.w./g DPPH
UAE (60 °C, 30 min, 280 W, 60 kHz)TPC: 20.1 mg GAE/g; 40.6 g d.w./g DPPH
HHPAE (10 min, 600 MPa)TPC: 26 mg GAE/g; 45.7 g d.w./g DPPH
Olive pomaceConventional solvent extraction (CSE)CSE (Water-EtOH)TPC: 16.9 mg GAE/g;
DPPH: 0.81 g TE/L
[24]
Ultrasound-assisted extraction (UAE)UAE (70 °C, 120 min)TPC: 14.7 mg GAE/g;
DPPH: 1.76 g TE/L
Cyclodextrin-enhanced pulsed UAECyclodextrin-enhanced pulsed UAETPC: 69.6 mg GAE/g
DPPH: 52.2 mg TE/kg
Olive pomaceUltrasound-assisted extraction (UAE)UAE (90% EtOH; 50 °C; 5 min, S/L: 30 g/mL, 135.6 W/cm, 60 kHz)55.1 mg HT/g; 381.2 mg MA/g;
29.8 mg OA/g
[25]
Olive pomaceExtraction via membrane processingSelected membranes
(NF90, NF270, BW30)
TPC: 1234.3 mg GAE/L extract
TFC: 464.2 mg EE/L extract
DPPH: 405.9 µg TE/L extract
FRAP: 9183.3 µmol FSE/L extract
[26]
Olive cakeConventional extractionMethanol, 70 °C, 12 h, 3 cyclesTPC: 4.37 mg GAE/g
DPPH: 72% inhibition
[27]
Olive pomaceHydrothermal pretreatments (steam explosion (SE) and subcritical water (SCW))200 °C, 5 minSE
TPC: 73.3 mg GAE/g
SCW
TPC: 69.7 mg GAE/g
[28]
Olive cakeExtraction by magnetic stirringEthanol and acetone (70%), 2 hTPC: 63.7 mg GAE/g extract
DPPH: 95.4% inhibition
ORAC: 0.82 mg TE/g
[29]
AlperujoHydrothermal treatmentEthyl acetate, 160 °C, 60 min (pH = 4.5)TPC: 64.2 g GAE/100 g
DPPH: 12 mg TE/mL
FRAP: 1.8 mg TE/mL
[30]
Olive-waste cakeSoxhlet extraction n-hexane; 60 minTPC: 35 mg GAE/g;
TFC: 13.3 mg CTE/g
DPPH: 67.2 µmol TE/g
FRAP: 176.7 µmol TE/g
[31]
TPC: total phenolic content; GAE: gallic acid equivalents; d.w.: dry weight; TE: trolox equivalents; TFC: total flavonoids content; HT: hydroxytyrosol; MA: maslinic acid; OA: oleanolic acid; EE: epicatechin equivalents; FSE: ferrous sulfate equivalents; CTE: catequin equivalents.

