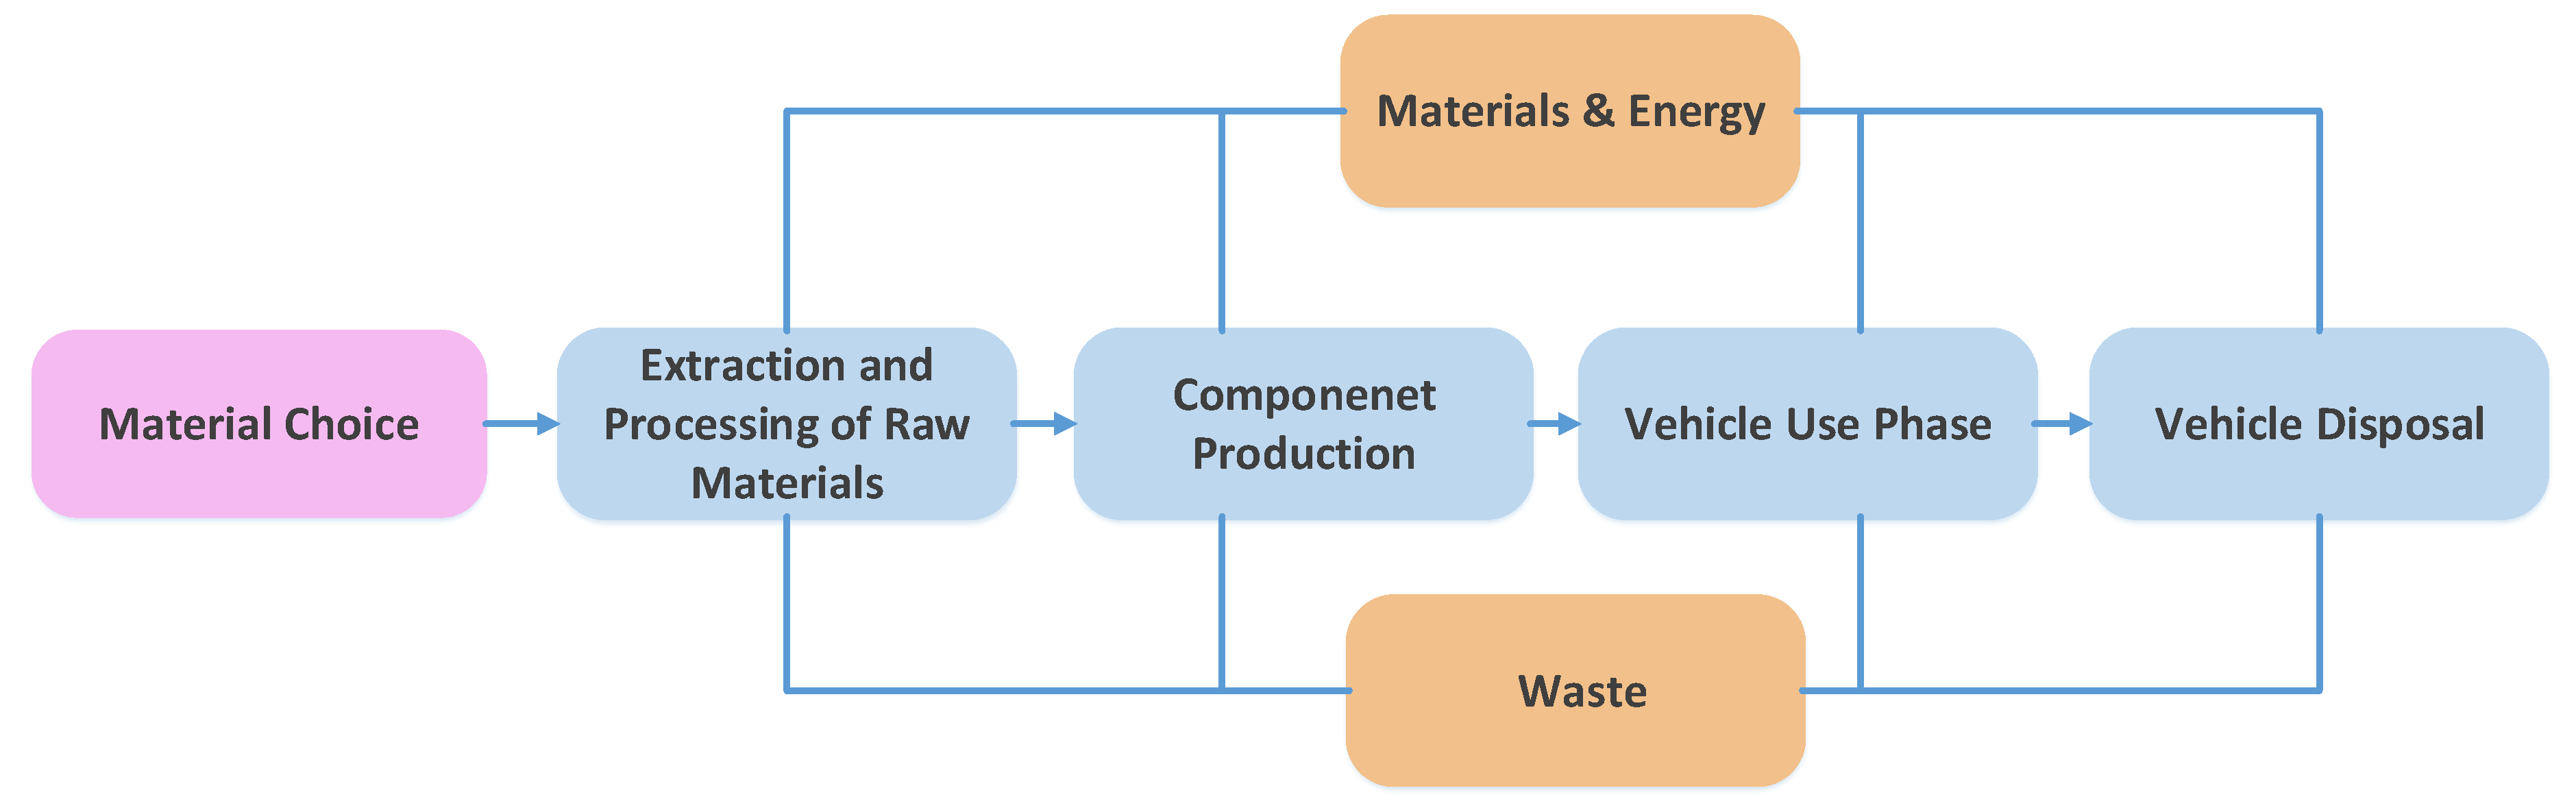
Figure 1.
“Cradle-to-grave” approach.
Figure 1.
“Cradle-to-grave” approach.
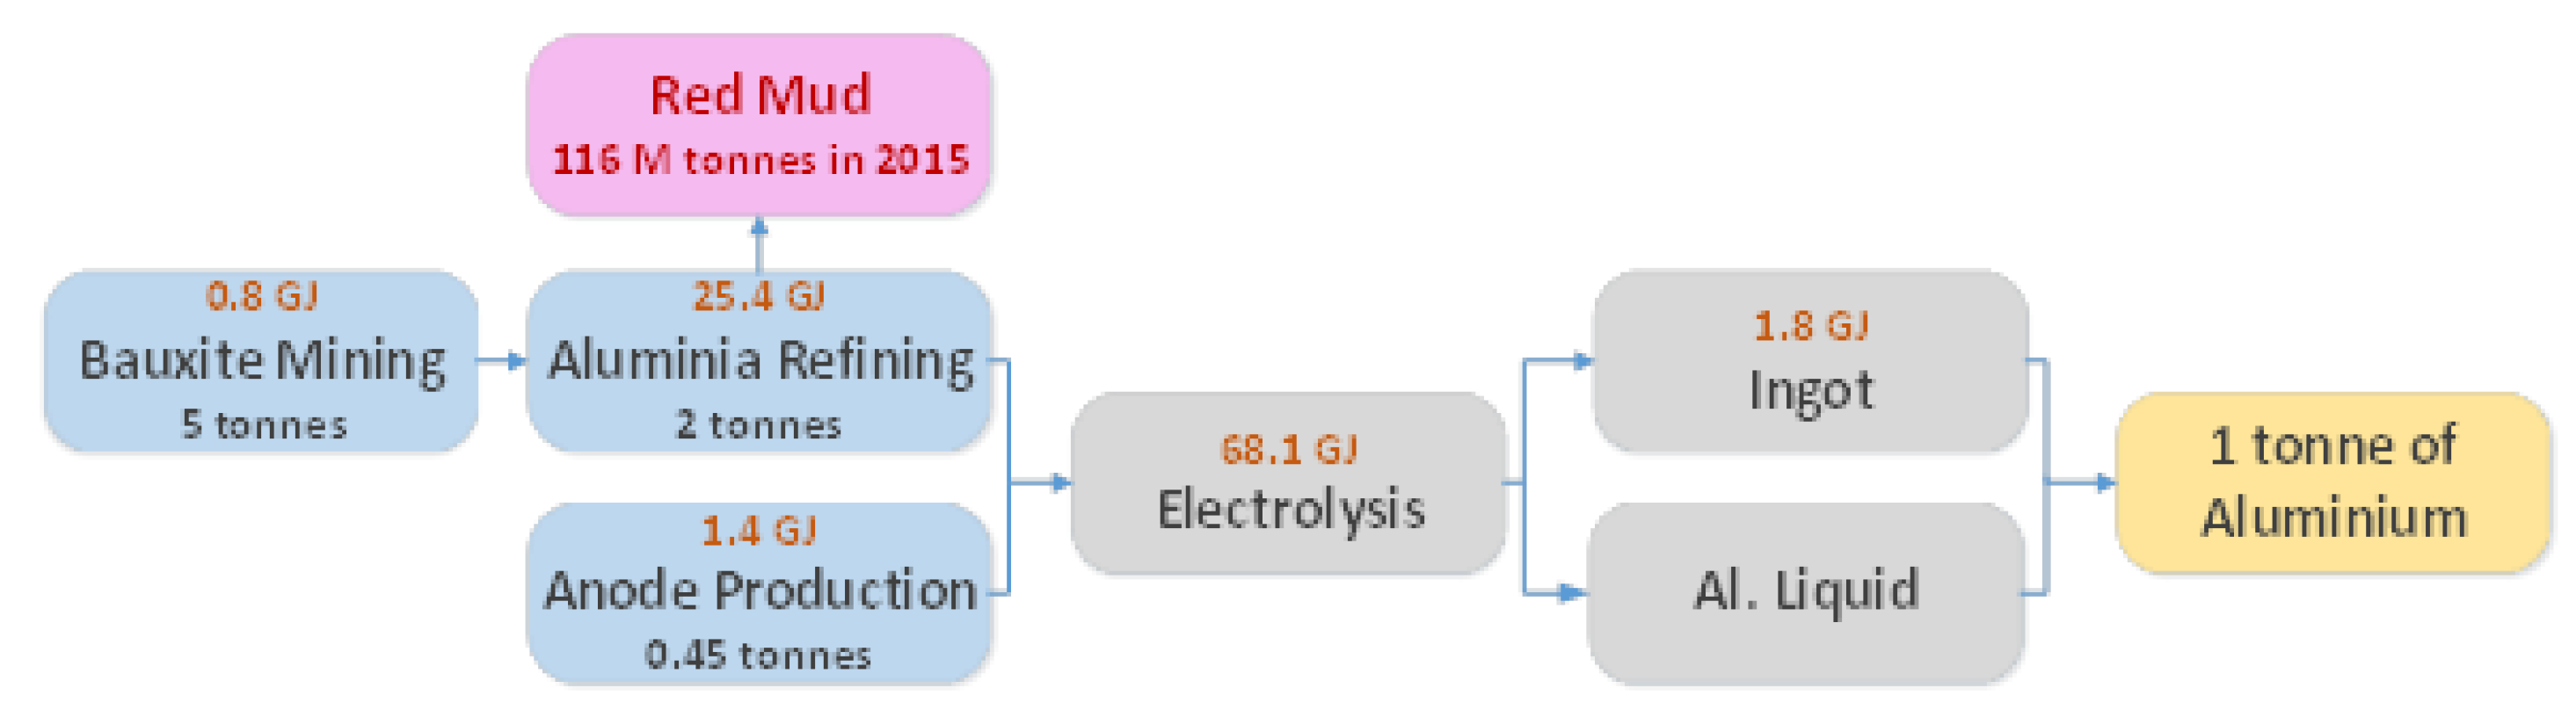
Figure 2.
Primary aluminum production steps with associated energy content for producing one ton of material.
Figure 2.
Primary aluminum production steps with associated energy content for producing one ton of material.
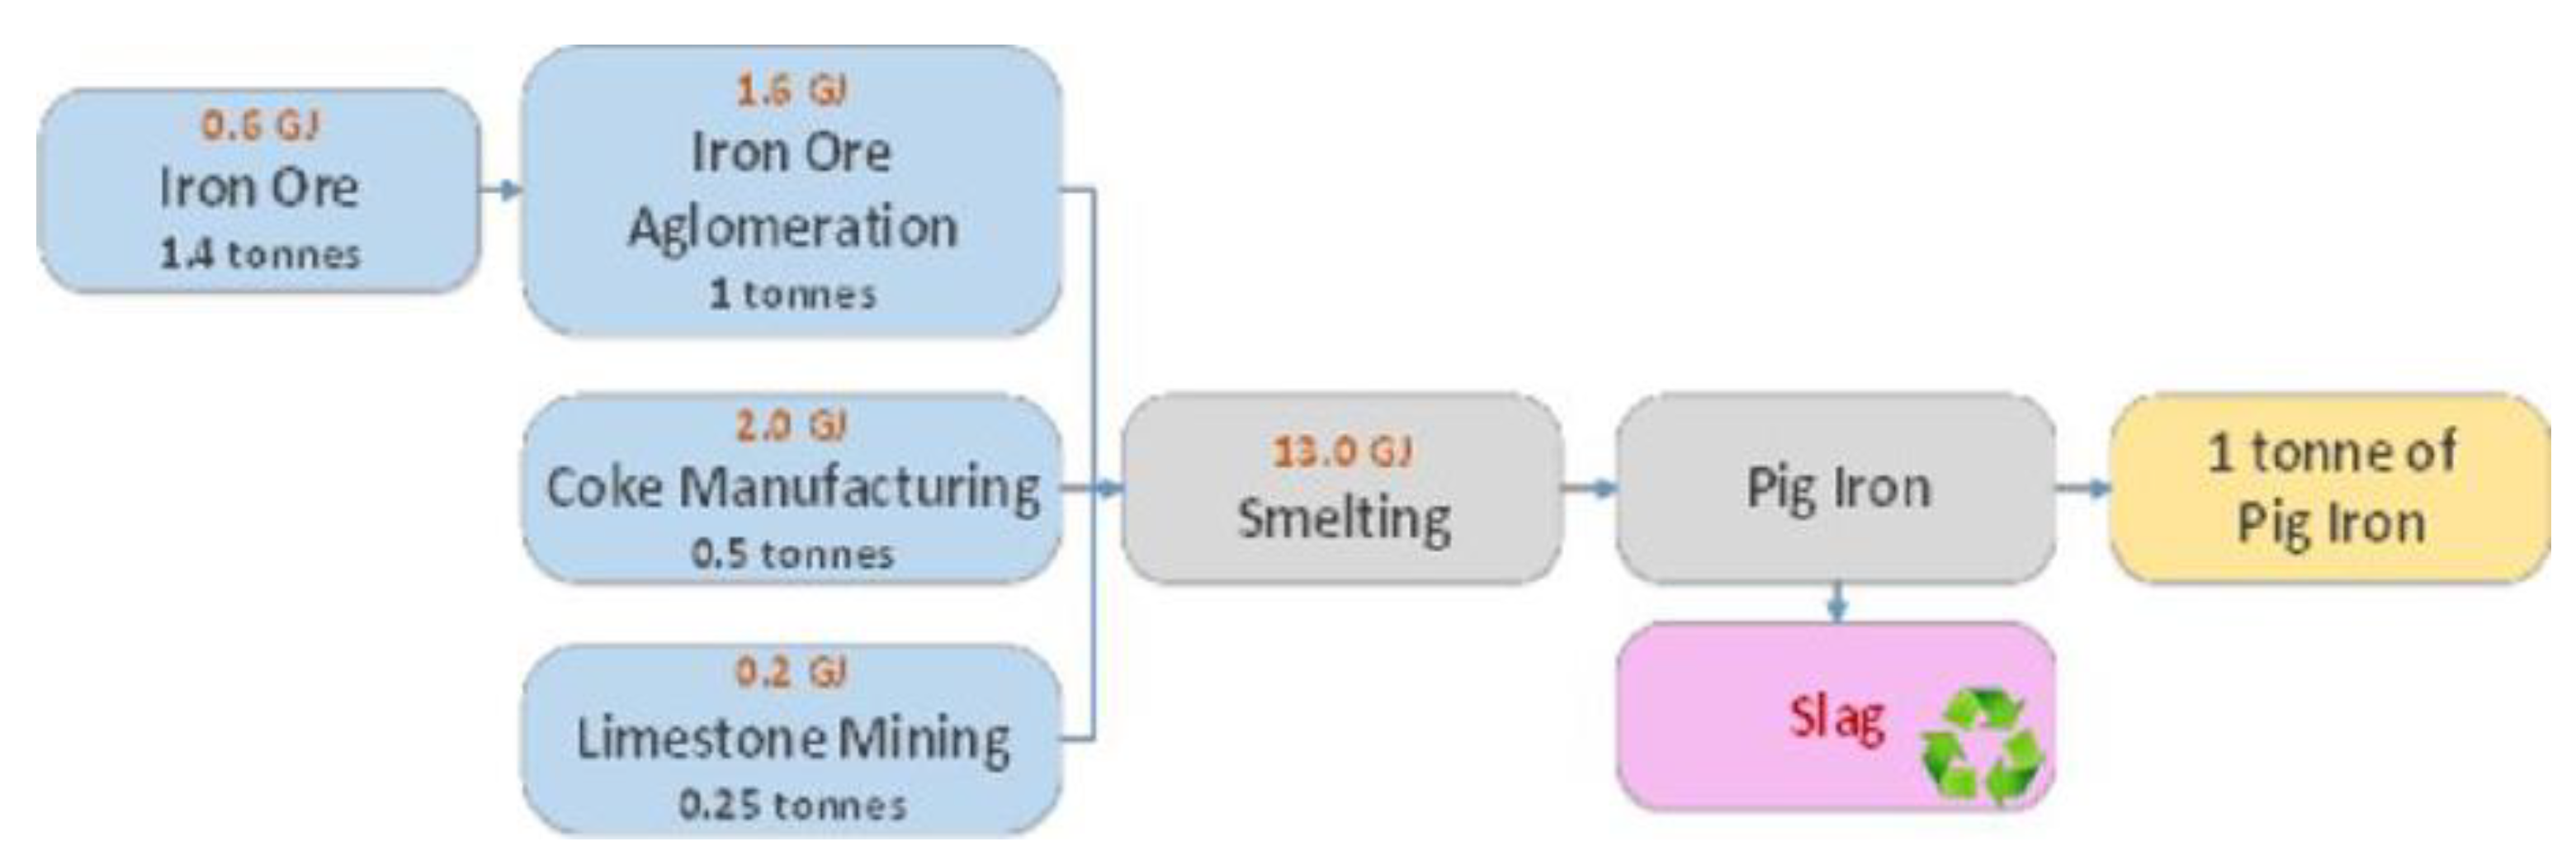
Figure 3.
Primary iron production steps with associated energy content for producing one ton of material.
Figure 3.
Primary iron production steps with associated energy content for producing one ton of material.
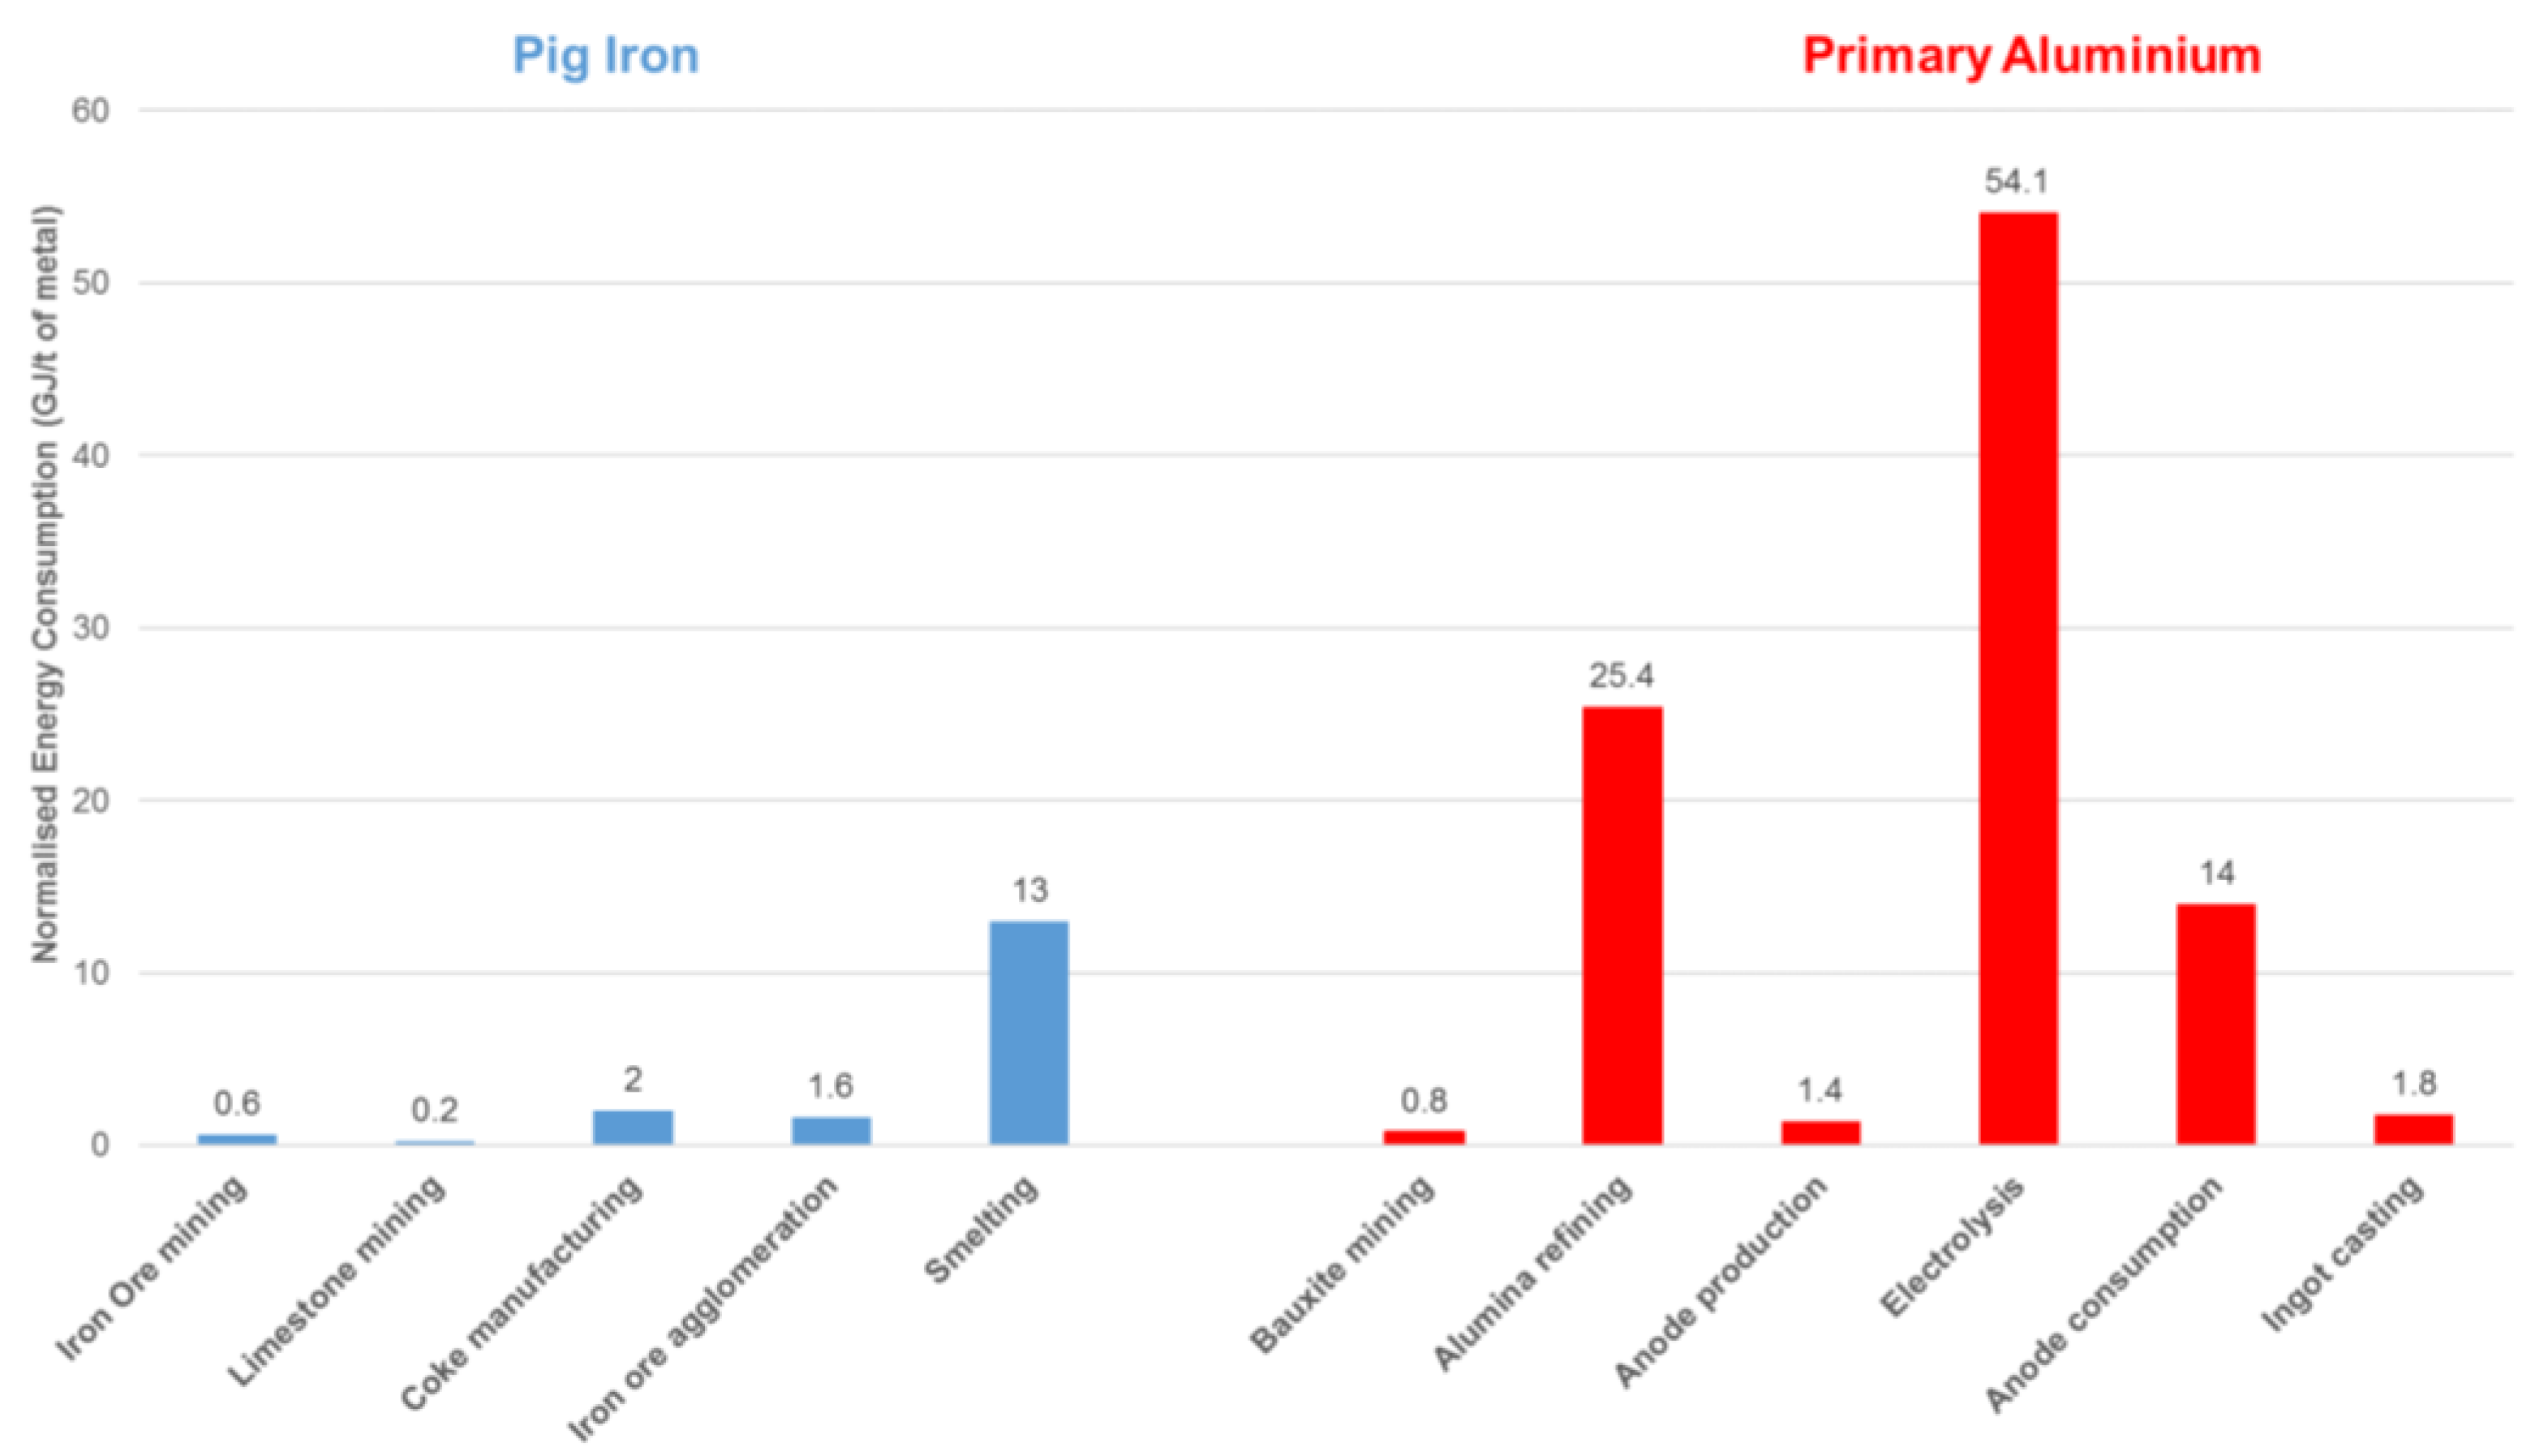
Figure 4.
Energy consumption for the production of pig iron and primary aluminum.
Figure 4.
Energy consumption for the production of pig iron and primary aluminum.
Figure 5.
Weight difference between cast iron and aluminum-alloy engine blocks according to the fuel consumed by the vehicle for 1.6-L engines.
Figure 5.
Weight difference between cast iron and aluminum-alloy engine blocks according to the fuel consumed by the vehicle for 1.6-L engines.
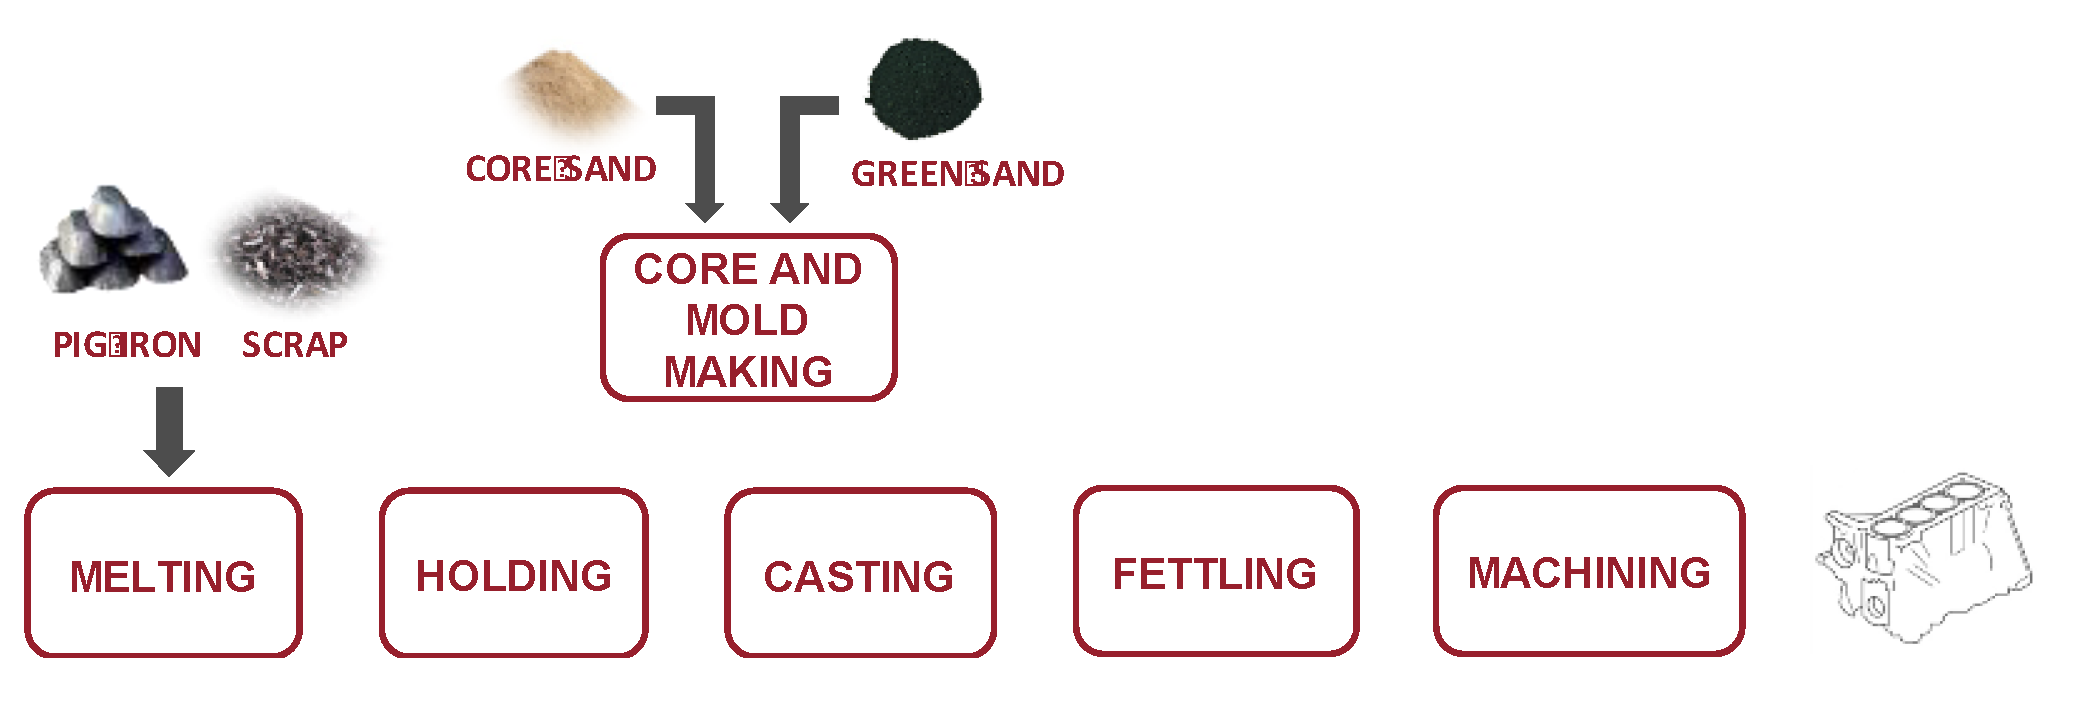
Figure 6.
Process flow for cast iron (CI) engine block manufacturing.
Figure 6.
Process flow for cast iron (CI) engine block manufacturing.
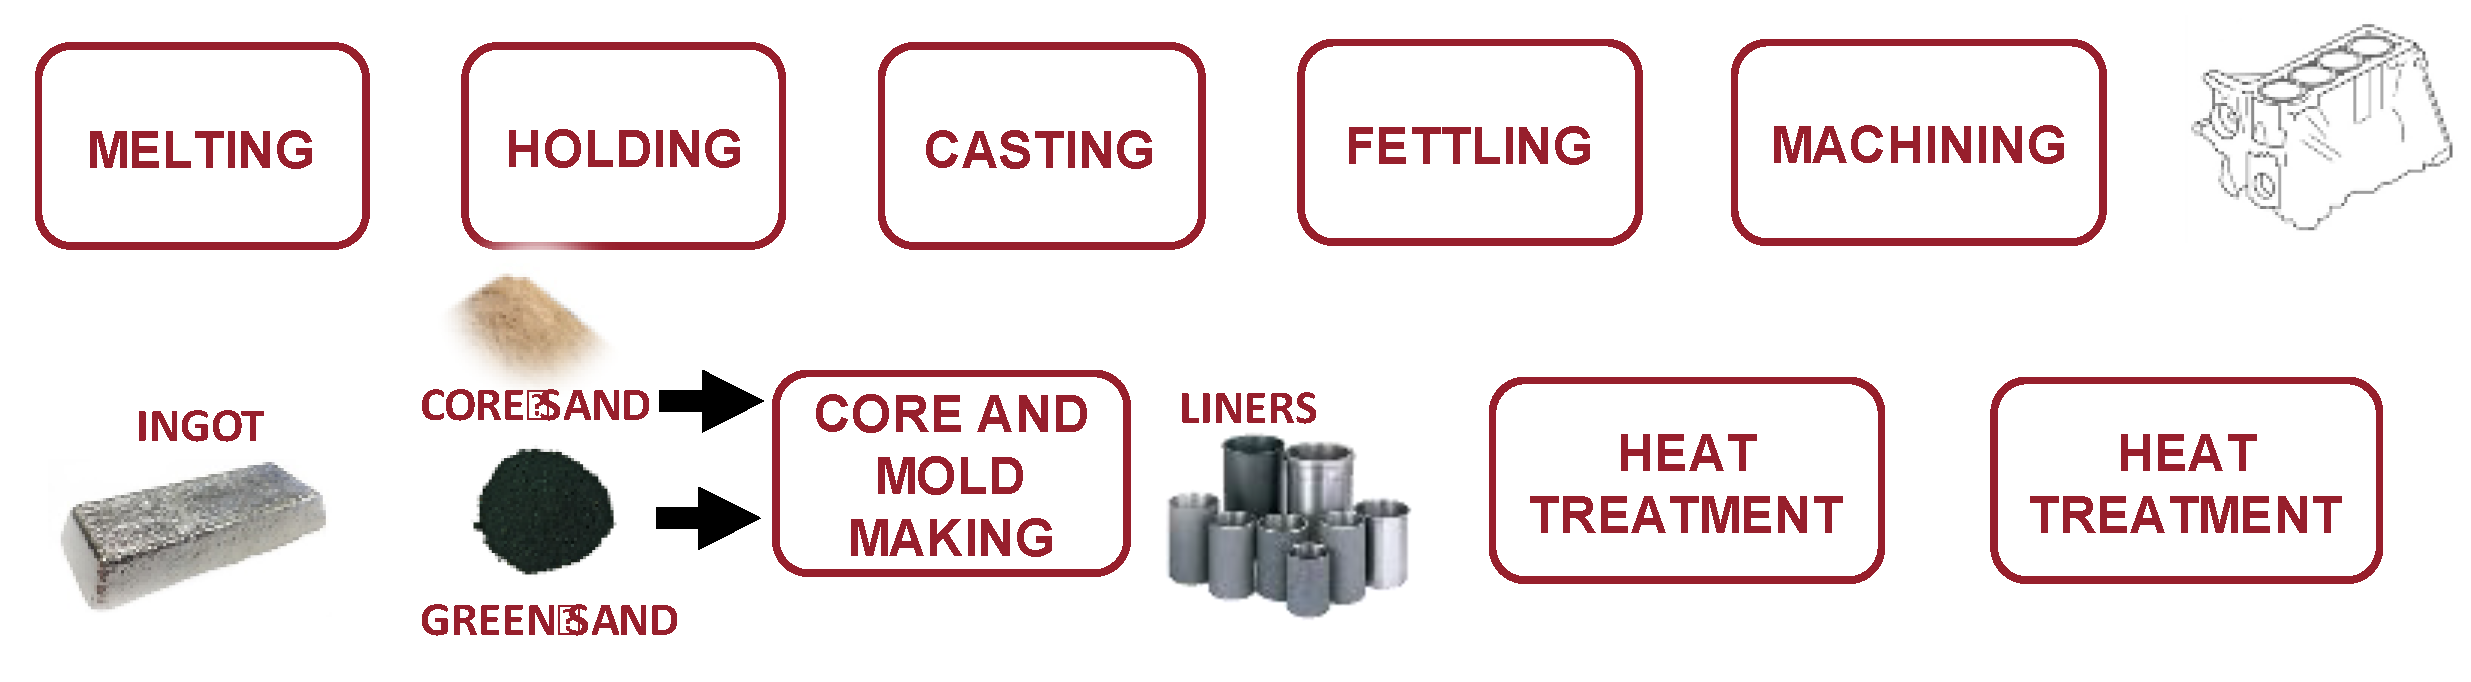
Figure 7.
Process flow for Al-alloy engine block manufacturing.
Figure 7.
Process flow for Al-alloy engine block manufacturing.
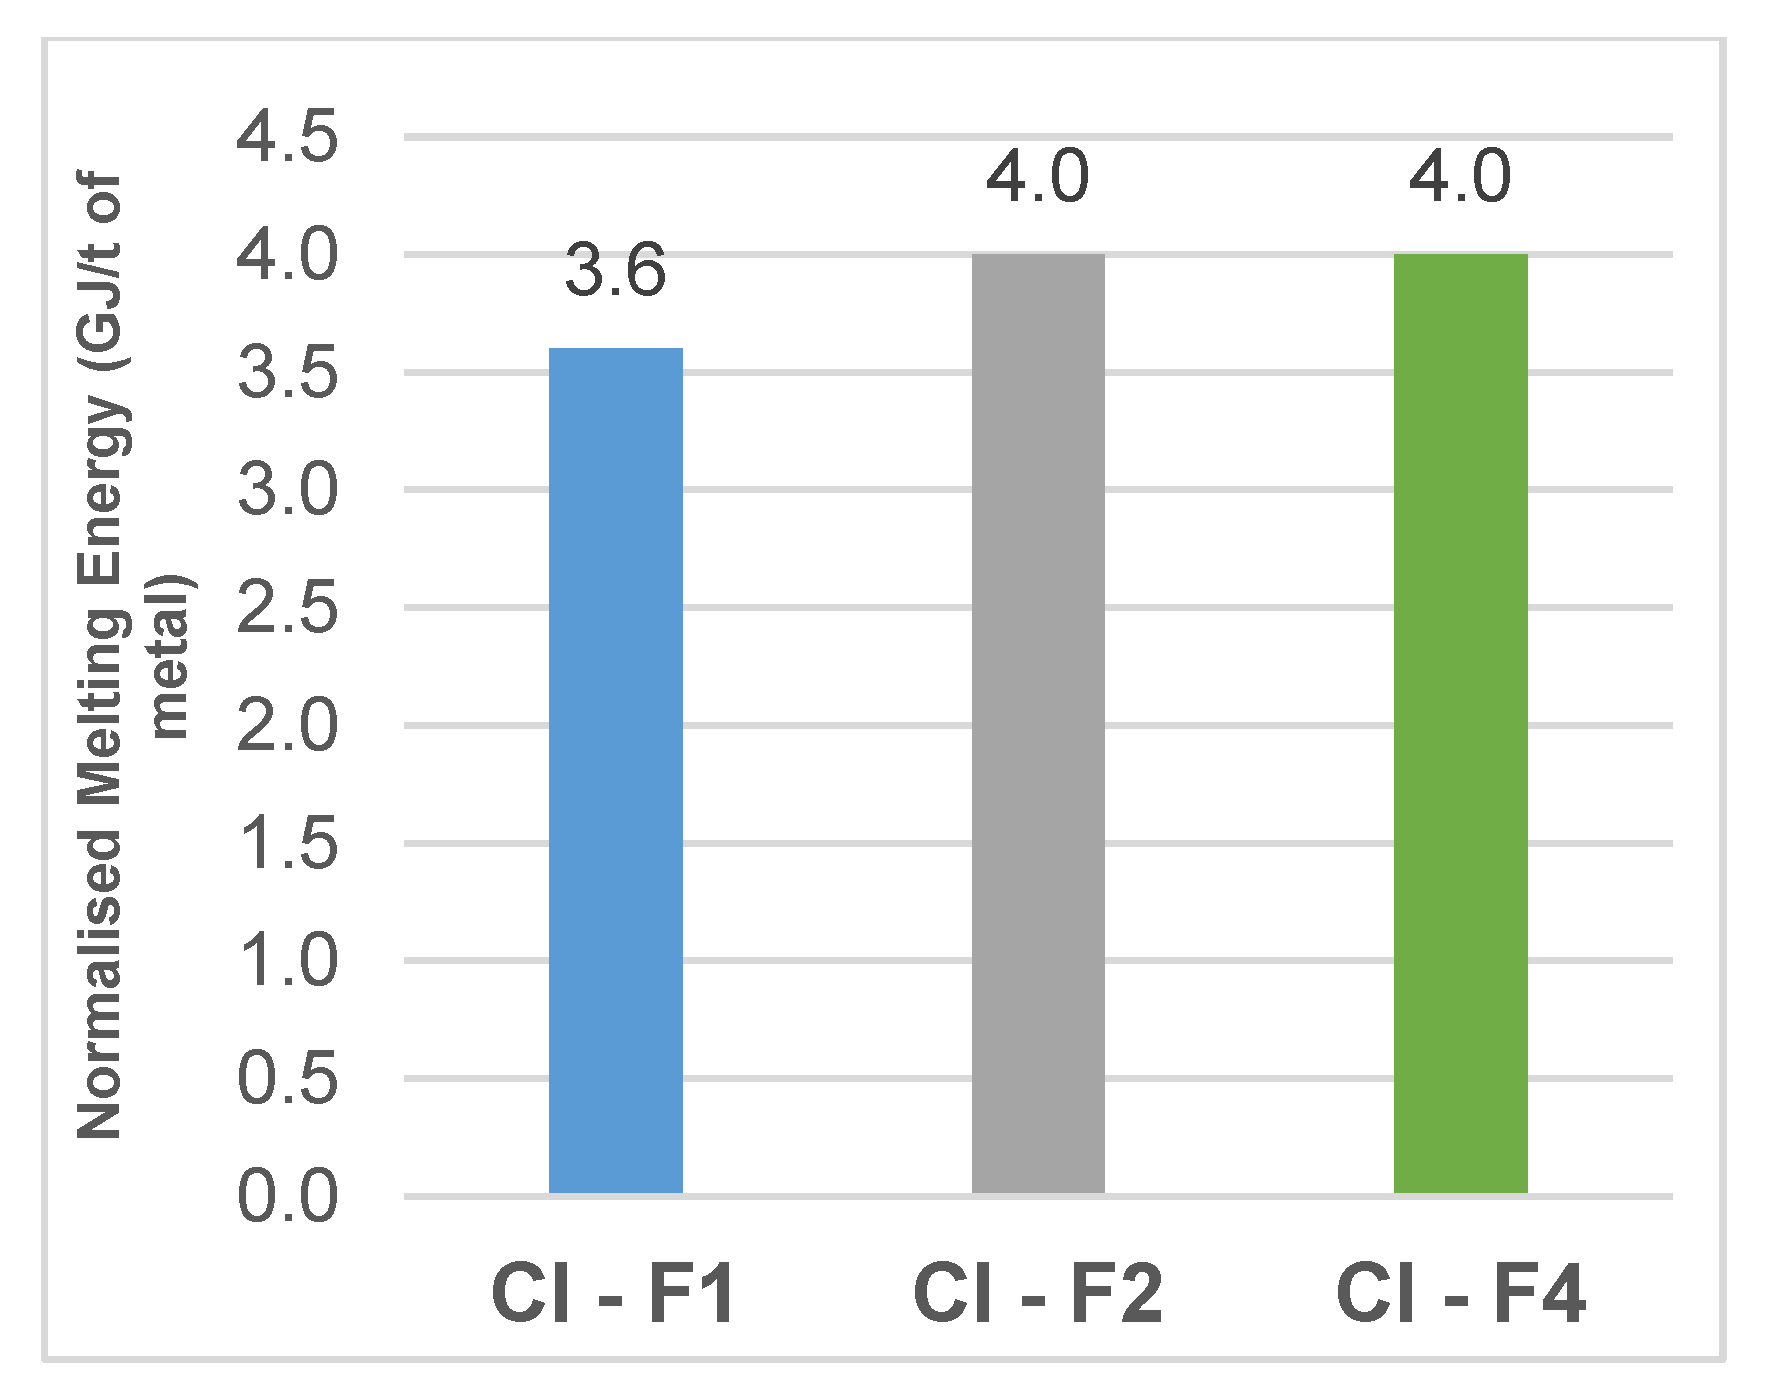
Figure 8.
Melting energy per ton of liquid metal in three different cast-iron foundries.
Figure 8.
Melting energy per ton of liquid metal in three different cast-iron foundries.
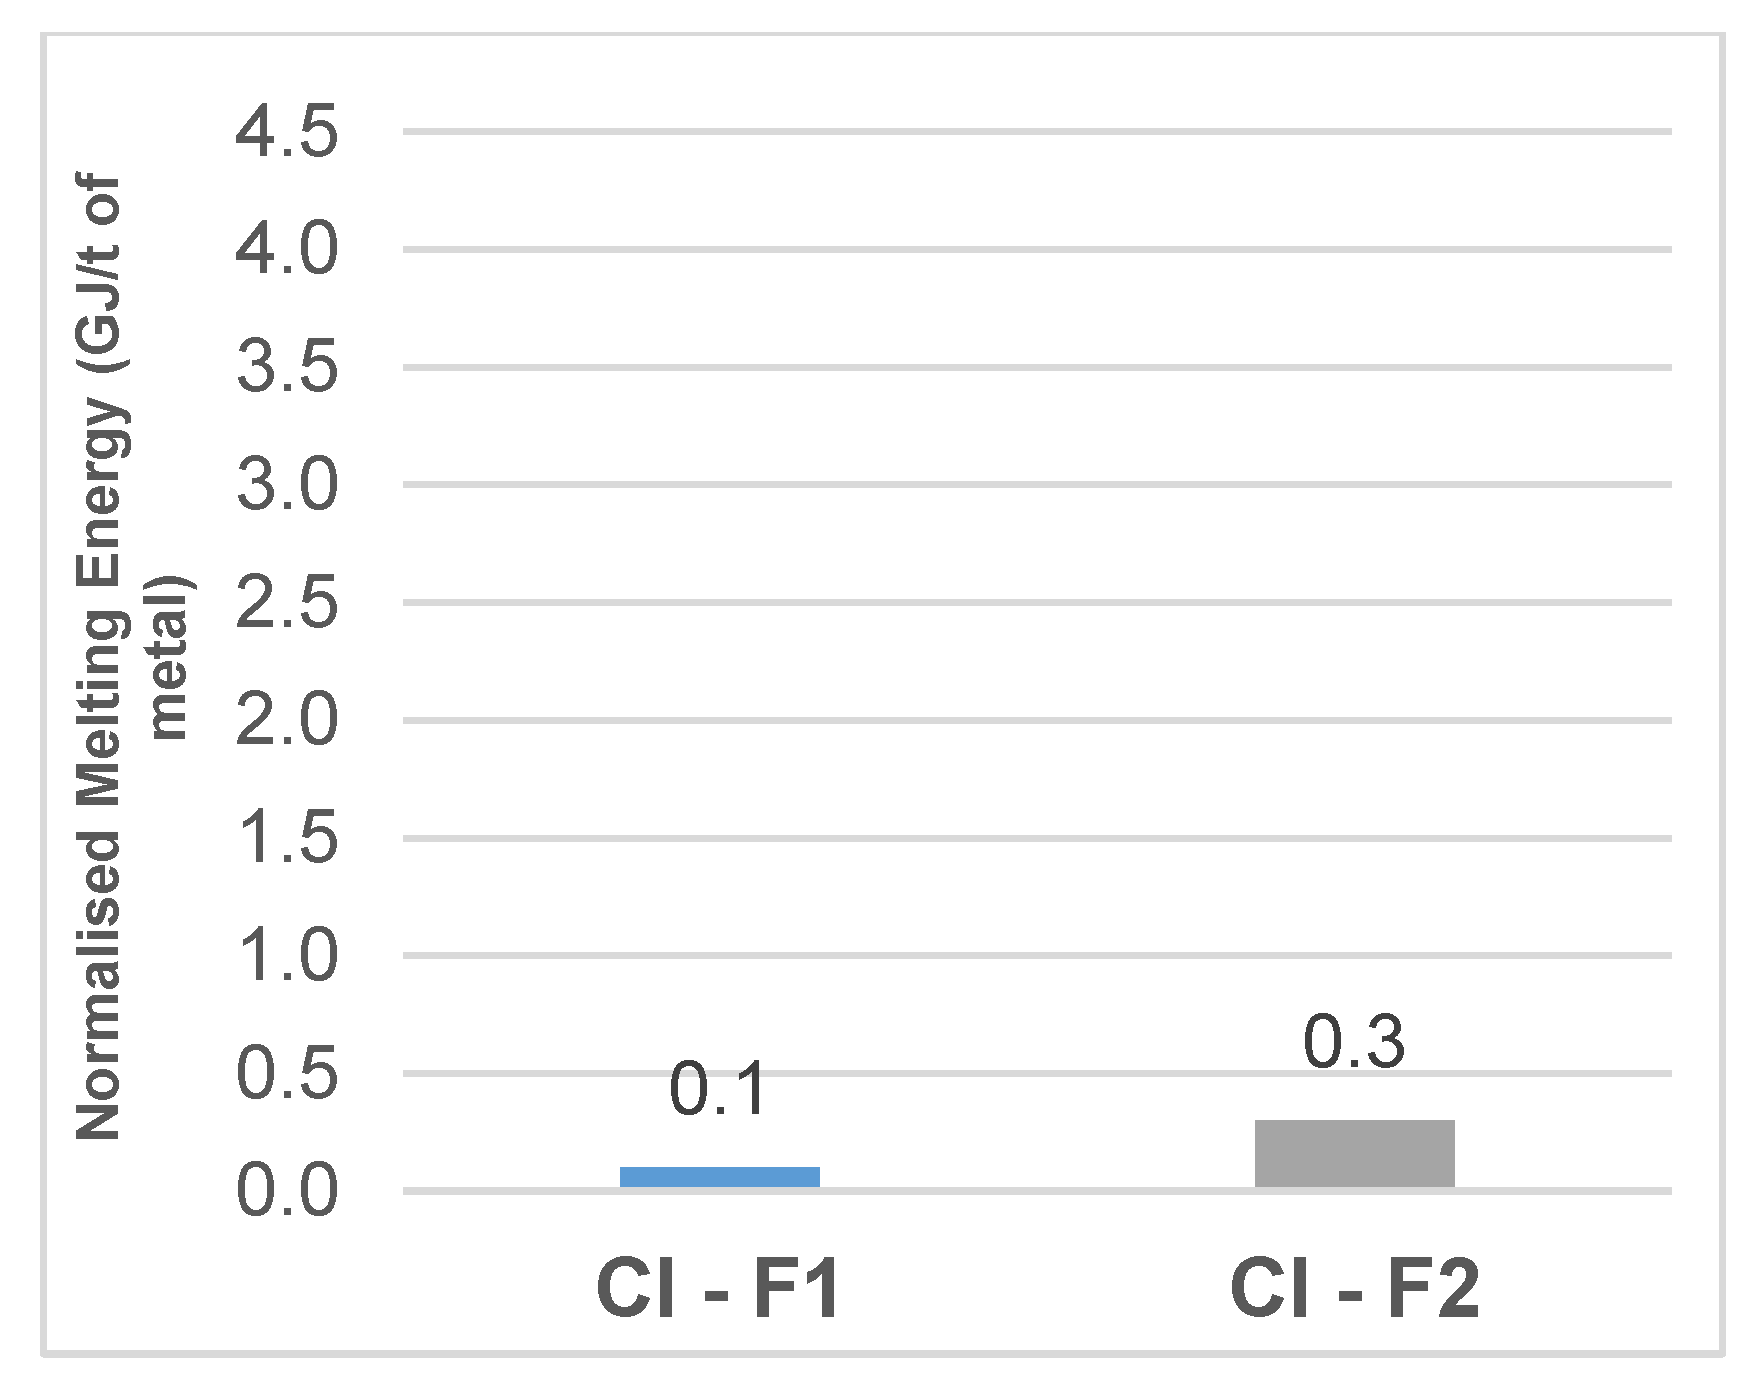
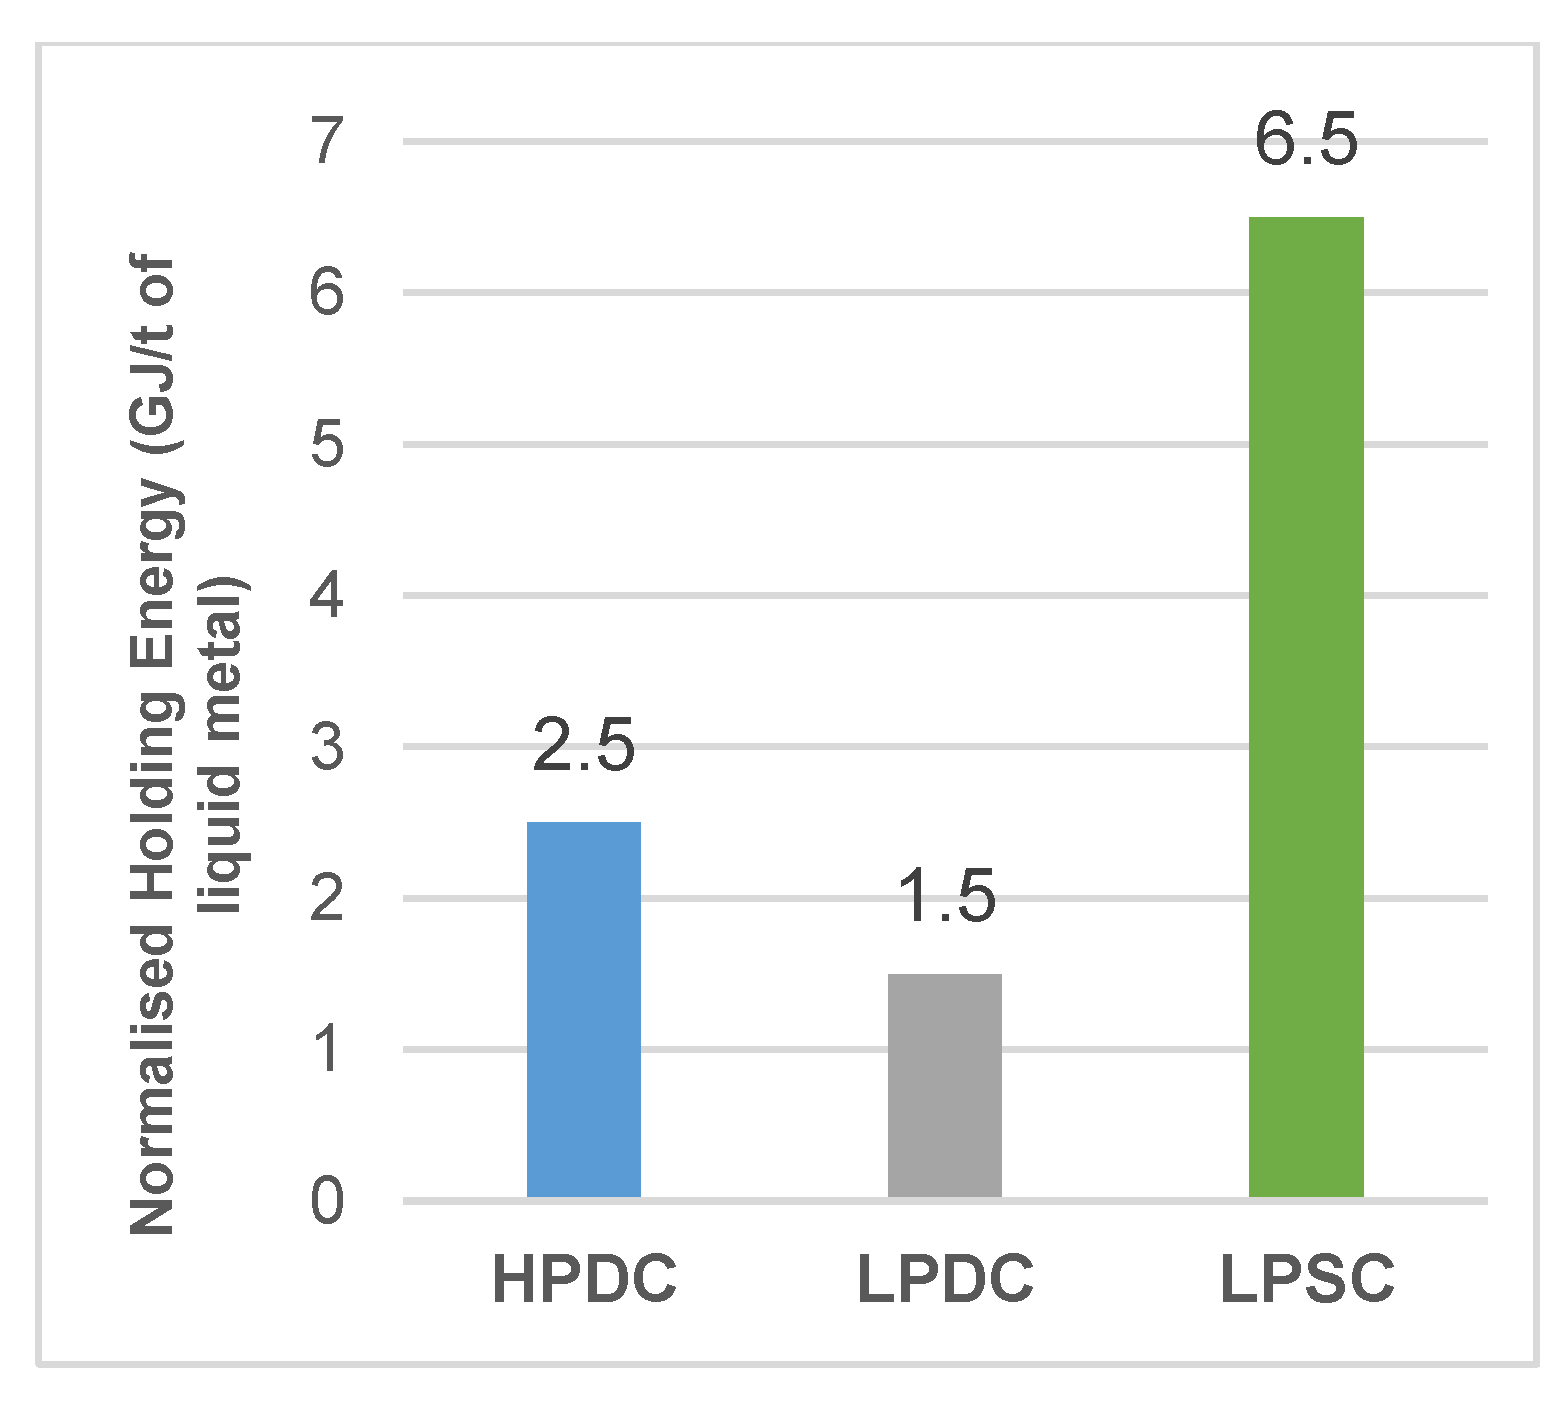
Figure 9.
Holding energy per ton of liquid metal in two different cast-iron foundries.
Figure 9.
Holding energy per ton of liquid metal in two different cast-iron foundries.
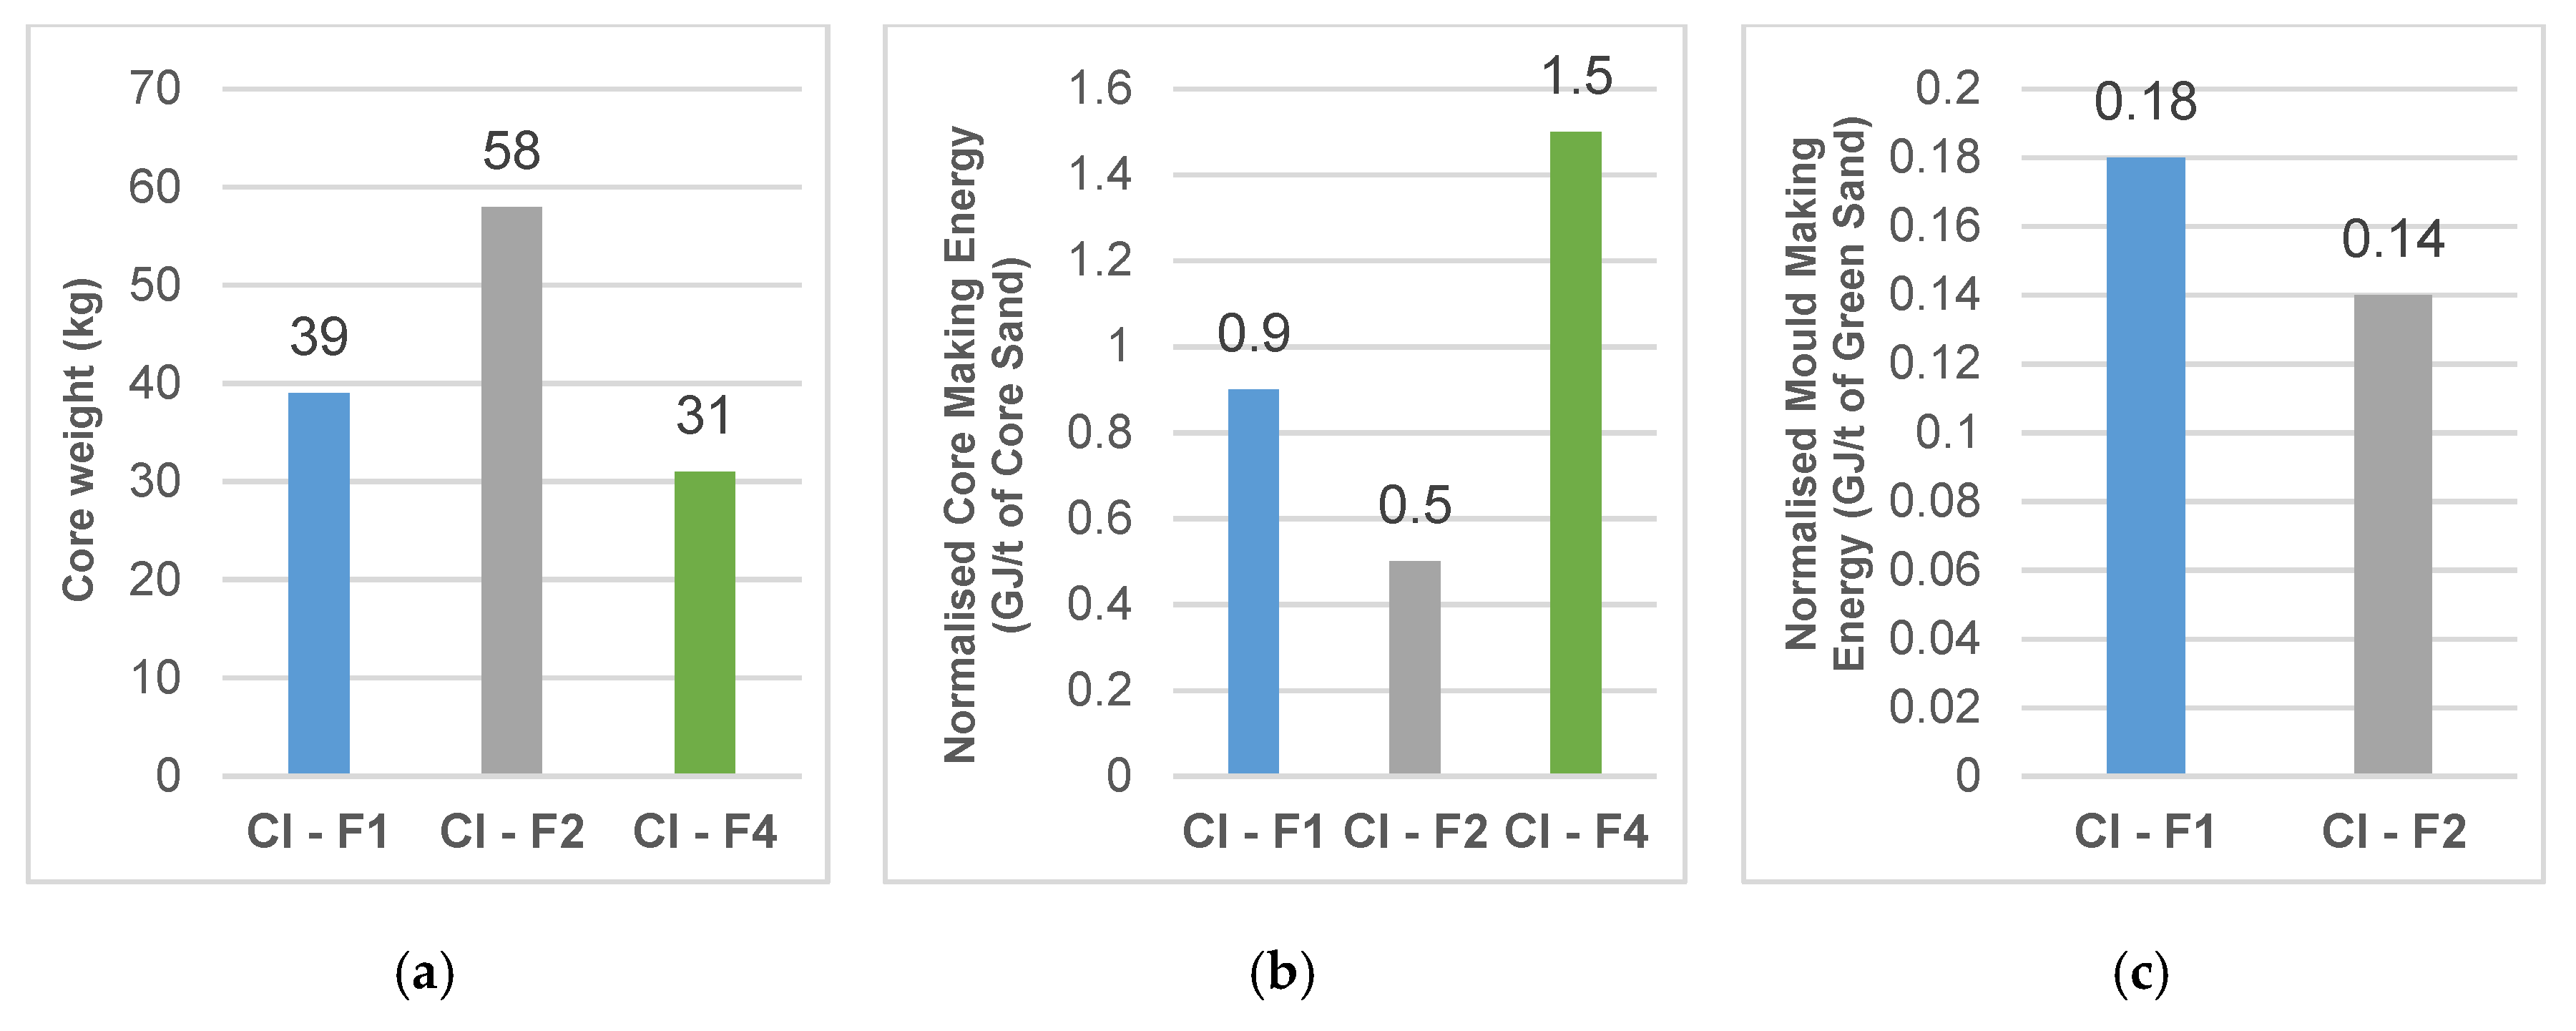
Figure 10.
Mold- and core-making: (a) core weight, (b) core-making energy, and (c) mold-making energy.
Figure 10.
Mold- and core-making: (a) core weight, (b) core-making energy, and (c) mold-making energy.
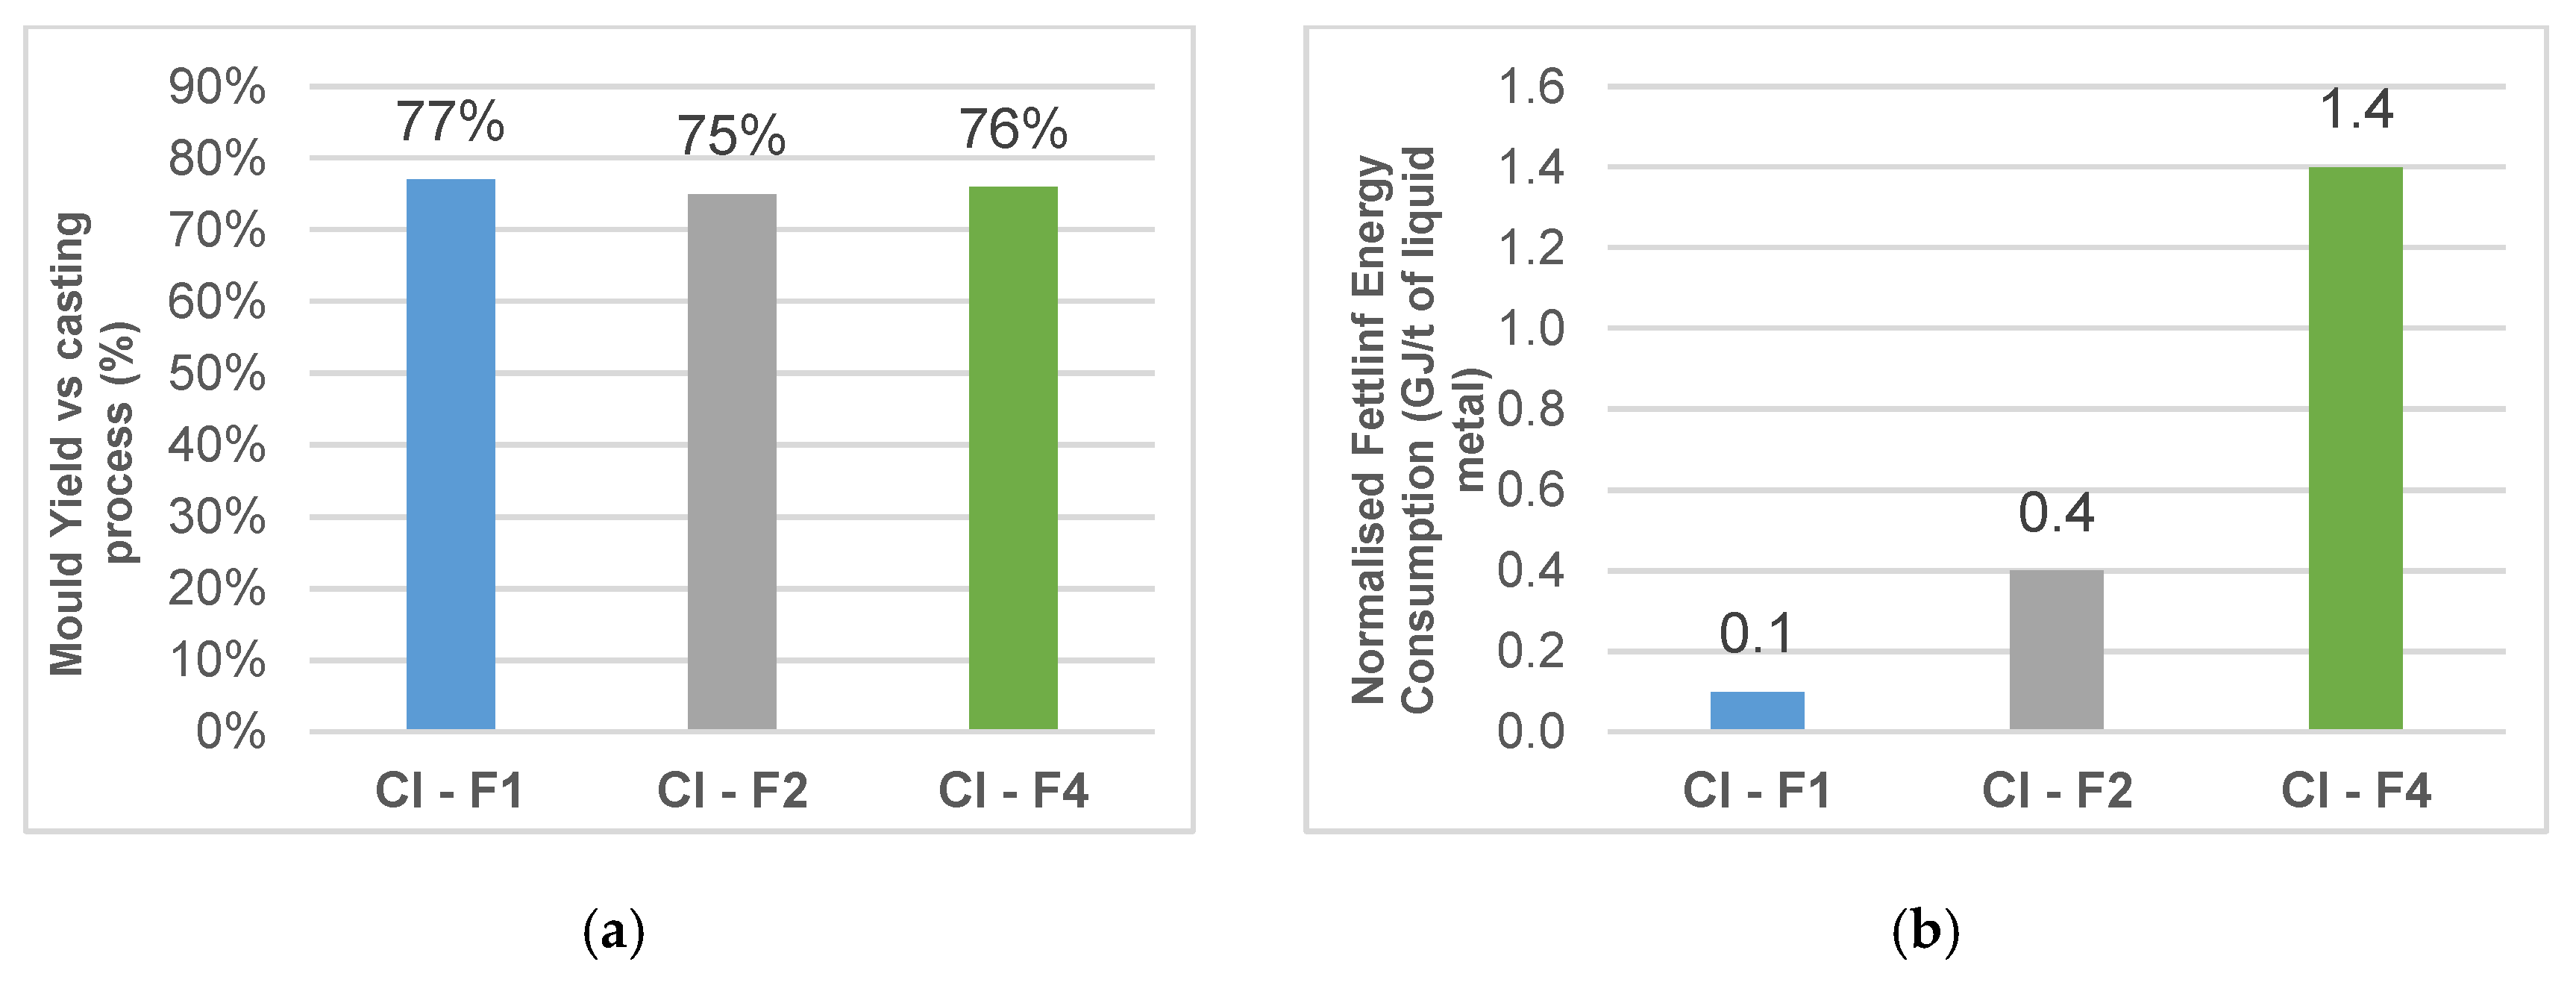
Figure 11.
Fettling process: (a) mold yield in different casting processes; (b) fettling energy consumption.
Figure 11.
Fettling process: (a) mold yield in different casting processes; (b) fettling energy consumption.
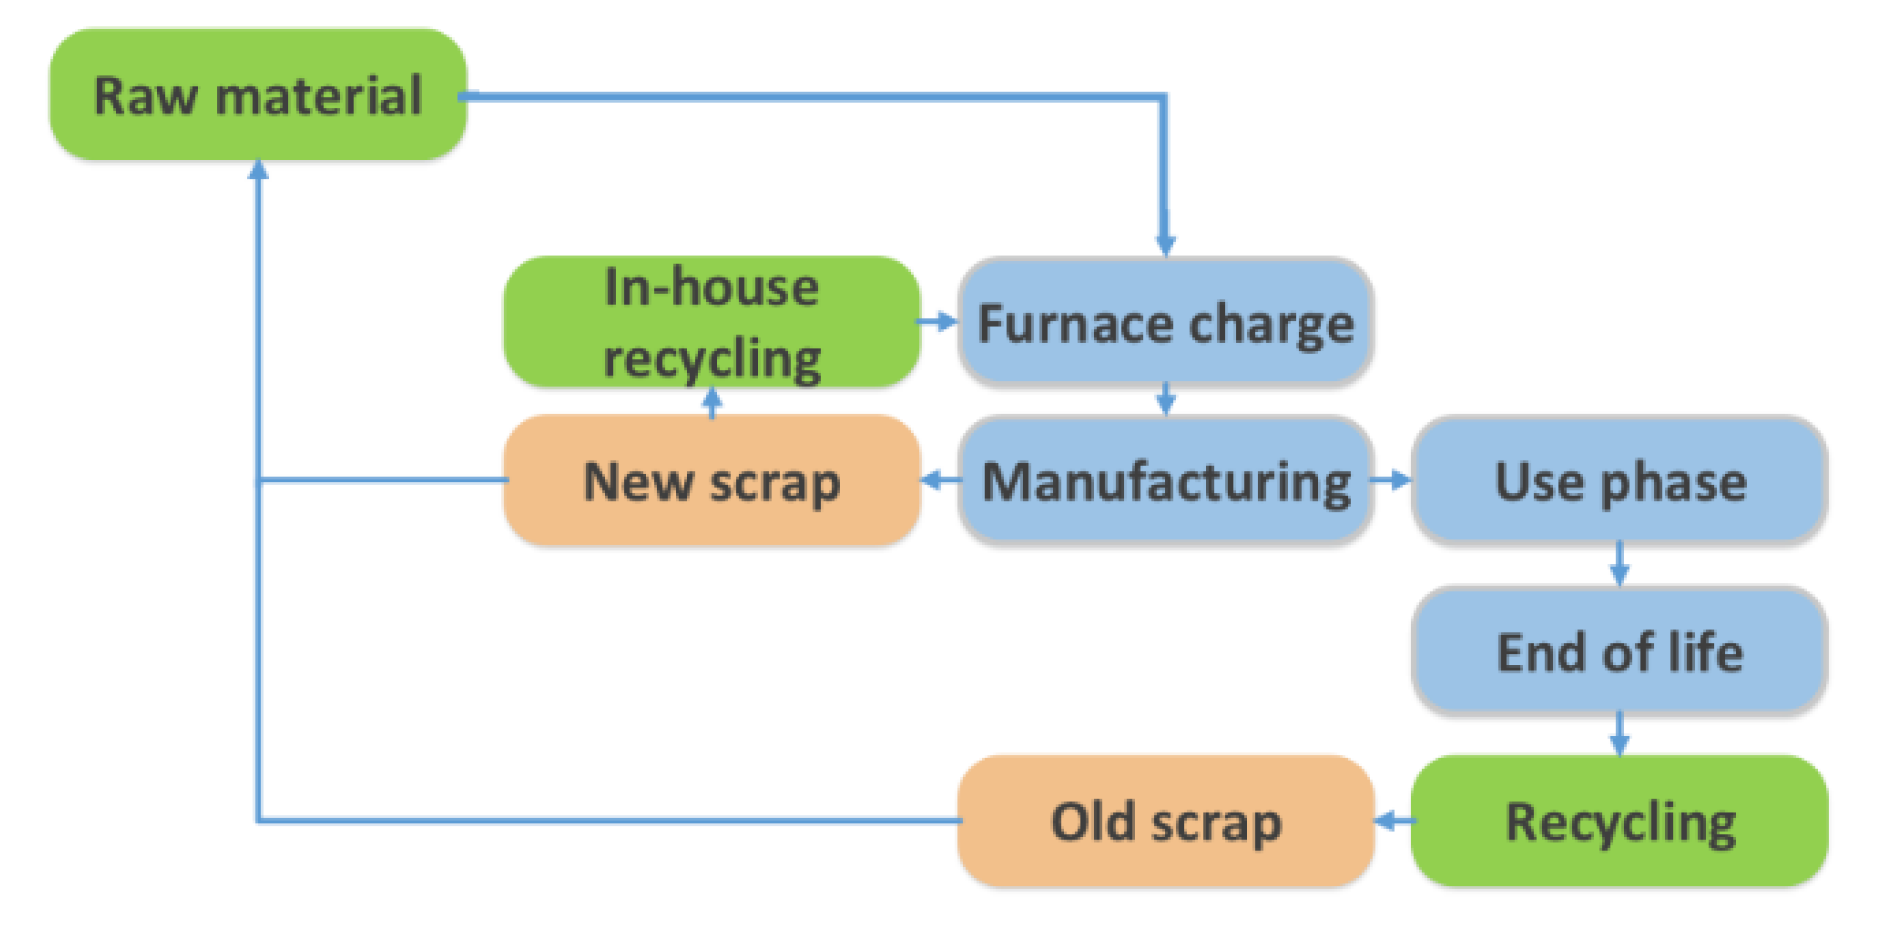
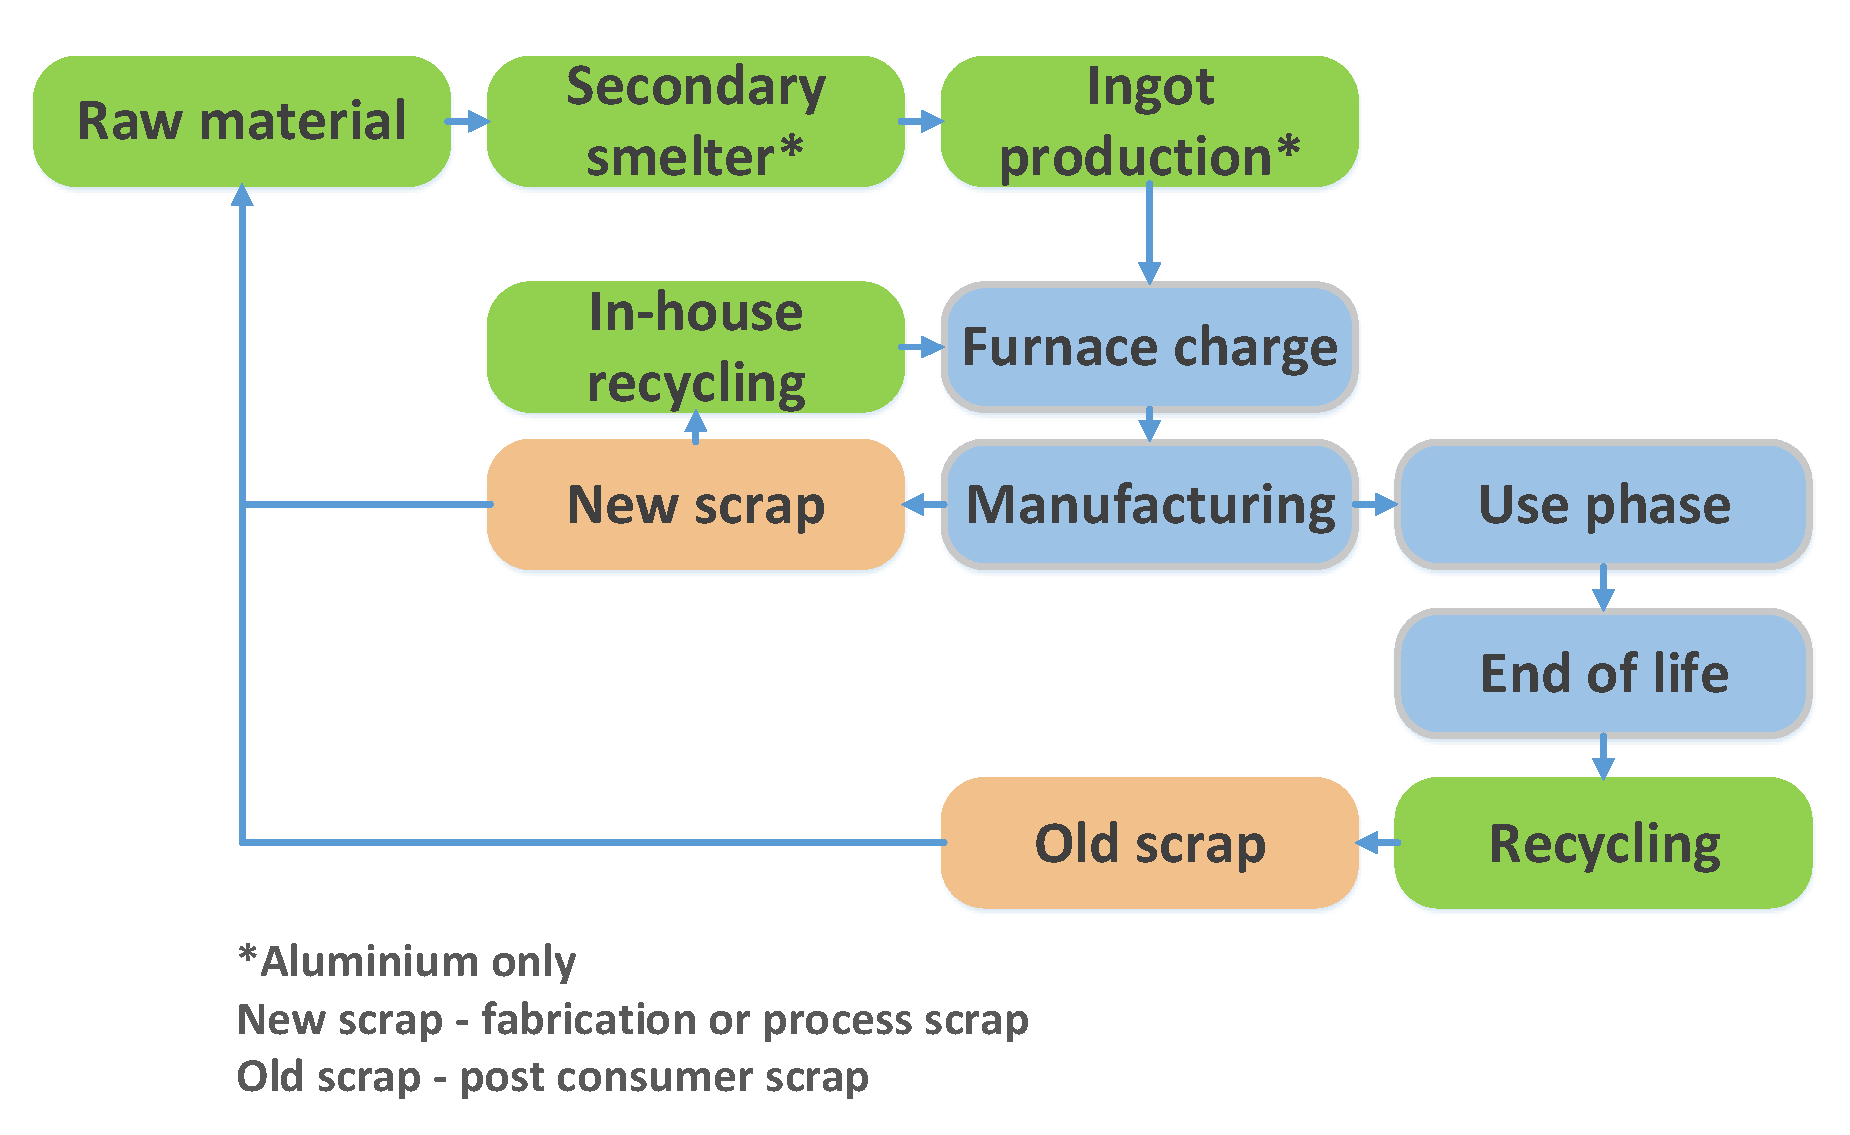
Figure 12.
Material flow diagram of the recycling.
Figure 12.
Material flow diagram of the recycling.
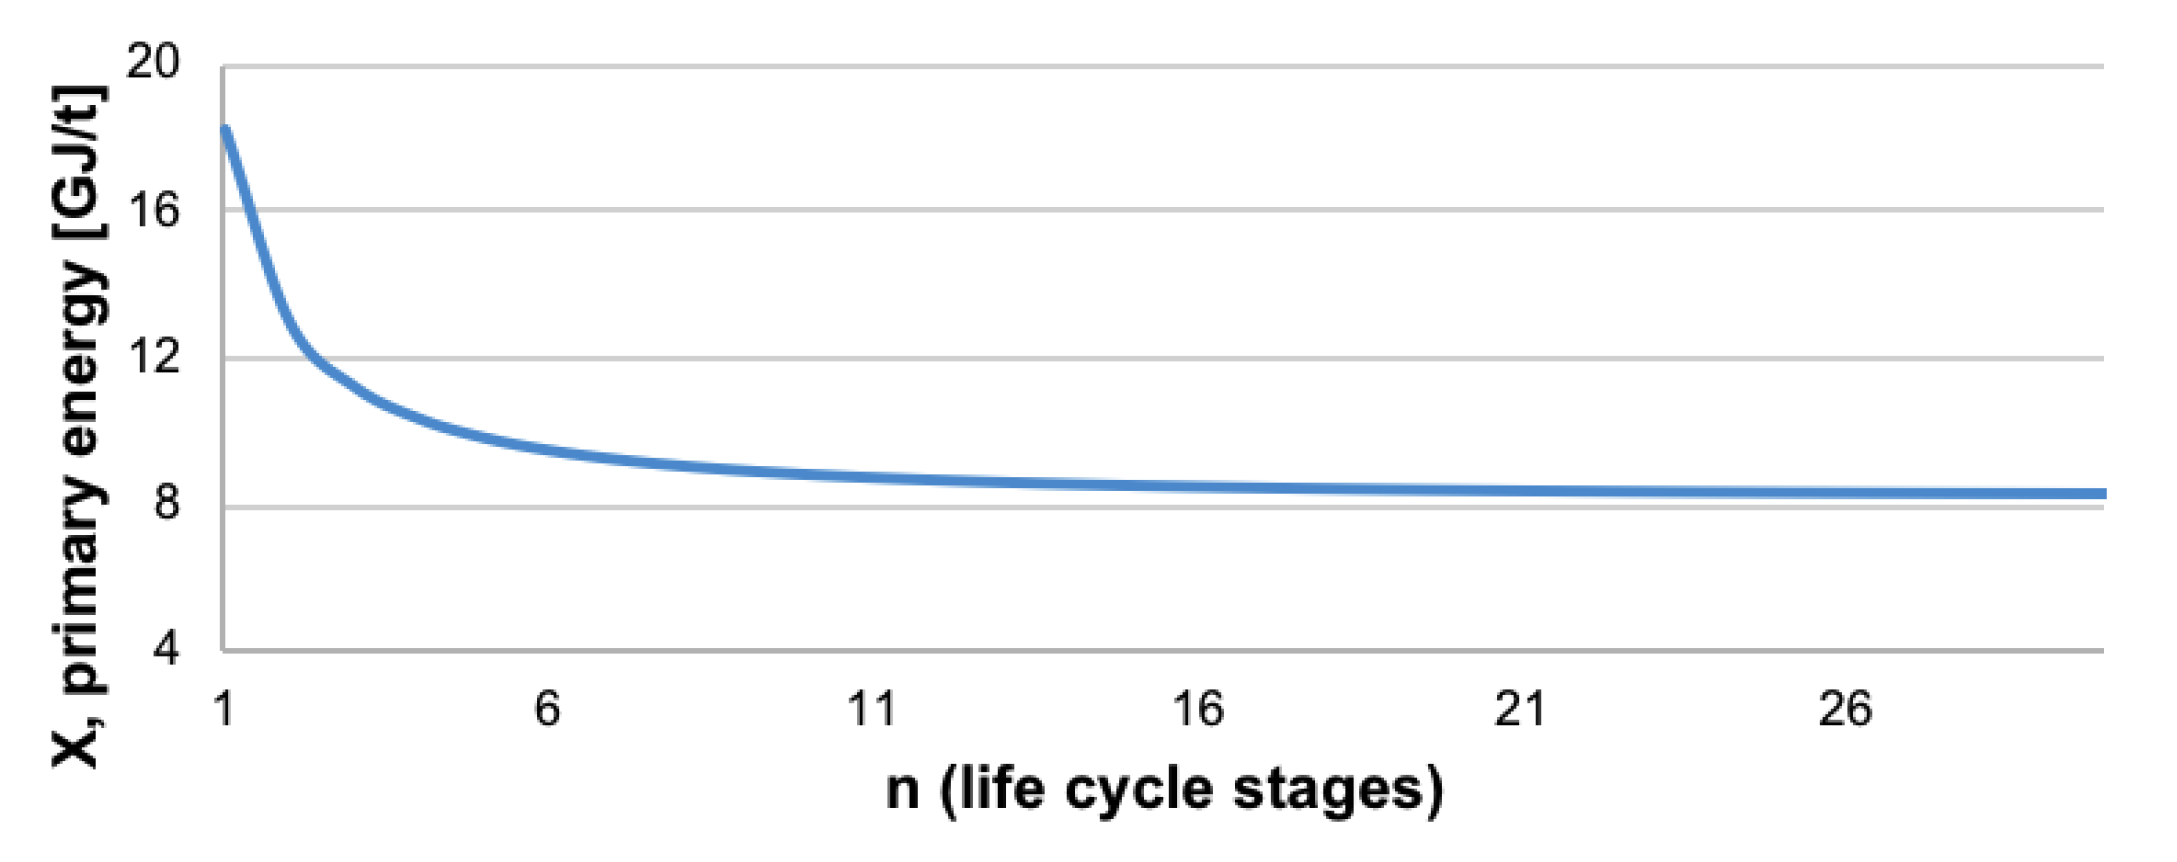
Figure 13.
Steel scrap embodied energy (X = 8.2) for electric arc furnace (EAF) recycling route.
Figure 13.
Steel scrap embodied energy (X = 8.2) for electric arc furnace (EAF) recycling route.
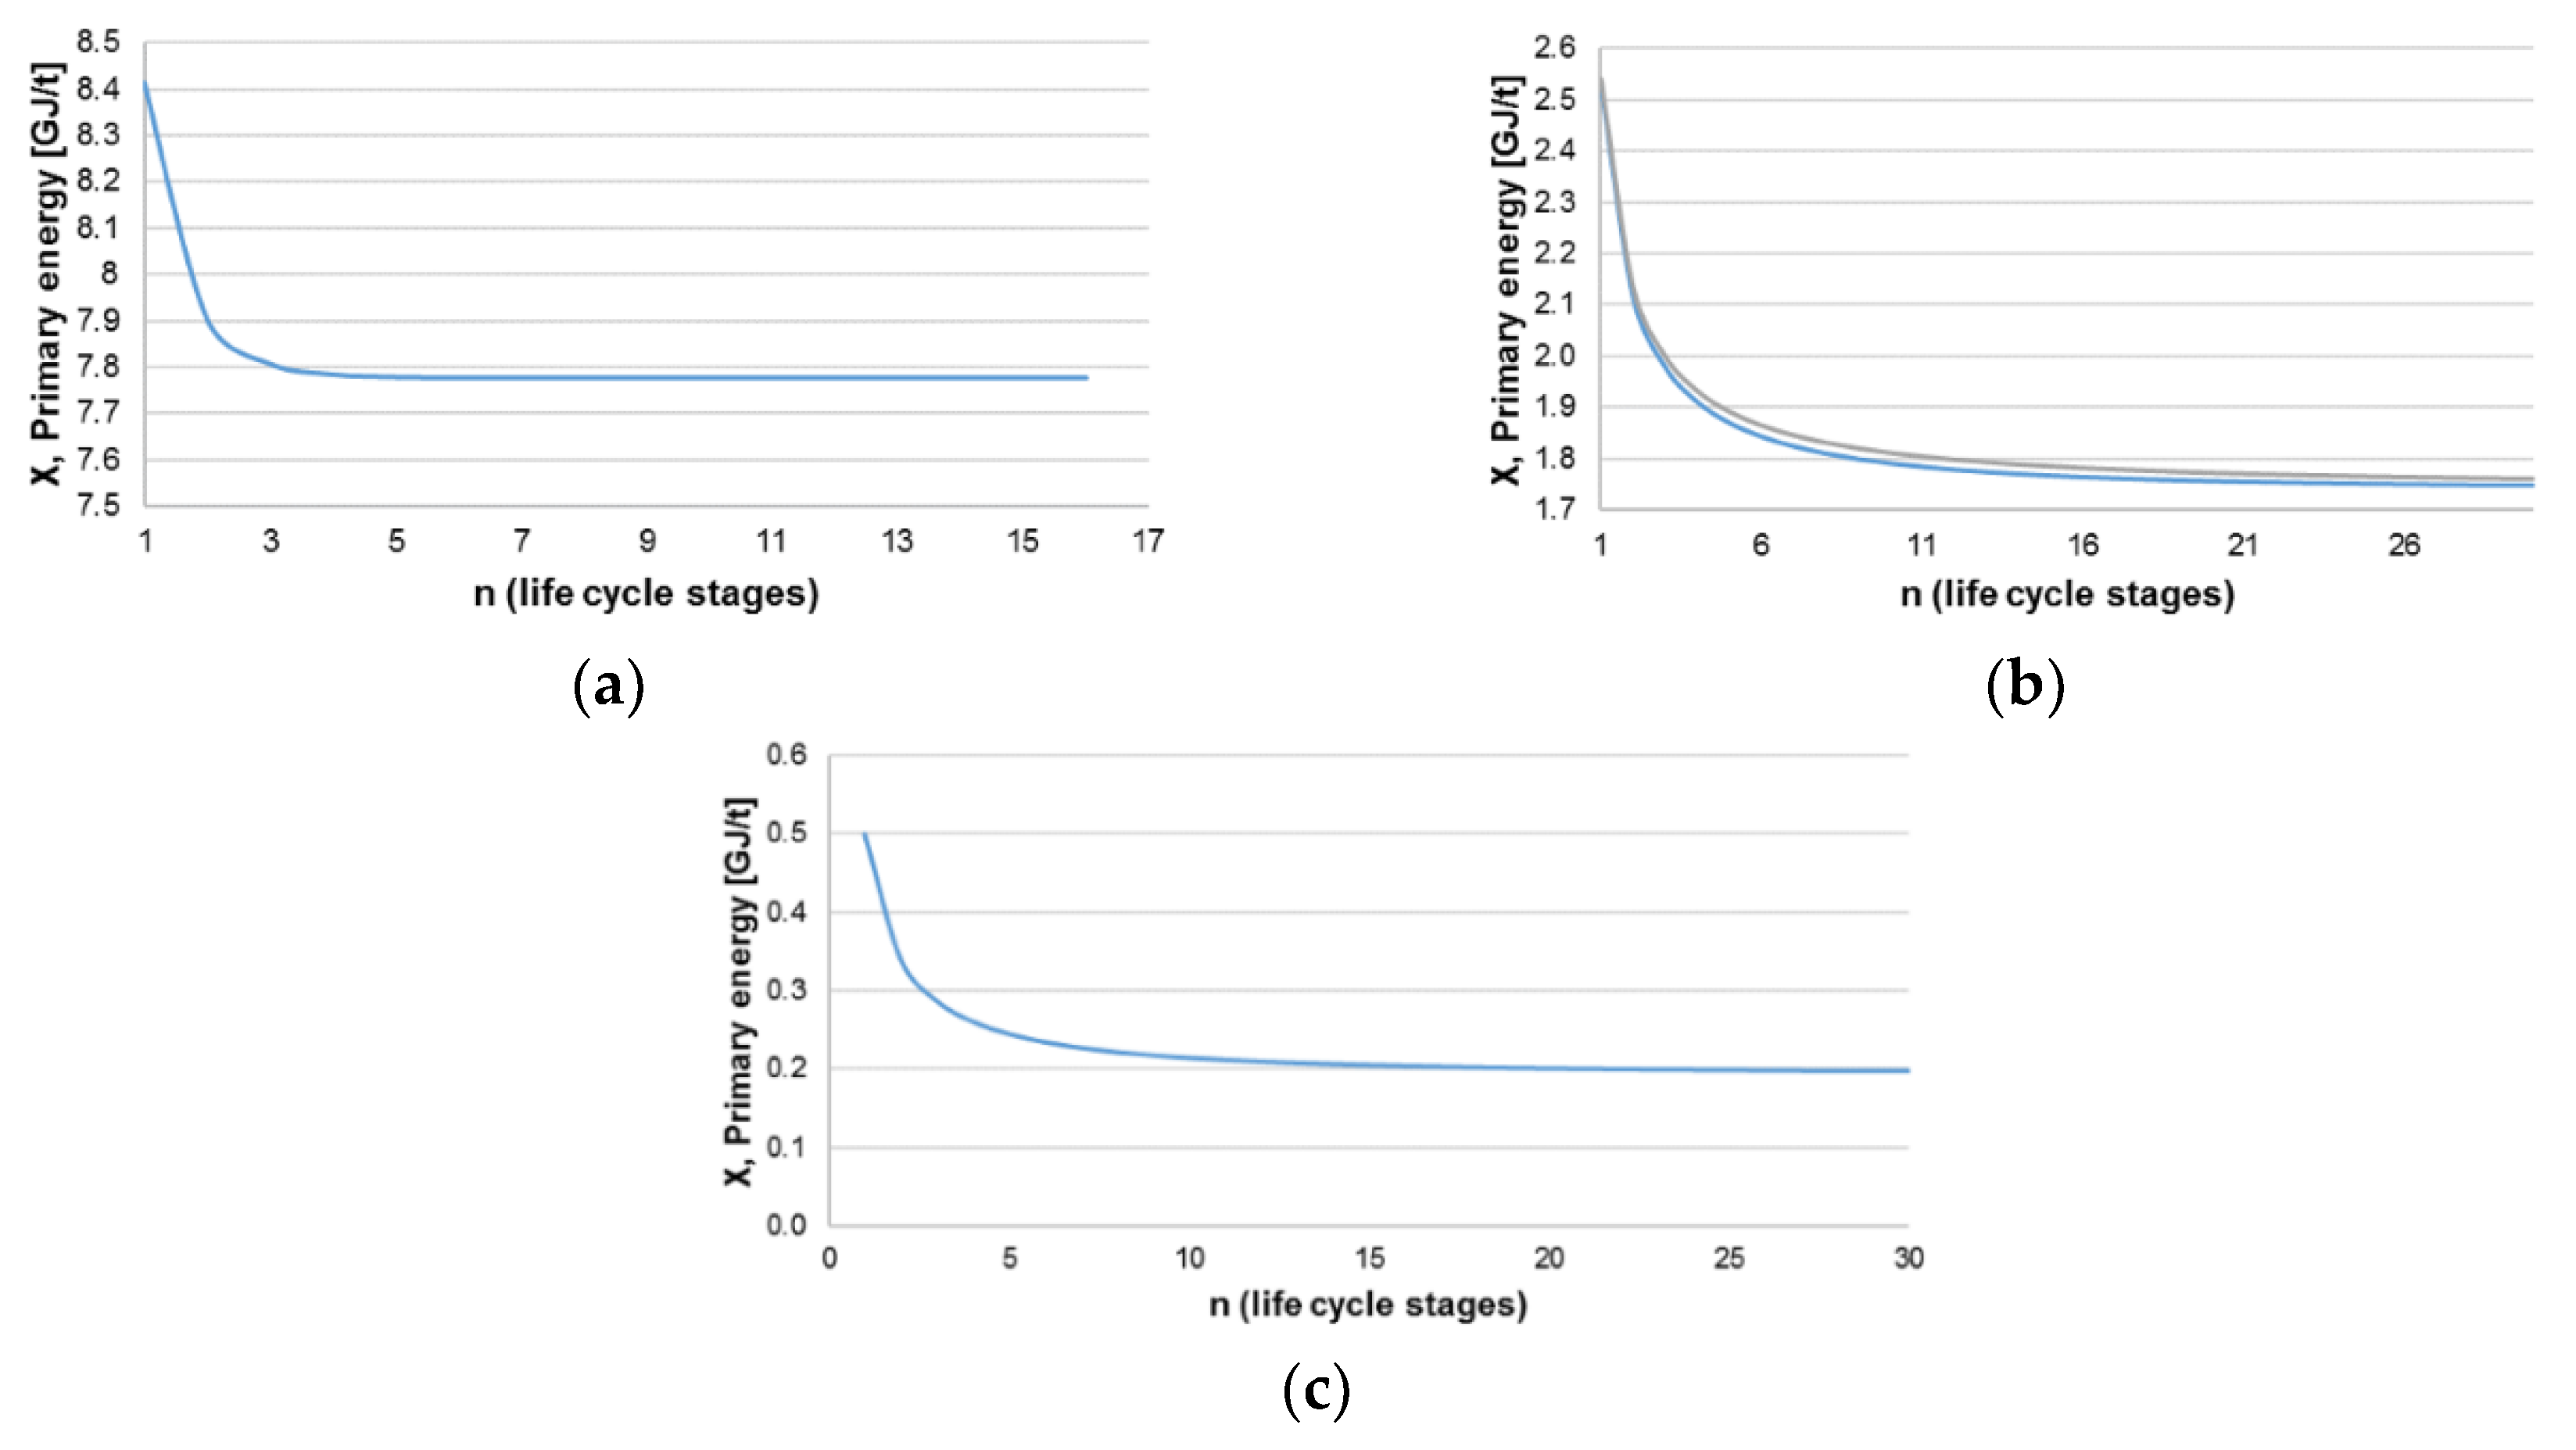
Figure 14.
(a) Energy embodied in metal collected from the production stage and re-melted in-house in the cast-iron foundries (assumed 2% of the embodied energy for pig iron addition), (b) energy embodied in core sand after reclamation process, and (c) energy embodied in green sand for its multiple reuse.
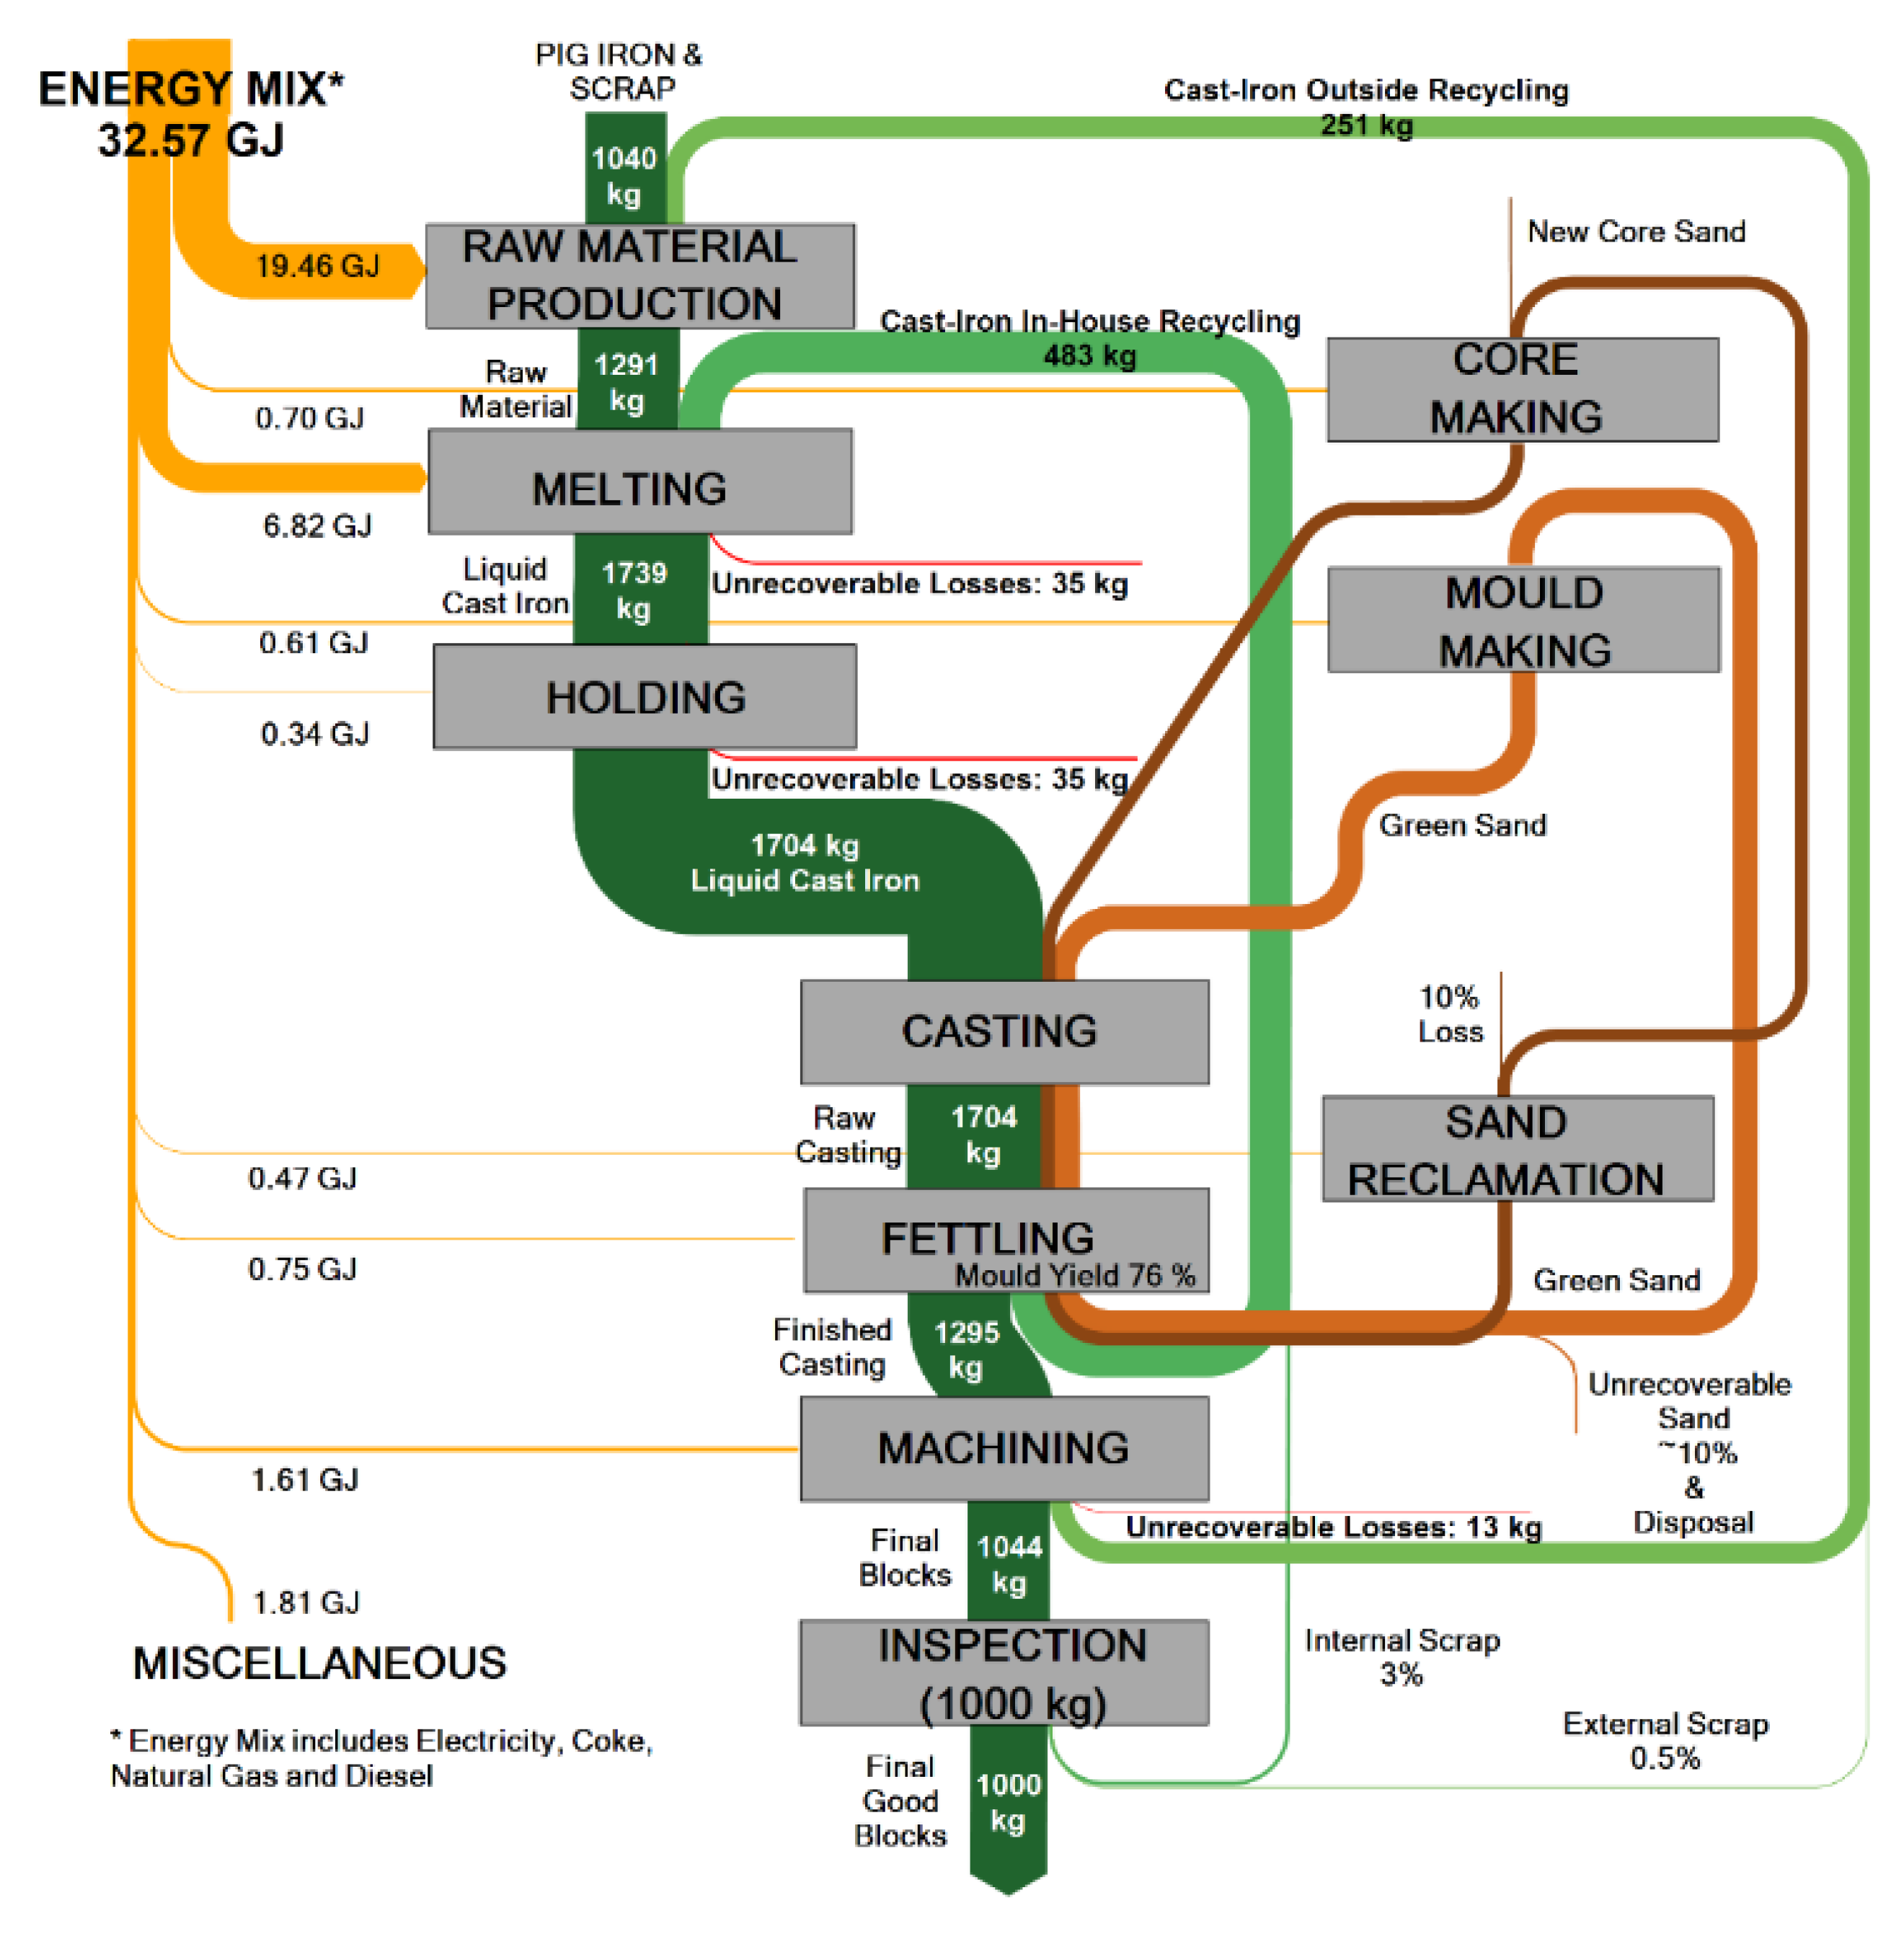
Figure 15.
Energy and material flow in CI sand casting, showing that 1000 kg of good castings require the melting of 1739 kg of CI and 32.57 GJ.
Figure 15.
Energy and material flow in CI sand casting, showing that 1000 kg of good castings require the melting of 1739 kg of CI and 32.57 GJ.
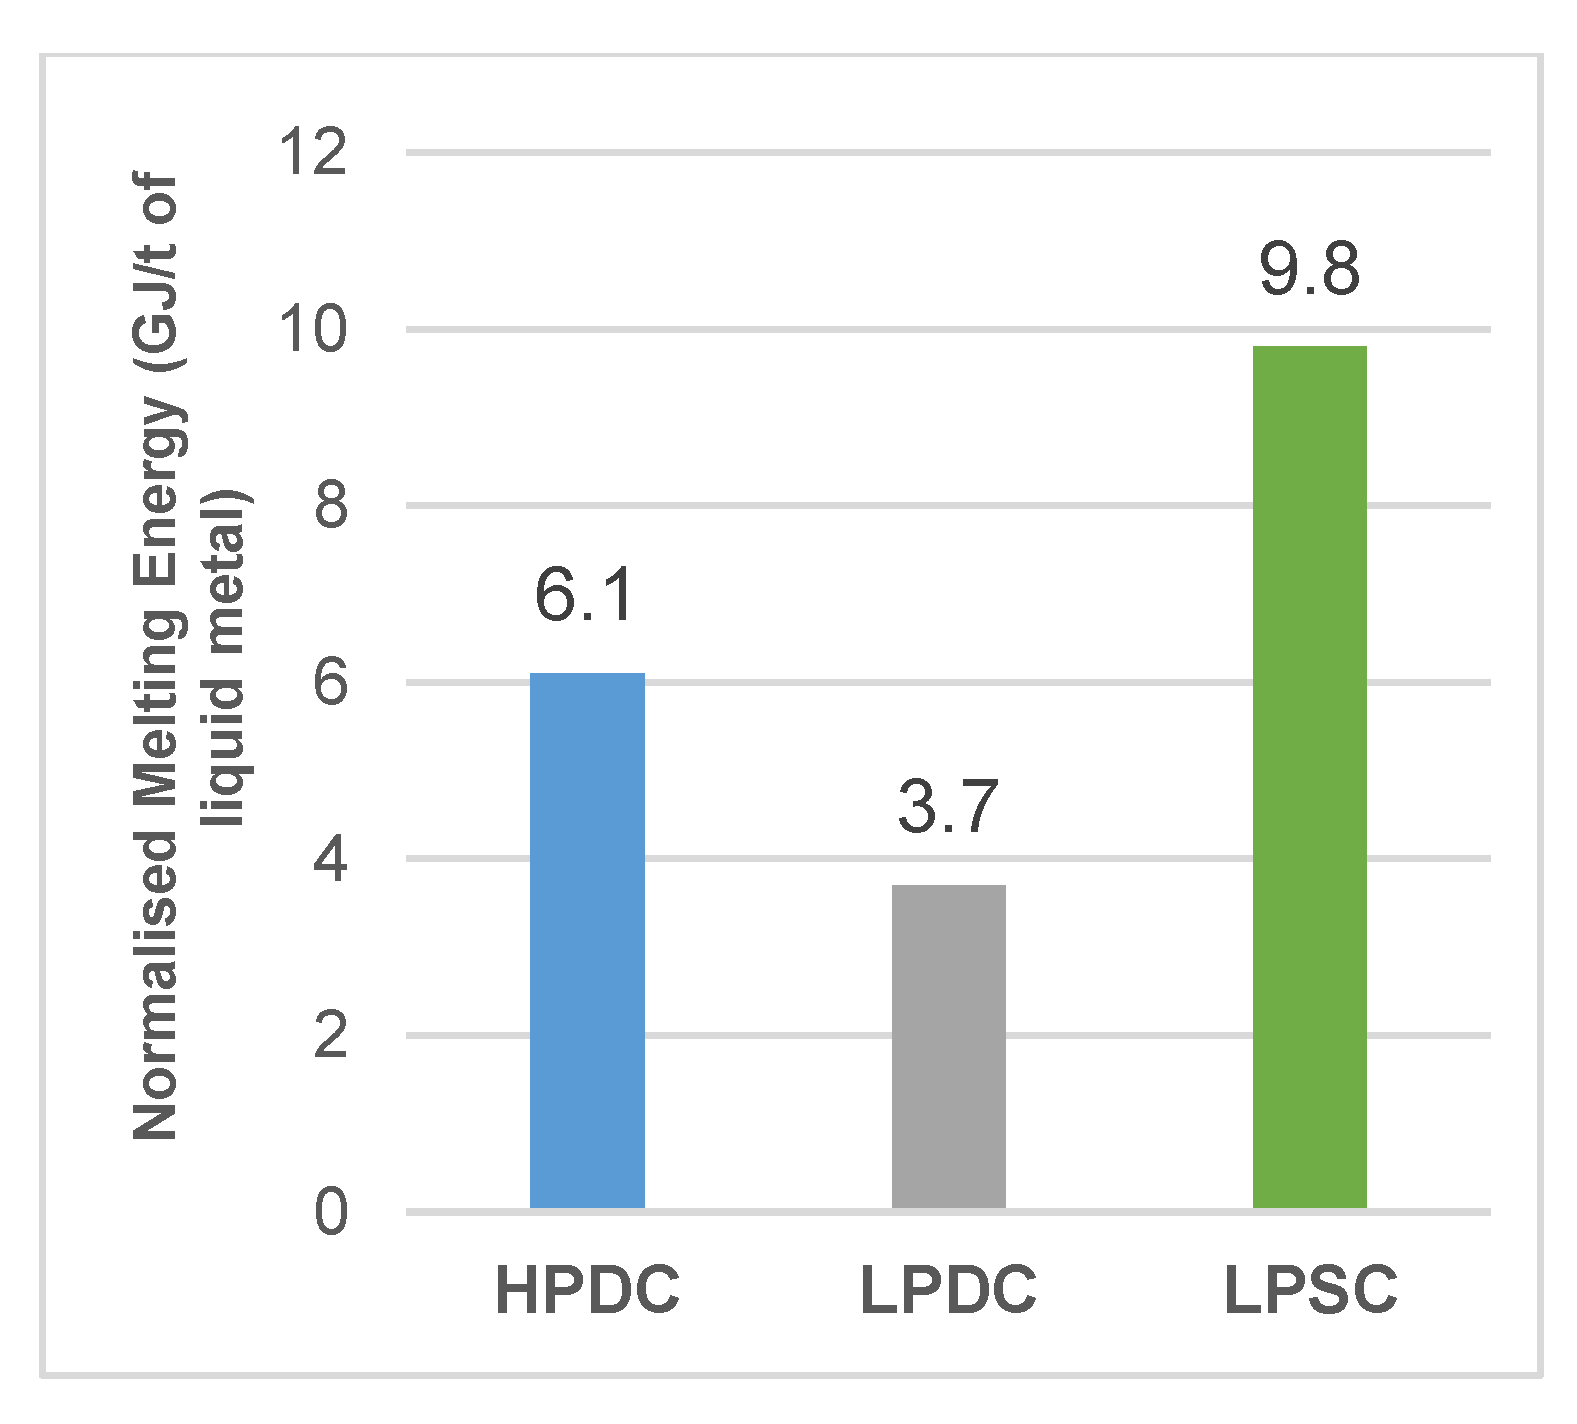
Figure 16.
Melting energy per ton of liquid metal in three different Al foundries.
Figure 16.
Melting energy per ton of liquid metal in three different Al foundries.
Figure 17.
Holding energy per ton of liquid metal in three different Al foundries.
Figure 17.
Holding energy per ton of liquid metal in three different Al foundries.
Figure 18.
Material flow diagram of the recycling.
Figure 18.
Material flow diagram of the recycling.
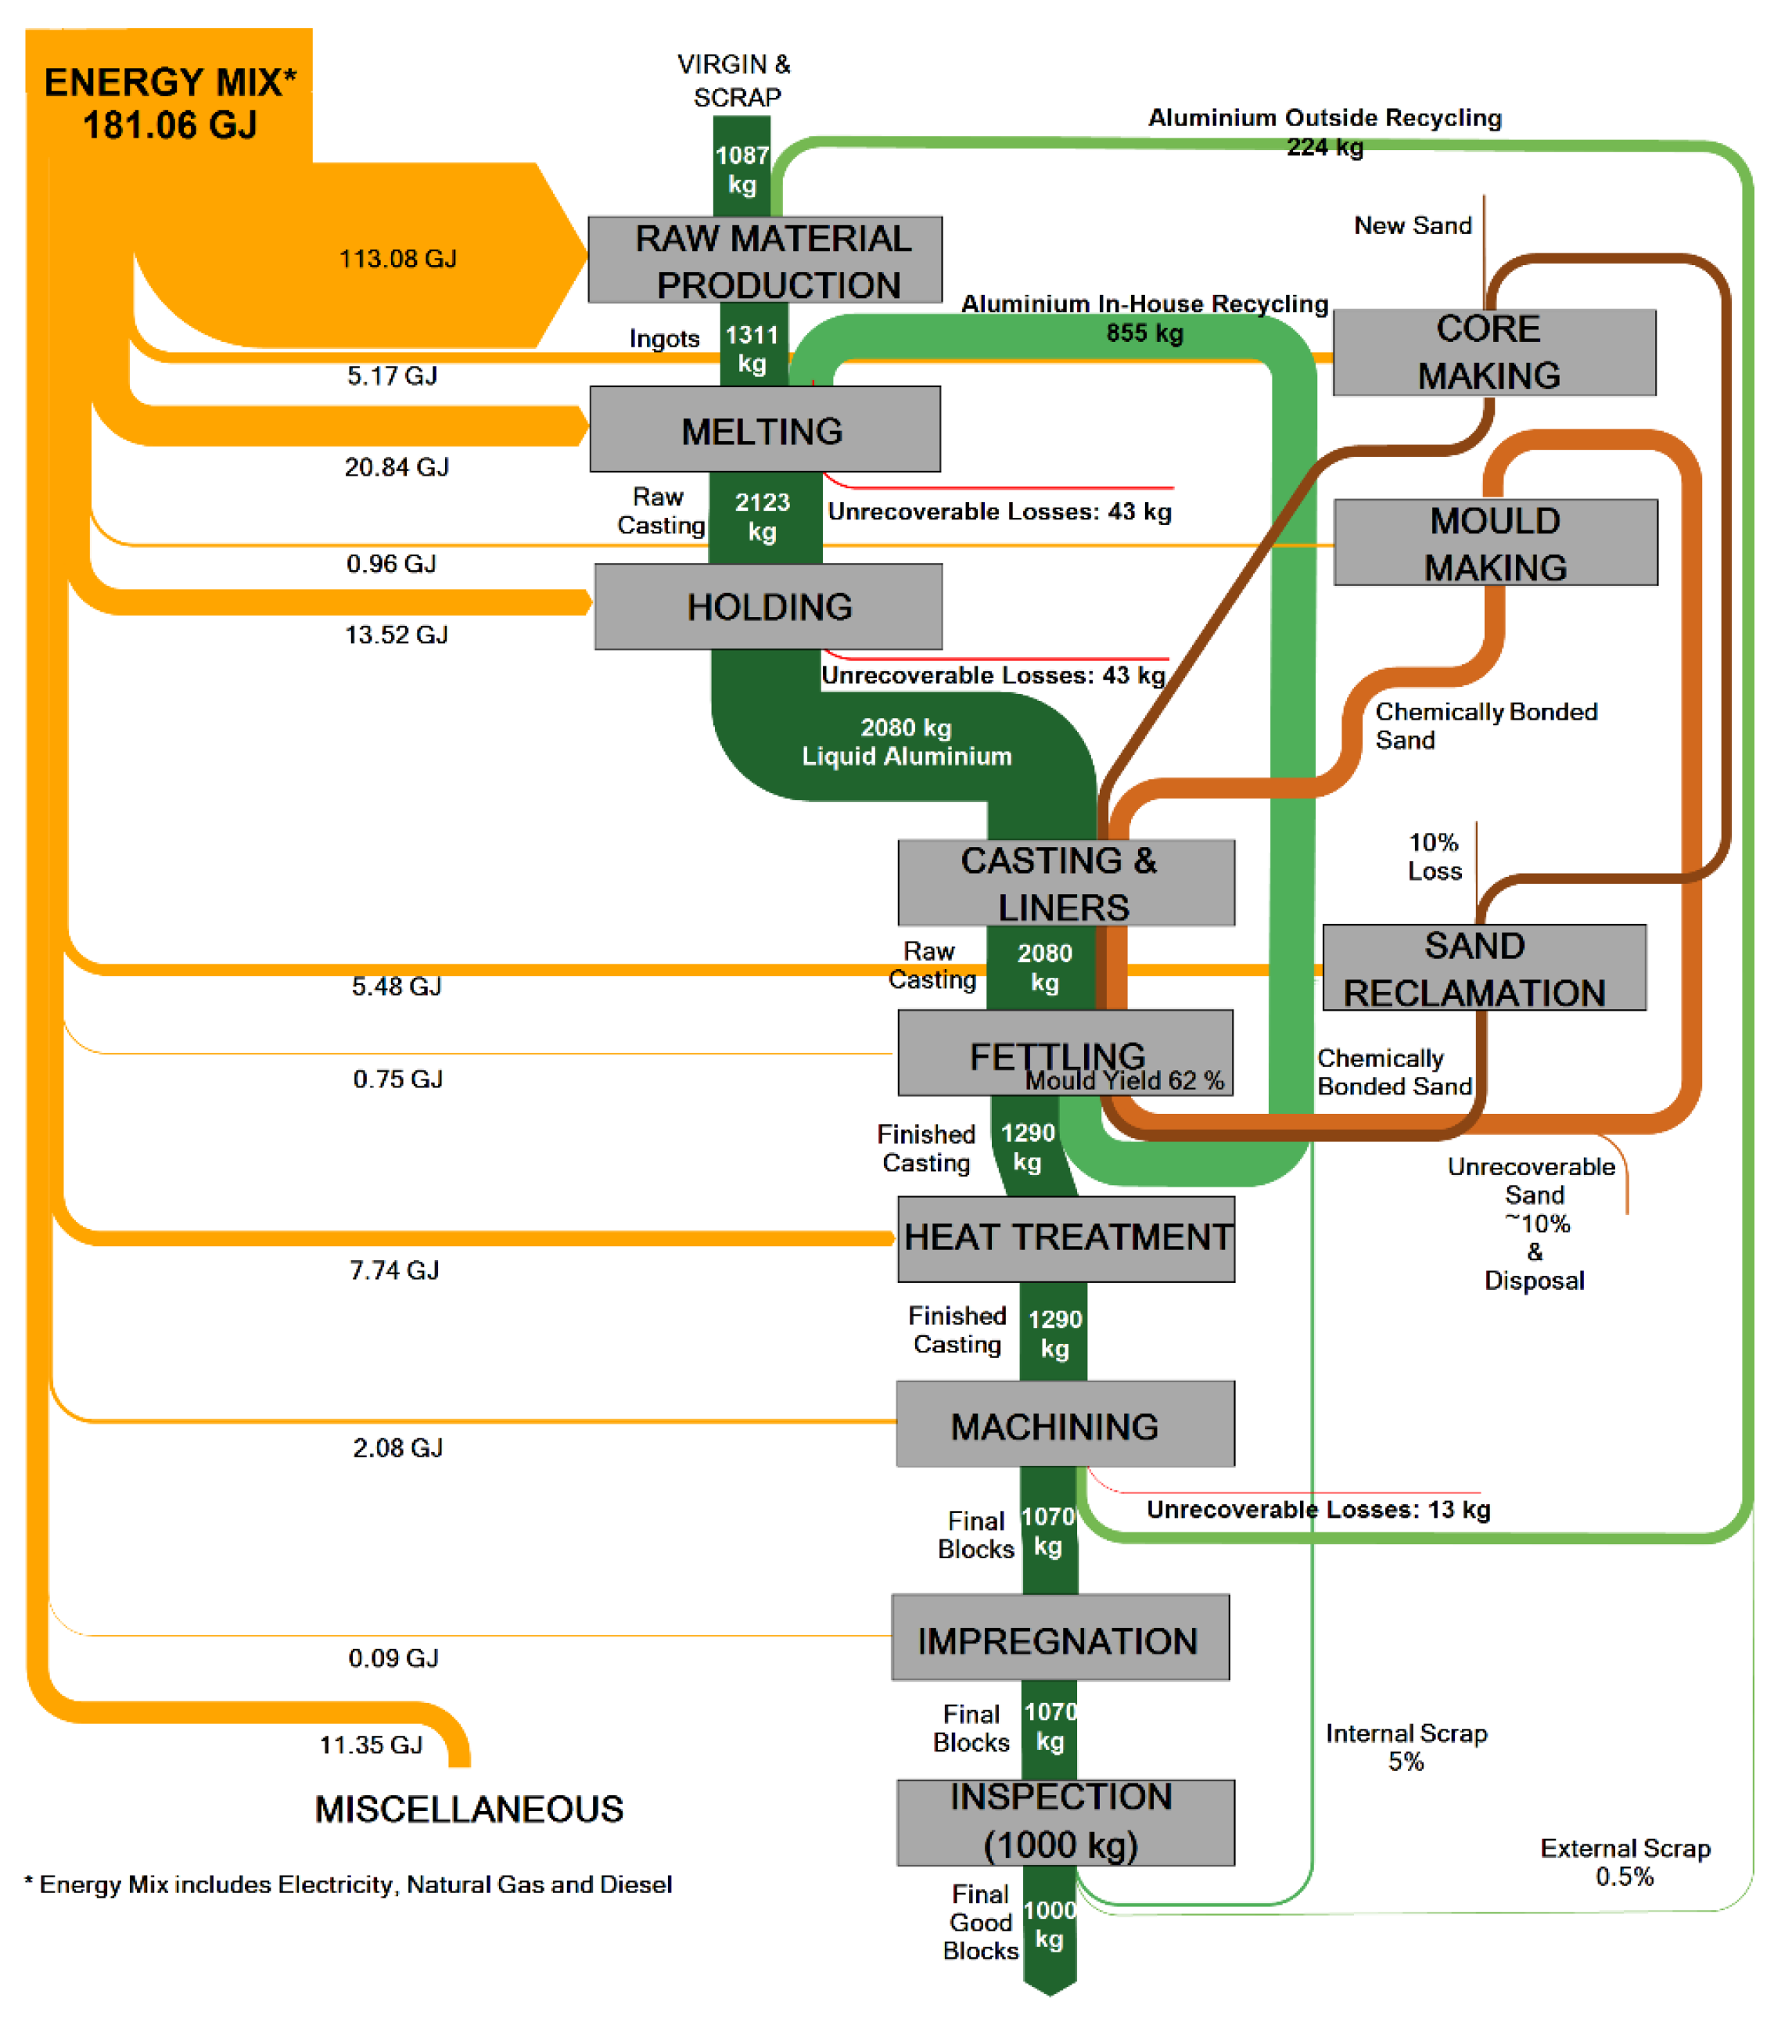
Figure 19.
Energy and material flow in low-pressure sand casting (LPSC), showing that 1000 kg of good castings require the melting of 2123 kg of Al and 181.06 GJ.
Figure 19.
Energy and material flow in low-pressure sand casting (LPSC), showing that 1000 kg of good castings require the melting of 2123 kg of Al and 181.06 GJ.
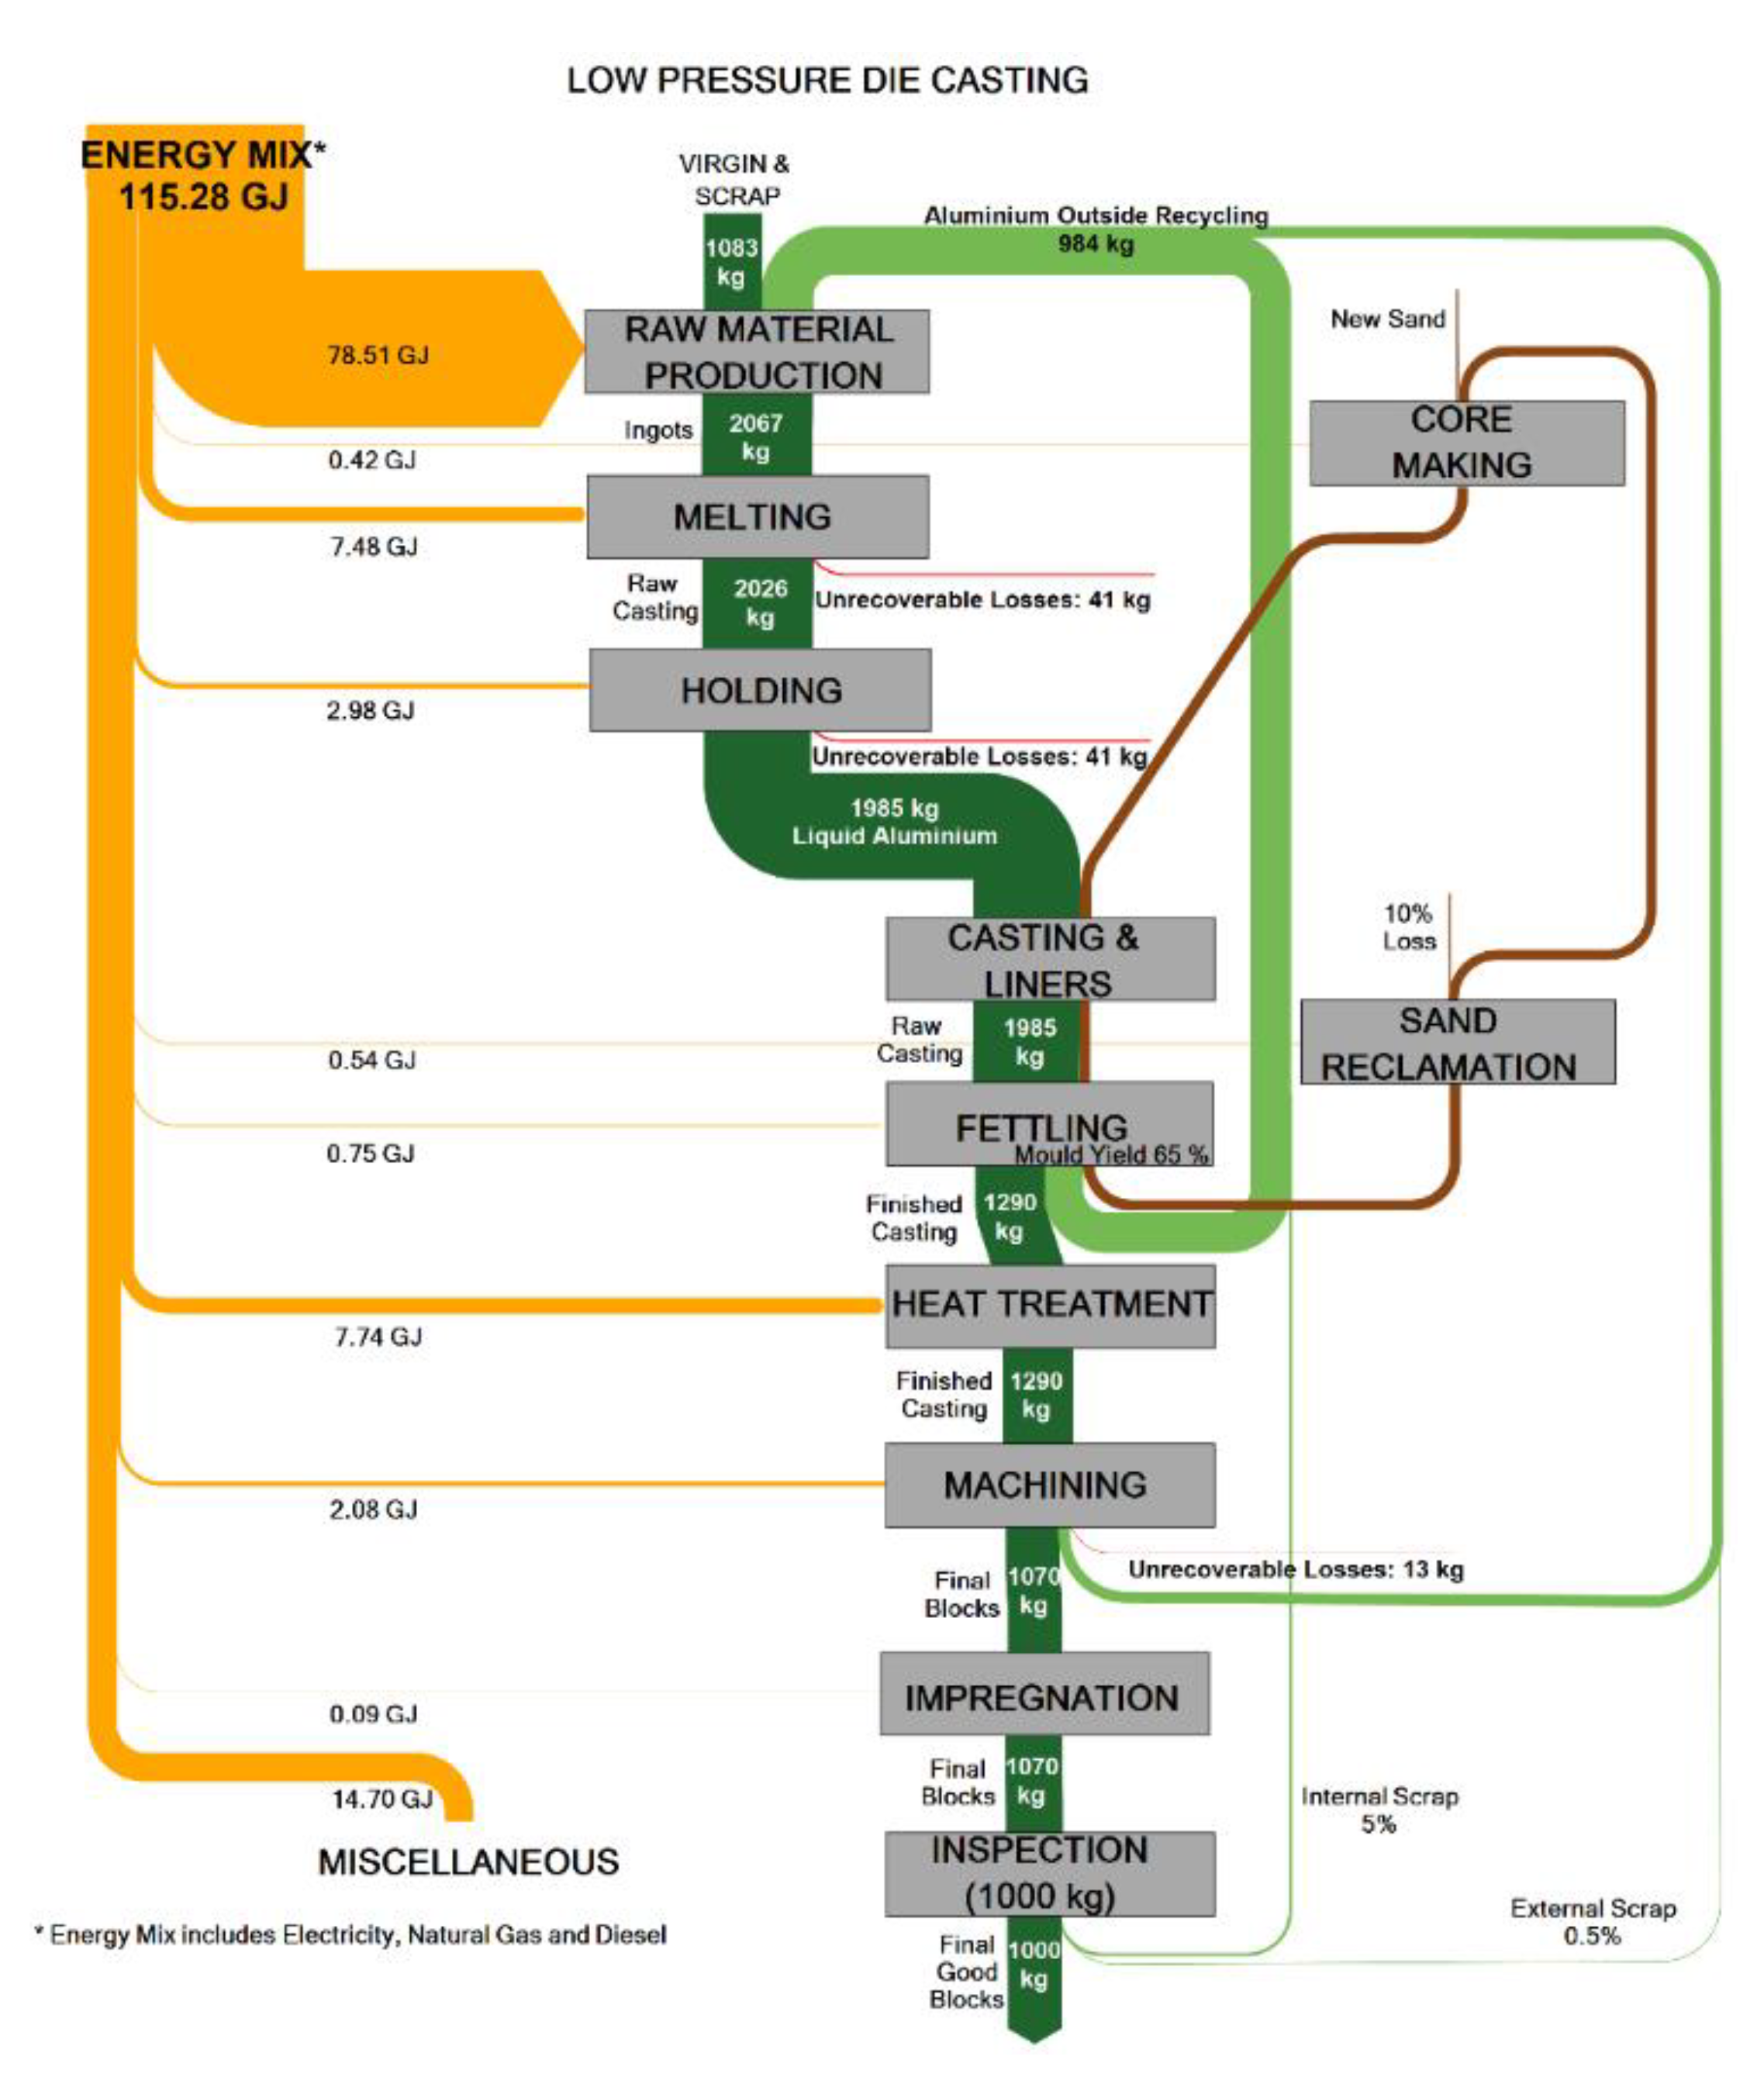
Figure 20.
Energy and material flow in low-pressure die casting (LPDC), showing that 1000 kg of good castings require the melting of 2067 kg of Al and 115.28 GJ.
Figure 20.
Energy and material flow in low-pressure die casting (LPDC), showing that 1000 kg of good castings require the melting of 2067 kg of Al and 115.28 GJ.
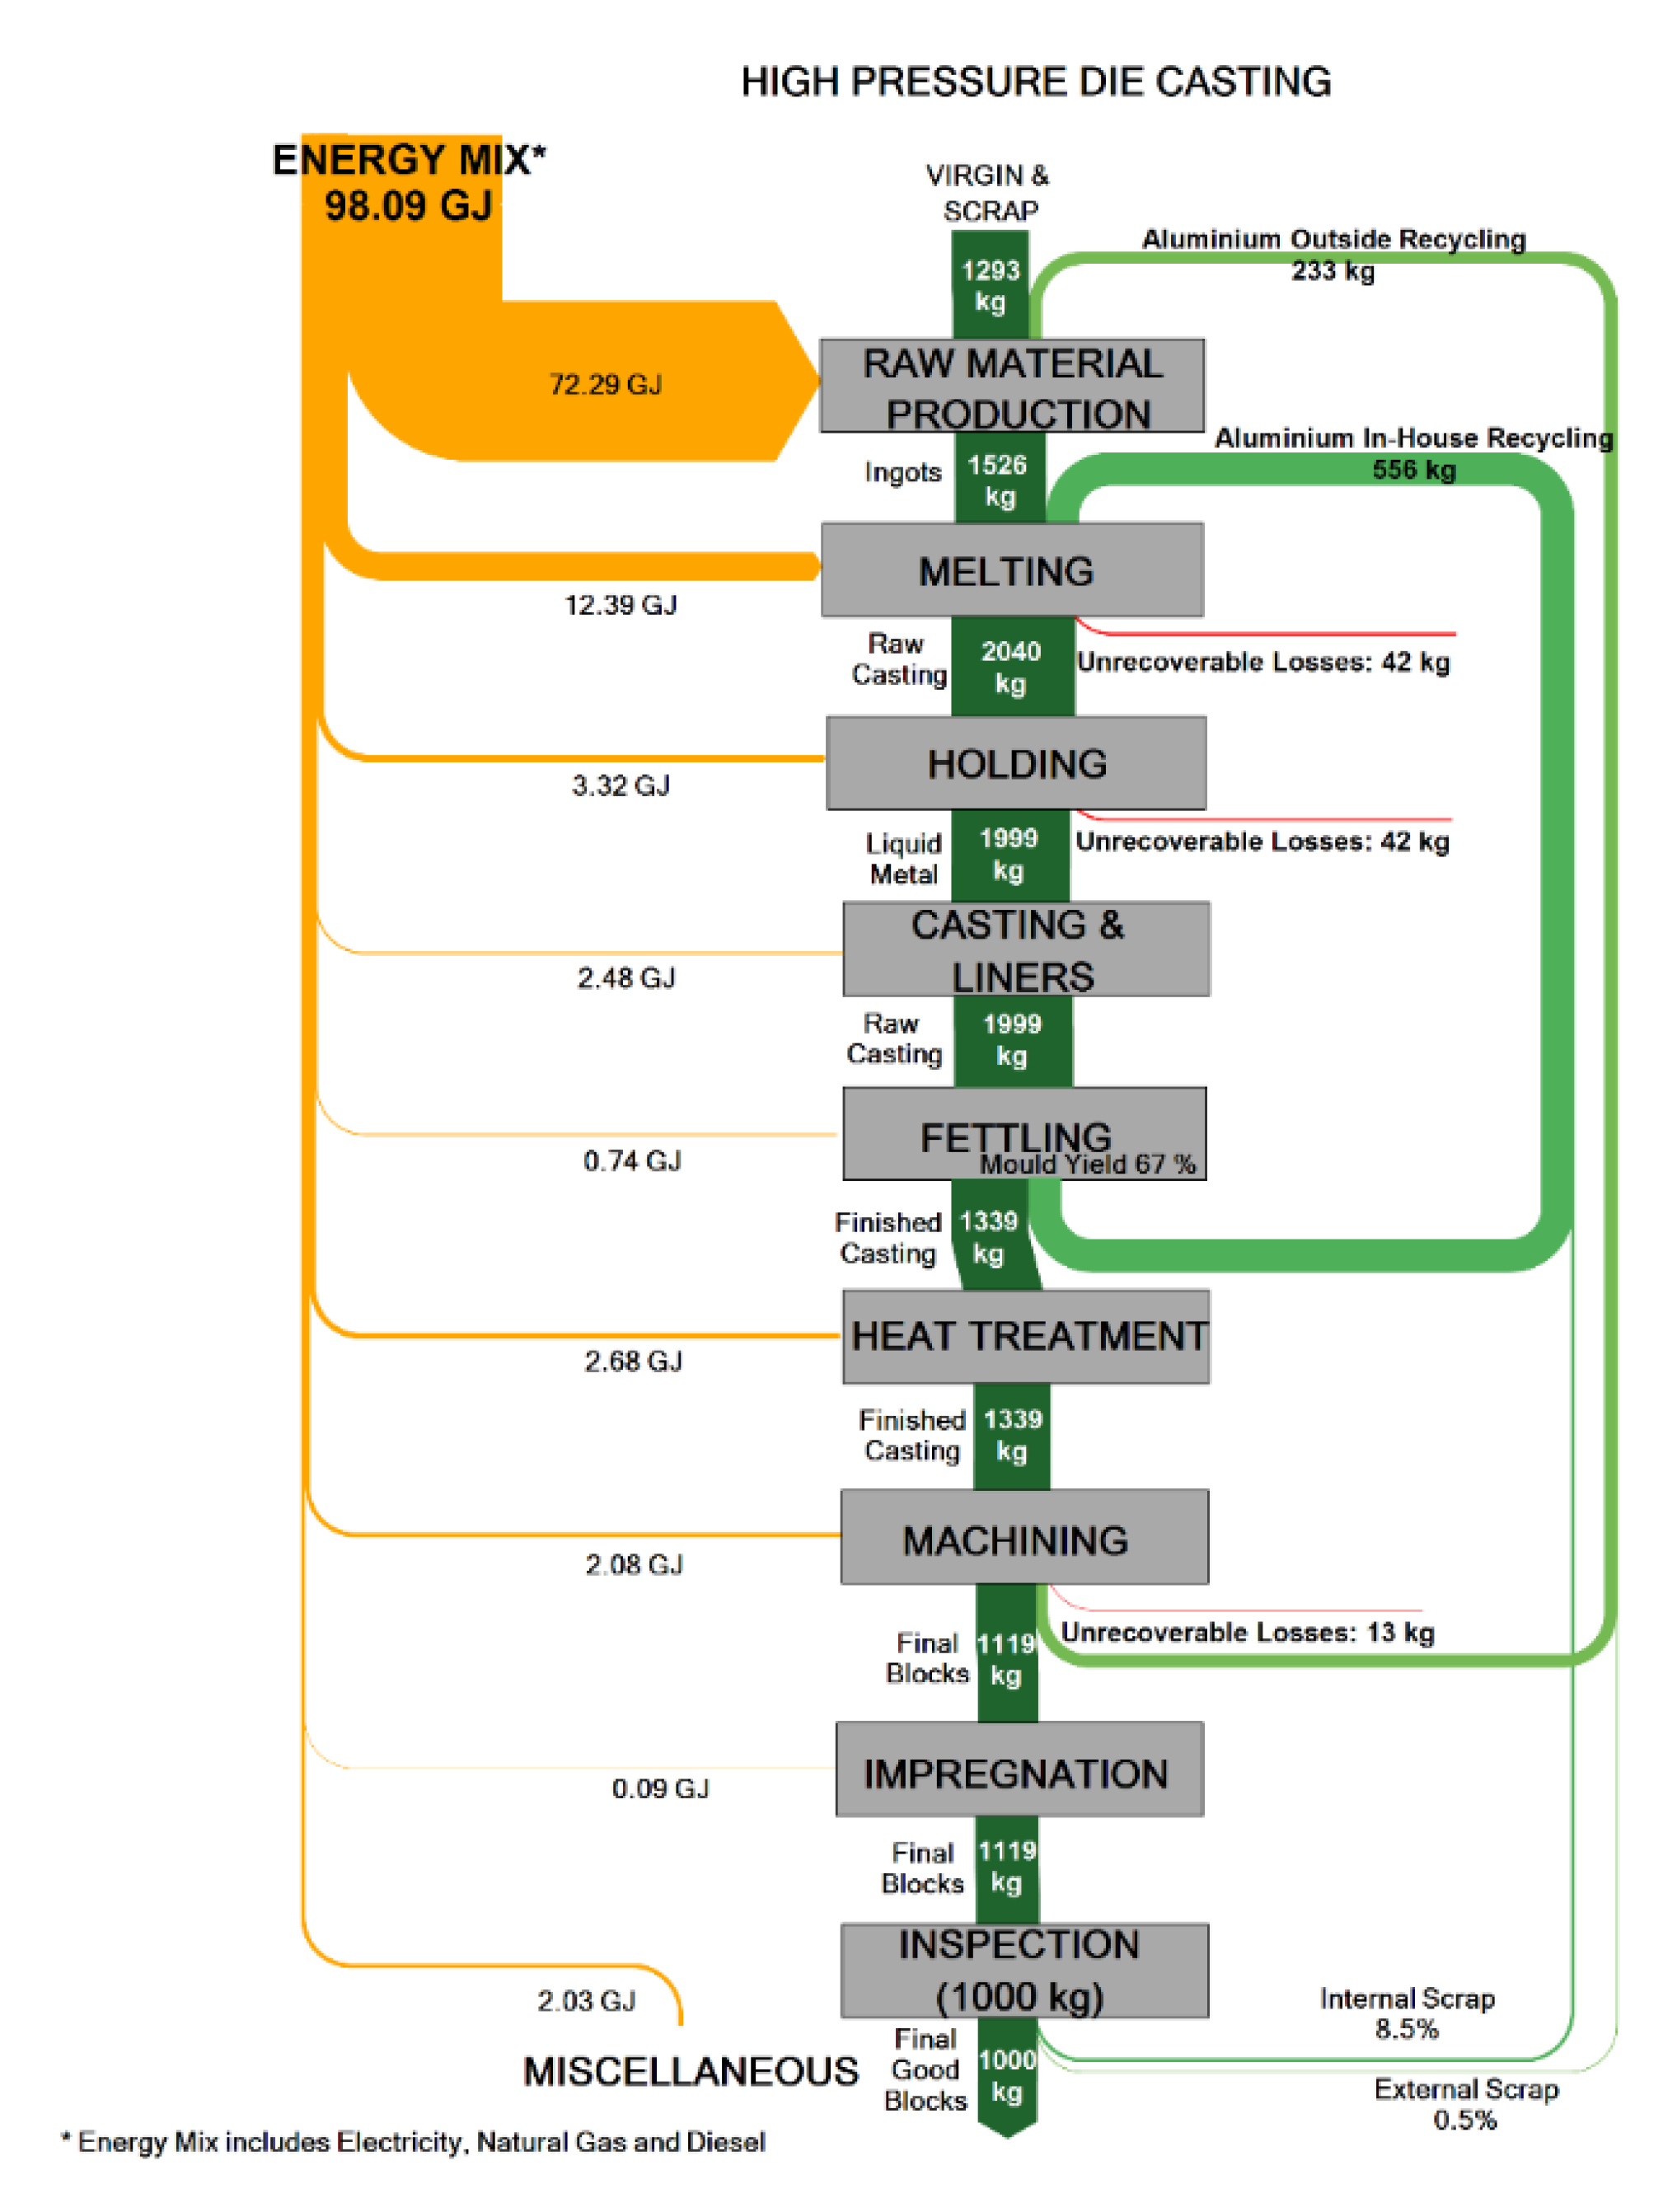
Figure 21.
Energy and material flow in high-pressure sand casting (HPDC), showing that 1000 kg of good castings require the melting of 2040 kg of Al and 98.09 GJ.
Figure 21.
Energy and material flow in high-pressure sand casting (HPDC), showing that 1000 kg of good castings require the melting of 2040 kg of Al and 98.09 GJ.
Figure 22.
Embodied material energy per ton of engine blocks.
Figure 22.
Embodied material energy per ton of engine blocks.
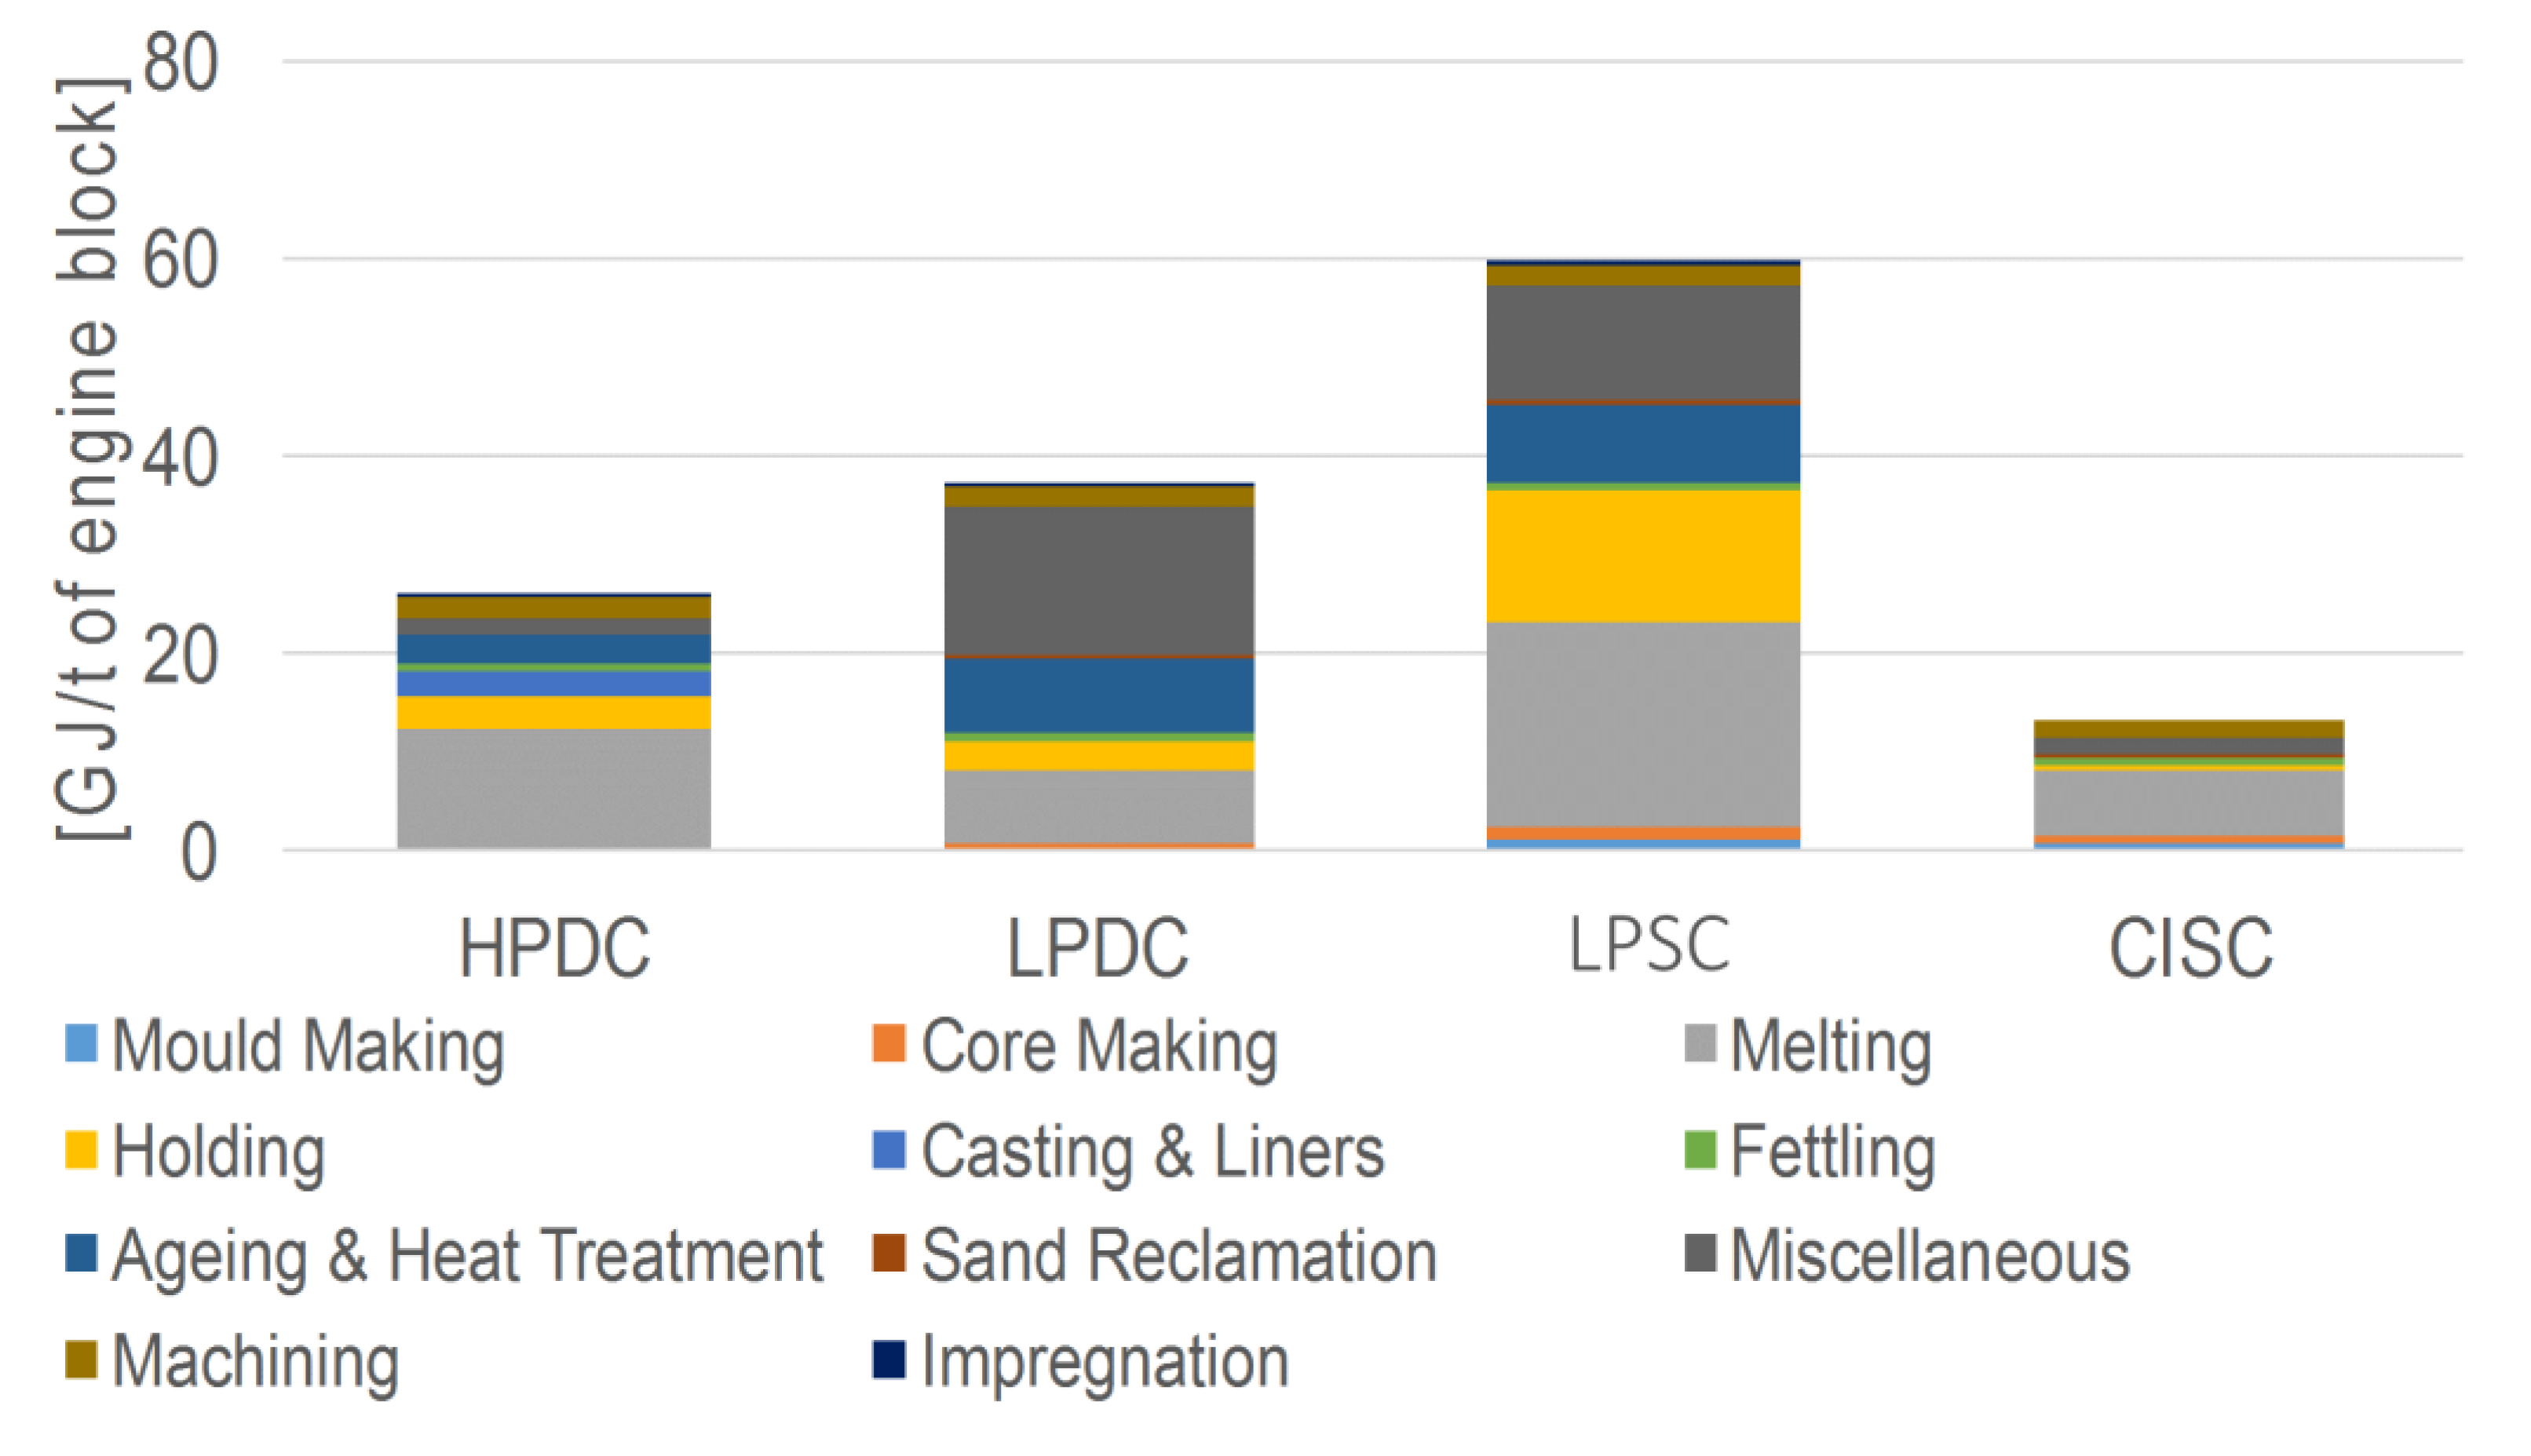
Figure 23.
Process energy per ton of engine blocks.
Figure 23.
Process energy per ton of engine blocks.
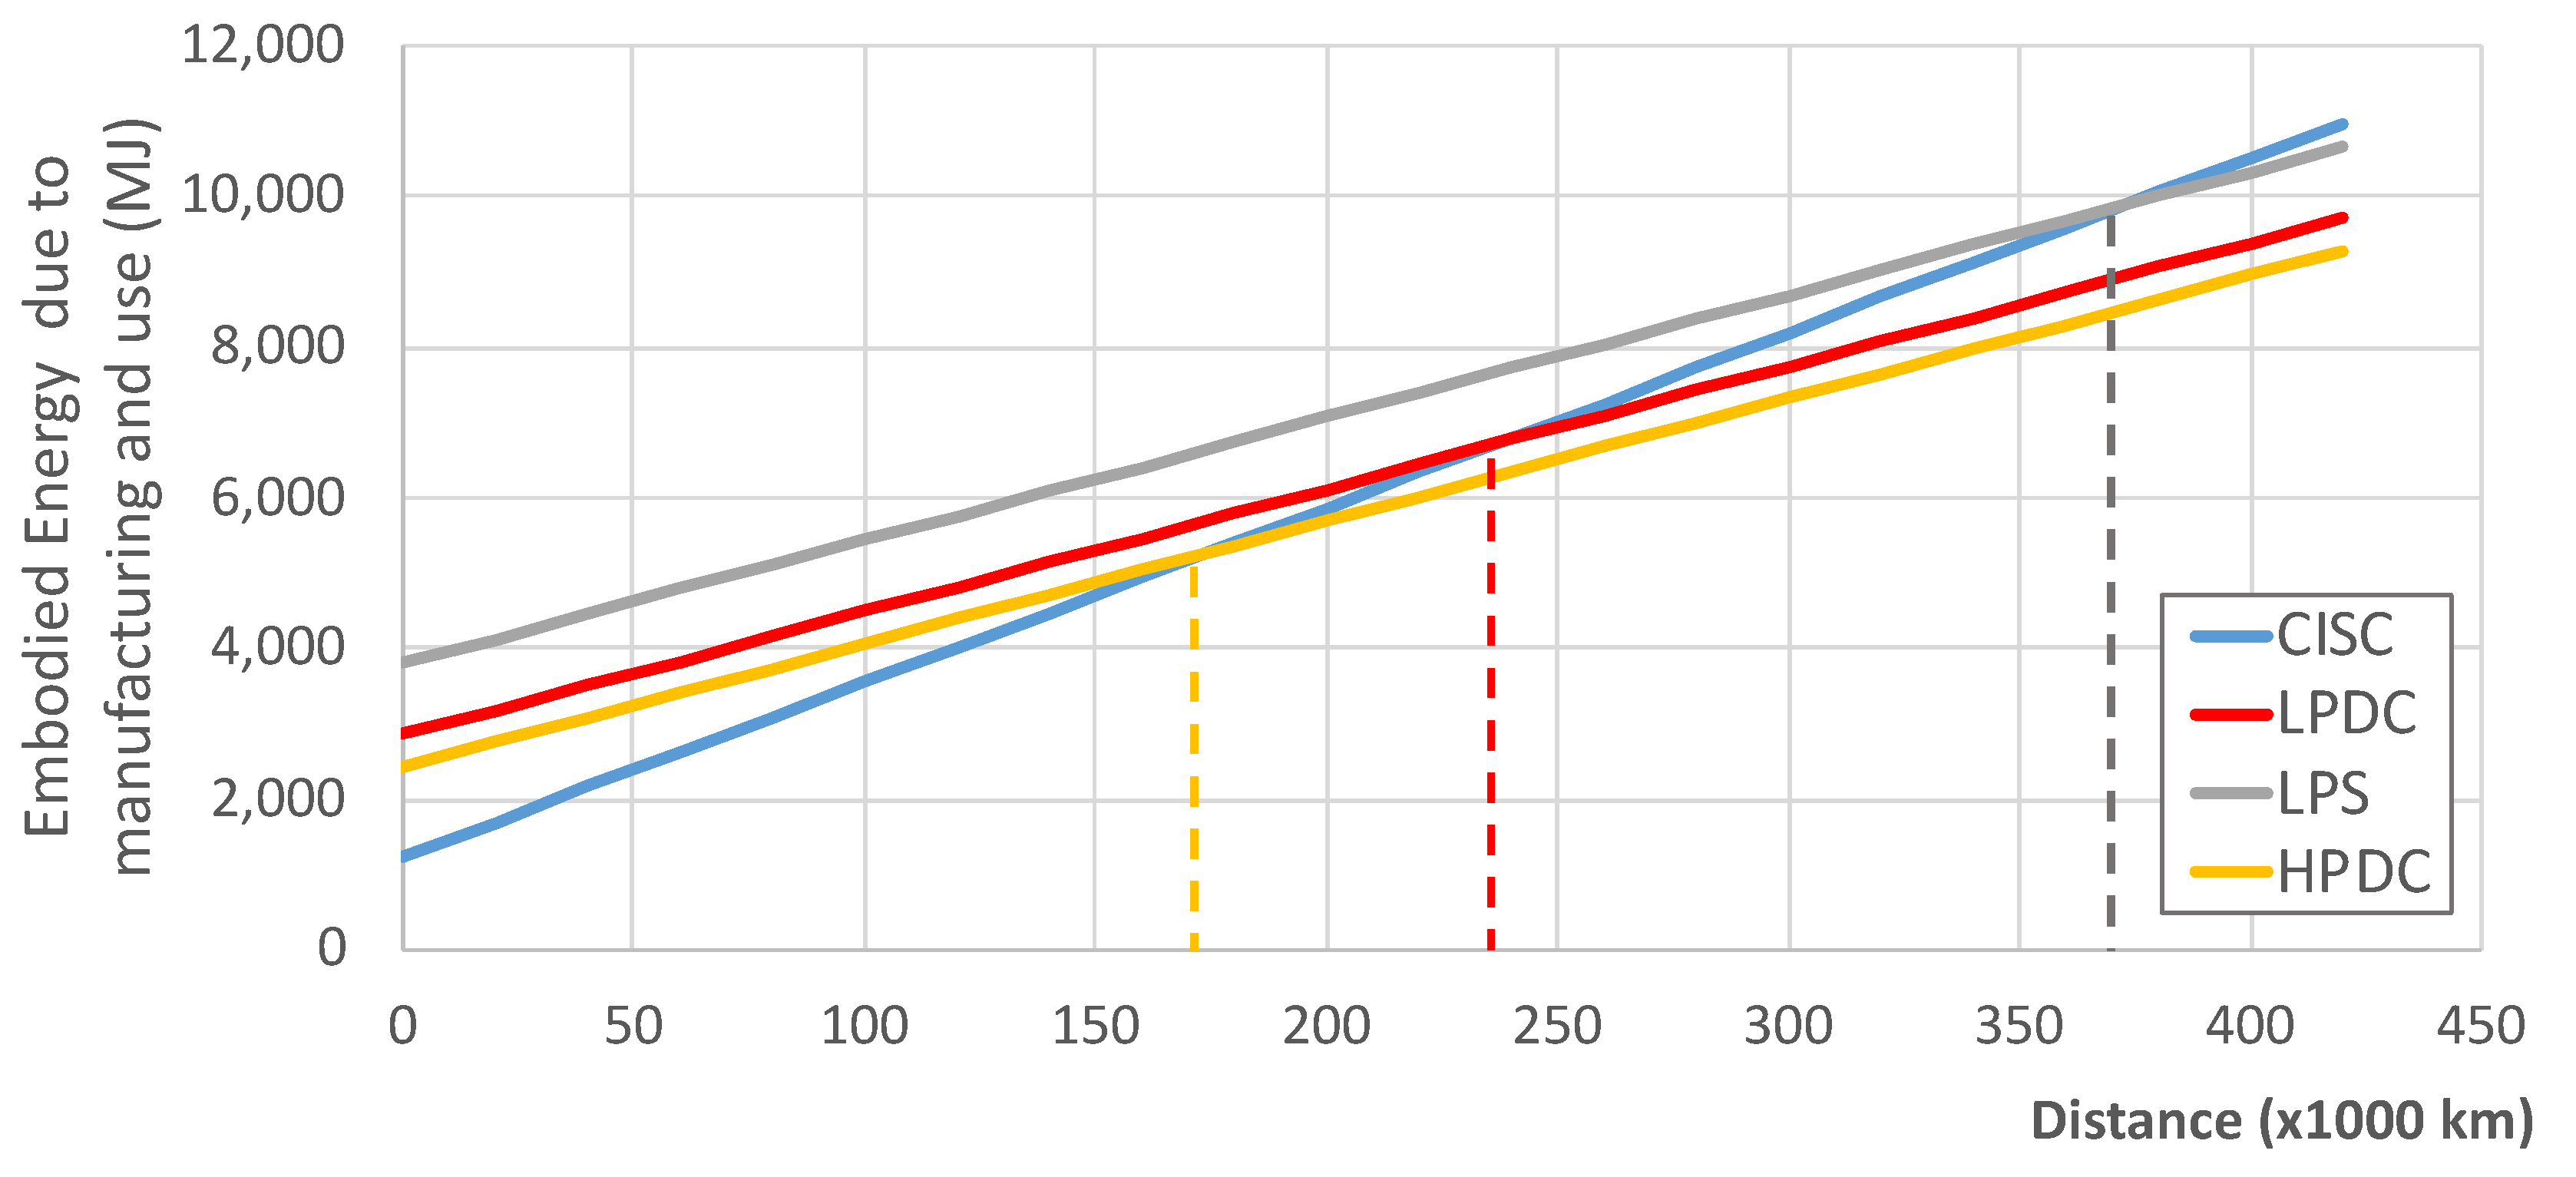
Figure 24.
Break-even distance for paying back the lightweight material (for a diesel automotive vehicle of 1200 kg with an average consumption of 7l,100 km).
Figure 24.
Break-even distance for paying back the lightweight material (for a diesel automotive vehicle of 1200 kg with an average consumption of 7l,100 km).
Table 1.
Bauxite mining energy per ton of bauxite.
Table 1.
Bauxite mining energy per ton of bauxite.
| Source | Energy (GJ/t) |
|---|
| [15] | 0.145 |
| [16] | 0.150 |
| [17] | 0.150 |
| [18] | 0.153 |
| [19] | 0.188 |
| [20] | 0.210 |
Table 2.
Alumina refining energy per ton of alumina.
Table 2.
Alumina refining energy per ton of alumina.
| Source | Energy (GJ/t) |
|---|
| [19] | 13.17 |
| [17] | 12.52 |
| [23] | 10.65 |
| [15] | 12.77 |
| [16] | 14.20 |
| [18] | 17.90 |
| [24] | 15.00 |
| [25] | 13.80 |
| [23] | 10.95 |
| [26] | 10.65 |
| [20] | 13.82 |
Table 3.
Electrolysis energy per ton of aluminum.
Table 3.
Electrolysis energy per ton of aluminum.
| Sources | Energy (GJ/t) |
|---|
| [27] | 56 |
| [24] | 52 |
| [28] | 66 |
| [21] | 54 |
| [29] | 53 |
| [16] | 55 |
| [20] | 47 |
| [23] (95% prebaked and 5% Soderberg) | 53.6 |
| [23] (89% prebaked and 11% Soderberg) | 55.0 |
| [24] | 50 |
| [18] | 55 |
| [26] | 56 |
Table 4.
Cast ingot energy per ton of aluminum.
Table 4.
Cast ingot energy per ton of aluminum.
| Sources | Energy (GJ/t) |
|---|
| [26] | 2.00 |
| [18] | 1.77 |
| [20] | 1.67 |
Table 5.
Iron ore mining and concentration energy per ton of iron ore.
Table 5.
Iron ore mining and concentration energy per ton of iron ore.
| Sources | Energy (GJ/t) |
|---|
| [32] | 0.153 |
| [33] | 0.142 |
| [30] | 0.177 |
| [27] | 0.956 |
| [34] | 0.750 |
Table 6.
Iron ore agglomeration per ton of iron ore agglomerated.
Table 6.
Iron ore agglomeration per ton of iron ore agglomerated.
| Sources | Energy (GJ/t) |
|---|
| [35] | 1.70 |
| [33] | 1.50 |
| [27] | 1.37 |
| [36] | 1.60 |
| [30] (pelletizing) | 1.33 |
| [30] (sintering) | 1.55 |
| [37] (pelletizing) | 0.82 |
| [37] (sintering) | 1.54 |
| [38] (sintering) | 2.25 |
| [34] (sintering) | 1.75 |
| [31] (pelletizing) | 2.10 |
| [31] (sintering) | 1.60 |
Table 7.
Coke manufacturing energy per ton of coke.
Table 7.
Coke manufacturing energy per ton of coke.
| Sources | Specific Country | Energy (GJ/t) |
|---|
| [27] | | 2.19 |
| [40] | | 3.70 |
| [34] | Germany 2003 | 3.70 |
| Japan 2002 | 3.50 |
| China 2004 | 4.20 |
| [35] | | 4.30 |
| [37] | | 4.45 |
| [22] | | 3.59 |
| [36] | | 5.80 |
| [38] | | 2.40 |
| [31] | | 6.00 |
Table 8.
Energy consumption per ton of limestone.
Table 8.
Energy consumption per ton of limestone.
| Sources | Energy (GJ/t) |
|---|
| [41] | 0.964 |
| [27] | 0.848 |
Table 9.
Energy consumption per ton of limestone.
Table 9.
Energy consumption per ton of limestone.
| Sources | Specifics | Energy (GJ/t) |
|---|
| [22] | | 16.90 |
| [38] | | 13.6–16.2 |
| [42] | Blast furnace | 12.3 |
| [40] | Blast furnace | 10.4 |
| [27] | Raw iron manufacturing | 12.8 |
| [31] | Blast furnace | 13–14.1 |
| [43] | Blast furnace | 12.7–18.6 |
| [44] | | 12.0 |
| [34] | blast furnace | 10.4 |
| [45] | | 12.2 |
| [36] | blast furnace | 10.4 |
| [37] | | 13.63 |
Table 10.
Energy for steel recycling with electric arc furnace.
Table 10.
Energy for steel recycling with electric arc furnace.
| Source | Energy (GJ/t) |
|---|
| World Steel Association (2015) | 5.3–8.7 |
| [49] | 6–15 |
| [50] | 8.1–9.0 |
| [13] | 10 |
| [22] | 5.5 |
| [43] | 5.3 |
| [44] | 5.5 |
Table 11.
Total energy per engine block. HPDC—high-pressure die casting; LPDC—low-pressure die casting; LPSC—low-pressure sand casting; CISC—cast-iron sand casting.
Table 11.
Total energy per engine block. HPDC—high-pressure die casting; LPDC—low-pressure die casting; LPSC—low-pressure sand casting; CISC—cast-iron sand casting.
| | HPDC | LPDC | LPSC | CISC |
|---|
| | Diesel | Petrol | Diesel | Petrol | Diesel | Petrol | Diesel | Petrol |
|---|
| Process energy (GJ/t) | 25.8 | 25.8 | 36.78 | 36.78 | 59.12 | 59.12 | 13.11 | 13.11 |
| Embodied energy (GJ/t) | 72.37 | 72.37 | 78.63 | 78.63 | 114 | 114 | 19.46 | 19.46 |
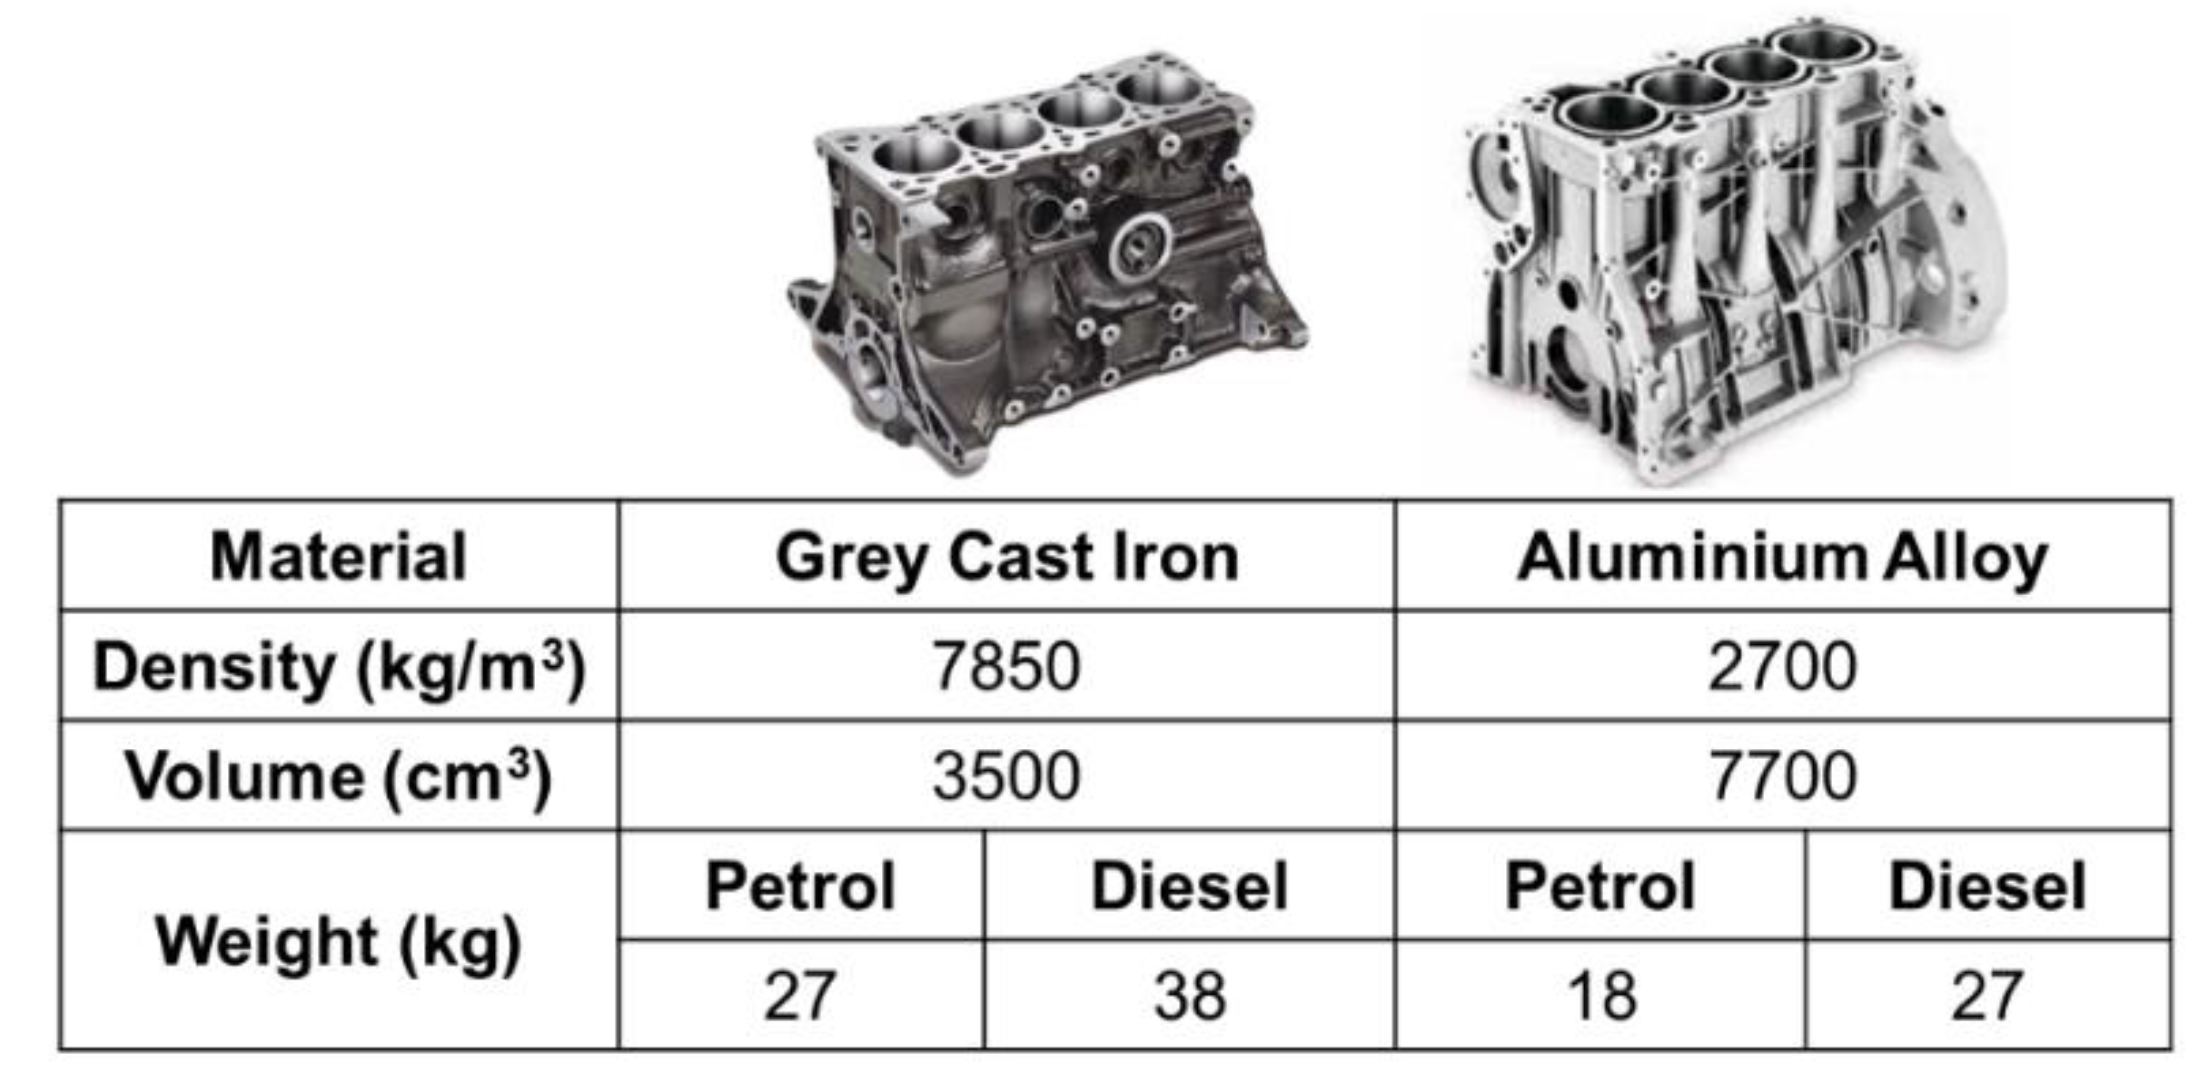
| Weight of single block (kg) | 27 | 18 | 27 | 18 | 27 | 18 | 38 | 27 |
| Process energy (GJ/block) | 0.64 | 0.41 | 0.91 | 0.58 | 1.46 | 0.93 | 0.5 | 0.35 |
| Embodied energy (GJ/block) | 1.79 | 1.14 | 1.94 | 1.24 | 2.81 | 1.79 | 0.74 | 0.53 |
| Total energy (GJ/block) | 2.43 | 1.54 | 2.85 | 1.81 | 4.28 | 2.72 | 1.24 | 0.88 |
Table 12.
Parameters for the break-even distance (BED) calculation.
Table 12.
Parameters for the break-even distance (BED) calculation.
| | Diesel | Petrol |
|---|
| 0.2 | 0.25 |
| 38.6 | 34.2 |
| 9 | 7 |
Table 13.
BED (km) vs. CISC for various types of engine blocks and manufacturing processes.
Table 13.
BED (km) vs. CISC for various types of engine blocks and manufacturing processes.
| | Diesel | Petrol |
|---|
| HPDC | 170,889 | 110,611 |
| LPDC | 232,141 | 155,809 |
| LPSC | 369,221 | 256,960 |


