Identification of Three-Phase Grid Impedance in the Presence of Parallel Converters
by
 , , , ,
Roni Luhtala
1,* ,
,
Tuomas Messo
1,*,
Tomi Roinila
1 ,
,
Henrik Alenius
1,
Erik de Jong
2,
Andrew Burstein
3 and
Alejandra Fabian
3 1
Department of Electrical Energy Engineering, Tampere University, 33720 Tampere, Finland
2
Department of Electrical Engineering, Eindhoven University of Technology, 5600 Eindhoven, The Netherlands
3
DNV-GL, 6812 Arnhem, The Netherlands
*
Authors to whom correspondence should be addressed.
Energies 2019, 12(14), 2674; https://doi.org/10.3390/en12142674
Submission received: 14 June 2019
/
Revised: 27 June 2019
/
Accepted: 8 July 2019
/
Published: 12 July 2019
(This article belongs to the Special Issue Modern Power System Dynamics, Stability and Control)
Abstract
:Grid impedance is an important parameter which affects the control performance of grid-connected power converters. Several methods already exist for optimizing the converter control system based on knowledge of grid impedance value. Grid impedance may change rapidly due to fault or disconnection of a transmission line. Therefore, online grid identification methods have been recently proposed to have up-to-date information about the grid impedance value. This is usually done by perturbing the converter output current and measuring the response in output voltage. However, any parallel converters connected to the same interface point will cause errors, since the measured current differs from the current that is flowing through the grid interface point. This paper points out challenges and errors in grid impedance identification, caused by parallel converters and their internal control functions, such as grid-voltage support. Experimental grid-impedance measurements are shown from the power hardware-in-the-loop setup developed at DNV-GL Flexible Power Grid Lab.
1. Introduction
Increasing the generation of renewable energy has been identified as one of the most important pathways to limit the global warming below 1.5 degrees [1]. Key technologies to reach this ambitious goal include power electronics and, especially, grid-connected three-phase converters. Furthermore, the number of small distributed generators is expected to continue increasing due to the declining cost of renewable energy and simultaneously rising concerns related to cost and availability of fossil fuels. A three-phase converter acts as the interface between the generator and the grid, having many important responsibilities such as high power quality, providing grid voltage support in microgrids, and maximizing power yield from the renewable power source.
Grid impedance is an important parameter in modern power systems, which may include a large number of power electronic converters [2]. The grid impedance has a significant effect on a power converter’s dynamic performance, such as settling time, control bandwidth, and stability [3,4]. Grid impedance is known to slow down current control, which is an integral control function of the inverter as it is responsible for generating sinusoidal high-quality currents. In general, a slower current controller will produce more harmonic currents to the power system in the presence of background harmonics by lowering the inverter output impedance [5]. Therefore, it is essential that a converter operating in weak grids with significant grid impedance is optimized to mitigate the detrimental effect of grid impedance. The inverter can be configured to estimate the grid impedance value and utilize adaptive control methods to maintain robust performance with different grid impedance levels [6,7]. Moreover, high grid impedance has been shown to cause grid-connected converters to become unstable due to fast grid synchronization [8]. Reliable grid impedance measurement can provide numerous benefits, such as online (or offline) stability analysis to aid in system-level studies and fault diagnostics [6,9]. Furthermore, grid impedance estimation is often the core function of islanding detection in grid-connected inverters.
In many cases it has been assumed that the grid impedance seen at the output terminals of the inverter resembles a resistive–inductive circuit [10]. However, the effect of parallel converters and their control functions to the accuracy of grid impedance measurement has not been previously reported. As illustrated in Figure 1, a converter operating, for example in a microgrid, may not be able to get information about the true current flowing toward the grid interface point when there are other parallel-connected converters in the same point of connection. Inverter usually measures current only from its own output terminals.
This paper shortly reviews the multiple–input multiple–output pseudo-random binary sequence (PRBS) injection method to identify the grid impedance online. The grid impedance is identified by perturbing the grid current in the dq-domain and using the MIMO-identification method to extract the impedance components between d- and q-components. In reality, the only feasible measurement point for grid-impedance measurements with the inverter is its output terminals, which leads to issues when other devices are connected in parallel and neglected from the analysis. This may cause errors in grid-impedance measurements and malfunctioning of grid-impedance based adaptive control functions.
The main contribution of this paper is to demonstrate the impact of a parallel-connected inverter on the grid-impedance measurements at the output terminals of the measuring inverter. The parallel inverter may have a current controller, voltage support function, and droop gain, and their resulting effects on the measurements are demonstrated through experimental measurements. The experiments are performed with 50 kW power levels at DNV-GL Flexible Power Grid Lab.
The remainder of the paper is organized as follows. Section 2 describes the used identification technique, and Section 3 develops the analytical grid impedance model for comparison. In Section 4, the experimental power hardware-in-the-loop setup is shown. Section 5 presents and discusses the experimental results. Finally, Section 6 draws the conclusions.
2. Frequency-Response Measurement in the dq-Domain
In a typical non-parametric frequency-response measurement of a grid-connected system, the system is perturbed by a predefined current or voltage excitation. The input and output signals are measured, and Fourier methods are applied to extract the spectral information. Most often, a wideband perturbation such as maximum-length binary sequence (MLBS) is applied [11]. This type of injection has energy at multiple frequencies, making it possible to measure the frequency response simultaneously at several frequencies. Another advantage of the MLBS over the other types of signals, such as sinusoids, is that the sequence can be implemented with a low-cost system whose output can only generate a small number of signal levels.
Three-phase power-distribution systems analyzed in the dq-domain can be considered as multiple–input multiple–output (MIMO) systems. For example, measuring the three-phase grid impedance requires that the impedances of both the d- and q-component are measured. Typically, the goal is to obtain a 2 × 2 impedance matrix, which includes the direct components (d and q) as well as the cross-coupling components (from d to q and from q to d). As the components are most often coupled, the identification process may become exhaustive when applying conventional measurement techniques. In such conventional techniques, a perturbation current/voltage is injected to each system input, the responses are measured at all outputs in turn, and Fourier techniques are applied to each input and output signal combination.
An alternative to the conventional method is to apply orthogonal perturbation sequences [12]. In the method, several perturbations are simultaneously injected through system inputs. As the injections are orthogonal, that is, they have energy at different frequencies, dynamics of several input–output couples can be measured at the same time within one measurement cycle. Applying orthogonal perturbation sequences not only saves overall measurement time, but also ensures that the dynamics of each input–output couple are measured under the same operating conditions, which may not be the case if sequential perturbations are applied.
The synthesis of orthogonal (periodic) binary sequences has been well documented [13]. One of the most popular techniques is to apply a Hadamard modulation [6]. In this method, the maximum-length binary sequence (MLBS) is used as a base signal. The second signal is obtained by adding, modulo 2, the sequence 0 0 1 1 0 0… to the MLBS. The third signal is obtained by adding the sequence 0 0 0 0 1 1 1 1 0 0 0 0… to the MLBS, and so on.
Figure 2 shows samples of three orthogonal binary sequences in the time and frequency domain, obtained by the Hadamard modulation. The first sequence is a conventional MLBS that has 63 bits. All of the sequences are generated at the same frequency. As the figure shows, all three signals have similar time-domain properties, but each signal has energy at different frequencies, that is, if one signal has nonzero energy at a certain frequency, the other two signals have zero energy at that frequency.
3. Grid Impedance Modeling
Grid strength is often considered as the short-circuit ratio at the grid interface point. The grid impedance is, in many cases, equivalent to a resistive–inductive circuit in the frequency range overlapping with inverter current control [2,14], i.e., up to 1 kHz.
System impedance, seen by a converter located at the end of a long transmission line, is mainly affected by the transmission system impedance, from which 60% can be caused by the leakage inductance of transformers in the system, as discussed in [14]. Thus, the assumption that grid impedance resembles an RL-circuit (as shown in Figure 3) is valid in such cases. In this paper, we are studying the case where the equivalent grid impedance is not solely determined by the transmission system, instead, the parallel devices at the grid interface point have a major effect on the identified impedance.
Grid Impedance Model
Grid impedance model can be derived in a dq-reference frame synchronized to the voltages at the grid interface. In the case of the resistive–inductive grid impedance, the inductor voltages can be solved as in (1). The equation can be transformed into the stationary reference frame (-frame) using the amplitude–invariant Clarke’s transformation, as given in (2).
4. Laboratory Setup
The experimental tests were carried out at DNV-GL Flexible Power Grid Lab, Arnhem, which includes a power hardware-in-the-loop (PHIL) setup, shown in Figure 4. The combined power of the four power amplifier groups is 200 kVA. The four power amplifiers are digital power amplifiers manufactured by Egston. Control systems were implemented using the OPAL-RT real-time digital simulator, which includes the Xilinx Virtex-7 FPGA VC707, for fast digital computation and signal processing. Each of the digital amplifiers comprised of four single-phase units (a total of 16 units in the whole PHIL setup) with a closed-loop bandwidth of approximately 5 kHz [15]. Each single-phase amplifier comprised of six interleaved parallel half-bridge converters with an equivalent switching frequency of 125 kHz. For the closed-loop PHIL setup, the high-speed SFP communication link was established between the OPAL-RT and Egston. The current and voltage measurements were updated from the amplifier output terminal to OPAL-RT every 4 microseconds, while current and voltage control set point values were sent to the Egston digital I/O box. The host PC was connected via asynchronous ethernet to the OPAL-RT target PC. The single-phase amplifiers were isolated from the main grid by a Dy transformer. Thus, the amplifiers can be freely configured to act as sources or loads, DC or AC, depending on the needs of the PHIL study. Each amplifier can be configured to emulate the impedance behavior of a real grid-connected converter, as discussed in [15].
5. Impedance Measurements
5.1. Reference Case: Grid Impedance with Ideal Current Injection
The three-phase grid voltages were generated by amplifier group number 3 (G3), while it operated in voltage amplifier mode. Grid impedance is implemented by connecting a three-phase 0.5 mH inductor in series with the amplifier. To validate the experimental measurements, a reference measurement was done first. The reference measurement is required to differentiate what effect is caused by the voltage amplifier and what is caused by the parallel-connected converter.
Grid impedance was measured in the dq-domain using amplifier group number 1 (G1) in current amplifier mode. During the measurement, both amplifier groups 2 and 4 (G2 and G4) remained disconnected. The grid impedance is measured by applying two orthogonal signals (the MLBS and IRS signals) into d and q references of the current amplifier, as illustrated in Figure 5, and by using Fourier methods to compute the frequency responses. Frequency responses were computed offline utilizing measurement cards and a PC running MATLAB software. The impedance components are extracted from the measured d and q-components as follows:
Measured source impedance is shown in Figure 6 in the dq-domain. The direct and quadrature components, i.e., and , follow precisely the analytical model defined in (5). Both the magnitude and phase follow the RL-model up to approximately 1 kHz. The cross-coupling components of the grid impedance, and , follow the analytical model up to approximately 500 Hz. The deviation is due to the fact that some injection current from d component leaks to q-component (and vice versa) at high frequencies, as can be seen in previous measurements, presented in [15] and revisited in Figure 7. In the figure, the injection from d to q-component and vice versa, starts to experience a phase shift approximately after 500 Hz. Ideally, all the frequencies responses in Figure 7 would have constant magnitude and constant phase shift, with cross-coupling frequency response magnitudes close to zero (or -Inf in decibels). Moreover, the input impedance of the voltage amplifier is not zero and it starts to affect the cross-coupling components at high frequencies. However, it can be stated based on the measured impedance components that the setup can operate as a sufficient platform to study the effect of parallel converter on the grid impedance measurement.
5.2. Emulating a Three-Phase Grid-Following Inverter
During a previous visit at the Flex Power Grid Laboratory, it was demonstrated how a voltage amplifier can be configured to emulate impedance behavior of a real grid-connected power converter. A three-phase inductor was connected to the output of the amplifier in order to prevent large transients in circulating currents between the amplifiers and, more importantly, to enable mimicking the effect of fast current control and slow phase-locked-loop on the impedance seen from the grid interface point. An interested reader is urged to see [15] for further information.
Amplifier group number 4 was connected to the grid interface point through a 2 mH inductor, shown in Figure 8. The grid impedance was measured by injecting the MLBS signal to the reference value of current d-component and the IRS signal to current q-components. The measured impedance components are shown in Figure 9 and compared to the analytical model. The current control bandwidth was designed to 500 Hz and synchronous reference frame phase-locked-loop (SRF-PLL) bandwidth was varied between 1 and 40 Hz.
5.3. Effect of SRF-PLL
The measurements in Figure 9 are done with three different settings of the phase-locked-loop (SRF-PLL). The SRF-PLL is required to synchronize the converter current to the grid voltage. Bandwidth of the synchronization algorithm is varied between 1 Hz and 40 Hz. The direct component of the grid impedance follows the ideal value regardless of the SRF-PLL bandwidth, which is caused by the fact that d-components are not significantly affected by SRF-PLL [5]. Magnitude of the cross-coupling component is also accurately identified, but the phase starts to drop after 100 Hz. This phase-drop in the cross-coupling impedances was present in all of the measurements where injection was made using the current controlled converter. Adding the decoupling gains in the current control () was observed to improve the situation, but the phase-error could not be entirely removed. Components, which are calculated based on the voltage q-component —that is, and —are more severely impacted by the SRF-PLL bandwidth. It can be concluded that the magnitude of both components cannot be accurately identified inside the SRF-PLL bandwidth. Moreover, the phase has large error extending up to approximately ten times the SRF-PLL bandwidth.
To mitigate errors caused by the SRF-PLL, its bandwidth should be reduced down to a few hertz. However, this would have a severe effect on control performance of the converter during transients and faults [16]. A better approach is to implement another SRF-PLL intended only for measuring the grid impedance, as done in [6]. To improve the phase-accuracy of the cross-coupling components, the decoupling gains should be redesigned, to prevent d-component injection from turning into q-component at high frequencies. Due to limited access days at the laboratory, this modification has been left as a future challenge. For the purpose of following measurements, the SRF-PLL bandwidth was left to 1 Hz.
5.4. Effect of Parallel Converter with Current Control
Amplifier group number 2 was configured to emulate a current-controlled converter and connected in parallel, as illustrated in Figure 10. The internal switch inside the converter control system was connected to the upper signal to bypass any voltage support or droop functions. The reference of the current control was constant (50 A). Moreover, during the impedance measurement, the converter G4 was also feeding 50 A of current to the system.
Figure 11 shows the measured voltage and currents at the grid interface with and without the injection from converter G4. The injection was set to 2 A, which is equal to 2 percent of the total grid current of 100 A, which was found to provide sufficient compromise between noise rejection and measurement time.
Figure 12 shows the corresponding waveforms in the dq-domain. Waveforms include more noise due to the fact that these signals were captured by the measurement card and were corrupted by surrounding noise in the laboratory. However, the effect of noise can be easily removed by taking longer measurement and applying averaging. Impedances were measured by taking 50 full PRBS sequences and applying averaging in time domain.
Figure 13 shows the identified impedance with parallel current-controlled converter. In the case of all impedance components, the magnitude is accurately identified, which is due to fact that the output impedance of converter G2 is much higher than that of the grid impedance. The output inductance of G2 was 3.2 mH, which is 6.4 times higher than the grid inductance. Interestingly the parallel converter improves the phase-accuracy of the cross-coupling components, presumably by altering the way injection from d-component leaks to q-component (and vice versa). However, the phase of the direct and quadrature components and are slightly deteriorated. The maximum error is approximately 13 degrees at 600 Hz.
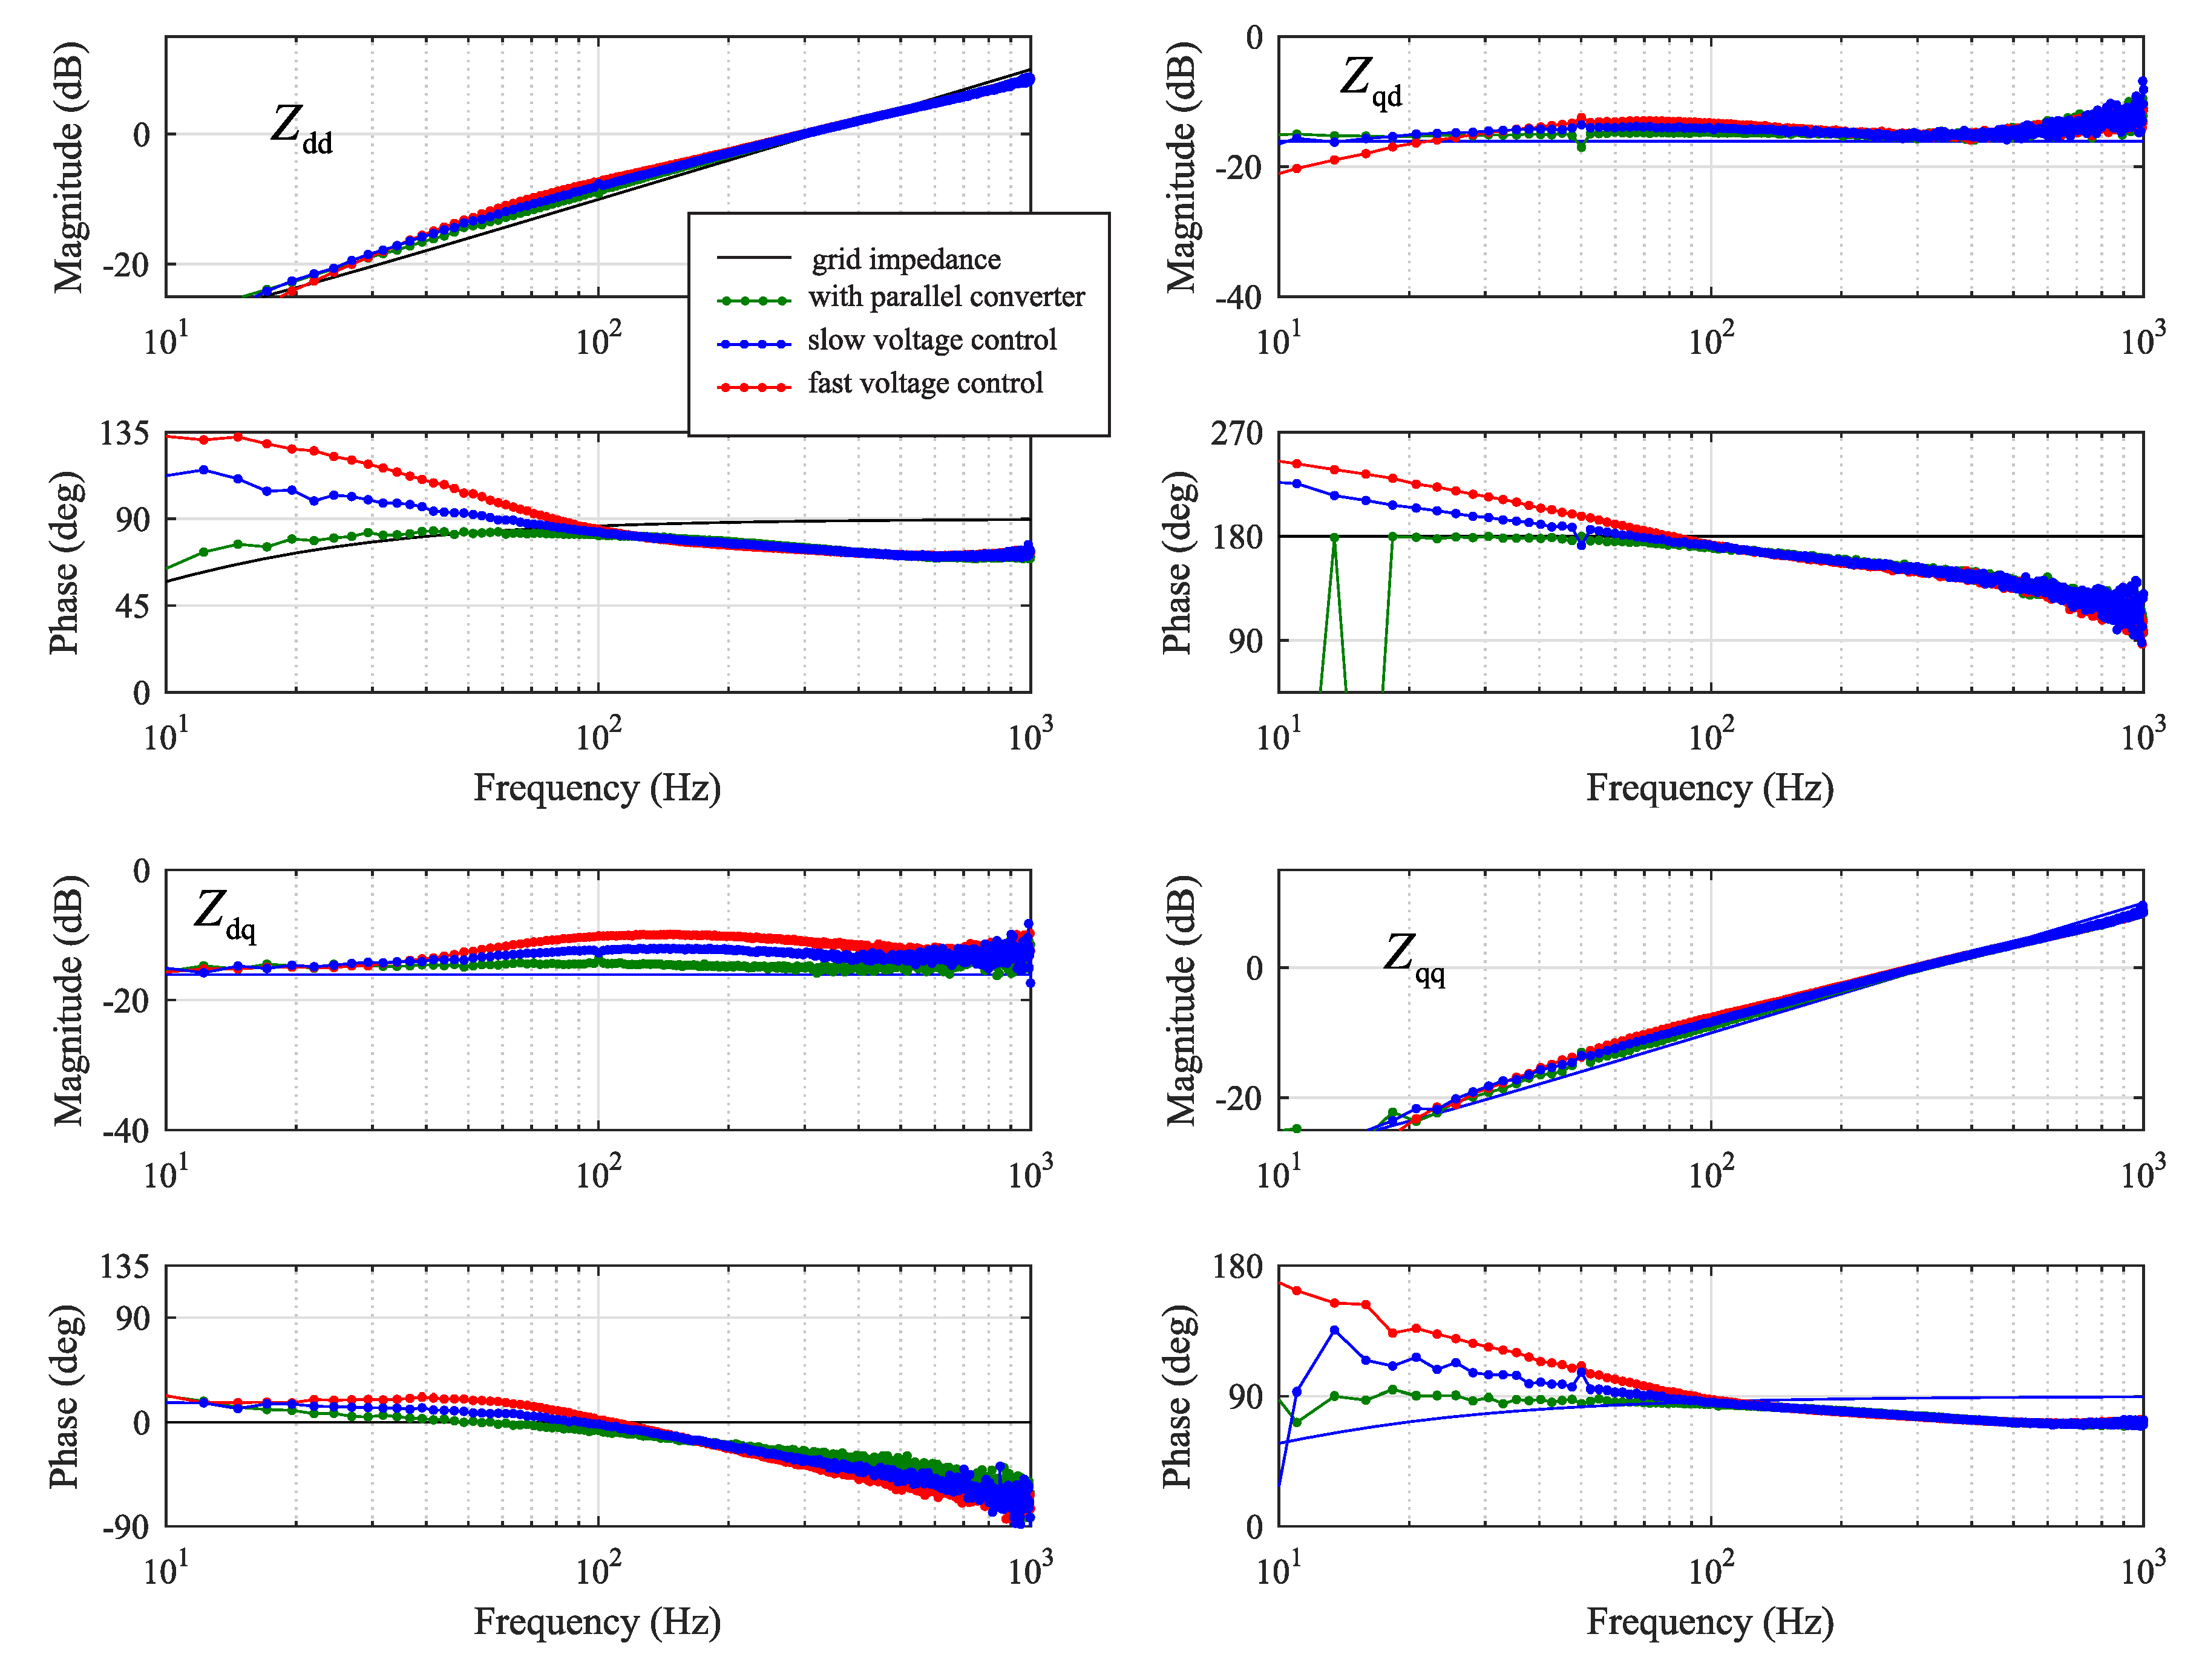
5.5. Effect of Parallel Converter with Grid Voltage Control
The effect of a parallel microgrid converter with voltage support function was studied by setting the switch position in Figure 10 to the lower position and setting the droop gain equal to zero. The voltage support function provides capacitive current when the grid voltage drops below the reference and inductive current if the grid voltage goes over this limit. A low-pass filter was used to filter out noise from the measured grid voltage d-component.
The identified grid impedance in the presence of a parallel current-controlled converter with voltage support function is shown in Figure 14. The effect of voltage support dominates the impedance in the low frequency range. The phase-error at high frequencies is still evident in the direct component , which is caused by insufficient decoupling in the current control of converter G4. However, now also the phase at low frequencies has large error due to voltage control. Fast voltage control causes significant phase-lead in the direct component within its bandwidth. The same behavior is observed in cross-coupling component and quadrature component . The cross-coupling component has the least effect on its phase. However, the magnitude has error around middle frequencies, which was also found to be affected by the low-pass filter. Decreasing the cutoff frequency of the low-pass filter would improve the magnitude–accuracy of component .
The results clearly show that grid impedance measurement may fail critically when there is a parallel converter with grid voltage support function. However, the amount of error depends on the bandwidth of the voltage supporting controller. Controllers tuned to act fast in the presence of faults are generally tuned to have high bandwidth; and controllers tuned for enhancing power transmission capability have generally much lower bandwidth.
5.6. Effect of Parallel Converter with Grid Voltage Control and Droop Gain
The effect of droop coefficient was studied by setting the droop gain in Figure 10 to a nonzero value. Droop gain is a widely used method to solve the stability issues of several parallel converters with voltage supporting function. Without droop there would be several voltage controllers fighting to control the same voltage. However, the droop allows driving the proportional-integral (PI) controller error signal to zero even if the actual voltage amplitude at the grid interface differs from the internal reference .
The voltage controller was left at the fast setting and droop gain was varied between zero and 0.2. The identified impedance components are shown in Figure 15. The higher the droop gain, the less effect the voltage control has on the identified impedance. The phase-error is clearly reduced in impedance components , , and when the value of droop gain is increased. The effect can be understood by considering the purpose of the droop gain, that is, it reduces the effect of voltage control on the grid voltage at the interface point. Thus, with higher droop gain, less error is introduced in the identified grid impedance.
5.7. Summary
Based on the results above, several factors affecting grid impedance in the presence of parallel converter identification accuracy were found:
- PLL should be tuned very slow, or a separate PLL should be dedicated only for the purpose of impedance measurement. However, if a separate PLL is not available, the grid inductance and resistance should be estimated based on identified direct and quadrature components, since cross-coupling components may experience significant phase-error.
- Leaking of injection current from d-component to q-component causes error mainly in the phase of identified cross-coupling components. This can be somewhat reduced by adjusting decoupling gains inside the current control of the inverter that is generating the injection.
- A parallel current-controlled converter causes slight phase-error of the direct and quadrature impedance components and . However, the cross-coupling components and are more accurately identified. The effect could be counteracted by optimizing the decoupling gains inside the current controller of the inverter that is supplying the injection.
- Fast voltage control in the parallel converter affects the accuracy of all the identified impedance components. Voltage control easily causes phase-error at low frequencies, which extends up to ten times its bandwidth. In the case of a parallel converter with both current control and voltage support function, the phase of direct and quadrature components of identified impedance may not provide useful information for, e.g., adaptive control routines, due to large phase-error.
- Adding a droop gain to the voltage support function counteracted the errors imposed by the voltage control. Thus, in the case of large droop gain in the parallel converter, the grid impedance can be identified more accurately.
6. Conclusions
This paper discusses challenges related to online grid impedance identification using a grid-connected three-phase inverter as the source of injection. The paper shows how a parallel-connected converter affects the accuracy of the identified grid impedance. It is shown that the SRF-PLL used in generating the reference frame for measured currents and voltage in the dq-domain has a major impact on accuracy. Moreover, the current control of the parallel converter was shown to cause phase-error mainly in direct and quadrature component of identified impedance. Furthermore, it was shown that voltage support function in a parallel converter may have a severe effect on accuracy of impedance identification. However, a droop gain in the parallel converter may counteract to reduce the errors.
Author Contributions
Conceptualization, T.M., T.R., and A.B.; methodology, T.M. and R.L.; software, T.R., R.L., H.A., and A.F.; validation, R.L. and T.M.; formal Analysis, T.M. and R.L.; resources, E.d.J.; writing—original draft, R.L. and T.M.; writing—review and editing, H.A.; visualization, T.M.; supervision, T.M. and E.d.J.; project administration, T.M. and E.d.J.; funding acquisition, T.M., T.R., and E.d.J.
Funding
This research and testing has been performed using the ERIGrid Research Infrastructure, and is part of a project that has received funding from the European Union’s Horizon 2020 Research and Innovation Programme under Grant Agreement Number 654113. The support of the European Research Infrastructure ERIGrid and its partner DNVGL is very much appreciated. Moreover, part of the study was funded by the Academy of Finland (Mitigation of harmonic resonances in three-phase renewable energy systems, grant number 297054).
Acknowledgments
The authors would like to express their gratitude to the rest of the staff of DNV-GL—especially, for the friendly atmosphere and all the ideas and conversations that helped to formulate the research topic and main outcomes.
Conflicts of Interest
The authors declare no conflict of interest.
References
- IPCC. 2018: Global Warming of 1.5C. In An IPCC Special Report on the Impacts of Global Warming of 1.5C Above Pre-Industrial Levels and Related Global Greenhouse Gas Emission Pathways, in the Context of Strengthening the Global Response to the Threat of Climate Change, Sustainable Development, and Efforts to Eradicate Poverty, Report; IPCC: Geneva, Switzerland, 2018. [Google Scholar]
- Jessen, L.; Fuchs, F.W. Modeling of inverter output impedance for stability analysis in combination with measured grid impedances. In Proceedings of the 2015 IEEE 6th International Symposium on Power Electronics for Distributed Generation Systems (PEDG), Aachen, Germany, 22–25 June 2015; pp. 1–7. [Google Scholar]
- Li, C. Unstable Operation of Photovoltaic Inverter from Field Experiences. IEEE Trans. Power Deliv. 2018, 33, 1013–1015. [Google Scholar] [CrossRef]
- Zou, C.; Rao, H.; Xu, S.; Li, Y.; Li, W.; Chen, J.; Zhao, X.; Yang, Y.; Lei, B. Analysis of Resonance Between a VSC-HVDC Converter and the AC Grid. IEEE Trans. Power Electron. 2018, 33, 10157–10168. [Google Scholar] [CrossRef]
- Suntio, T.; Messo, T.; Puukko, J. Power Electronic Converters: Dynamics and Control in Conventional and Renewable Energy Applications; Wiley-VCH: Weinheim, Germany, 2017; pp. 633–661. ISBN 978-3-527-34022-4. [Google Scholar]
- Luhtala, R.; Roinila, T.; Messo, T. Implementation of real-time impedance-based stability assessment of grid-connected systems using MIMO-identification techniques. IEEE Trans. Ind. Appl. 2018, 54, 5054–5063. [Google Scholar] [CrossRef]
- Luhtala, R.; Roinila, T.; Messo, T. Adaptive control of grid-voltage feedforward for grid-connected inverters based on real-time identification of grid impedance. In Proceedings of the 2018 International Power Electronics Conference (IPEC-Niigata 2018-ECCE Asia), Niigata, Japan, 20–24 May 2018; pp. 1–8. [Google Scholar]
- Messo, T.; Jokipii, J.; Mäkinen, A.; Suntio, T. Modeling the grid synchronization induced negative-resistor-like behavior in the output impedance of a three-phase photovoltaic inverter. In Proceedings of the 2013 4th IEEE International Symposium on Power Electronics for Distributed Generation Systems (PEDG), Rogers, AR, USA, 8–11 July 2013. [Google Scholar]
- Messo, T.; Luhtala, R.; Aapro, A.; Roinila, T. Accurate impedance model of grid-connected inverter for small-signal stability assessment in high-impedance grids. IEEJ J. Ind. Appl. 2019, 8, 488–496. [Google Scholar] [CrossRef]
- Lorenzen, S.L.; Nielsen, A.B.; Bede, L. Control of a grid connected converter during weak grid conditions. In Proceedings of the 2016 IEEE 7th International Symposium on Power Electronics for Distributed Generation Systems (PEDG), Vancouver, BC, Canada, 27–30 June 2016; pp. 1–6. [Google Scholar]
- Roinila, T.; Messo, T.; Suntio, T.; Vilkko, M. Pseudo-Random Sequences in DQ-Domain Analysis of Feedforward Control in Grid-Connected Inverters. Proc. IFAC Symp. Syst. Identif. 2015, 48, 1301–1306. [Google Scholar] [CrossRef]
- Roinila, T.; Messo, T.; Santi, E. MIMO-Identification Techniques for Rapid Impedance-based Stability Assessment of Three Phase Systems in DQ Domain. IEEE Trans. Power Electron. 2018, 33, 4015–4022. [Google Scholar] [CrossRef]
- Tan, A.H.; Godfrey, K.R. Industrial Process Identification—Perturbation Signal Design and Applications; Springer Nature: Basel, Switzerland, 2019. [Google Scholar]
- Sun, J.; Li, M.; Zhang, Z.; Xu, T.; He, J.; Wang, H.; Li, G. Renewable energy transmission by HVDC across the continent: System challenges and opportunities. CSEE J. Power Energy Syst. 2017, 3, 353–364. [Google Scholar] [CrossRef]
- Messo, T.; Luhtala, R.; Roinila, T.; de Jong, E.; Scharrenberg, R.; Caldognetto, T.; Mattavelli, P.; Sun, Y.; Fabian, A. Using high-bandwidth voltage amplifier to emulate grid-following inverter for AC microgrid dynamics studies. Energies 2019, 12, 379. [Google Scholar] [CrossRef]
- Chung, S.-K. A phase tracking system for three phase utility interface inverters. IEEE Trans. Power Electron. 2000, 15, 431–438. [Google Scholar] [CrossRef]
Figure 1.
True grid current versus the available measurement point used in determination of grid impedance.
Figure 1.
True grid current versus the available measurement point used in determination of grid impedance.

Figure 2.
Three orthogonal binary sequences in the time and frequency domain.
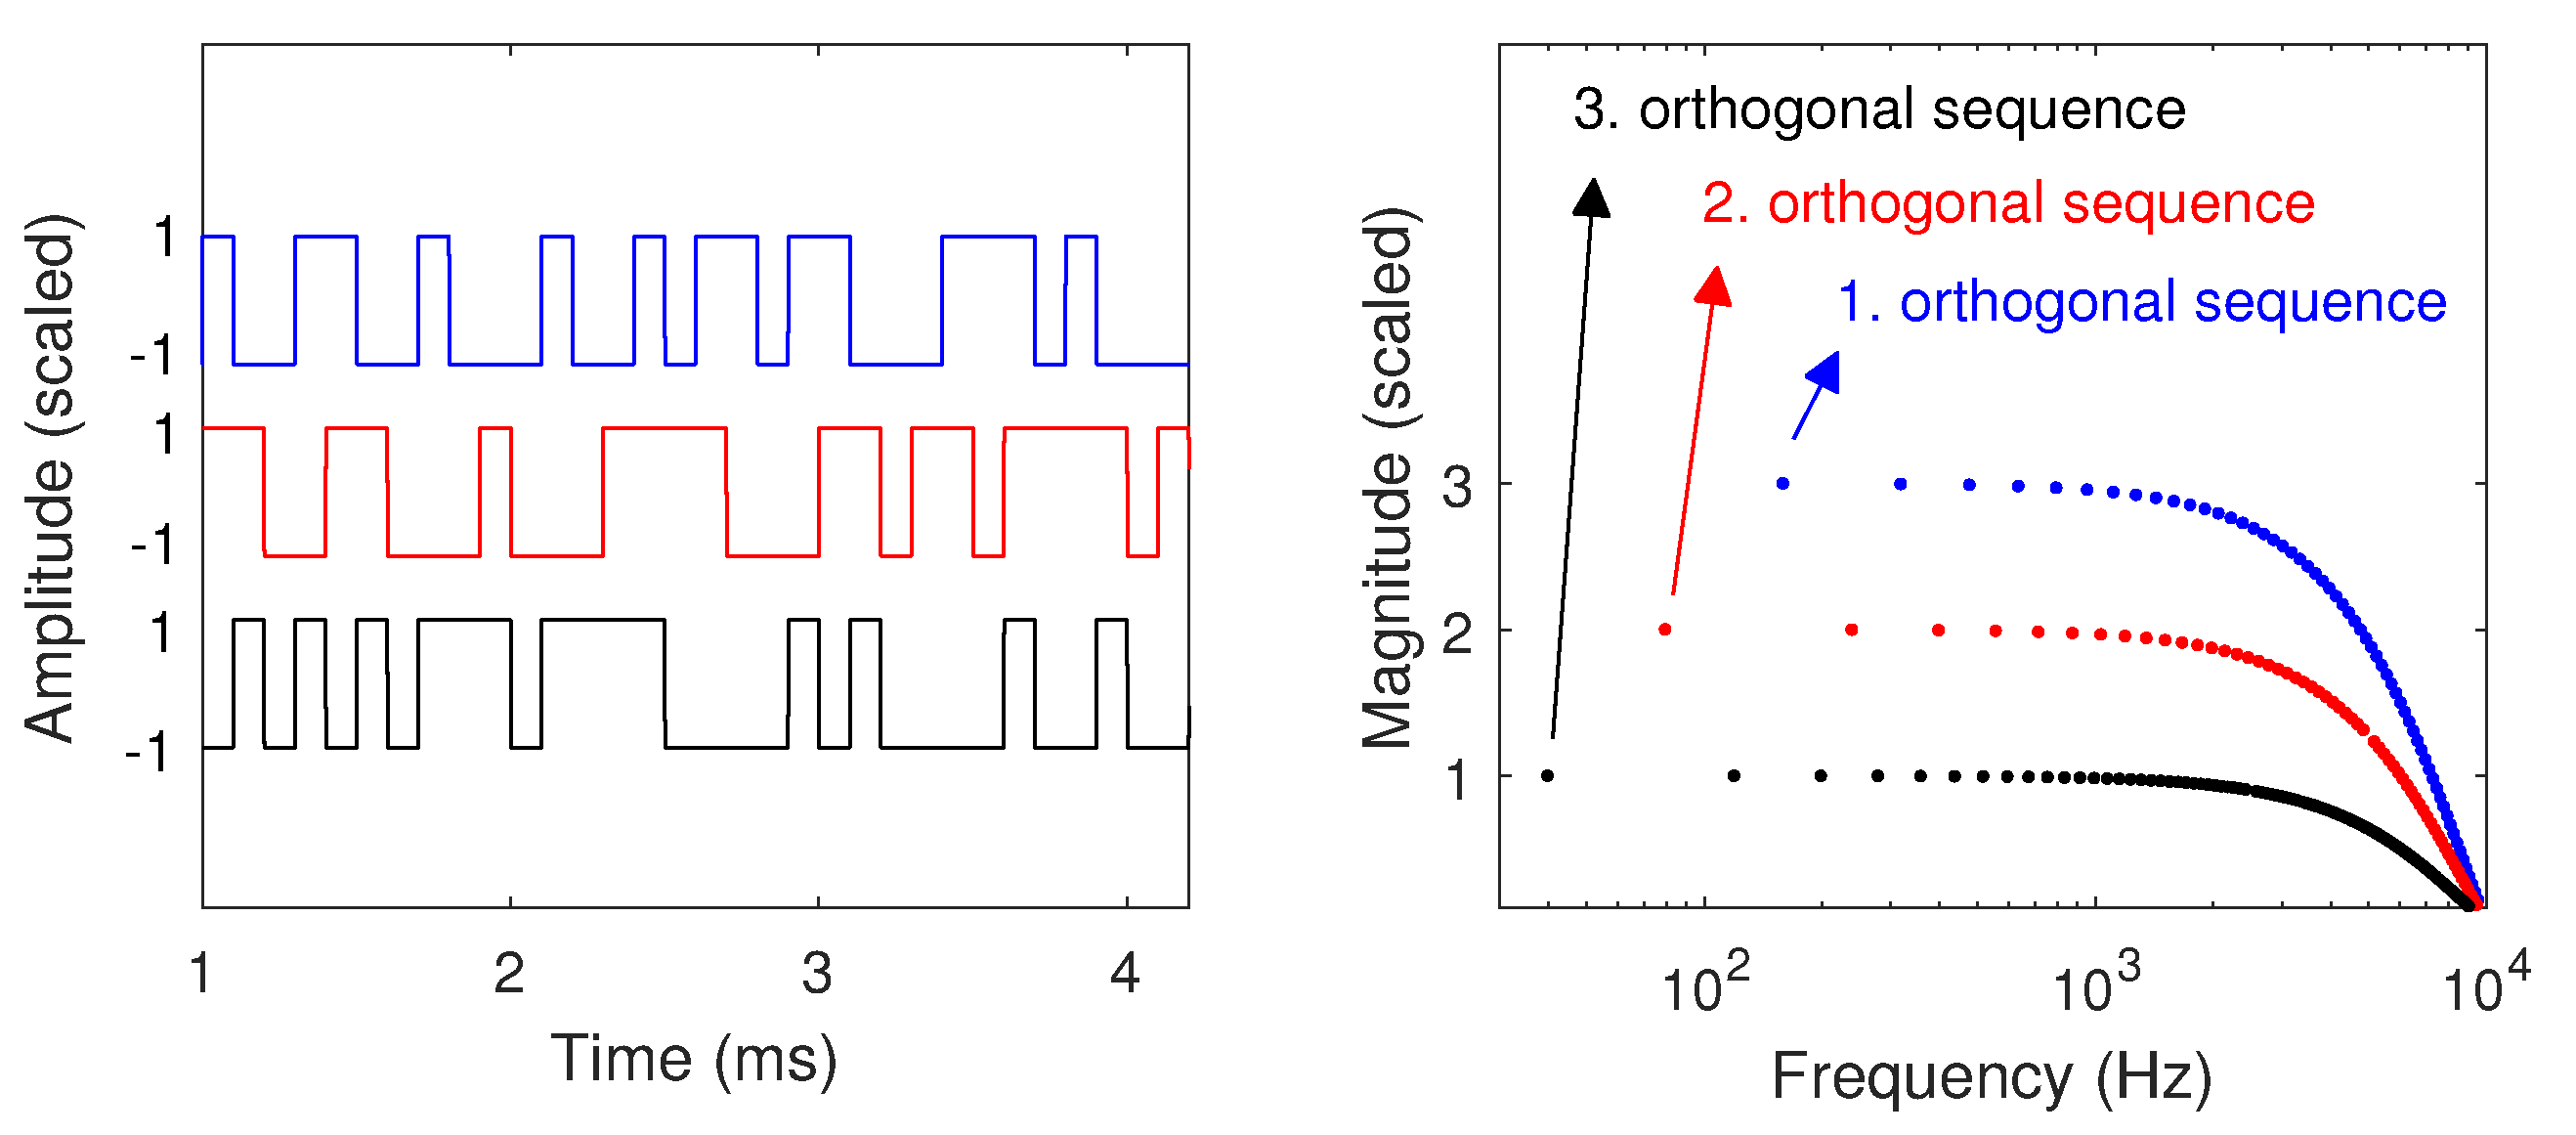
Figure 3.
Circuit diagram of three-phase resistive–inductive grid.
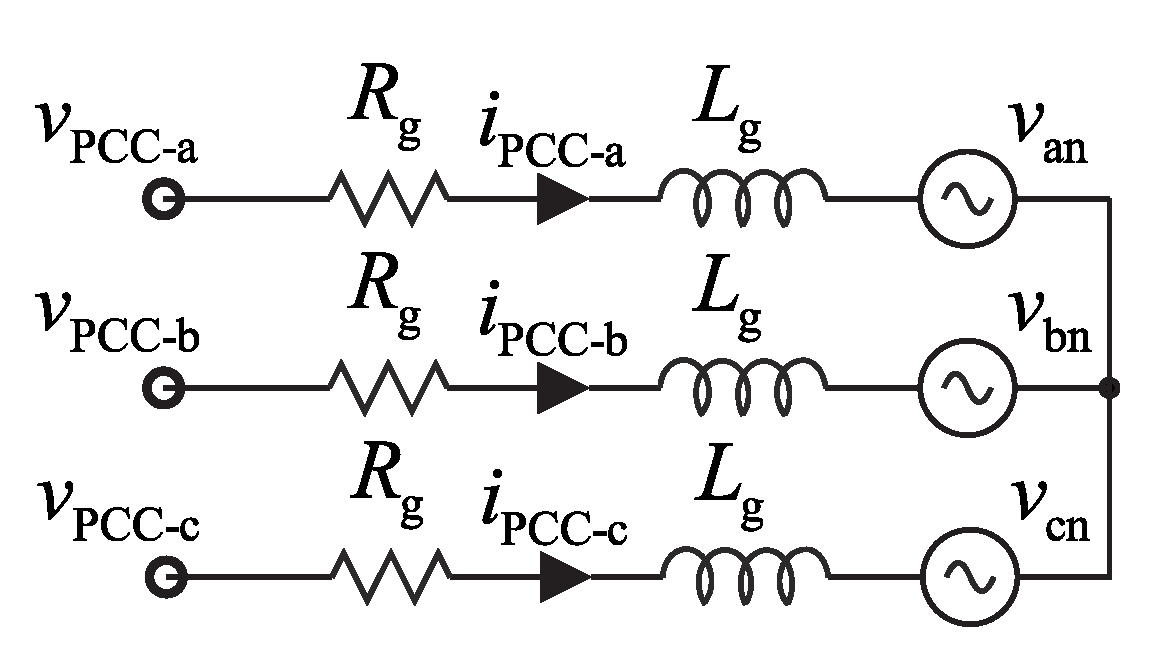
Figure 4.
Schematic of power hardware-in-the-loop (PHIL) setup at Flexible Power Grid Lab.

Figure 5.
Measurement setup to extract reference measurement of grid impedance.

Figure 6.
Measured and modeled grid impedance in dq-domain when amplifier group number 1 is configured to operate in current control mode and used to inject the excitation signal.
Figure 6.
Measured and modeled grid impedance in dq-domain when amplifier group number 1 is configured to operate in current control mode and used to inject the excitation signal.

Figure 7.
Measured frequency response of amplifier injection input to output in dq-domain.

Figure 8.
Overview of two voltage amplifiers configured to emulate a converter connected to a grid with finite impedance.
Figure 8.
Overview of two voltage amplifiers configured to emulate a converter connected to a grid with finite impedance.
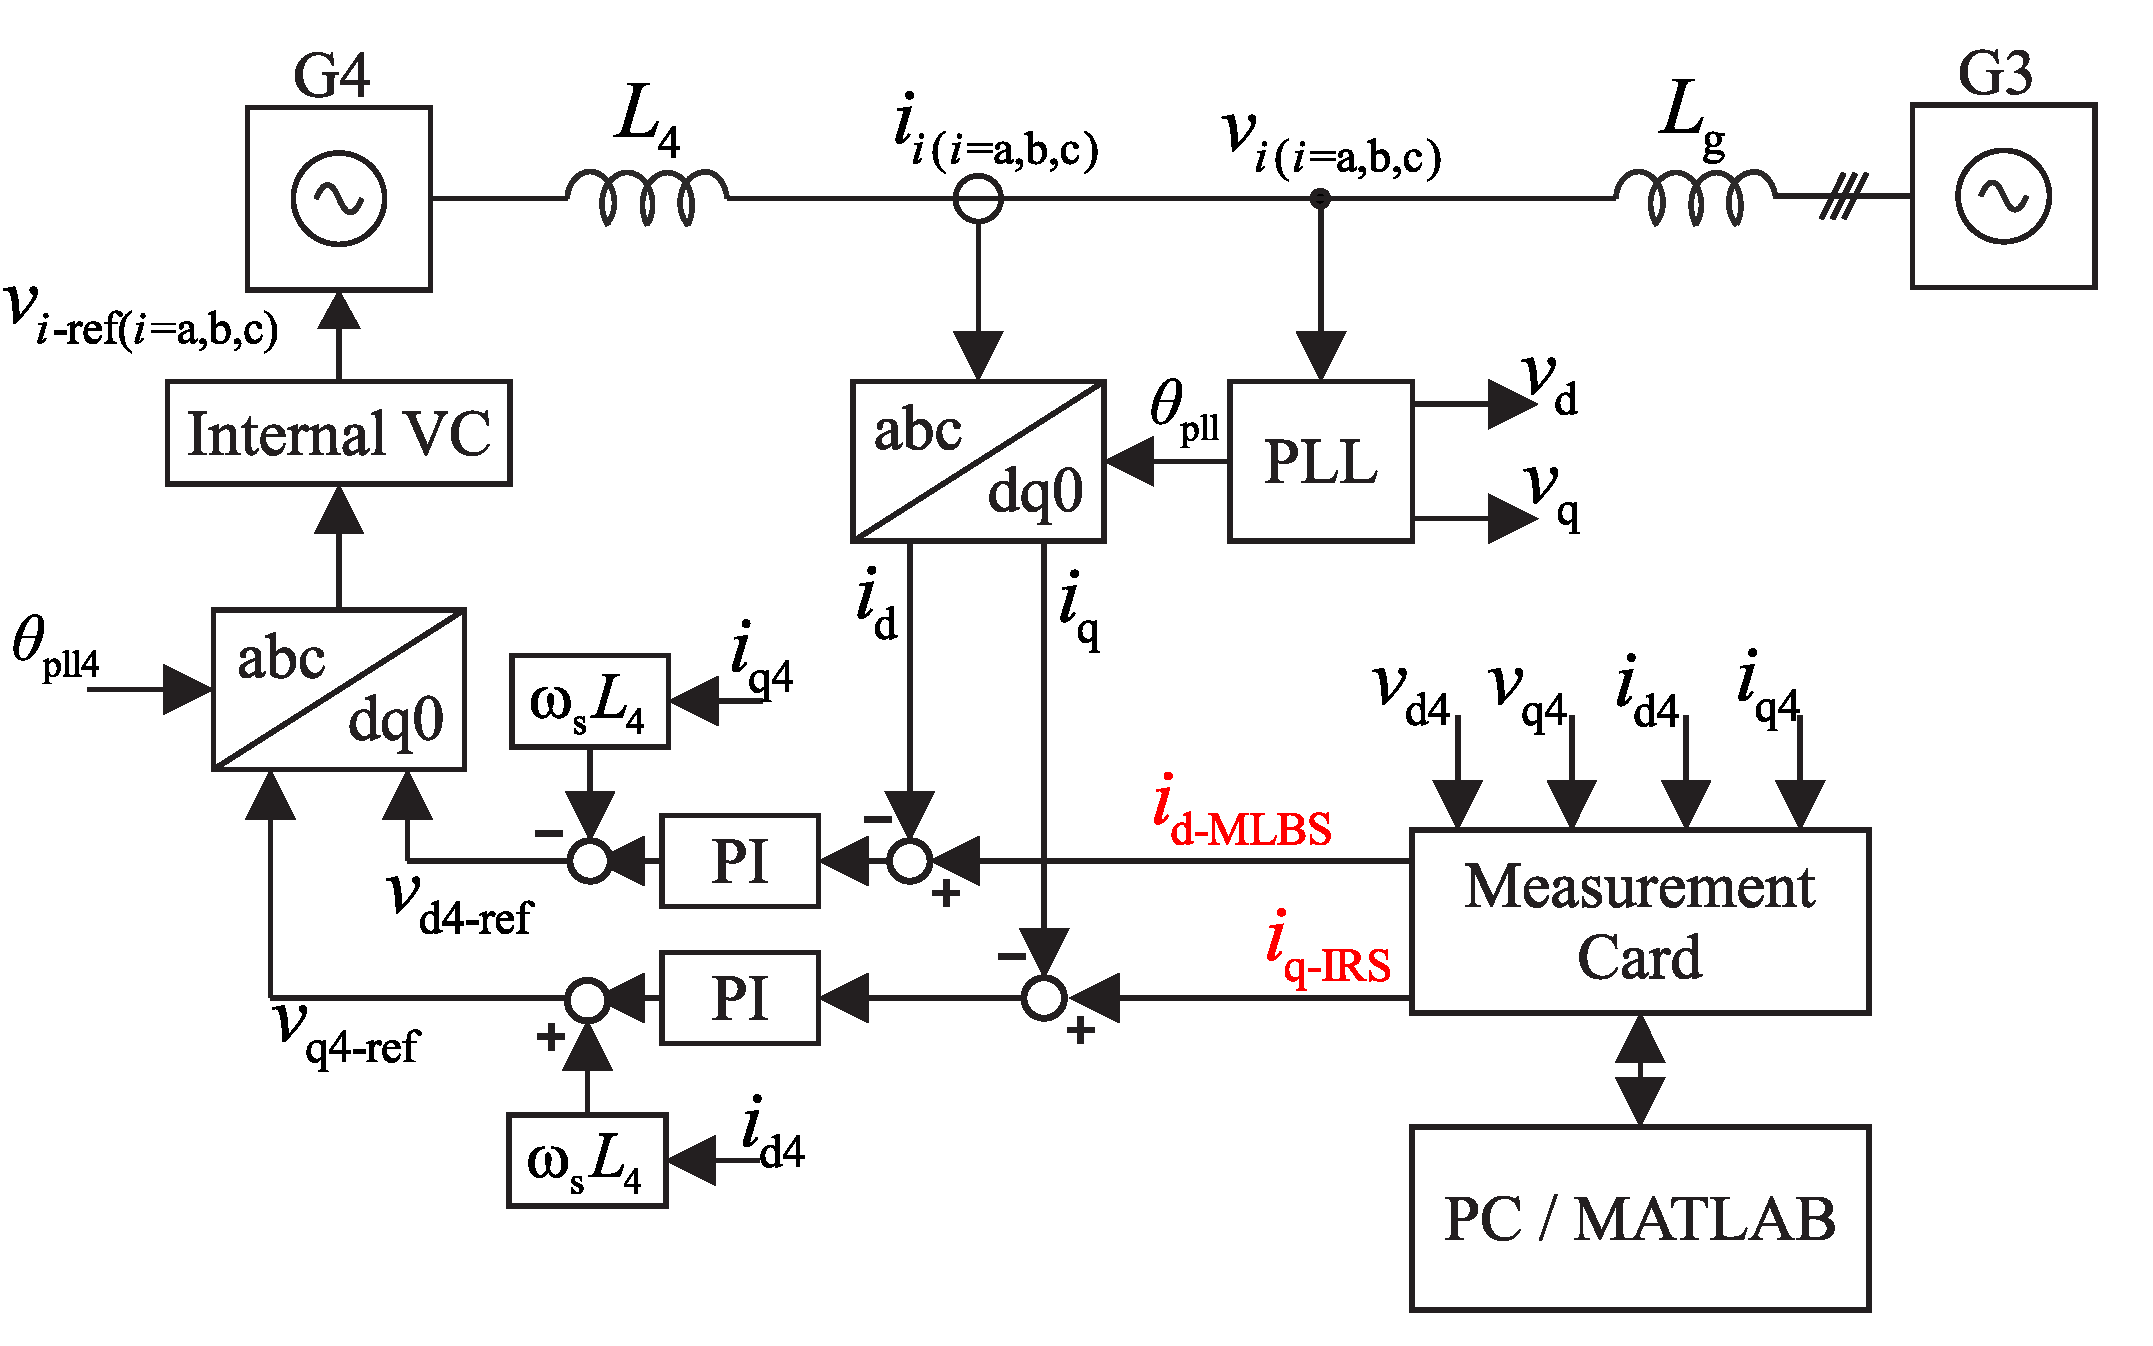
Figure 9.
Impedance components extracted using the emulated inverter as an excitation source with different phase-locked-loop (SRF-PLL) crossover frequencies.
Figure 9.
Impedance components extracted using the emulated inverter as an excitation source with different phase-locked-loop (SRF-PLL) crossover frequencies.
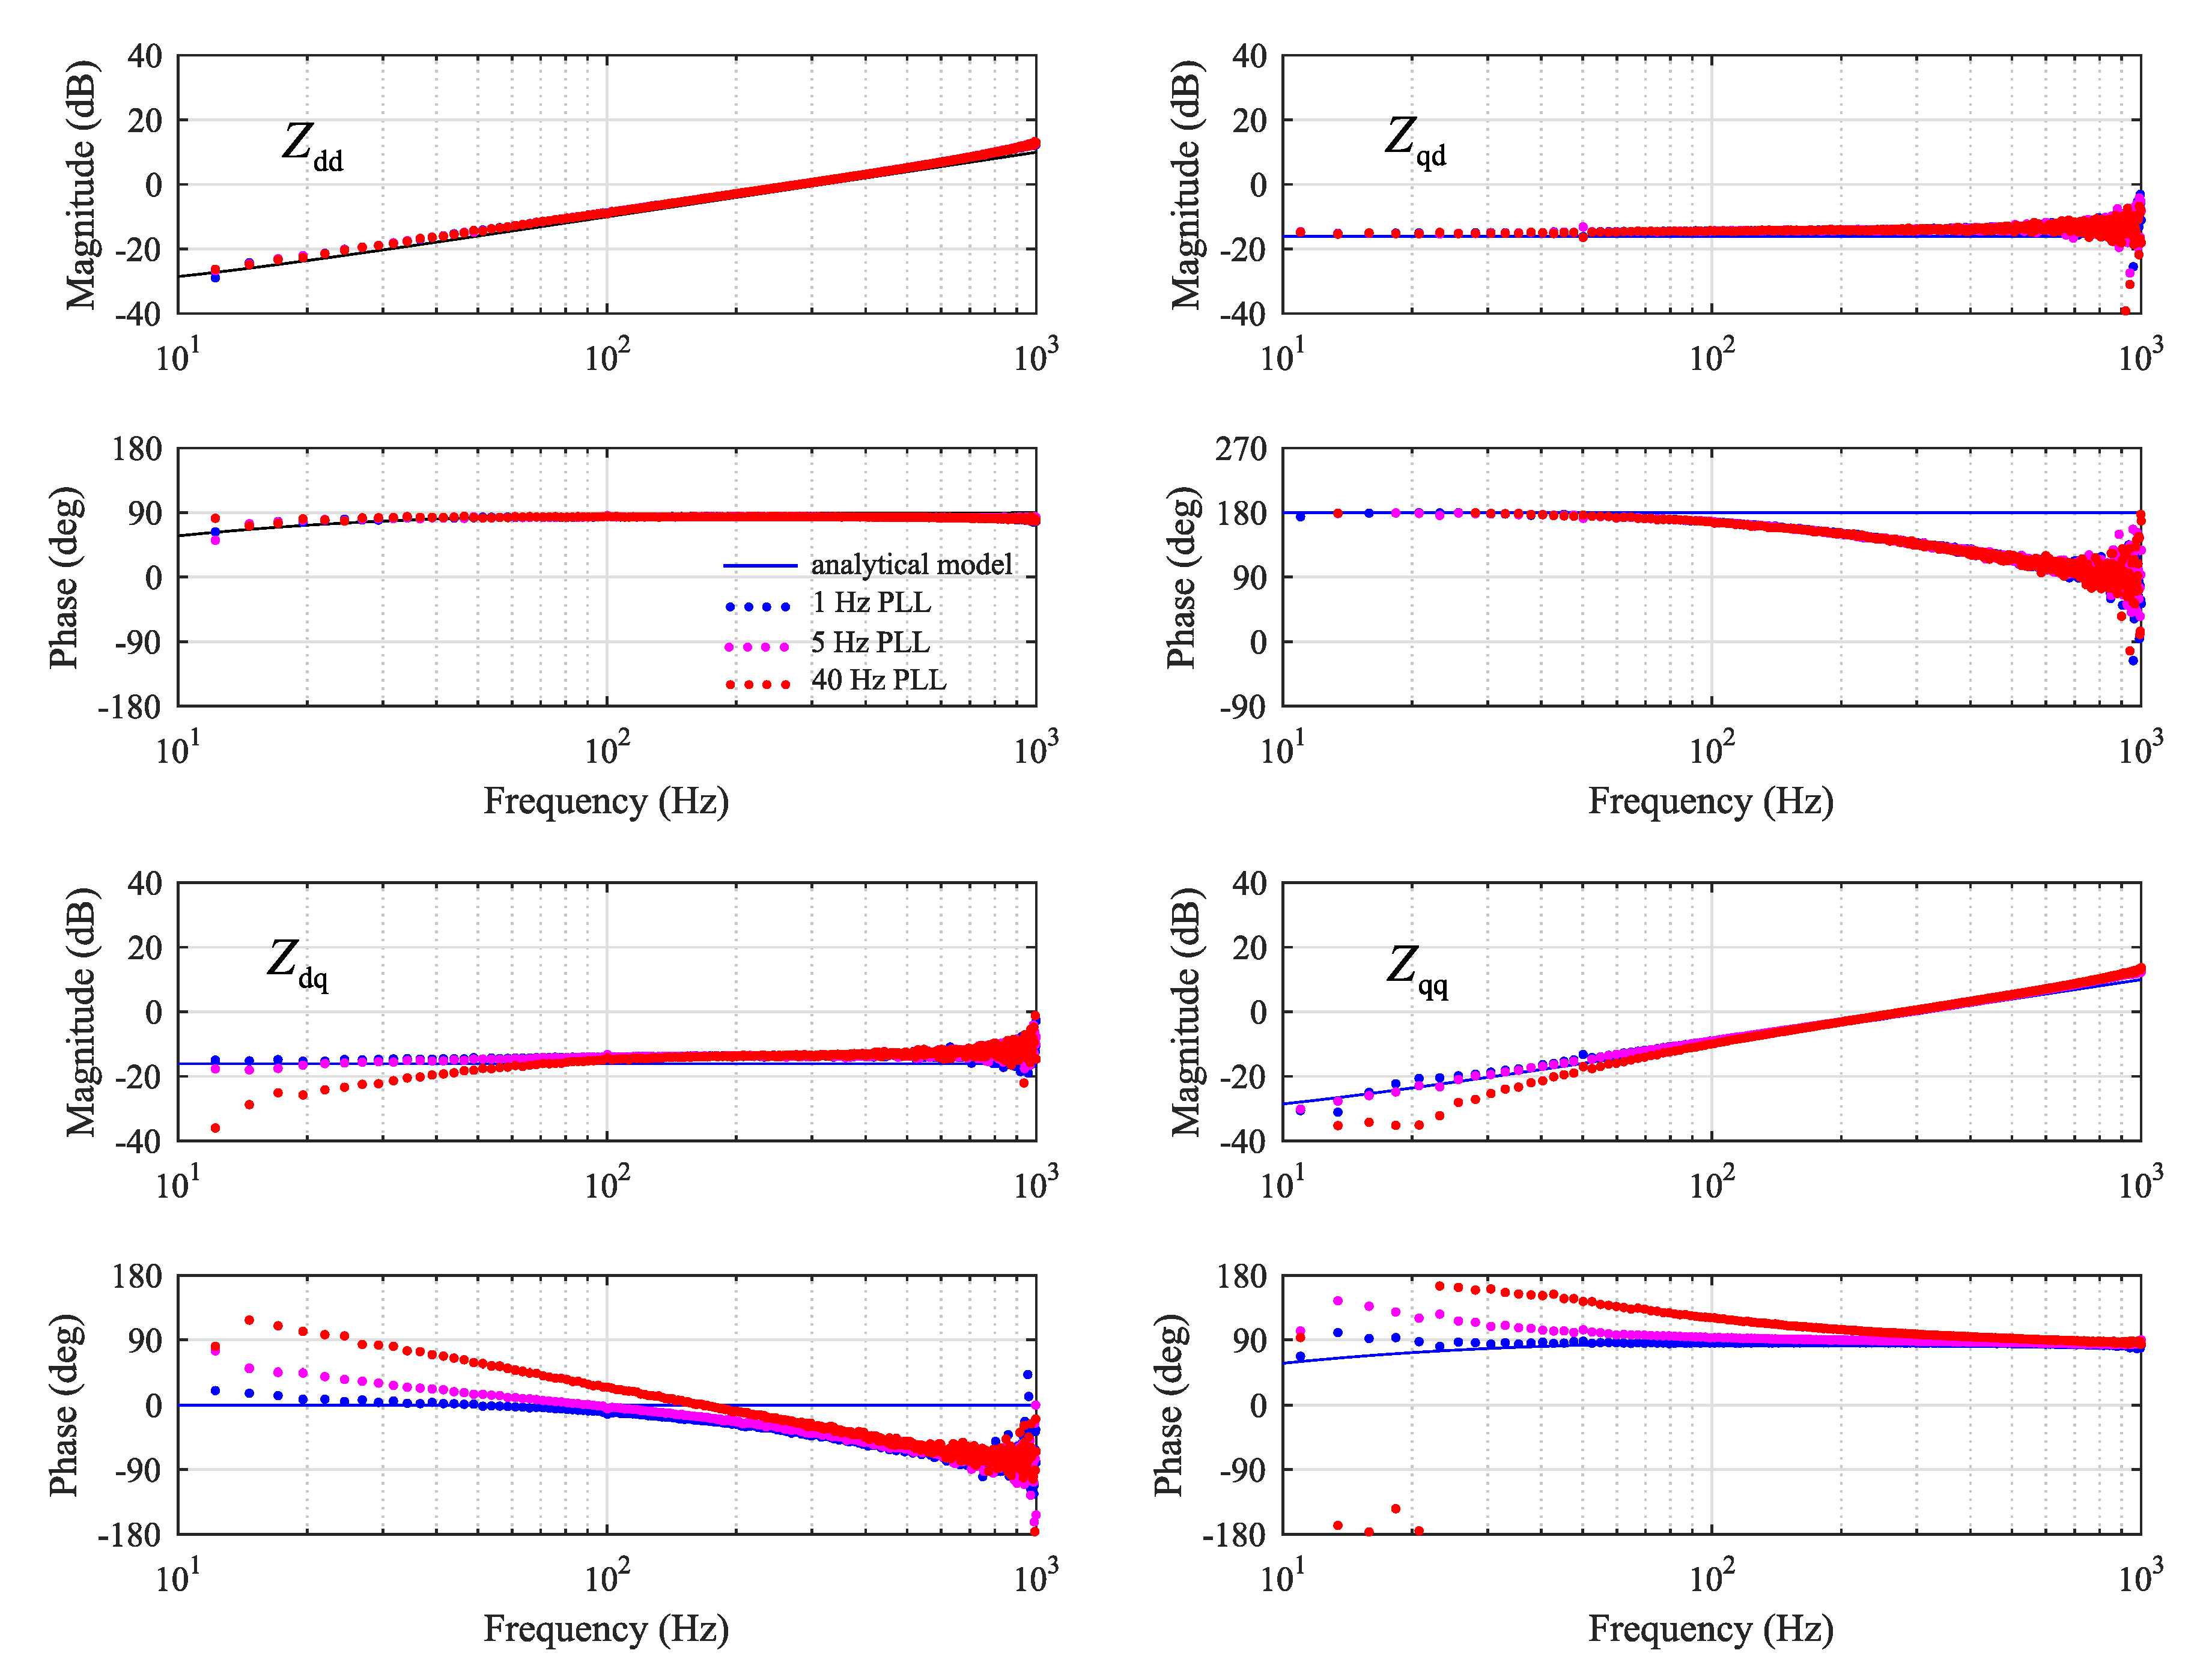
Figure 10.
Layout of the measurement setup to study the effect of control functions of a parallel converter.
Figure 10.
Layout of the measurement setup to study the effect of control functions of a parallel converter.

Figure 11.
Waveforms at the grid interface (a) without and (b) with the MIMO injection signal added to converter G4 output current references.
Figure 11.
Waveforms at the grid interface (a) without and (b) with the MIMO injection signal added to converter G4 output current references.
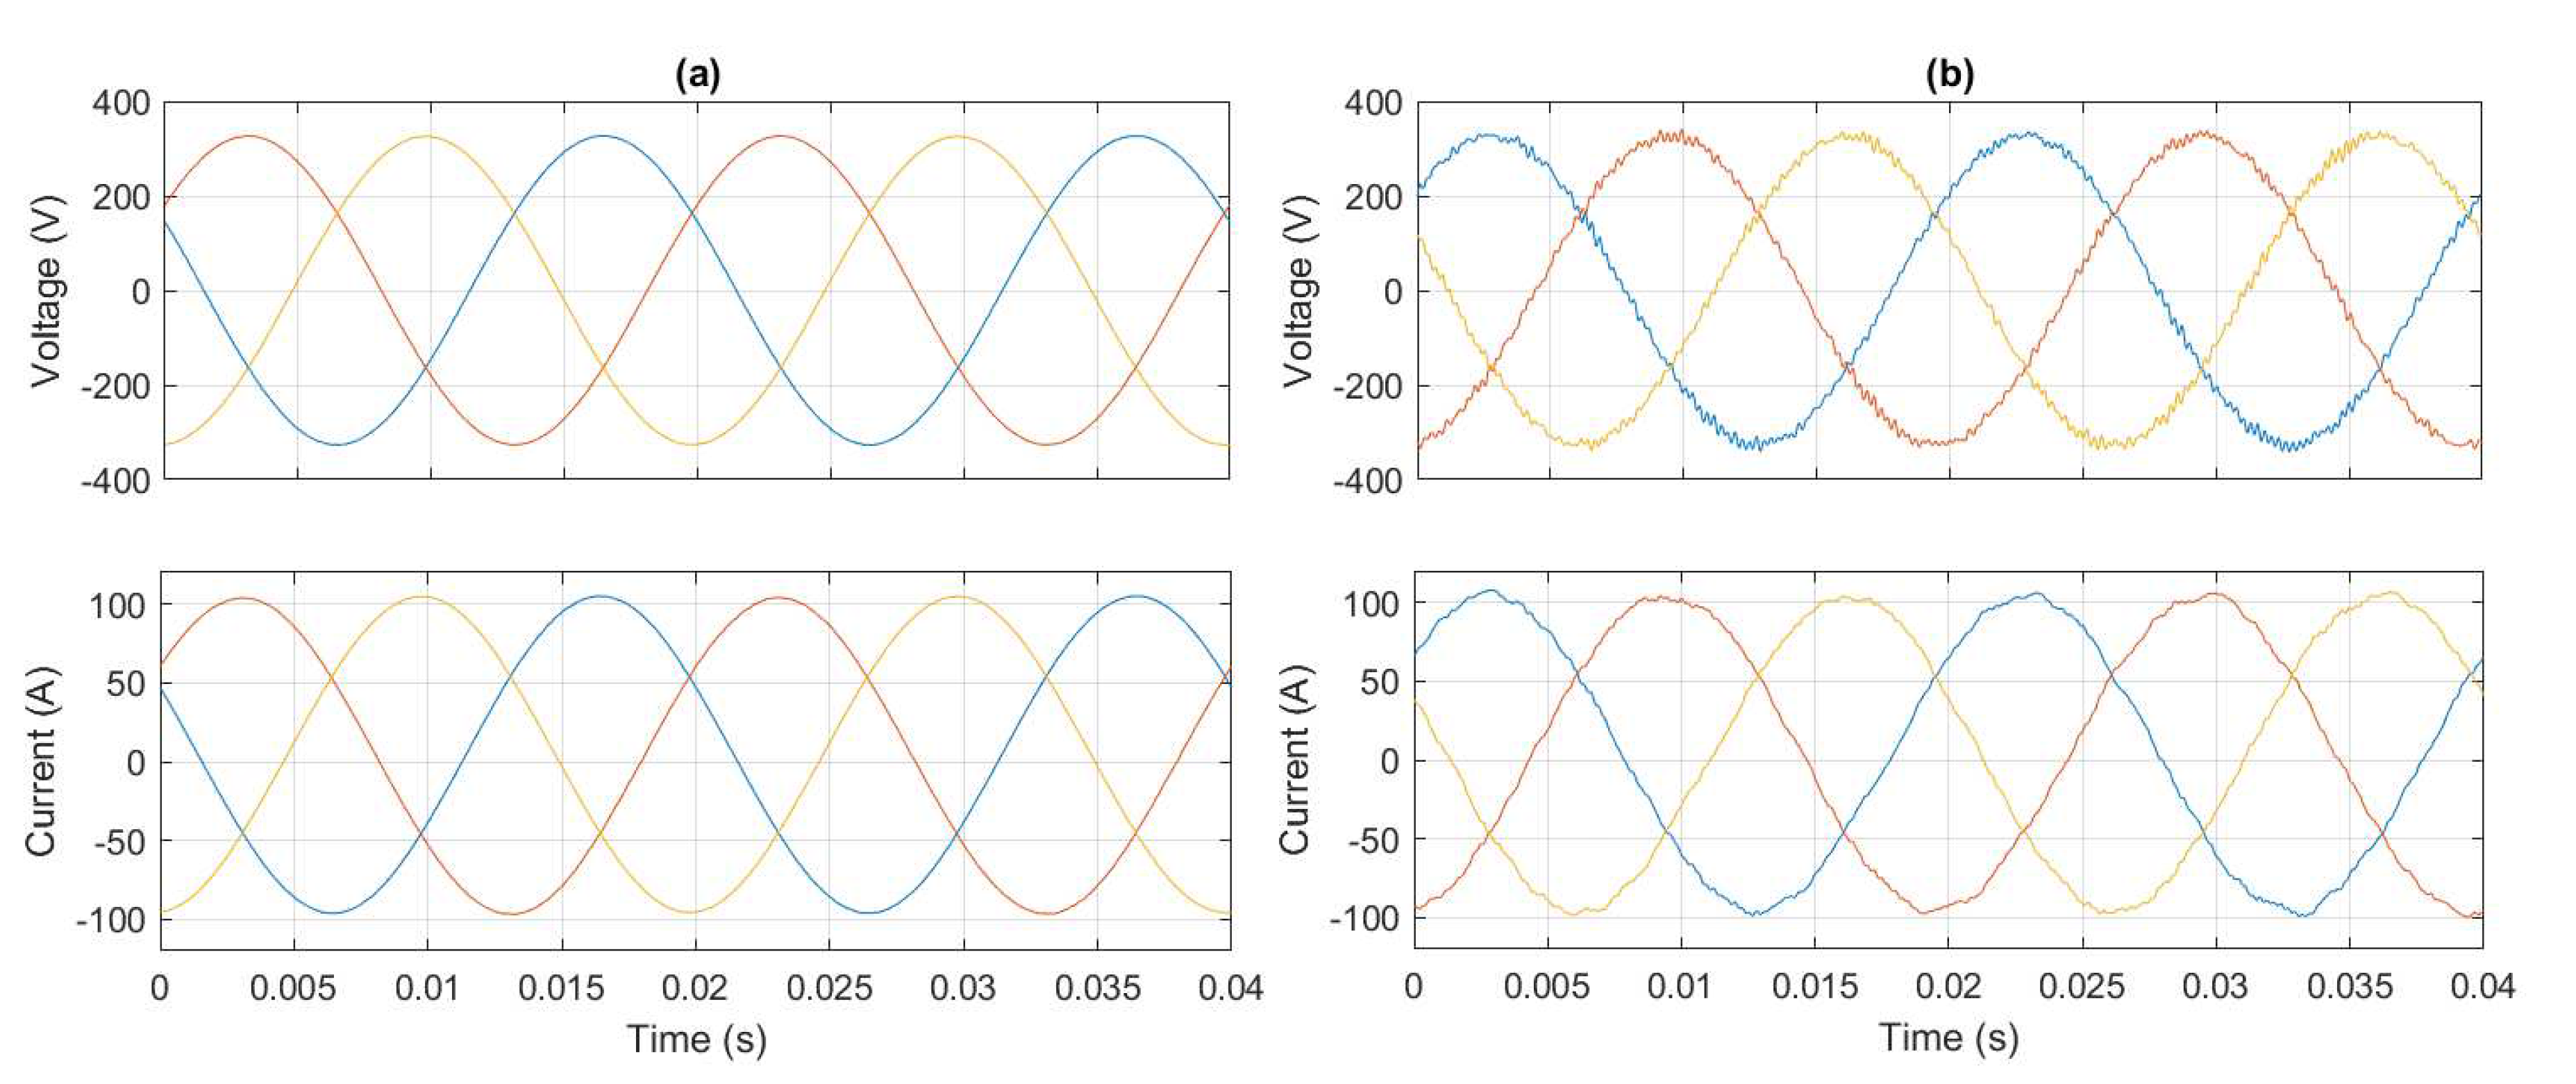
Figure 12.
Dq-domain variables (a) without and (b) with the injection.

Figure 13.
Measured impedance with parallel-connected current-controlled device.

Figure 14.
Measured impedance with parallel-connected device with additional voltage control.

Figure 15.
Measured impedancewith parallel-connected device with additional voltage control and droop.
Figure 15.
Measured impedancewith parallel-connected device with additional voltage control and droop.

© 2019 by the authors. Licensee MDPI, Basel, Switzerland. This article is an open access article distributed under the terms and conditions of the Creative Commons Attribution (CC BY) license (http://creativecommons.org/licenses/by/4.0/).
Share and Cite
MDPI and ACS Style
Luhtala, R.; Messo, T.; Roinila, T.; Alenius, H.; de Jong, E.; Burstein, A.; Fabian, A. Identification of Three-Phase Grid Impedance in the Presence of Parallel Converters. Energies 2019, 12, 2674. https://doi.org/10.3390/en12142674
AMA Style
Luhtala R, Messo T, Roinila T, Alenius H, de Jong E, Burstein A, Fabian A. Identification of Three-Phase Grid Impedance in the Presence of Parallel Converters. Energies. 2019; 12(14):2674. https://doi.org/10.3390/en12142674
Chicago/Turabian StyleLuhtala, Roni, Tuomas Messo, Tomi Roinila, Henrik Alenius, Erik de Jong, Andrew Burstein, and Alejandra Fabian. 2019. "Identification of Three-Phase Grid Impedance in the Presence of Parallel Converters" Energies 12, no. 14: 2674. https://doi.org/10.3390/en12142674
Note that from the first issue of 2016, this journal uses article numbers instead of page numbers. See further details here.