Allocation of Ontario’s Surplus Electricity to Different Power-to-Gas Applications
by
 and
and
Suaad S. Al-Zakwani
1, 
Azadeh Maroufmashat
1,*, 
Abdelkader Mazouz
2,
Michael Fowler
1 and
and
Ali Elkamel
1,3,* 1
Department of Chemical Engineering, University of Waterloo, Waterloo, ON N2L 3G1, Canada
2
College of Business, Al Ain University of Science and Technology, Al Ain 64141, UAE
3
Department of Chemical Engineering, Khalifa University, Abu Dhabi 127788, UAE
*
Authors to whom correspondence should be addressed.
Energies 2019, 12(14), 2675; https://doi.org/10.3390/en12142675
Submission received: 16 June 2019
/
Revised: 5 July 2019
/
Accepted: 8 July 2019
/
Published: 12 July 2019
(This article belongs to the Special Issue Sustainable Hydrogen Production, Storage and Utilization)
Abstract
:Power-to-Gas (PtG) is a potential means of managing intermittent and weather-dependent renewable energies to create a storable chemical energy form. Power-to-Gas is not only a storage technology; its role can be extended to many other applications including energy distribution, transportation, and industrial use. This study quantifies the hydrogen volumes upon utilizing Ontario, Canada’s surplus electricity baseload and explores the allocation of the hydrogen produced to four Power-to-Gas pathways in terms of economic and environmental benefits, focusing on the following Power-to-Gas pathways: Power-to-Gas to mobility fuel, Power-to-Gas to industry, Power-to-Gas to natural gas pipelines for use as hydrogen-enriched natural gas, and Power-to-Gas to renewable natural gas (i.e., Methanation). The study shows that the Power-to-Gas to mobility fuel pathway has the potential to be implemented. Utilization of hydrogen for refueling light-duty vehicles is a profitable business case with an average positive net present value of $4.5 billions, five years payback time, and 20% internal rate of return. Moreover, this PtG pathway promises a potential 2,215,916 tonnes of CO2 reduction from road travel.
1. Introduction
The demand for energy storage systems is increasing globally due to the continuous integration of green energy sources into electrical systems, aiming to reduce greenhouse gas impacts from fossil fuel-based power generation. The intermittent nature of renewable energy sources, however, creates a problem of excess electricity baseload during off-peak periods, when the supply of energy exceeds the demand. Therefore, a storage system is needed to deal with this. This baseload power variance is subsequently referred to as surplus baseload generation or excess electricity. In the Canadian province of Ontario, for example, there is no electricity market for utilizing surplus electricity, most of which is managed through electricity curtailment and export [1]. In 2017, about 19.1 TWh of energy was exported, and 3.3 TWh was curtailed, costing the province more than one million dollars in profits [2,3]. If the province were to have a surplus electricity utilization plan, surplus electricity could instead be used for greenhouse gases (GHG) reduction in other sectors.
The process of storing energy means capturing energy by converting it into accessible and economically storable forms. Electrical energy storage (EES) technologies are categorized into electrical, electrochemical, mechanical, chemical, and thermal energy storage systems [4], all with their own advantages and disadvantages [4]. Among different EES means available [4,5,6,7], Balibar et al. (2017) [8] claimed that the only practical method known and efficient at the huge national energy-consumption scale is Power-to-gas (PtG).
Power-to-Gas technology is one of the promising alternatives to end fossil-fuel reliance. The main concept behind Power-to-Gas technology is simply making use of surplus electricity to decompose water molecules into its primary components: hydrogen and oxygen. Hydrogen gas holds promise as an alternative carbon-free fuel that can be used for heating and lighting homes, electricity generating, vehicle fueling, and other related applications. Therefore, Power-to-Gas offers valuable energy pathways that can be applied for residential and industrial purposes. In almost all the pathways, the surplus electricity is converted to hydrogen via electrolysis as the first step. Then, the electrolyte hydrogen is either used directly for multiple applications, such as end-user applications (heating or generating electricity), and sold for industrial purposes, or further compressed to be used as zero-emission transportation fuel. As an alternative pathway, the energy carrier can also be stored or utilized to generate power again through gas turbines or fuel cells, called Power-to-Power. Additionally, combining green hydrogen with captured carbon dioxide to produce renewable natural gas (RNG)—in a process called ‘methanation’—is a promising means for utilizing carbon dioxide and increasing the renewable content of the natural gas grid.
Canada has started to adopt green-hydrogen energy, led by Hydrogenics, a global company that produces industrial and commercial hydrogen-generation systems [9]. Currently, there are two PtG facilities in Canada: (1) in Ontario, a 2-MW Power-to-Gas plant in the Greater Toronto Area was built and operated by Ontario’s Independent Electricity System Operator (IESO) with a collaborative by Hydrogenics and Enbridge in 2017; and (2) in Quebec, a 350-kW storage capacity was built in 2015 by TUGLIQ Energy Co, mainly as a Power-to-Power facility [10].
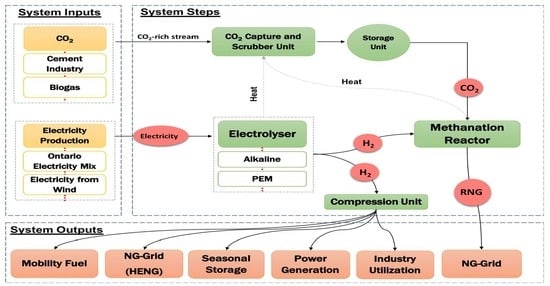
Electricity, the main input to the PtG systems, is converted to hydrogen via electrolysis. In addition, carbon dioxide captured from different sources is utilized in the methanation process to produce renewable natural gas. Figure 1 demonstrates the PtG process-chains inputs, outputs, and the final value streams. In fact, the importance of a Power-to-Gas system is based on its final “high value” hydrogen streams, which are starting to be competitive in different sectors because of their economic and environmental benefits.
The pathways can supply various applications: hydrogen for power generation, for transportation, for industrial applications, for heating buildings, and for generating power and hydrogen as an Industrial Feedstock.
These applications have been discussed widely in the literature. The majority of prior reports [11,12,13,14] have categorized the hydrogen streams as follows: (1) green fuel for mobility applications; (2) residential applications; (3) replacing fossil-based hydrogen in industry; and (4) long-term energy storage and distribution through the natural gas grid by injecting pure hydrogen or renewable natural gas into the natural gas system.
A large body of literature has explored the suitability of various PtG pathways for applications. Schiebahn et al. (2015) [15] assessed the achievability of three PtG process chains including (1) hydrogen injection into the natural gas grid; (2) RNG—from methanation—blending with conventional natural gas; and (3) renewable hydrogen utilization for transportation. The study confirmed that the PtG process chains need to be economically competitive to be attainable and applicable. Indeed, large-scale projects of the first two pathways are not economical yet, since the production costs of hydrogen or methane to be injected into the gas network is still high compared to the conventional natural gas production. However, utilization of renewable hydrogen as a fuel in the transportation sector is a promising and profitable business [15].
The current study investigated four specific Power-to-Gas pathways: Power-to-Gas to mobility fuel, Power-to-Gas to industry, Power-to-Gas to natural gas pipeline for use as hydrogen-enriched natural gas (HENG), and Power-to-Gas to Renewable Natural Gas i.e., Methanation. This study quantifies the hydrogen volumes at three production capacity factors (67%, 80%, and 96%) upon utilizing Ontario’s surplus electricity baseload. Five allocation scenarios (A–E) of the hydrogen produced to the four Power-to-Gas pathways are investigated and their economic and environmental aspects considered. Allocation scenario A in which hydrogen assigned to each pathway is constrained by a specific demand, is based on Ontario’s energy plans for pollution management in line with international efforts to reduce global warming impacts. Scenarios B–E are about utilization of the produced hydrogen entirely for one of mobility fuel, industrial feedstock, injection into the natural gas grid, or renewable natural gas synthesis, respectively. The study also examines the economic feasibility and carbon offset of the PtG pathways in each scenario.
2. Power-to-Gas Pathways
In this study, the following PtG pathways are used: Power-to-Gas to Mobility Fuel, Power-to-Gas to Industry, Power-to-Gas to Natural Gas Pipeline for use as HENG, and Power-to-Gas to Renewable Natural Gas (i.e., Methanation). The following subsections give a brief definition for each pathway.
2.1. Power-to-Gas Mobility Fuel
The implementation of electrolytic hydrogen in the mobility market is still in its early stages. Moreover, its development depends on national strategies and policies that aim to achieve high-efficiency automobiles and zero-emissions transportation [14]. Hydrogen Council (2017) [11] confirmed the maturity of hydrogen-powered vehicles, as they are commercially available currently or will be available in the next five years. Actually, on-site hydrogen production is economically favorable to reduce the transportation costs and a storage capacity is needed as a backup in case of demand increase [13].
Several studies have investigated the reliability of hydrogen from PtG technology to meet the hydrogen-mobility market. For example, Mukherjee et al. [16] developed a simulation model for a 2-MW PtG plant which aims to meet the transportation sector hydrogen demand as well as offer electrical grid ancillary services in Ontario, Canada. The model has evaluated the economic variables that are capable of making the PtG to mobility fuel pathway financially competitive by adjusting potential revenue streams, i.e., hydrogen selling price and carbon pricing. The suggested hydrogen price and carbon credit are 5.5 $/kg and 27 $/tonne of CO2, respectively.
2.2. Power-to-Gas to Industry
Governments and policymakers aim to reduce the CO2 emissions by reducing the use of fossil fuels in the industrial sector. Hydrogen, the most appendant compound, is the promising solution, in which hydrogen can create high temperatures while producing little or no CO2 emissions. Equipment can be modified to run on hydrogen or a combination of hydrogen and other combustible fuels. In fact, CO2 emissions could be reduced annually by as much as 440 million tonnes by 2050, if hydrogen production is largely decarbonized through water electrolysis (electricity should be from renewable sources) or carbon capture [11].
To date, several studies have investigated replacing fossil-based hydrogen production, i.e., steam methane reforming (SMR) and coal gasification, with green hydrogen deployment for the manufacturing sector. A seminal study in this field is the work of Al-Subaie et al. (2016) [17] on the utilization of electrolytic hydrogen produced via PtG concept for the petroleum industry. The PtG plant is able to supply 706,303 m3/day of clean hydrogen to the refinery; offsetting CO2 release what is equivalent to emissions produced from 34,893 conventional gasoline light-duty vehicles.
2.3. Power-to-Gas to Natural Gas Pipeline for use as Hydrogen-Enriched Natural Gas
Combining electrolytic hydrogen with natural gas is a cost-effective option for providing heat and power for residential and business sectors while decarburizing natural gas networks [14]. The blend, which is called hydrogen-enriched natural gas, contains hydrogen within the concentration range 5%–20% by volume [11,12,13,18]. Combining the advantages of both hydrogen and methane, HENG has much higher volumetric energy storage density than pure hydrogen. By adding green hydrogen to the gas grid, the grid provides huge and long-term energy storage capacity and increases the renewable content of the natural gas grid at the same time [19].
According to current standards and policies, the maximum allowable hydrogen concentration should not exceed 10% by volume without substantial modifications in natural gas systems, however, the acceptable rang for end-users falls between 5% and 20% of hydrogen and higher hydrogen blending results in more costs [10]; otherwise, extensive modification would be required on the level of the natural gas pipelines and end-users’ appliances.
2.4. Power-to-Gas to Renewable Natural Gas ‘Methanation’
Methanation is a further step in power-to-gas systems, involves combining electrolytic hydrogen with carbon dioxide (CO2) by a thermo-catalytic or biologic process, producing what is called “renewable natural gas” (RNG) [20]. Converting electrical energy to RNG has lower efficiency, about 20% compared to direct blending because it requires a CO2 source and energy for the methanation reaction and consequently additional costs are added [11,13,20]. The renewable gas resulting from the methanation process is pure and therefore matches existing natural gas networks and storage infrastructure [11].
There are several sources from which CO2 can be captured and utilized in methanation. Reiter and Lindorfer (2015a) [21] evaluated viable CO2 sources for PtG applications. In this present study, CO2 from biogas digesters is considered as a potential CO2 source for methanation. Figure 2 demonstrates the RNG-production where CO2 is captured from biogas digestion [13,22,23].
A recent series of publications have studied the implementation of different power-to-gas pathways in the Canadian province of Ontario. Mukherjee et al. (2017) [24], Hajimiragha et al. (2009) [25], and Walker et al. (2015) [26] examined the utilization of hydrogen via power-to-gas in the transportation sector. Additionally, Walker et al. (2016) [27] and Al-Subaie et al. (2017) [17] studied the implementation of electrolytic hydrogen into the petroleum-industry, aiming to optimize GHG reduction and system cost. Further, the feasibility of hydrogen injection into the natural gas grid and its environmental and economic consequences was examined by Mukherjee et al. (2015) [28]. Ozbilen et al. (2012) [29], and Walker (2016) [3] investigated power-to-gas system as seasonal storage technology in Ontario. However, the current study is a snapshot of the time to optimize the allocation of hydrogen—produced from Ontario’s surplus baseload electricity—to various PtG pathways in terms of environmental and economic aspects for the year 2017.
3. Methodology
The current study first determines the amount of hydrogen that could be produced from Ontario’s surplus baseload electricity at three different capacity factors through PtG technology. Then, it explores different scenarios for allocating the generated hydrogen to the four PtG energy streams. Furthermore, the work estimates the amount of CO2 offset as well as some economic aspects such as capital and operational costs, and the economic validity of each PtG pathway.
Emission factors of different power sources for Ontario’s electricity generation for 2017 are illustrated in Table 1, according to Independent Electricity System Operator (IESO). Further, Figure 3 shows hourly emission factor of Ontario’s electricity mix for 2017 [30].
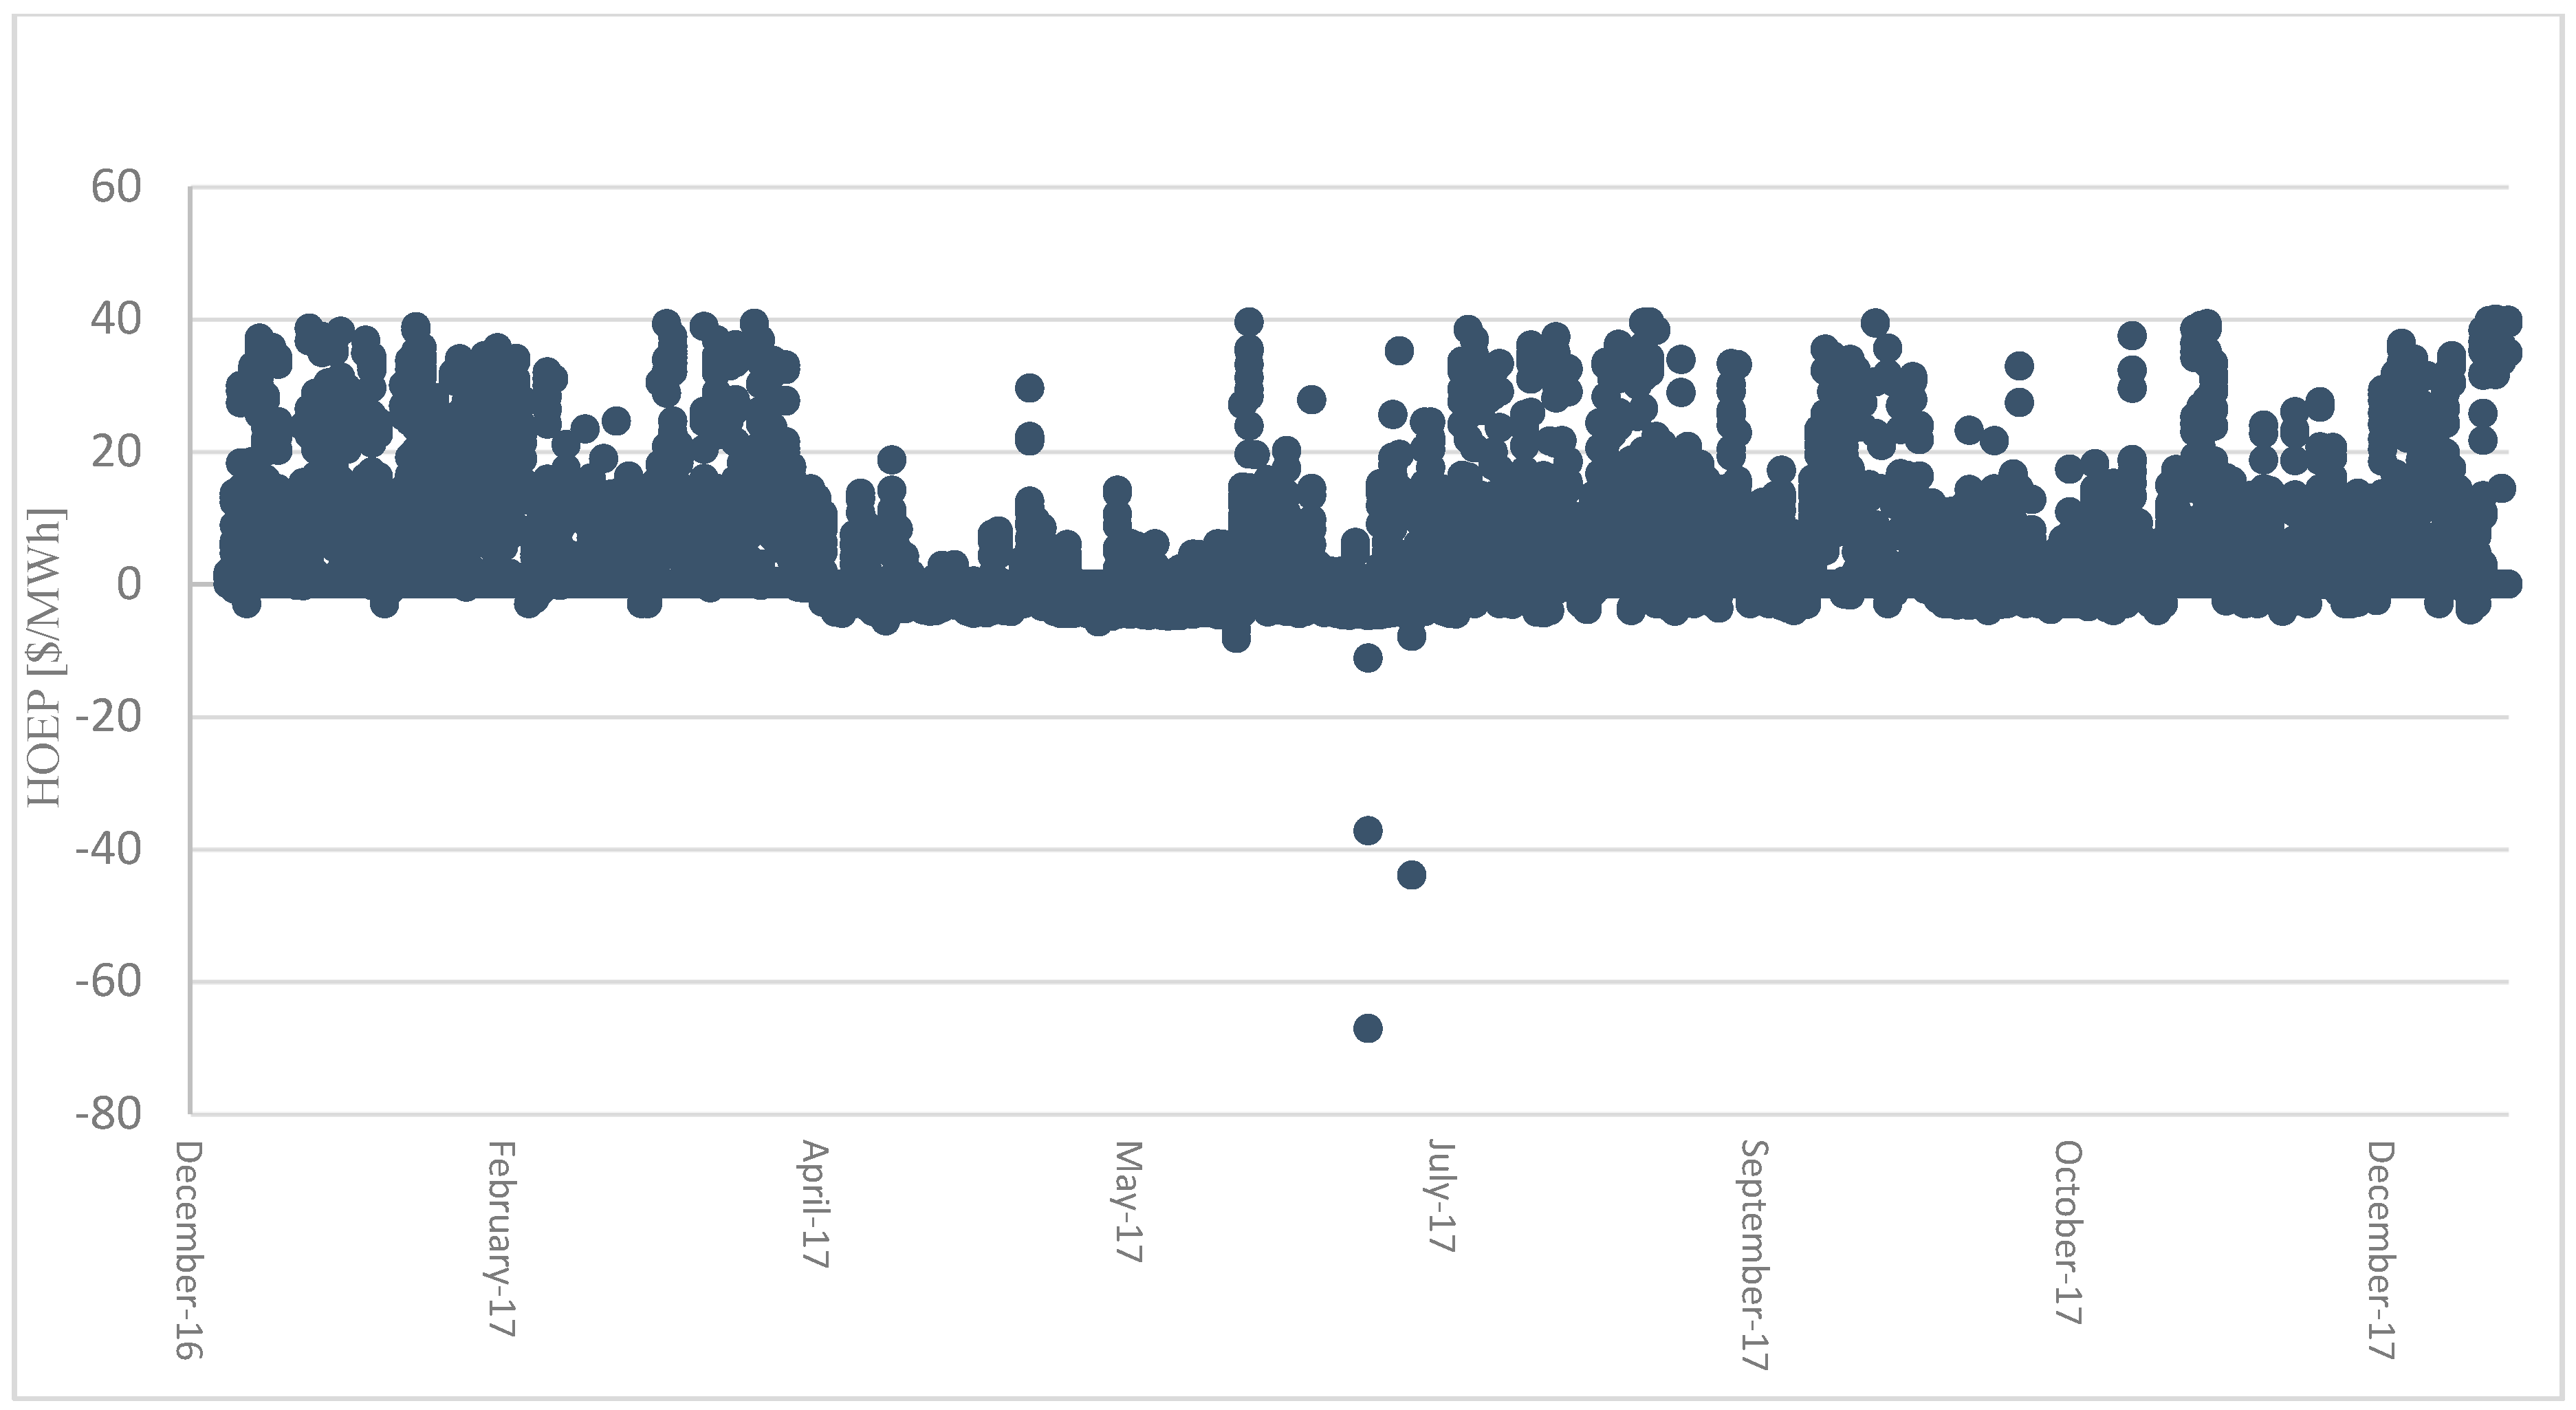
The overall capital expenses (CAPEX) of a pathway represent the fixed costs necessary to acquire the PtG pathways. CAPEX is the summation of a pathway’s equipment cost (Table 2); civil works costs; engineering costs; distributed control system (DCS) and energy management unit (EMU); and interconnection, commissioning, and start-up costs [13]. Moreover, a PtG plant’s overall operating costs (OPEX) involve (1) the cost of electricity to be utilized for hydrogen production and other technologies operation, in which the hourly Ontario energy price (HOEP) in $/MWh is offered by IESO [31] (Figure 4); (2) the equipment annual operating costs (OPEX), which is the cost related to the maintenance, spare parts and replacement associated with the equipment. It is a percentage of the equipment CAPEX (Table 2); (3) the cost of water purchased for electrolysis [32]. Furthermore, the PtG pathway’s profitability is examined by considering three profitability indicators: net present value (NPV), payback period (PBP), and internal rate of return (IRR).
Generally, two revenue streams are proposed for the PtG pathways, specifically: (1) direct revenue from hydrogen or RNG selling (Table 3); (2) monetary paybacks from CO2 emission reduction earned credits, which is 18 $/tonne CO2 [35].
The PtG system is assumed to operate for 350 days, at three capacity factors, which are 67%, 80%, and 96%, with an electrolysis efficiency of 80%. Table 4 shows the ranges of hourly emission factors and hourly Ontario energy price for the three capacity factors [30]. In this study, a 1-MW polymer electrolyte membrane (PEM) electrolyzer with an electricity consumption of 51.5 kWh per kg hydrogen is assumed for hydrogen production [40].
Additionally, part of the Climate Change Action Plan, the Province initiated the cap-and-trade program, which aims to support businesses and industry stakeholders to invest in more efficient and clean technologies and pollution reduction consequently [41]. The market-based program, which has been in action since January 1, 2017, sets a hard emission-boundary or (cap) to the industrial organizations to lower emissions gradually starting by the major emitters of GHGs. Furthermore, the price is put on carbon reduction, encouraging the companies to reduce more; said otherwise, the less the companies emit, the less money they pay [42]. On the other hand, companies who emit less can make a profit from selling emission-permits or allowances to other companies that exceed their emission-cap [43]. Therefore, the carbon credit for Ontario is 18 $/tonne CO2 [35].
Figure 5 illustrates the monthly trends of Ontario’s surplus baseload electricity generation (SBG) in gigawatts hour (GWh) along with the electrolytic hydrogen production at the three different capacity factors in tonnes, for 2017. The figure shows the inconstancy of surplus baseload generation over the whole year, with peak power-generation occurring in April 2017. The decrease in SBG during February and March, and from July to September could be due to stronger demand during winter and summer, respectively.
Hydrogen allocation will be based on five scenarios as follows:
- ▪
- Scenario A: hydrogen allocation based on each pathway’s demand and constraints, set by Ontario’s Climate Change Action Plan and Long-Term Energy Plans;
- ▪
- Scenario B: utilization of produced hydrogen entirely as a mobility fuel;
- ▪
- Scenario C: utilization of produced hydrogen entirely for industry;
- ▪
- Scenario D: utilization of produced hydrogen entirely as hydrogen enrich natural gas;
- ▪
- Scenario E: utilization of produced hydrogen entirely for methanation.
In scenario A, the total hydrogen produced via PtG concept is allocated based on each pathway’s demand as set by Ontario’s energy plans and policies to eliminate greenhouse gases by 2050, Table 5.
4. Transportation Sector Demand for Hydrogen
According to Ontario’s Climate Change Action Plan, the transportation sector is considered as a significant challenge in the road toward emission reduction, as one third (33%) of the total GHG pollution comes from the mobility sector [39]. Generally, in the transportation sector, hydrogen demand depends on the needs of the light-duty vehicles that represent 75% of total vehicles on the roads [6]. The hydrogen production and electrolyzer sizing depend mainly on the hydrogen demand, which can be estimated based on the number of FCVs in 2017 in Ontario’s roads. Hajimiragha at al. (2009) [25] developed an optimization model to find the optimal electric hydrogen production rate to supply the transportation sector demand from 2008 to 2025, as well as the optimal penetration percentage of hydrogen-FCVs on Ontario’s roads. Their study, based on the total baseload electricity generation from all Ontario zones, validated the feasibility of current and projected hydrogen production by Ontario’s grid system, using PtG technology. The hydrogen production capacity is capable of supporting 1.2%–2.8% penetration of FCVs in Ontario’s road by 2025. In the current study, the demand of the PtG to mobility fuel pathway is set to supply 1.2% penetration of FCVs into the province’s total vehicles based on Hajimiragha at el.’s optimization model [25]. In 2016, the number of light-duty vehicles registered was 8,037,343, according to Statistics Canada [44]. Assuming 2% annual increase in the number of cars [44], the number would have been 8,198,090 light-duty vehicles in 2017, making the number of FCVs about 100,000.
5. Industrial Demand for Hydrogen
As one-quarter of Ontario’s GHG emissions come from industry, Ontario’s government has set some policies to achieve its vision of a low-carbon economy and related the reduction of emissions with the economic competitiveness. In Ontario, hydrogen for industrial purposes is currently produced via the process of steam methane reforming (SMR). Table 6 shows H2-production capacities for the primary industries in Ontario [19]. This study covers up to 5% of the total hydrogen demand for industry.
6. Hydrogen to be Injected into the Natural Gas Grid
The natural gas market in Ontario accounts for 40% of Canada’s total natural gas consumption, with an average daily provincial demand of 218 thousands of cubic meters per day (e3m3/d) [46]. Injecting hydrogen into the natural gas grid is a proposed approach toward scalable and long-term energy storage and grid decarburization. Hydrogen blending is a way to increase the renewable content of the natural gas system. According to current standards and policies, the maximum allowable hydrogen concentration should not exceed 20% by volume. High blend concentrations may pose some risks in the distribution pipelines and end-user instruments [22]. Mostly, natural gas systems can tolerate low hydrogen concentration (0%–10%) [22]; otherwise great enhancement would be required for high hydrogen concentration. For this study, 5% H2 by volume will be considered as hydrogen concentration in the natural gas grid.
7. Hydrogen for Renewable Natural Gas Synthesis
Under the Climate Change Action Plan, Ontario is seeking to displace the fossil natural gas in the long-term by increasing the natural gas renewable content by encouraging renewable natural gas (RNG) projects [39,47]. RNG, also known as bio-methane, is a biogas of high methane content (90% or more), produced by biomass digestion [27]. The current RNG sources in Ontario are wastewater, landfill, and animal manure. Power-to-gas to renewable gas (methanation) is a potential source for RNG production that utilizes captured carbon dioxide and converts it along with hydrogen to RNG. RNG can be blended with regular natural gas without any concentration boundary as the two have almost the same chemical composition [13,14]. According to the Canadian Gas Association (CGA), up to 10% of RNG-content for Canada’s natural gas network has been set as a long-term goal to be reached by 2050 [48]; which will be the target of this study as well.
8. Results and Discussion
8.1. Scenario A
The amount of surplus baseload electricity for 2017 of each capacity factor is converted to hydrogen and then allocated according to the pre-defined demand for each pathway (Table 7). Accordingly, the total hydrogen produced is approximately 170, 193, and 227 kilo-tonnes (kt), respectively. For each capacity factor, the hydrogen amount is allocated to the four PtG pathways mentioned earlier. Figure 6 illustrates hydrogen allocation percentage for each PtG pathway for each capacity factor.
Furthermore, Table 7 shows the amount of carbon offset by producing hydrogen via the PtG technology instead of the conventional methods. The highest carbon reduction occurs in the case of utilizing hydrogen as mobility fuel instead of gasoline, about 2,215,916 tonnes of CO2 might be reduced.
Table 7 also shows PtG pathways economy considering scenario A allocation for each pathway for the three capacity factors. Wherein the pathways’ costs are represented by the overall capital exposures (CAPEX) and the overall annual operational expenses (OPEX); and the pathways’ profitability are expressed by NPV, PBP, and IRR. In fact, CAPEX value is strongly dependent on the type and the number of technologies for each pathway, electrolyzers in particular, because the capital cost of the electrolysis equipment is high.
For scenario A, hydrogen allocation is constrained by each PtG pathway demand illustrated by Table 5. Therefore, hydrogen amount for each pathway will be constant at three capacity factors except for the PtG pathway Power-to-Gas to Renewable Gas which has relatively flexible demand.
The pathway PtG to mobility fuel has the highest CAPEX, about 4.6 billion dollars, since it requires 1610 electrolyzers—considering the maximum surplus electricity generation—compared to other pathways. Further, OPEX is changing since the HOEP range (refer to Table 4) is different for each capacity factor. For the three capacity factors, the pathway shows an acceptable economic validity, in which NPV is positive, the average payback period is 5 years, and an IRR of 19%.
PtG to industry, the second pathway, has the lowest overall CAPEX and OPEX among the other pathways. However, with a PBP of more than 10 years the project investment costs will not be recovered sooner although the IRR indicates a positive possibility of money gain up to 4%. Moreover, the negative NPV indicates that the total income is less than the costs and the reason might be because of the hydrogen is sold at the same price as hydrogen produced through steam methane reforming (2.69 $/kg H2 [37]), which is low compared to hydrogen as mobility fuel (10 $/kg H2 [36]). For this particular case, selling hydrogen at least at 4 $/kg makes the project profitable with a positive NPV of $45,456,997, payback time of 9 years, and 10% IRR. Such projects should be part of government incentives to encourage clean energy utilization.
The third and fourth pathways, PtG to pipeline for use as HENG and PtG to RNG, show un-acceptable economic validity with highly negative NPVs and PBPs that reach more than 100 years. This might be because HENG and RNG are sold at a very low price (10 $ per MWh [38]) compared to their extremely high production costs. For this current study, the prices that make PtG to pipeline for use as HENG and PtG to RNG profitable business cases start from 0.358 and 0.191 $/MWh, respectively, which are high prices compared to the current natural gas price range.
Generally, this result ties with a previous German case study by Schiebahn et al. (2015) [15], wherein the production costs of injecting hydrogen or renewable natural gas into the natural gas grid are several times higher than conventional natural gas production cost. Hence, large-scale implementation of such projects is currently uneconomic [15]. Although injecting RNG would not pose any risks to distribution pipelines or end-user appliances compared to hydrogen injection, this technology has some main drawbacks that need to be overcome. First is low overall process efficiency (40%–63%) because it involves multiple energy conversion steps, which boosts the energy loses [12]. The second problem is that the CO2 methanation requires an enormous amount of carbon dioxide. For example, in this study, CO2 source is assumed to be from Ontario’s biogas farms in which the total annual biogas production is 118.98 million cubic meter [49], accordingly 55 kilo-tonnes of CO2 (40% concentration of CO2 in the biogas). What is required, however, in the case of 67% availability, equals around 281 kilo-tonnes of CO2; that is, requirements exceed CO2 availability. Albeit, CO2 could be captured from other sources like the cement industry, but that is an expensive option.
In addition, the realization of hydrogen injection into the natural gas grid to be used as HENG requires re-specifying composition and gas quality standers along with transmission and distribution pipeline tolerances for high hydrogen concentration. Further, some other concerns need to be addressed regarding HENG blend, namely those related to process control, safety, and public acceptance [19]. It is neither possible nor legal to blend hydrogen in high concentration with natural gas (more than 20 vol% H2) because that will result in natural gas composition change, which affects consumer devices [50].
Conversely, the high-efficiency of fuel cell vehicles tolerates hydrogen cost competitiveness compared to gasoline, making the use of hydrogen as a green fuel for automobiles an economically sound, commercial case. Though for this pathway to be implemented, hydrogen infrastructure would need to be built from scratch, and a collaboration among industry, governments, and the public would be required for cost-effective conversion to renewable energy [15].
Producing hydrogen via electrolysis has always been seen as an ideal means in industry, especially if it is generated from renewable sources. Even though the electrolytic hydrogen is an excellent solution for industrial greenhouse gases reduction, it is still inherently expensive and not continually efficient. Therefore, adoption of a large-scale plant that produces hydrogen via PtG technology is currently not bankable because cost matters, especially if there are cheaper alternatives available [51].
8.2. Scenario B
In this scenario, hydrogen produced (at the three production capacities) via PtG technology is utilized entirely for the pathway PtG to mobility fuel (Table 8). The hydrogen amount, which is generated from the surplus electricity, could refuel up to 1,147,732 FCVs, which represents 14% of the total light-duty vehicles in Ontario in 2017. Accordingly, a huge amount of carbon dioxide would be eliminated from Ontario’s roads, 5,235,156 tonnes of CO2, if hydrogen were produced at a capacity of 96%. Moreover, this pathway still shows good economic validity, in which the PBP is less than or equal to 9 years considering a discount rate of 8%. Despite the high CAPEX and OPEX, the NPV and IRR are greater than zero, indicating a positive gain and profitable business case. It is clear that scaling up the production makes it less economically efficient; since the number of equipment will be more, increasing the overall CAPEX.
8.3. Scenario C
In this scenario, hydrogen produced via PtG technology is utilized entirely for the pathway PtG to industry, at three production capacities 67%, 80%, and 96% (Table 9). Utilizing Ontario’s surplus electricity to produce hydrogen via the PtG technology could supply 82%, 93%, and 110% of industrial demand at the three capacity factors, respectively. By implementing this PtG energy stream, up to 3131 kilo-tonnes of CO2 could be offset, as Table 9 illustrates. Nevertheless, hydrogen production through PtG is still costly compared to other available cheaper alternatives, namely hydrogen produced via steam methane reforming. The economic validity indicators (NPV, PBP, and IRR) show some improvement by increasing hydrogen production capacity, but they are not indicating any positive gain feedback. To increase this pathway’s profitability, hydrogen could be sold at a higher price; however, in this case, hydrogen would not be a favorable option for stockholders. For this particular case, selling hydrogen at least at 10 $/kg makes the project profitable with a positive NPV of $1,259,846,895, payback time of 9 years, and 9% IRR. Such projects should be part of government incentives to encourage clean energy utilization.
8.4. Scenario D
In scenario D, hydrogen produced from the surplus electricity is allocated totally to the third PtG pathway, PtG to pipeline to be used as HENG, at the three different capacity factors (Table 10). As illustrated in Table 10, increasing the capacity factor results in increasing the hydrogen concentration in the natural gas grid, exceeding the constraint (20% by volume). Although using HENG instead of the conventional natural gas could offset up to 268,970 tonnes of carbon dioxide, its capital and operational costs are extremely high, resulting in extremely negative NPV and very long payback time. In this case, IRR is undefined because there is no interest rate small enough that makes NPV equal zero. Therefore, the probability of implementing a large-scale project is not yet feasible. For this current study, the selling price that makes this PtG pathway a profitable business case starts from 648 $/kWh, which is relatively a high price compared to the current natural gas price range.
8.5. Scenario E
In this scenario, the amount of hydrogen produced via PtG technology is entirely combined with CO2 from biogas digestion plant for RNG synthesis. Table 11 shows the selected three capacity factors for hydrogen production, the amount of CO2 offset, the economic cost, as well as the profitability indicators. RNG produced in the reaction of methanation could be a 12%, 14%, and 16% additive by volume into the natural gas grid at three capacity factors, respectively. Regarding the methanation reaction an enormous amount of carbon dioxide is required; Ontario’s biogas digesters are unlikely to be able to supply this carbon dioxide because of resource limitations. Therefore, other more expensive options may be considered, for instance, utilizing CO2 captured from the cement industry. On one hand, methanation could eliminate up to 997,080 tonnes of carbon dioxide from the atmosphere in the case of 96% electrolysis availability. On the other hand, the cost of RNG production is exceedingly high because it demands multiple processes, namely water electrolysis, CO2 separation, and CH4 synthesis. This PtG pathway shows low profitability potential as Table 11 illustrates, with a negative NPV and a payback period exceeding 100 years. In this case, IRR is undefined because there is no interest rate small enough that makes NPV equal zero. For this current study, the selling price that makes this PtG pathway a profitable business case starts from 341 $/MWh, which is relatively high price compared to the current natural gas price range.
9. Conclusions
Power-to-Gas is a novel energy storage concept that could be used to manage Ontario’s surplus baseload electricity in various applications. This paper has focused on four Power-to-Gas pathways: Power-to-Gas to mobility fuel, Power-to-Gas to industry, Power-to-Gas to natural gas pipelines for use as hydrogen-enriched natural gas, and Power-to-Gas to renewable natural gas (i.e., Methanation). The surplus power in Ontario has been quantified at three capacity factors (67%, 80%, and 96%) for 2017, and then allocated to the four Power-to-Gas pathways, analyzing the economic and environmental benefits. The purpose was to investigate the use of Ontario’s surplus electricity—that would otherwise exported or curtailed—to reduce the emissions as well as supply the demand of other sectors within the province, including transportation, industry, and energy storage and distribution. The study shows that the hydrogen produced via the Power-to-Gas technology could have been allocated to supply four different energy demands of four sectors in Ontario in 2017. In fact, the realization of Power-to-Gas pathways will demand substantial financial support and collaboration among governments, stockholders, and the public. Some Power-to-Gas energy streams show the potential to compete with conventional energy applications, namely utilizing hydrogen as a mobility fuel instead of gasoline. However, the other pathways are not competitive yet due to their high capital and operational costs compared to the cheaper available alternatives. Taken together, these outcomes do not support strong recommendations, and continued effort is needed to investigate the environmental and economic feasibility of large implementations of Power-to-Gas pathways in Ontario.
Author Contributions
S.S.A.-Z. wrote the paper and carried out the entire literature review presented in this work. A.M. (Azadeh Maroufmashat) is her co-supervisor, provided key insights throughout the course of this work. A.M. (Abdelkader Mazouz) read and edit the paper. M.F. and A.E. are first author supervisors.
Funding
This research received no external funding.
Conflicts of Interest
The authors declare no conflict of interest.
References
- Environmental Commissioner of Ontario. Surplus Baseload Electricity Generation in Ontario. 2017. Available online: https://eco.on.ca/blog/surplus-baseload-electricity-generation-in-ontario (accessed on 6 April 2018).
- Power Imports and Exports Data. IESO, 2017. Available online: http://www.ieso.ca/en/power-data/supply-overview/imports-and-exports (accessed on 5 April 2018).
- Walker, S.B.; Van Lanen, D.; Fowler, M.; Mukherjee, U. Economic analysis with respect to Power-to-Gas energy storage with consideration of various market mechanisms. Int. J. Hydrogen Energy 2016, 41, 7754–7765. [Google Scholar] [CrossRef]
- IEC. Electrical Energy Storage—White Paper; International Electrotechnical Commission: Geneva, Switzerland, 2011. [Google Scholar]
- Ibrahim, H.; Ilinca, A.; Perron, J. Energy storage systems-Characteristics and comparisons. Renew. Sustain. Energy Rev. 2008, 12, 1221–1250. [Google Scholar] [CrossRef]
- Pleßmann, G.; Erdmann, M.; Hlusiak, M.; Breyer, C. Global energy storage demand for a 100% renewable electricity supply. Energy Proc. 2014, 46, 22–31. [Google Scholar] [CrossRef]
- Jentsch, M.; Trost, T.; Sterner, M. Optimal use of Power-to-Gas energy storage systems in an 85% renewable energy scenario. Energy Proc. 2014, 46, 254–261. [Google Scholar] [CrossRef]
- Balibar, S. Energy transitions after COP21 and 22. Comptes Rendus Phys. 2017, 18, 7–8. [Google Scholar] [CrossRef]
- Hydrogenics, About The Company Hydrogenics. 2018. Available online: http://www.hydrogenics.com/about-the-company/ (accessed on 27 May 2018).
- Yeong, Y.; Glass, N.; Baker, R. Review of Hydrogen Tolerance of Key Power-to-Gas (P2G) Components and Systems in Canada, Ottawa. Master’s Thesis, University of Waterloo, Waterloo, ON, Canada, 2017. [Google Scholar]
- Hydrogen Council. Hydrogen-Scaling Up; The Hydrogen Council: Brussels, Belgium, 2017; p. 80. [Google Scholar]
- Maroufmashat, A.; Fowler, M. Transition of future energy system infrastructure; through Power-to-Gas pathways. Energies 2017, 10, 1089. [Google Scholar] [CrossRef]
- Tractebel Engineering S.A.; Hinicio. Study on Early Business Cases for H2 in Energy Storage and More Broadly Power To H2 Applications; The Fuel Cells and Hydrogen 2 Joint Undertaking: Brussels, Belgium, 2017. [Google Scholar]
- ENEA Consulting. The Potential of Power-To-Gas; ENEA Consulting: Paris, France, 2016. [Google Scholar]
- Schiebahn, S.; Grube, T.; Robinius, M.; Tietze, V.; Kumar, B.; Stolten, D. Power to gas: Technological overview, systems analysis and economic assessment for a case study in Germany. Int. J. Hydrogen Energy 2015, 40, 4285–4294. [Google Scholar] [CrossRef]
- Mukherjee, U.; Walker, S.; Maroufmashat, A.; Fowler, M.; Elkamel, A. Development of a pricing mechanism for valuing ancillary, transportation and environmental services offered by a power to gas energy system. Energy 2017, 128, 2017. [Google Scholar] [CrossRef]
- Al-Subaie, A.; Maroufmashat, A.; Elkamel, A.; Fowler, M. Presenting the implementation of power-to-gas to an oil refinery as a way to reduce carbon intensity of petroleum fuels. Int. J. Hydrogen Energy 2017, 42, 19376–19388. [Google Scholar] [CrossRef]
- Robinius, M.; Welder, L.; Ryberg, D.S.; Mansilla, C.; Lucchese, P.; Tlili, O.; Le Duigou, A.; Simon, J.; Balan, M.; Dickinson, R.R.; et al. Power-to-Hydrogen and Hydrogen-to-X: Which markets? Which economic potential? Answers from the literature. In Proceedings of the 2017 14th International Conference on the European Energy Market (EEM), Dresden, Germany, 6–9 June 2017. [Google Scholar]
- Nanthagopal, K.; Subbarao, R.; Elango, T.; Baskar, P.; Annamalai, K. Hydrogen enriched compressed natural gas (HCNG): A futuristic fuel for internal combustion engines. Therm. Sci. 2011, 15, 44. [Google Scholar] [CrossRef]
- Melaina, M.W.; Eichman, J. Hydrogen Energy Storage for Grid and Transportation Services; National Renewable Energy Laboratory: Golden, CO, USA, 2015.
- Reiter, G.; Lindorfer, J. Evaluating CO2 sources for power-to-gas applications—A case study for Austria. J. CO2 Util. 2015, 10, 40–49. [Google Scholar] [CrossRef]
- Gupta, R.; Basile, A.; Veziroglu, T.N. Compendium of Hydrogen Energy: Hydrogen Storage, Distribution and Infrastructure; Woodhead Publishing: Sawston, UK, 2015. [Google Scholar]
- Lord, A.S.; Kobos, P.H.; Borns, D.J. Geologic storage of hydrogen: Scaling up to meet city transportation demands. Int. J. Hydrogen Energy 2014, 39, 15570–15582. [Google Scholar] [CrossRef] [Green Version]
- Mukherjee, U.; Walker, S.; Maroufmashat, A.; Fowler, M.; Elkamel, A. Power-to-gas to meet transportation demand while providing ancillary services to the electrical grid. In Proceedings of the 2016 IEEE Smart Energy Grid Engineering (SEGE), Oshawa, ON, Canada, 21–24 August 2016; pp. 221–225. [Google Scholar]
- Hajimiragha, A.; Fowler, M.W.; Canizares, C.A. Hydrogen economy transition in Ontario—Canada considering the electricity grid constraints. Int. J. Hydrogen Energy 2009, 34, 5275–5293. [Google Scholar] [CrossRef]
- Walker, S.B.; Fowler, M.; Ahmadi, L. Comparative life cycle assessment of power-to-gas generation of hydrogen with a dynamic emissions factor for fuel cell vehicles. J. Energy Storage 2015, 4, 62–73. [Google Scholar] [CrossRef]
- Walker, S.; Mukherjee, U.; Fowler, M.; Arbiv, I.; Lazzaroni, E. Implementing Power-to-Gas to provide green hydrogen to a bitumen upgrader. Int. J. Energy Res. 2016, 40, 1925–1934. [Google Scholar] [CrossRef]
- Mukherjee, U.; Elsholkami, M.; Walker, S.; Fowler, M.; Elkamel, A.; Hajimiragha, A. Optimal sizing of an electrolytic hydrogen production system using an existing natural gas infrastructure. Int. J. Hydrogen Energy 2015, 40, 9760–9772. [Google Scholar] [CrossRef]
- Ozbilen, A.; Dincer, I.; Naterer, G.F.; Aydin, M. Role of hydrogen storage in renewable energy management for Ontario. Int. J. Hydrogen Energy 2012, 37, 7343–7354. [Google Scholar] [CrossRef]
- IESO. 2017 Electricity Data, Independent Electricity System Operator. 2018. Available online: http://www.ieso.ca/corporate-ieso/media/year-end-data (accessed on 9 May 2018).
- Independent Electricity System Operator, Hourly Ontario Energy Price Ieso. 2012. Available online: https://www.ieso.ca/imoweb/marketdata/hoep.asp (accessed on 16 May 2018).
- City of Markham—Water Rate. The City of Markham, 2014. Available online: https://www.markham.ca/wps/portal/Markham/Residents/Water/RatesBills/WaterRates/ (accessed on 30 April 2018).
- Smeets, F.; Thomas, D. HyBALANCE: State-of-the-Art PEM Electrolysis Paving the Way to Multi-MW Renewable Hydrogen Systems; Hydrogenics: Oevel, Belgium, 2017. [Google Scholar]
- Lehner, M.; Tichler, R.; Steinmüller, H.; Koppe, M. Power-to-Gas: Technology and Business Models; Springer: Berlin, Germany, 2014; pp. 7–18. [Google Scholar]
- ICF Consulting Canada. Long-Term Carbon Price Forecast Report Long-Term Carbon Price Forecast and Marginal Abatement Cost Curve for Assessment of Natural Gas Utilities’ Cap and Trade Activities (EB-2016-0359); Ontario Energy Board: Toronto, ON, Canada, 2017. [Google Scholar]
- Cost to Refill California Fuel Cell Partnership. California Fuel Cell Partnership, 2018. Available online: https://cafcp.org/content/cost-refill (accessed on 6 June 2018).
- Kaiwen, L.; Bin, Y.; Tao, Z. Economic analysis of hydrogen production from steam reforming process: A literature review. Energy Sources Part B Econ. Plan. Policy 2018, 13, 109–115. [Google Scholar] [CrossRef]
- US Energy Information Administration. Henry Hub Natural Gas Spot Price. 2018. Available online: https://www.eia.gov/dnav/ng/hist/rngwhhdM.htm (accessed on 9 May 2018).
- HYDROGENICS. Renewable Hydrogen Solutions; Hydrogenics: Gladbeck, Germany, 2016. [Google Scholar]
- Sudiro, M.; Bertucco, A. Synthetic Natural Gas (SNG) from coal and biomass: A survey of existing process technologies, open issues and perspectives. Nat. Gas. 2010, 105–126. [Google Scholar] [CrossRef]
- Tombe, T.; Rivers, N. The Cost of Carbon Pricing in Ontario and Alberta. Macleans, 2017. Available online: http://www.macleans.ca/economy/economicanalysis/what-carbon-prices-in-alberta-and-ontario-will-cost-the-average-household-and-why/ (accessed on 6 July 2018).
- Government of Ontario. Cap and Trade in Ontario. Queen’s Printer for Ontario, 2017. Available online: https://www.ontario.ca/page/cap-and-trade-ontario (accessed on 15 May 2018).
- Government of Ontario. Ontario’s Five Year Climate Change Action Plan 2016—2020; Ministry of the Environment and Climate Change: Toronto, ON, Canada, 2016; p. 86.
- Statistics Canada. Motor Vehicle Registrations, by Province and Territory. 2016. Available online: http://www.statcan.gc.ca/tables-tableaux/sum-som/l01/cst01/trade14b-eng.htm (accessed on 4 April 2018).
- Hunter, C.; Deligiannis, G. Canadian Hydrogen Survey 2004–2005: Capacity, Production and Surplus Update; Dalcor Consultants Ltd. and Camford Information Services Inc.: West Vancouver, ON, Canada, 2005. [Google Scholar]
- National Energy Board. NEB—Marketable Natural Gas Production in Canada. Government of Canada, 2018. Available online: https://www.neb-one.gc.ca/nrg/sttstc/ntrlgs/stt/mrktblntrlgsprdctn-eng.html (accessed on 4 June 2018).
- Canadian Biogas Association. Renewable Natural Gas Developments in Ontario: An Evolving Outlook. Acknowledgements The Canadian Biogas Association thanks the Independent Electricity System Operator (IESO) for their support of the Renewable Natural Gas Outreach and Market Development Initiative through the Education and Capacity Building Program; The Canadian Biogas Association: Ottawa, ON, Canada, 2017. [Google Scholar]
- Aubry, A. Canada’s Natural Gas Utilities Propose Target for Renewable Natural Gas; Canadian Gas Association (CGA): Ottawa, ON, Canada, 2016. [Google Scholar]
- Robins, K. Canadian Biogas Study Technical Document; The Canadian Biogas Association: Ottawa, ON, Canada, 2013. [Google Scholar]
- Baier, J.; Schneider, G.; Heel, A. A cost estimation for CO2 reduction and reuse by methanation from cement industry sources in Switzerland. Front. Energy Res. 2018, 6, 2018. [Google Scholar] [CrossRef]
- Arnold, B.R. The Lowdown on Hydrogen—Part 2: Production; Energy Post: London, UK, 2017; pp. 1–8. [Google Scholar]
Figure 1.
Power-to-Gas pathways.


Figure 3.
Hourly emission factor of Ontario’s electricity mix for 2017 [30].
Figure 3.
Hourly emission factor of Ontario’s electricity mix for 2017 [30].

Figure 4.
The hourly Ontario energy price (HOEP) in $/MWh [31].
Figure 4.
The hourly Ontario energy price (HOEP) in $/MWh [31].

Figure 5.
The monthly trends of Ontario’s surplus baseload electricity and the electrolytic hydrogen production at the three different capacity factors.
Figure 5.
The monthly trends of Ontario’s surplus baseload electricity and the electrolytic hydrogen production at the three different capacity factors.

Figure 6.
H2 allocation at three different capacity factors.


Table 1.
Greenhouse gas emission factors from power generation sources [30].
Table 1.
Greenhouse gas emission factors from power generation sources [30].
| Power Source | GHG Emission Factor (kg CO2/MWh) |
|---|---|
| Nuclear | 17 |
| Hydro | 18 |
| Solar | 39 |
| Gas | 622 |
| Biofuel | 177 |
| Wind | 14 |
Table 2.
Capital expenses (CAPEX) and operating costs (OPEX) of main Power-to-Gas (PtG) pathways components.
Table 2.
Capital expenses (CAPEX) and operating costs (OPEX) of main Power-to-Gas (PtG) pathways components.
| Equipment | Equipment’s Capital Cost (CAPEX) | Equipment’s Operational Cost (OPEX) [% CAPEX] | Reference |
|---|---|---|---|
| Electrolyzer | 1324 ($/kW) | 4% | [13,33] |
| Compressors | 245,508 ($) | 6% | [14] |
| Steel tanks | 577,404 ($) | 2% | [13] |
| Injection station | 860,083 ($) | 8% | [13] |
| Methanation | 496 ($/kWCH4) | 10% | [34] |
| PtG Pathway | Final Product Selling Price | Reference |
|---|---|---|
| PtG to mobility fuel | 10 $/kg H2 | [36] |
| PtG to industry | Price of H2 produced via steam methane reforming 2.69 $/kg H2 | [37] |
| PtG to pipeline to be used as HENG | Natural gas price 10 $/MWh | [38] |
| PtG to renewable natural gas |
Table 4.
Ranges of hourly emission factors and hourly Ontario energy price for the three capacity factors [30].
Table 4.
Ranges of hourly emission factors and hourly Ontario energy price for the three capacity factors [30].
| Capacity Factor | 67% | 80% | 96% |
|---|---|---|---|
| Emission range (kg CO2/MWh) | 20–142 | 20–169 | 20–176 |
| HOEP (¢/kWh) | −6.7–4.0 | −6.7–31.4 | −6.7–182.3 |
Table 5.
Hydrogen, hydrogen-enriched natural gas (HENG), and RNG demand to be met by PtG pathways.
| Power-to-Gas Pathway | Demand to be Met |
|---|---|
| Power-to-Gas to Mobility fuel | 1.2% penetration of fuel cell vehicle (FCV) on Ontario’s road in 2017 |
| Power-to-Gas to Industry | Supply 5% of Ontario’s industrial hydrogen demand |
| Power-to-Gas to Natural Gas Pipeline for use as HENG | 5% by volume hydrogen concentration in Ontario’s natural gas grid (2017) |
| Power-to-Gas to Renewable Gas | Up to 10% by volume RNG content in Ontario’s natural gas grid |
Table 6.
Steam methane reforming (SMR) hydrogen production capacities by sector in Ontario [45].
Table 6.
Steam methane reforming (SMR) hydrogen production capacities by sector in Ontario [45].
| Production Capacity (MSm³/d) | |
|---|---|
| Oil Refining | ~3.5 |
| Chemical | ~2.37 |
| Others | ~0.4 |
| Total | ~6.3 |
Table 7.
Allocation of hydrogen produced via PtG concept at three capacity factors (67%, 80%, and 96%) for the four PtG pathways.
Table 7.
Allocation of hydrogen produced via PtG concept at three capacity factors (67%, 80%, and 96%) for the four PtG pathways.
| PtG-Mobility | PtG-to Industry | PtG-HENG | PtG-RNG | PtG-Mobility | PtG-to Industry | PtG-HENG | PtG-RNG | PtG-Mobility | PtG-to Industry | PtG-HENG | PtG-RNG | ||
|---|---|---|---|---|---|---|---|---|---|---|---|---|---|
| Capacity Factor | 67% | 80% | 96% | ||||||||||
| surplus electricity (GWh/y) | 8327 | 9512 | 11,210 | ||||||||||
| Total hydrogen before allocation(kg/y) | 169,275,028 | 193,131,431 | 227,615,472 | ||||||||||
| Amount of H2 (kg/y) | 96,344,160 | 10,334,413 | 11,461,057 | 51,444,504 | 96,344,160 | 10,334,413 | 11,461,057 | 75,737,743 | 96,344,160 | 10,334,413 | 11,461,057 | 110,034,079 | |
| Demand to be met | 1.2% FCVs penetration | 5% of industrial demand | 5% vol. | 3.6% vol. RNG | 1.2% FCVs penetration | 5% of industrial demand | 5% vol. | 5.3% vol. RNG | 1.2% FCVs penetration | 5% of industrial demand | 5% vol. | 7.7% vol. RNG | |
| Equipment | Electrolyzers | 1160 | 81 | 131 | 635 | 1160 | 81 | 131 | 866 | 1160 | 81 | 131 | 1258 |
| Pre-storage compressors | 536 | 38 | 61 | 272 | 536 | 32 | 61 | 618 | 536 | 38 | 61 | 898 | |
| Booster compressors | 259 | 18 | 29 | 847 | 259 | 18 | 29 | 298 | 259 | 18 | 29 | 433 | |
| Storage tanks | 124 | 17 | 14 | 68 | 124 | 17 | 14 | 308 | 124 | 17 | 14 | 145 | |
| CO2 for methanation (kg/y) | - | - | - | 280,762,976 | - | - | - | 413,345,492 | - | - | - | 600,520,809 | |
| CO2-offset (tCO2/y) | 2,215,916 | 86,913 | 7262 | 119,250 | 2,215,916 | 102,971 | 8336 | 210,251 | 2,215,916 | 133,097 | 10,033 | 399,173 | |
| Overall CAPEX ($) | $4,579,650,865 | $322,108,291 | $519,249,027 | $2,571,826,242 | $4,579,650,865 | $322,108,291 | $519,249,027 | $3,479,708,304 | $4,579,650,865 | $322,442,321 | $519,249,027 | $5,014,074,169 | |
| Overall OPEX ($) | $59,820,472 | $4,916,527 | $6,346,866 | $36,491,490 | $72,622,147 | $4,916,527 | $7,777,982 | $59,071,009 | $106,974,741 | $9,336,053 | $11,397,484 | $119,367,287 | |
| NPV ($) | $4,624,487,221 | −$86,995,939 | −$562,726,957 | −$2,759,830,087 | $4,558,157,203 | −$92,850,132 | −$577,430,247 | −$3,802,863,216 | $43,594,908,932 | −$117,642,852 | −$612,667,125 | −$5,796,372,412 | |
| PBP (years) | 4.85 | 13.38 | 115 | 134 | 4.92 | 13.79 | 87 | 106 | 5.11 | 15.46 | 55 | 63 | |
| IRR (%) | 20.07% | 4.18% | - | - | 19.77% | 3.84% | - | - | 18.97% | 2.59% | - | - | |
Table 8.
Hydrogen allocation, Scenario B.
| PtG Pathway | 100% PtG to Mobility Fuel | |||
|---|---|---|---|---|
| Capacity Factor | 67% | 80% | 96% | |
| Surplus electricity (GWh/y) | 8327 | 9512 | 11,210 | |
| Amount of H2 [kg/y] | 169,287,434 | 193,131,431 | 227,615,472 | |
| FCVs penetration | 10% | 12% | 14% | |
| Equipment | Electrolyzers | 3665 | ||
| Pre-storage compressors | 1693 | |||
| Booster compressors | 817 | |||
| Storage tanks | 273 | 312 | 373 | |
| CO2-offset (tCO2/y) | 3,893,611 | 4,442,023 | 5,235,156 | |
| Overall CAPEX ($) | $14,373,891,507 | $14,470,328,519 | $14,474,400,375 | |
| Overall OPEX ($) | $142,604,532 | $172,809,234 | $218,677,367 | |
| NPV ($) | $1,392,386,339 | $2,447,945,894 | $6,651,407,145 | |
| PBP (years) | 8.96 | 8.49 | 6.73 | |
| IRR (%) | 9.26% | 10.05% | 13.73% | |
Table 9.
Hydrogen allocation, Scenario C.
| PtG Pathway | 100% PtG to Industry | |||
|---|---|---|---|---|
| Capacity Factor | 67% | 80% | 96% | |
| Surplus electricity (GWh/y) | 8327 | 9512 | 11,210 | |
| Amount of H2 (kg/y) | 169,275,028 | 193,131,431 | 227,615,472 | |
| Industrial demand (kg/y) | 206,725,050 | |||
| Percentage of industrial demand | 82% | 93% | 110% | |
| Equipment | Electrolyzers | 3665 | ||
| Pre-storage compressors | 1693 | |||
| Booster compressors | 817 | |||
| Storage tanks | 273 | 312 | 373 | |
| CO2-offset (tCO2/y) | 2,255,516 | 2,617,574 | 3,130,678 | |
| Overall CAPEX ($) | $14,373,891,507 | $14,470,328,519 | $14,474,400,375 | |
| Overall OPEX ($) | $141,018,779 | $162,717,784 | $164,981,145 | |
| NPV ($) | −$10,889,133,191 | −$10,504,561,783 | −$9,529,424,829 | |
| PBP (years) | 40.50 | 35.82 | 28.74 | |
| IRR (%) | −5.95% | −5.01% | −3.23% | |
Table 10.
Hydrogen allocation, Scenario D.
| PtG Pathway | 100% PtG to Pipeline to be Used as HENG | |||
|---|---|---|---|---|
| Capacity Factor | 67% | 80% | 96% | |
| Surplus electricity (GWh/y) | 8327 | 9512 | 11,210 | |
| Amount of H2 (kt/y) | 169,275,028 | 193,131,431 | 227,615,472 | |
| Natural gas production (e3m3/y) | 2,422,248 | |||
| H2 concentration in the natural gas grid [vol.%] | 87% | 89% | 106% | |
| Equipment | Electrolyzers | 3665 | ||
| Pre-storage compressors | 1693 | |||
| Booster compressors | 817 | |||
| Storage tanks | 273 | 312 | 373 | |
| CO2-offset (tCO2/y) | 215,117 | 238,082 | 268,970 | |
| Overall CAPEX | $14,291,161,242 | $14,472,203,500 | $14,476,275,356 | |
| Overall OPEX | $138,818,879 | $162,457,467 | $213,268,925 | |
| NPV ($) | −$15,321,431,824 | −$15,685,815,833 | −$15,911,513,729 | |
| PBP (years) | 136 | 117 | 99 | |
Table 11.
Hydrogen allocation, Scenario E.
| PtG Pathway | 100% PtG to RNG | |||
|---|---|---|---|---|
| Capacity Factor | 67% | 80% | 96% | |
| Surplus electricity (GWh/y) | 8327 | 9512 | 11,210 | |
| Amount of H2 (kg/y) | 169,275,028 | 193,131,431 | 227,615,472 | |
| Natural gas production (e3m3/y) | 2,422,248 | |||
| RNG produced (kg/y) | 336,702,809 | 384,155,278 | 452,747,045 | |
| RNG content in the natural gas grid (vol.%) | 12% | 14% | 16% | |
| Amount CO2 required for methanation (tCO2/y) | 923,833 | 1,054,032 | 1,242,231 | |
| Equipment | Electrolyzers | 3665 | ||
| Pre-storage compressors | 10,933 | |||
| Booster compressors | 5278 | |||
| Storage tanks | 1763 | 2015 | 2412 | |
| CO2-offset (tCO2/y) | 756,604 | 855,882 | 997,080 | |
| Overall CAPEX | $15,198,918,416 | $15,595,760,530 | $15,648,349,282 | |
| Overall OPEX | $181,554,848 | $213,999,898 | $269,720,226 | |
| NPV ($) | −$16,330,965,392 | −$16,628,120,335 | −$17,425,413,126 | |
| PBP (years) | 132 | 148 | 86 | |
© 2019 by the authors. Licensee MDPI, Basel, Switzerland. This article is an open access article distributed under the terms and conditions of the Creative Commons Attribution (CC BY) license (http://creativecommons.org/licenses/by/4.0/).
Share and Cite
MDPI and ACS Style
Al-Zakwani, S.S.; Maroufmashat, A.; Mazouz, A.; Fowler, M.; Elkamel, A. Allocation of Ontario’s Surplus Electricity to Different Power-to-Gas Applications. Energies 2019, 12, 2675. https://doi.org/10.3390/en12142675
AMA Style
Al-Zakwani SS, Maroufmashat A, Mazouz A, Fowler M, Elkamel A. Allocation of Ontario’s Surplus Electricity to Different Power-to-Gas Applications. Energies. 2019; 12(14):2675. https://doi.org/10.3390/en12142675
Chicago/Turabian StyleAl-Zakwani, Suaad S., Azadeh Maroufmashat, Abdelkader Mazouz, Michael Fowler, and Ali Elkamel. 2019. "Allocation of Ontario’s Surplus Electricity to Different Power-to-Gas Applications" Energies 12, no. 14: 2675. https://doi.org/10.3390/en12142675
Note that from the first issue of 2016, this journal uses article numbers instead of page numbers. See further details here.