Challenges in the Electromagnetic Modeling of Road Embedded Wireless Power Transfer
by
 , , and
Vincenzo Cirimele
1,* ,
,
Riccardo Torchio
2 ,
,
Antonio Virgillito
1,
Fabio Freschi
1 and
Piergiorgio Alotto
2 1
Department of Energy “G. Ferraris”, Politecnico di Torino, Corso Duca degli Abruzzi, 24, 10129 Torino, Italy
2
Department of Industrial Engineering, University of Padova, Via Gradenigo, 6/a, 35131 Padova, Italy
*
Author to whom correspondence should be addressed.
Energies 2019, 12(14), 2677; https://doi.org/10.3390/en12142677
Submission received: 12 June 2019
/
Revised: 8 July 2019
/
Accepted: 9 July 2019
/
Published: 12 July 2019
(This article belongs to the Special Issue Intelligent Wireless Power Transfer System and Its Application)
Abstract
:In this paper, starting from the experimental experience of the road embedment of a transmitting coil for wireless power transfer, a numerical model of such device is constructed. The model is then used to perform several parametric analyses which aim at investigating the influence of the main electromagnetic parameters of the concrete and the geometrical parameters of the wireless power transfer on the overall behavior of the device. The results of such study allow for providing guidelines for the design of the coil and the choice of the materials for the embedment. Moreover, as a secondary result of the adopted methodology, the electromagnetic characterization of the concrete adopted for the road embedment is obtained.
1. Introduction
Recent automotive sales reports show the increasing market share of electric vehicles. This growth is mainly supported by the advances and the wider availability of charging infrastructures. However, this rapid evolution is strictly related to urban environments in which the typical travel distances are compatible with the still limited range allowed by the current battery technology [1]. The lower energy density of traction batteries compared with classic fossil fuels still represents the strongest barrier to the full development of the electric mobility also for long trips.
Many car manufacturers as well as public authorities are indicating dynamic wireless power transfer (WPT) technology as a possible solution to overcome this limitation and enhance the societal acceptance and the widespread adoption of electric vehicles [2]. Thanks to the possibility of continuously supplying vehicles while normally driving, dynamic WPT can effectively eliminate the necessities of long stops for the recharge guaranteeing the autonomy of the battery also for long distance trips [3]. At the same time, its adoption in urban areas, and in particular for public transportation, can contribute to decreasing the battery capacity installed in the vehicle and maintaining the battery state of charge within an optimal range that guarantees a longer battery life [4].
The European Union is supporting the research on dynamic WPT by funding several research projects. The most recent one, FABRIC [5,6], successfully concluded in June 2018, demonstrated the feasibility of this technology through the development of three different dynamic WPT systems. Among these systems, the electrical engineering group of the Politecnico di Torino, Italy, has developed a system named PoliTO Charge While Driving (CWD). The development of this system has been strongly focused on the direct embedment in the road pavement of the coils, called transmitters, that give rise to the variable magnetic field that is used as vector for the transfer of energy to the coil installed under the vehicle floor, called the receiver.
The investigation of the technical issues related to the embedment of the coil in the road pavement is fundamental in order to provide technical guidelines for the future installation and use of dynamic WPT systems. These aspects were only marginally taken into account in the development of other prototypes. The most famous Online Electric Vehicle (OLEV) system developed by the Korea Advanced Institute of Science & Technology proposed the embedment of the transmitters in the road pavement by using massive plastic cases to isolate the coils with respect to the surrounding ground materials [7]. The system developed by the CIRCE institute in Spain in the framework of the Victoria project proposed the installation of the coil structure (i.e., the coil and the auxiliary ferrite and aluminum components) in dedicated manholes far from any surrounding material [8]. The SELECT research center in Utah made a similar choice by covering the coils with non metallic slabs [9]. However, despite these choices facilitate the prototyping and the testing, they are not suited for the integration in the highways because of mechanical and structural problems [10] or in relation to the safety requirements that do not allow the presence of objects sticking out from the ground. Lastly, these solutions are in general expensive.
Conversely, the PoliTO CWD aimed at the direct integration of the transmitter coils without any additional magnetic structure and by using standard roadwork materials (mainly standard Portland concrete and asphalt) with the aim of a strong cost reduction [3]. The transmitter coils are powered at a frequency of 85 kHz which is suggested by the SAE J2954 standard for static applications (i.e., with the vehicle stopped during the charge) [11] but which is being considered also for the extension to dynamic applications for interoperability reasons.
The embedment of the coils has represented a significant technical issue for the project. In fact, the first tests of embedment showed the appearance of unexpected phenomena, manifesting themselves as a strong modification in the coil impedance and a significant deviation from the behavior of an inductor. Despite a practical solution being found and the system functionality successfully proved, the origin and the physical mechanisms of these phenomena were not clearly identified. This is also because it was not possible to perform dedicated measurements according to the physical characteristics of the problem.
Electromagnetic simulation has come to the aid providing the possibility of investigating the behavior of the electromagnetic quantities involved in the process, understanding its physics and also indicating possible solutions to the problem. However, the modeling of concrete represented an important challenge because this material is not generally characterized for electromagnetic applications and its composition depends on several factors. It is worth remarking that the presented analysis focuses on the embedment in absence of reinforcing bars. As shown in [12], the presence of iron for the reinforcing structures in proximity of the WPT coils can strongly affect the performances of the system especially in terms of efficiency. However, reinforcing bars are not present in the PoliTO experiment because the referred system has been developed in the view of the installation in highway infrastructures for which reinforcing bars are typically not adopted [13].
Starting from the illustration of the embedment experiment and the description of the encountered phenomena, this paper summarizes the results of the adopted methodology and the developed tools for the construction of a model of the coil and the embedding concrete able to explain their interaction mechanisms. The developed model is then used to investigate the role and the weight of the main electromagnetic parameters of the concrete and the geometrical parameters of the coil in this interaction. The results are used to provide guidelines for the design of the coil and the choice of the materials for the embedment.
2. The Embedment Experiment
The test that allowed for experiencing the problems introduced in the previous section was carried out with the coil shown in Figure 1a. This coil consists of nine turns of litz wire with an outer diameter of 4 mm individually covered with an insulating material of thickness 12 m with a relative permittivity of 3.1. The nine turns are placed side by side forming a transmitting coil having inner dimensions 1.25 m × 0.5 m. The two terminals of the wire have been welded and inserted in the respective crimping terminals.
The impedance of the coil was measured in laboratory conditions (pre-embedment) far from any metallic object by using a Hioki 3532-50 LCR meter. The amplitude and the phase of the impedance measured at the coil terminals were registered in the frequency range 10 kHz–150 kHz. Amplitude and phase were interpreted considering an equivalent R-L series circuit. The resulting values at 85 kHz were a self-inductance H and a resistance m.
Following the preliminary measurements, the coil was placed in a dedicated basement of unreinforced concrete without any reinforcing bars (Figure 1a) and then covered with a 2 cm layer of concrete (Figure 1b). A standard Portland cement was used for both the basement and the second layer.
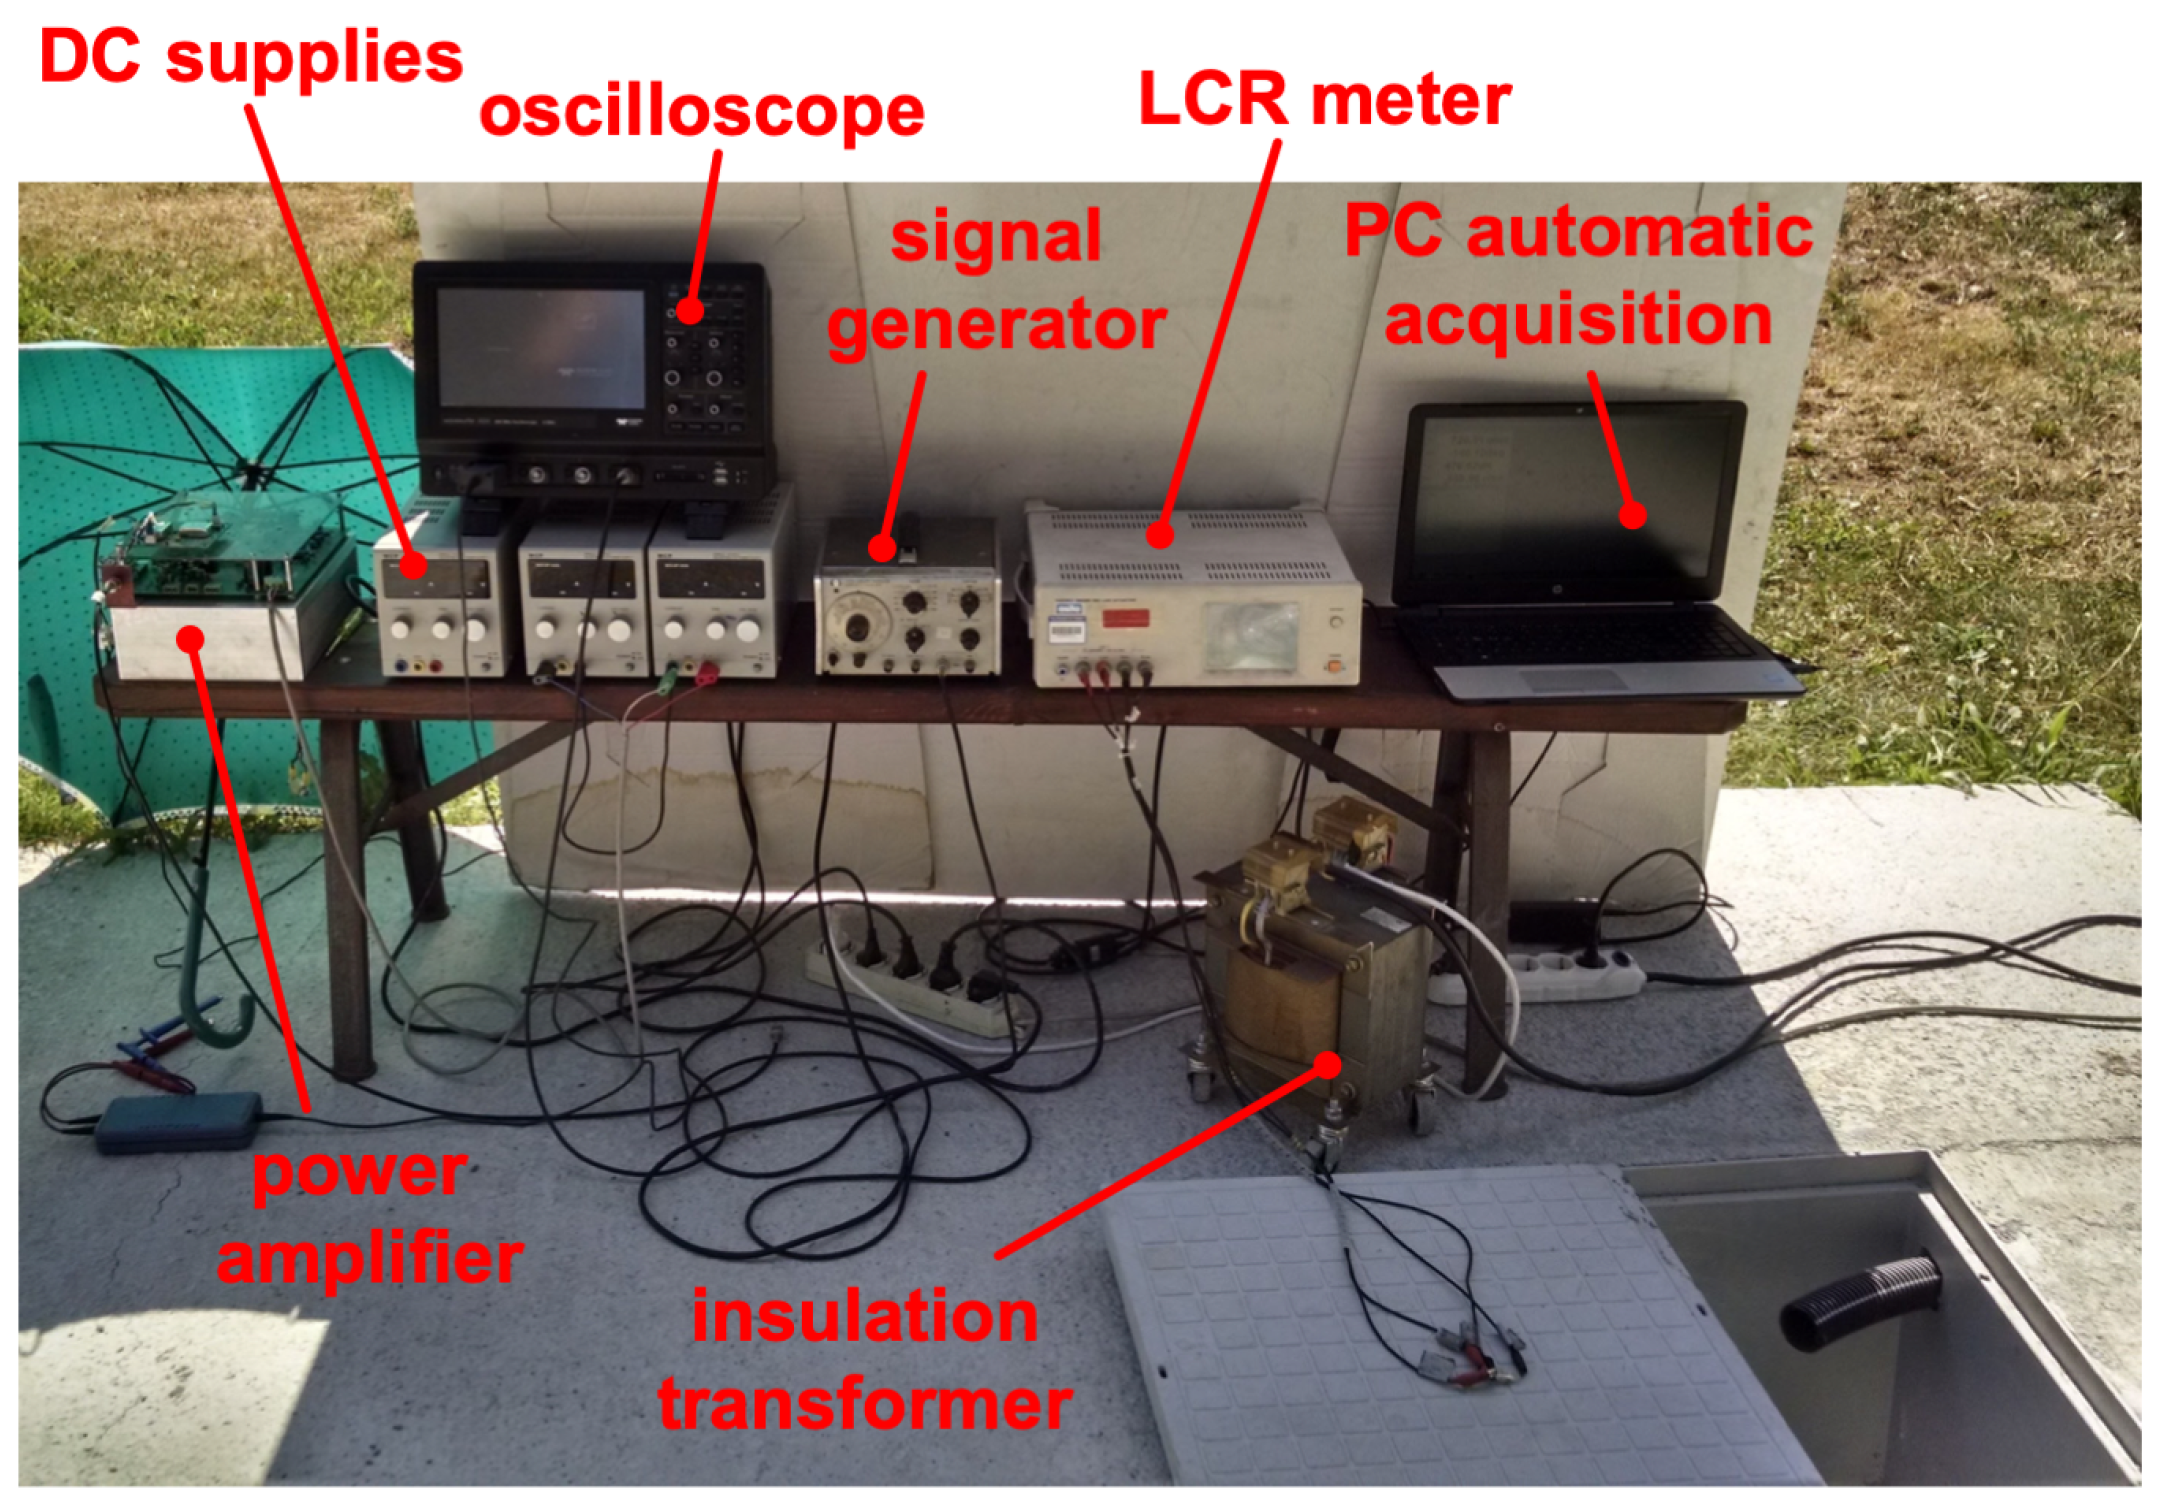
The same measurements at the coil terminals were then repeated after 28 days from the concrete pouring (post-embedment). This time interval together with the absence of precipitations allowed for a complete drying of the concrete layer. According to the physical characteristic of the problem, consisting of a large conductive object directly buried in the ground, the measurements were carried out by powering the LCR meter by means of an insulation transformer. This precaution aimed at minimizing the possible capacitive coupling between the instrument, the power cables and the ground. The measurements were automatized with a PC via a serial interface. The adopted test setup is shown in Figure 2.
The results of pre and post-embedment measurements are reported in Figure 3. The comparison clearly shows a strong deviation of the post-embedment behavior from the pre-embedment one. The amplitude of the impedance is clearly nonlinear with the frequency, and the phase starts to drop down above 50 kHz. The interpretation of the measurements with an R-L series model provided values of resistance and self-inductance at 85 kHz equal to and 293 H, respectively. It is worth noting that these values are the result of an interpretation of the measured amplitude and phase of the impedance on the basis of an R-L series model. This means that the values do not have a univocal correspondence to the physical values of resistance and inductance of the coil.
A second post-embedment test on the coil was then performed in order to assess the correctness of the results provided by the LCR meter. This second test was carried out by supplying the coil through a power source composed of a signal generator and a linear power amplifier (both visible in Figure 2). This is in order to exclude the possibility that the deviation was due to unforeseen nonlinearity phenomena in correspondence of low electromagnetic field values generated by the coil. In the test, the power amplifier was regulated to power the coil with a current up to 2 A rms. Voltage and current applied to the coil were registered with a Teledyne LeCroy Wavesurfer 3024 digital oscilloscope. The measurements were repeated by sampling the frequency range only in few points, nevertheless the results confirmed the reliability of the measurements obtained from the LCR meter, clearly indicating that the embedment introduced phenomena of electromagnetic interaction between the coil and the surrounding materials that modified the behavior of the coil moving it away from the inductive behavior expected for the correct operation of an IPT system.
A final set of measurements was carried out after the application of a final layer of cold asphalt (Figure 1c) necessary to guarantee the performances in terms of wear and grip requested for road paving. However, the measurements carried out following the application of the asphalt layer did not introduce any appreciable additional modification to the behavior of the coil.
These unexpected results have prompted the beginning of the investigation reported in the present paper. Direct measurements can characterize the coil from the circuit point of view, allowing a description as a two-terminal component. In order to understand the physical behavior, it is necessary to have an insight of the point-wise field quantities, like the current density in the region surrounding the coils. For this reason, the coil and the surrounding materials are numerically modeled and the problem is studied through electromagnetic simulations.
3. Electromagnetic Characterization of Concrete
The modeling of concrete for the sake of electromagnetic simulation requires the knowledge of the three main electromagnetic properties:
- electric resistivity ,
- relative electric permittivity ,
- relative magnetic permeability .
Concrete is a complex material that can consist of different chemical mixtures of cements and is usually heterogeneous and porous so that it holds back water. The water content strongly influences the electrical properties of concrete so their values can vary in a wide range. Many studies have dealt with the measurement of the electrical parameters of concrete for different applications and different frequency ranges. Among them, the authors in [14] mainly focuses on the use of concrete for electromagnetic shielding applications and provides values of relative permittivity that range from 4.8 to 12.8, depending on the moisture content, for frequencies in the order of 1 GHz. The authors in [15] provide values of relative permittivity that go from 4 to 20 at a frequency of 100 MHz. As far as resistivity is concerned, the ranges are even wider. For example, the IEEE standard 80–2000 on AC substations grounding [16] provides a range for the resistivity that goes from 21 m to m. On the other hand, the scientific literature agrees on considering concrete a non-ferromagnetic material assigning a relative magnetic permeability .
This very wide range of values for the electrical parameters made it impossible to find a priori a set of data directly usable for the modeling of the physical problem encountered in the real application. For this reason, we developed a dedicated measurement arrangement for the characterization of the concrete adopted for the embedment of the coil.
3.1. Methodology and Measurement Setup
The scientific literature devoted to the electromagnetic characterization of concrete points out the double conductive and dielectric nature of concrete [14,17,18]. A general medium having both conductive and dielectric behavior inserted between two electrodes can be represented through a simplified model given by the parallel of a capacitor and a resistor [19]. Hence, the values of capacitance and resistance can be extracted by means of the measurement of an impedance on the base of the following equation:
where is the angular frequency of the applied voltage.
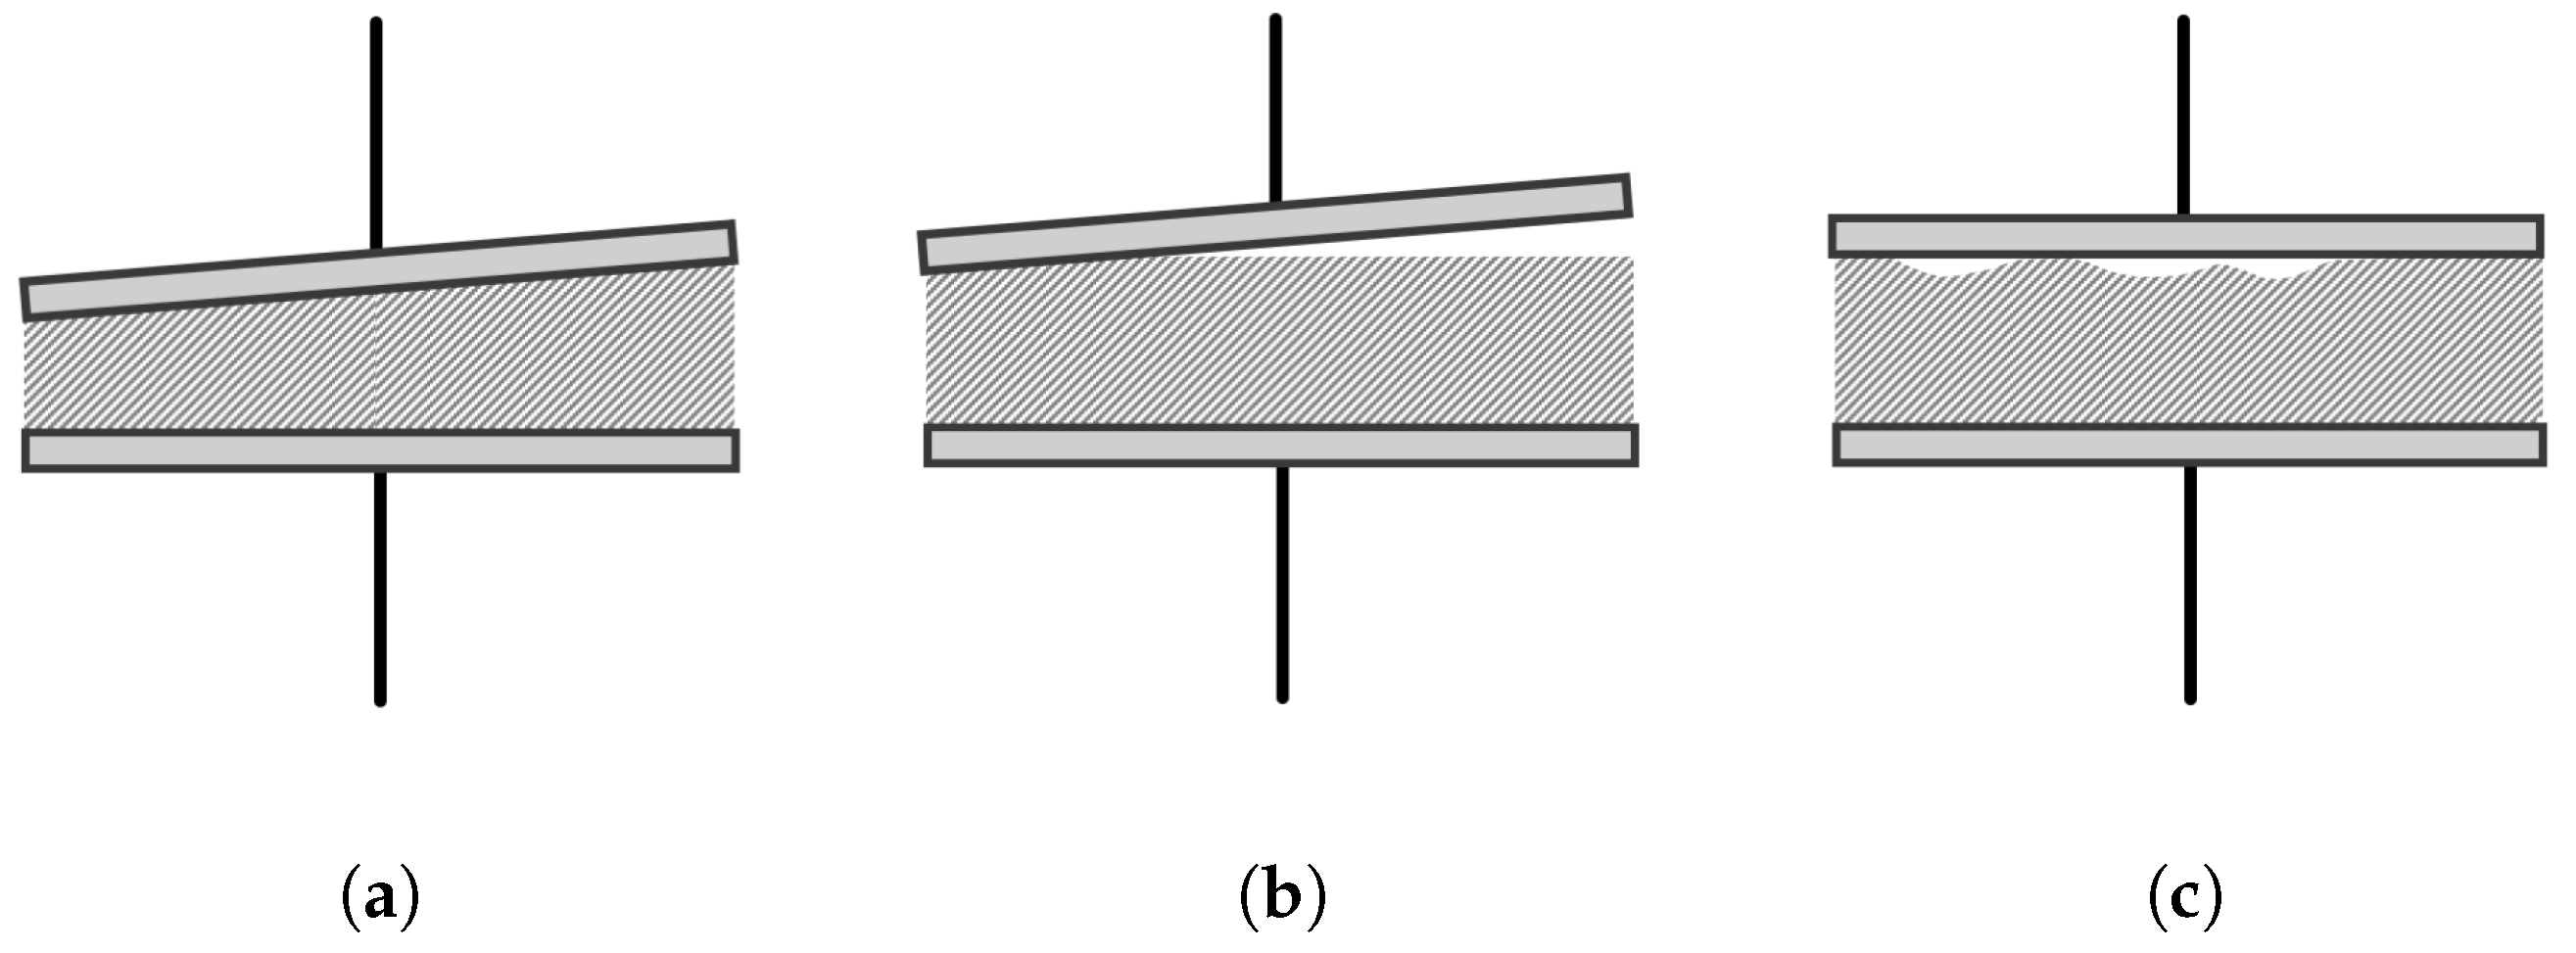
Among the different techniques for the evaluation of the electrical properties of materials, some studies were devoted to the materials used in road works [20], or precisely on IPT systems [21], make use of a parallel-plates capacitor structure using the material under test as dielectric/conductive element between the plates. However, this approach can present several problems qualitatively represented through the sketches shown in Figure 4. Mainly, these problems are related to the control of the relative positioning of the plates and the control of the adhesion of the material under test to guarantee the absence of air between the plates and the material itself. The first problem can be solved by inserting rigid spacers inside the material under test in order to guarantee the parallelism and the desired distance between the plates (i.e., solve the problems represented through Figure 4a,b). However, the insertion of the spacers would mean the modification of the medium properties. In this case, the extraction of the desired parameters from the measurements implies the development of a complex model able to take into account the introduced modification. The second problem (i.e., the one represented in Figure 4c) can be solved by pouring the material still wet. In this case, the use of a proper container for the material and a mechanical device that maintains the contact between the upper plate and the material during the drying phase is mandatory.
All these limitations have been overcome in the present work by developing the system shown in Figure 5. The parallel plates have been substituted by two cylindrical steel tubes acting as electrodes. The electrodes are inserted in a base made of resin aiming to maintain them parallel and at a fixed distance. A PVC tube is then inserted in order to create a container having the resin base as bottom cap. In this way, the wet concrete can be poured directly in the container. This guarantees the perfect alignment of the electrodes and the good adhesion of the material under test. Moreover, the use of this geometry with cylindrical surfaces at a very short distance, compared to the other dimensions of the electrodes, allows for neglecting the boundary effects and almost considering the totality of electric field lines perpendicular to the surface of the electrodes. The distance between the electrodes has been chosen large enough to guarantee that the aggregates present in the concrete could pass between them and small enough to maximize the capacitance between the electrodes improving the accuracy of the measurement. Finally, the chosen distance was 2 mm with the diameter of the electrodes equal to 50 mm. It is worth noting that the resin for the base was chosen among the materials for which the electric parameters is known with high accuracy. In this case, and m.
Once the concrete has dried, it is possible to connect an LCR meter to the electrodes and evaluate the ensemble of the lumped parameters as sketched in Figure 6. The three capacitances , and represent the lumped capacitances associated with the segments of the electrodes that are in the air, in the concrete under test and in the resin base, respectively. Conversely, since the air and the resin can be considered as perfect insulating materials at the adopted measurement voltage, only the resistance is present, which represents the lumped resistance of the concrete under test.
However, the relations that link the geometry of the system, permittivity and resistivity to the resistance and the capacitance are not known a priori for this new geometry. In this case, these relations can be generally expressed as:
where and are form factors for the capacitance and the resistance, respectively. The form factors for the developed device have been evaluated by filling the device with different materials of known permittivity and/or resistivity, measuring the resulting and by means of the LCR meter and applying Equations (2) and (3). The resulting values have been averaged and expressed as the two form factors per unit of length (in millimeters)
These form factors can be applied to the different layers of material along the electrodes’ length. The global form factors associated with the different layers are reported in Table 1.
Finally, the relative permittivity and the resistivity of the concrete under measurement can be derived, according to Equation (1), from the measurement of the overall capacitance and resistance of the measurement device and applying the following relations:
3.2. Measurements
Once the device has been characterized, it has been prepared for the measurement as shown in Figure 7. The concrete has been prepared by using the components (i.e., cement, aggregates, sand and water) in the most similar relative amount used for the embedment of the coil. In this phase, the different components have been mixed (Figure 7a) aimed at achieving the most uniform and homogeneous compound possible. The concrete has then been poured in the measurement device (Figure 7b) and vibrated (Figure 7c) in order to facilitate the expulsion of residual air. The device prepared in this way has been left to dry.
The measurements have been carried out after 28 days from pouring, similarly to the embedment experiment, by using a Hioki IM 3536 LCR meter connected as shown in Figure 8. A thin metallic film has been applied to the outer walls of the PVC tube and connected to the ground of the LCR meter. The use of this film, called guard shield, allows for ensuring that the overall electric field generated by the electrodes remains confined inside the concrete avoiding possible undesired interactions with other metallic objects in proximity of the device.
The measurement has been carried out in the frequency range from 10 kHz to 200 kHz and automatically registered by a PC communicating with the LCR meter. The measured amplitude and phase of the device have been interpreted as a parallel of a capacitance and a resistance (i.e., and ). The values of relative permittivity and resistivity obtained by these measurement are reported in Figure 9a,b, respectively.
The results point out that concrete has a marked conductive behavior. This predominant conductive behavior causes the huge values obtained for the relative permittivity at the lowest frequencies. The large values of permittivity are typical in the measurement of the permittivity of lossy dielectrics [22] for which polarization effects are usually overshadowed by conduction [23].
On the LCR meter side, this condition translates in a huge and non-physical value of capacitance and, thus, relative permittivity. The measurements become reliable for higher frequencies in correspondence of which the imaginary component of the device impedance (i.e., the capacitive reactance) becomes better appreciable by the instrument. If the frequency is increased, the behavior of the permittivity tends to a local asymptote indicated by the orange dashed line in the figure.
A sample of the values presented in the graphs of Figure 9 is reported in Table 2. These values show that resistivity remains stable in the whole range of frequency. According to this, the value of resistivity of m measured at 85 kHz has been chosen as representative for the modeling of the material. Conversely, the asymptotic value of 26.72 has been considered for relative permittivity.
As far as the parametric analysis of Section 4.2 is concerned, values between 10 m and 1000 m have been chosen as representative of typical applications, since indeed such values have been encountered in our experiments, depending, e.g., on ambient humidity. Indeed, the IEEE standard suggests an even wider range with values up to m, which we however deemed too wide for typical scenarios and which would not significantly alter our conclusions.
4. Numerical Model and Parametric Analysis
After obtaining the electromagnetic characterization of the concrete with the previously described procedure, a numerical model based on the Partial Element Equivalent Circuit (PEEC) method, proposed in [24,25] and then extended in [26], was built. Moreover, with the aim of reducing the computational effort required by the simulations, the code was coupled with the low-rank compression techniques based on hierarchical–matrices and Adaptive Cross Approximations implemented in the HLIBpro library [27], as proposed in [28,29].
The PEEC method, contrary to the Finite Element Method (FEM), is based on an integral representation of Maxwell’s equations. The method allows for a useful and rigorous circuit interpretation of the electromagnetic phenomena. Indeed, the geometrical mesh entities (i.e., faces and volumes) are interpreted as branches and nodes of an equivalent and fully coupled electric circuit.
Electromagnetic interactions between the circuit elements are represented by means of partial self and mutual inductances and coefficient of potentials (i.e., capacitive effects), which can be evaluated by means of analytical procedures based on singularity extraction techniques, as proposed by several authors [30,31,32,33].
Thanks to its direct derivation from the full-Maxwell equations and for the use of analytical formulas for the evaluation of the self and mutual coefficients, the adopted PEEC method allows for rigorous simulations avoiding the introduction of distortions and simplifications which instead a simplistic analysis based on concentrated circuit parameters would produce. Moreover, contrary to FEM, the imposition of artificial boundary conditions (which may introduce some distortions on open boundary problems) is not required.
For all these reasons, the adopted PEEC method is rigorous and perfectly suited for the open boundary problem which is addressed in this paper.
4.1. Model Validation
First, for validation purposes, a PEEC model of the pre-embedment coil was developed. The nine turns of the coil previously described in Section 2 have been modeled as nine open turns. Then, thanks to the circuit interpretation provided by the PEEC method, eight short circuits have been inserted in order to virtually connect the nine turns of the coil model. Moreover, a lumped voltage source connected to the most internal and external turns has been applied in order to feed the coil. In Figure 10, a detail of the connection between the nine coil turns and the lumped elements is shown.
Thanks to the use of the litz wire, a uniform current distribution can be assumed in the cross section of the coil turns. Thus, at the frequency range of interest, the nine turns have been modeled with only one mesh element in the cross section and a conductivity of MS/m. The coil model has been simulated in the range from 10 kHz to 150 kHz. The results in terms of equivalent impedance were almost R = 70 m and L = 207 H for each frequency value, which is in good agreement with the measurements.
Subsequently, a model of the road embedded coil (i.e., coil turns and concrete) was constructed. The PEEC model of the embedded coil has been validated against the results of Figure 3 (post–embedment). According to Table 2, a resistivity of 11.8 m and a permittivity of 26.7 has been assigned to the concrete PEEC model. A frequency sweep simulation has been carried out from 10 kHz to 150 kHz. The results in terms of the equivalent impedance (amplitude and phase) are shown in Figure 11 where they are compared with the measured values. As can be seen, the numerical results show a good agreement, proving the suitability of the constructed PEEC model to represent the physical device.
Then, with the purpose of reducing the computational effort of the parametric simulations and with the aim of understanding the physical phenomena in more detail, the amount of cement which is actually significant for the electromagnetic model has been investigated. In particular, the frequency sweep simulation has been repeated with progressively smaller cement models domain until a difference of 3% in the amplitude of the equivalent impedance was reached. This study showed that only the concrete close to the turns (particularly the one between the turns) actually influences the behavior of the coil. Thus, the PEEC model of the concrete can be substantially reduced and only the material in close proximity to the copper turns must be actually discretized. This also suggests that, when different types of concrete need to be tested in the context of laboratory experiments, a reduced amount of material can be used. The results, shown in Figure 11, have been obtained with a concrete thickness of almost three times the diameter of the copper coils.
As a further result of the simulations, it has been noticed that the electric current density (where , where is the conduction current density and is the polarization vector), in the concrete has two main components: one which flows parallel to the current inside the winding (inductive component) and a second one which flows from the external turn to the internal one (capacitive component), accumulating charge on the interfaces between the concrete and the turns. Figure 12a,b show the qualitative behavior of (in logarithmic scale) at 10 kHz and 100 kHz, respectively. As can be seen, when the frequency is low, the inductive component is predominant, while, with the increase of the frequency, the capacitive component becomes more relevant, significantly affecting the overall coil behavior. Indeed, the current can jump from one turn to the others through the parasitic resistive-capacitive impedance emphasized by the presence of the concrete between the turns, thus not generating the expected magnetic flux responsible for the transfer of energy via magnetic coupling with the receiver on the vehicle side.
How this effect impacts on efficiency, operation, and control of the system, while certainly fundamental for a successful commercial application is beyond the scope of this work. Instead, the considerations emerging in the next section provide useful information concerning the design of WPT systems which must be taken into account before considering their operational issues.
4.2. Parametric Analysis
After the validation step, the PEEC model of the embedded coil (here defined as Mod1) has been adopted to investigate the influence of the resistivity and the permittivity values of the concrete on the overall coil behavior (i.e., the equivalent impedance). Moreover, in order to investigate the influence of geometrical parameters of the coil, two other models of embedded coil have been generated: Mod2 was created by increasing the spacing between the coil turns (i.e., 8 mm, which is double the diameter of the wire), and Mod3 was created by increasing the thickness of the insulating material (i.e., two times the one adopted for Mod1 and Mod2) which separates the copper turns from the concrete. The spacing between the turns of Mod3 was also slightly increased of a quantity equal to the rise of the insulating layer thickness. It is worth noting that the size of the spacing between the coil turns is given with respect to the center of the turns. For this analysis, three frequency values have been selected, i.e., 20 kHz, 50 kHz, and 85 kHz. These frequency values are particularity significant since they cover the typical range of frequency of the majority of WPT systems either static and dynamic [3].
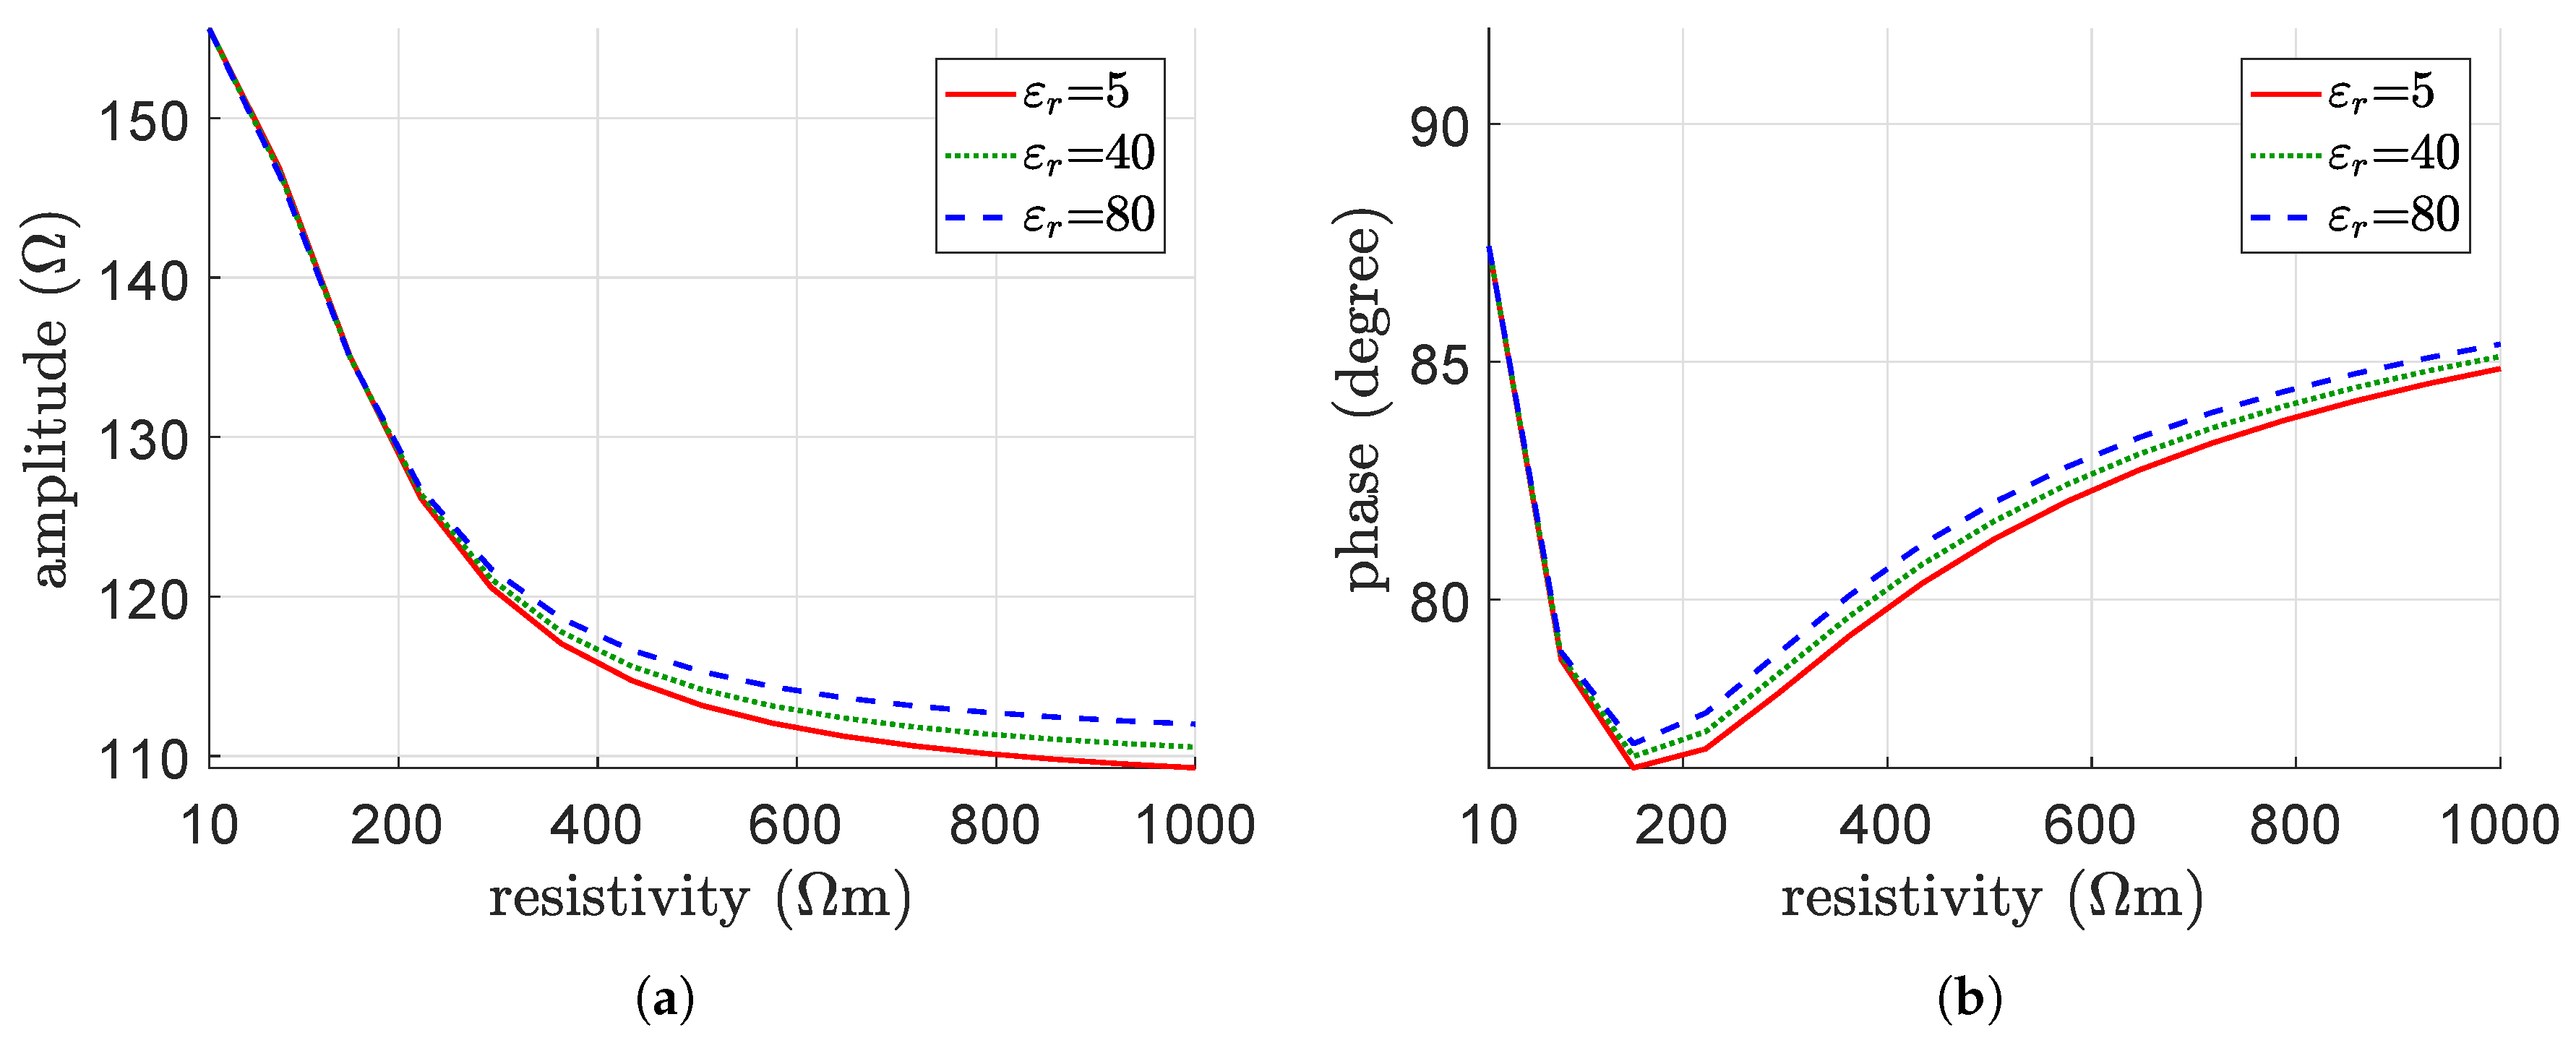
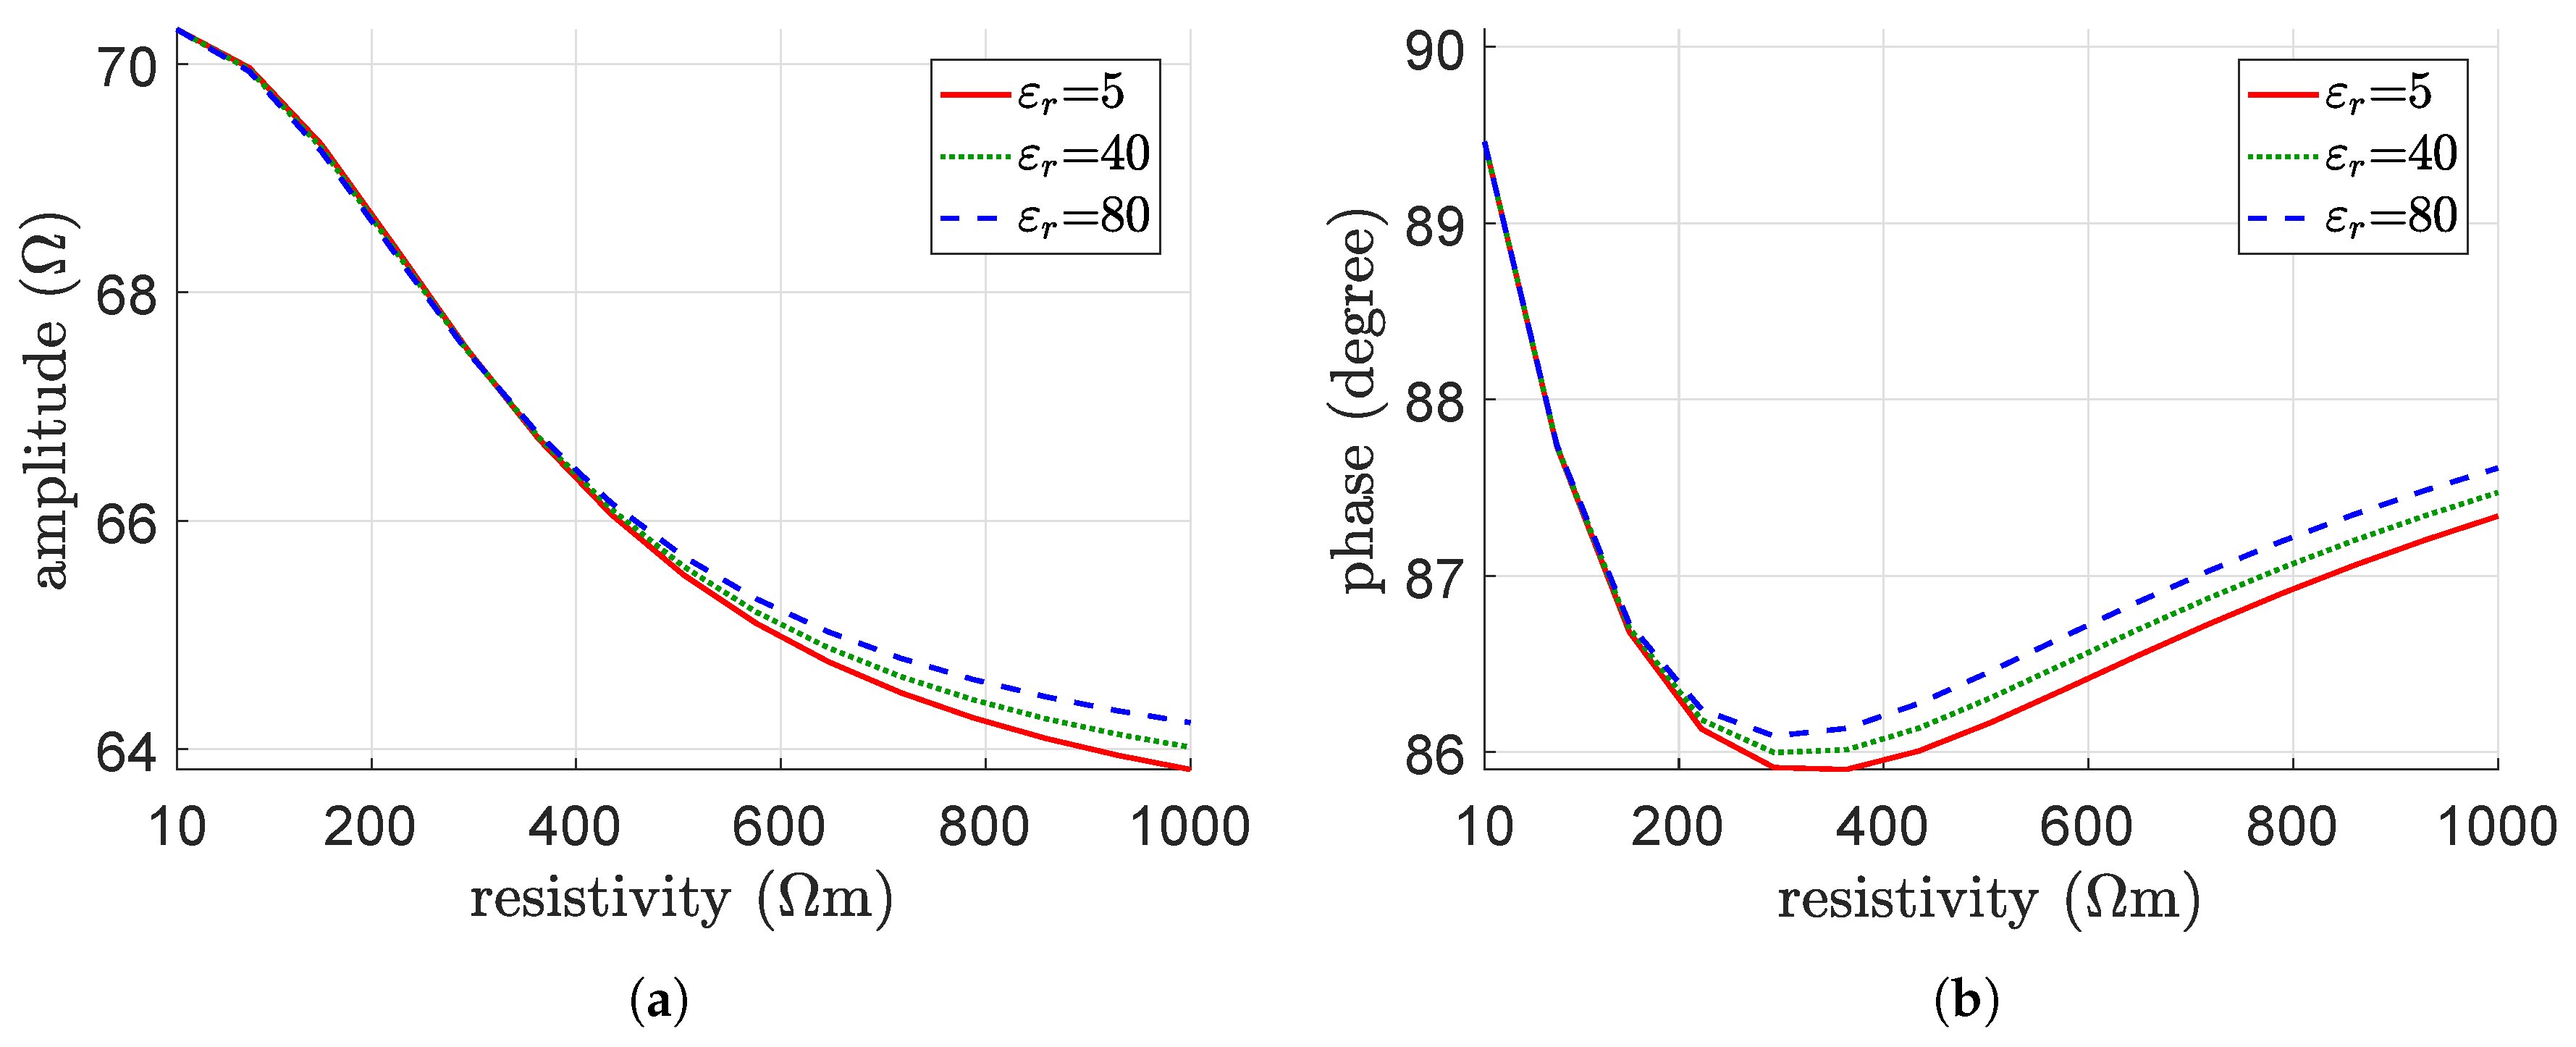
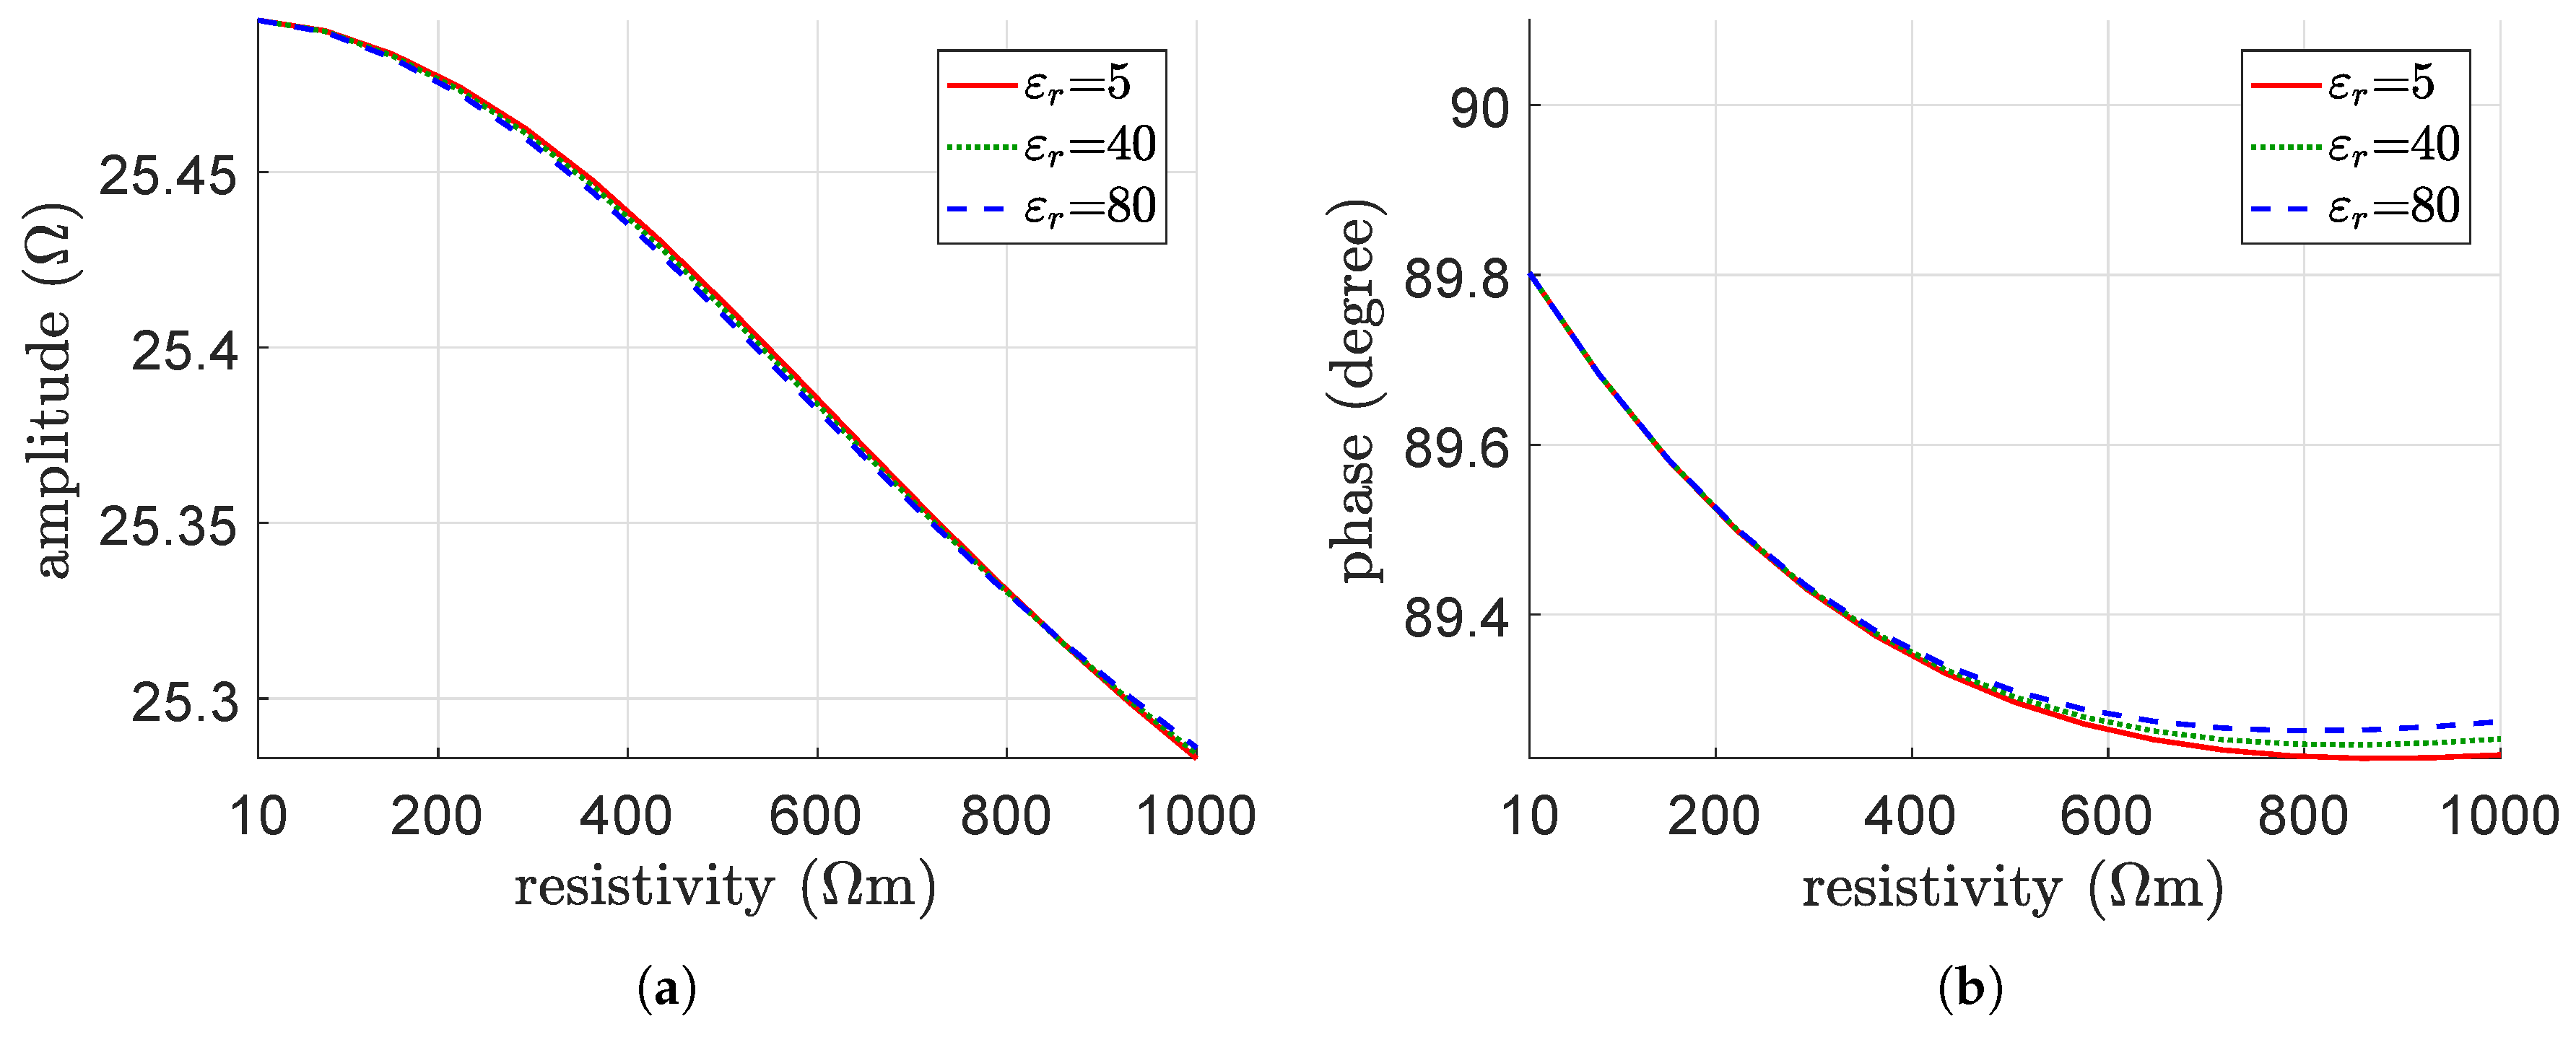
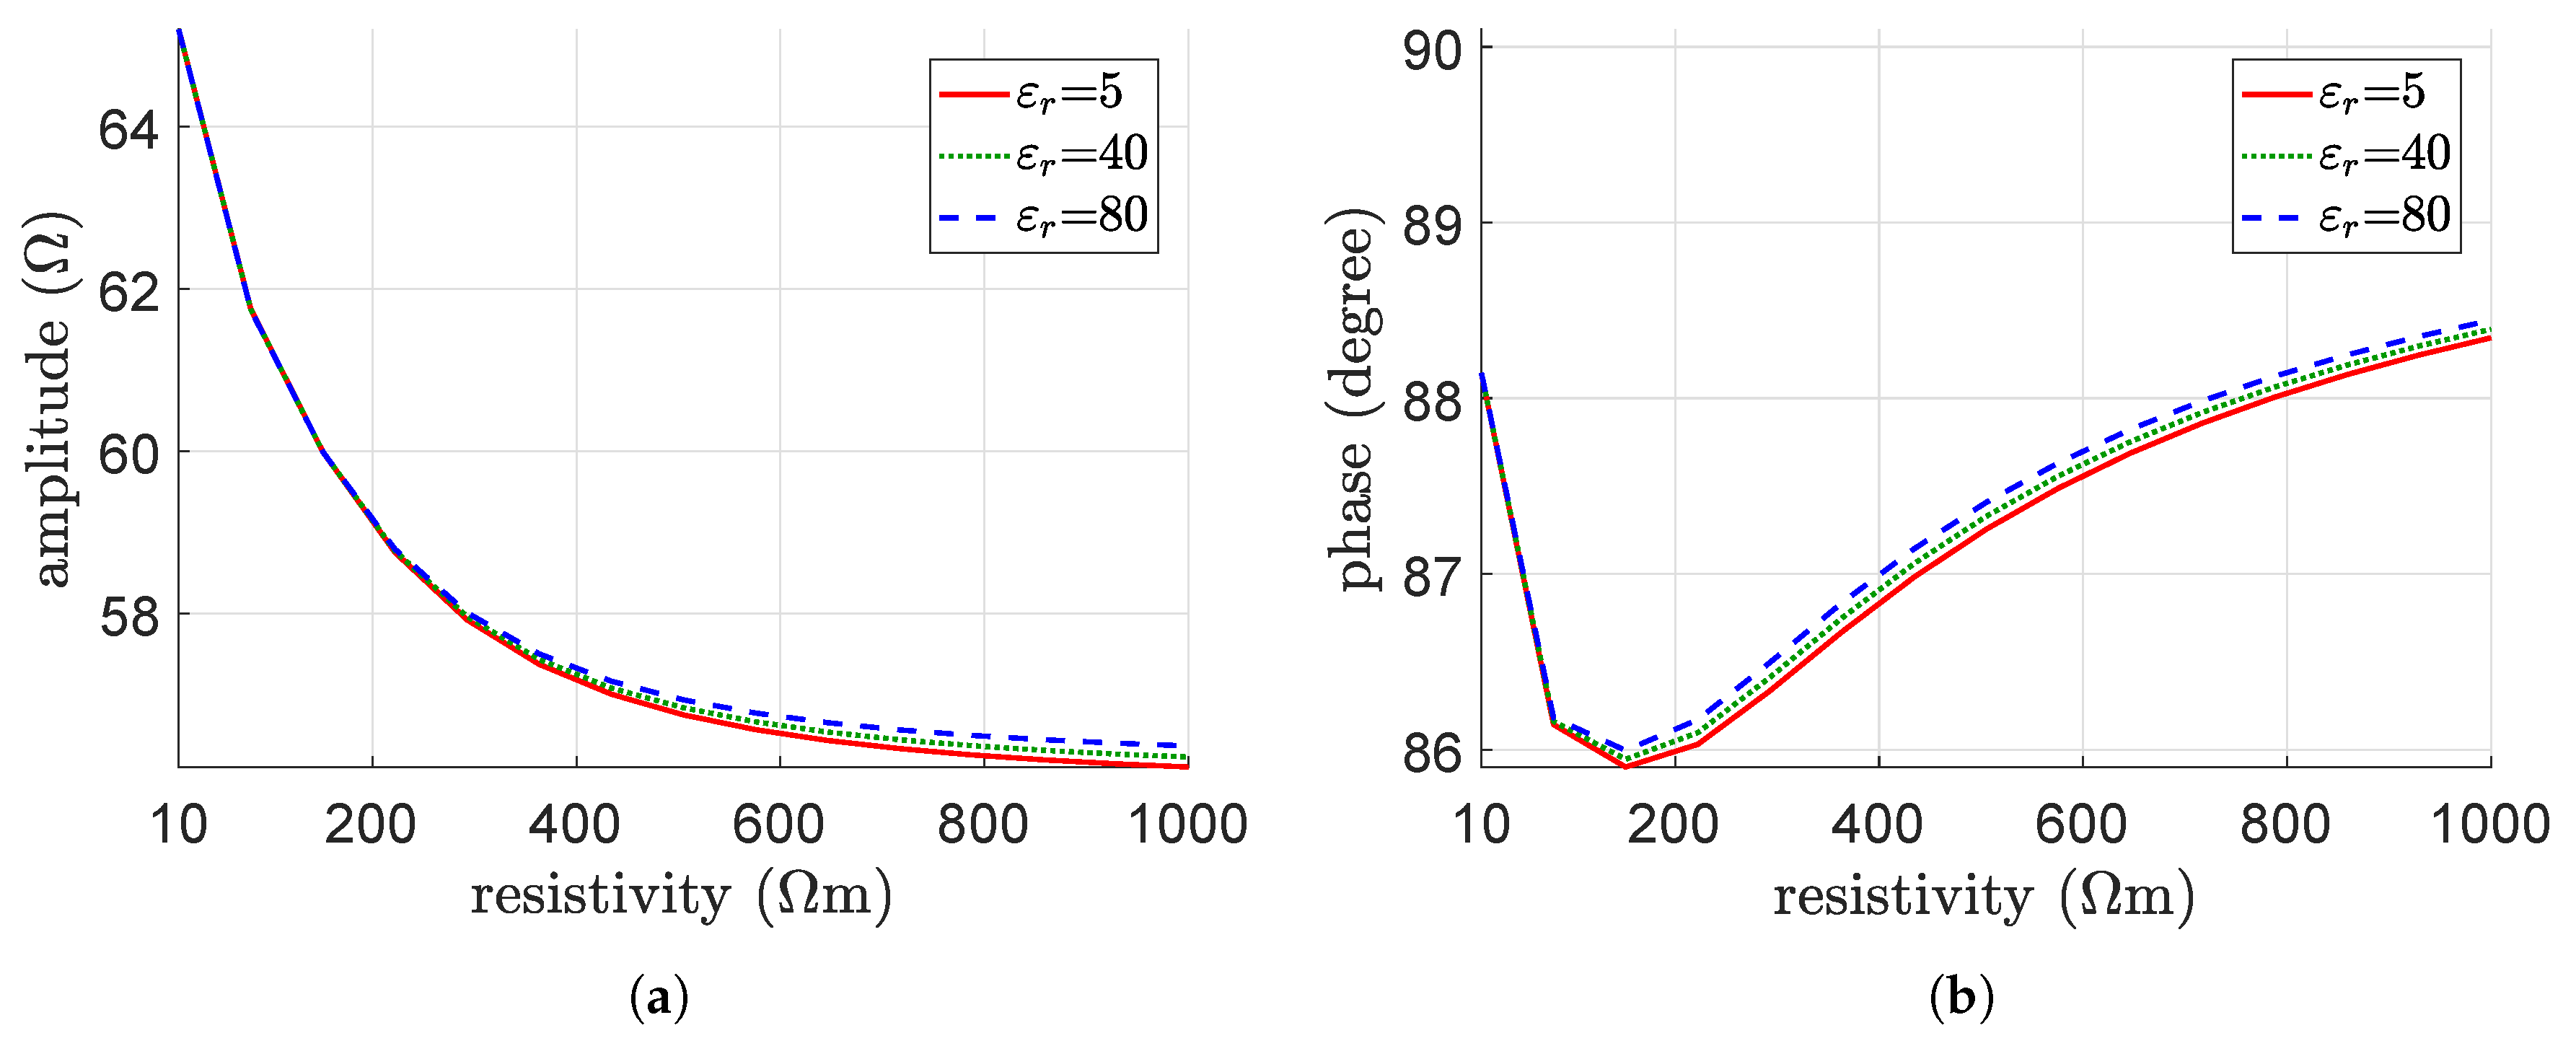
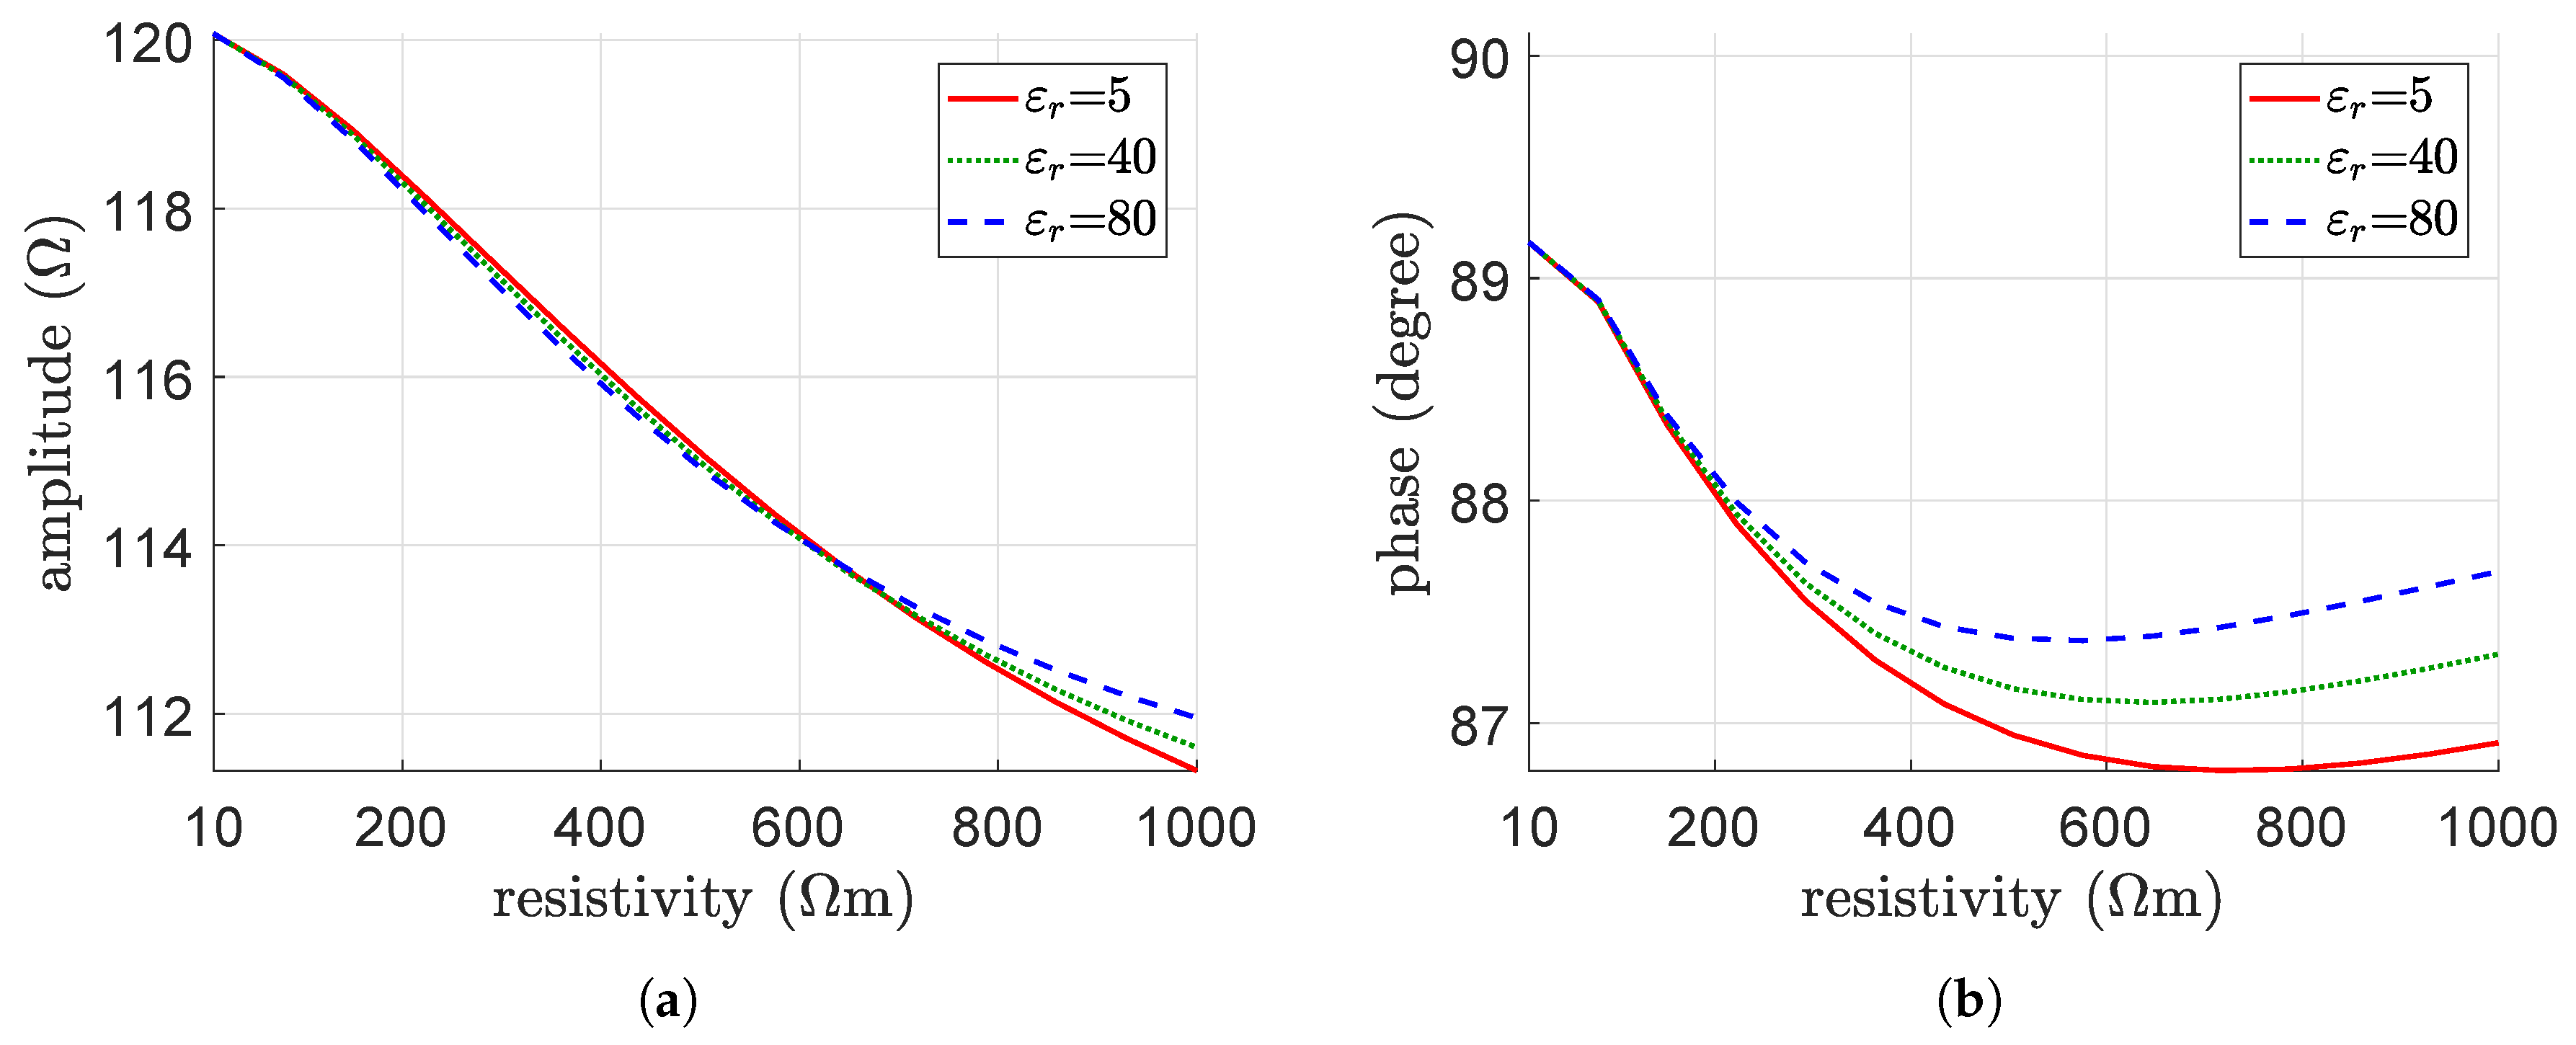
For Mod1, Mod2, and Mod3, the resistivity of the concrete has been swept from 10 m to 1000 m and three values of the relative permittivity have been selected, i.e., 5, 40, and 80. The results, in terms of the equivalent impedance (amplitude and phase) obtained from the simulations of Mod1, are shown in Figure 13, Figure 14 and Figure 15. The results related to Mod2 are shown instead in Figure 16, Figure 17 and Figure 18 while the ones related to Mod3 are shown in Figure 19, Figure 20 and Figure 21.
The results obtained from the parametric analysis (Figure 13, Figure 14, Figure 15, Figure 16, Figure 17, Figure 18, Figure 19, Figure 20 and Figure 21) show that the relative permittivity weakly influences the value of the equivalent impedance of the embedded coil. Indeed, the constitutive relation between the electric field and the electric current density , for media that exhibits both a conductive and a dielectric behavior, is given by [26]
where and are the resistivity and relative permittivity of the concrete, respectively, and is the permittivity of vacuum. Equation (8) shows that, for the range of resistivity considered in the study, the value of weakly influences the constitutive relation between and , which is instead ruled by the relatively low value of the resistivity of the concrete. Indeed, the influence of becomes more evident only for the highest resistivity values. Although such phenomenon can be generally expected, its manifestation and its dependence on the frequency and geometric parameters is not easy to quantify a priori.
Instead, Figure 13, Figure 14, Figure 15, Figure 16, Figure 17, Figure 18, Figure 19, Figure 20 and Figure 21 show that the resistivity value of the concrete strongly influences the overall coil behavior, especially for the highest frequency values.
By comparing the results obtained from Mod1 (Figure 13, Figure 14 and Figure 15) and Mod2 (Figure 16, Figure 17 and Figure 18), it can be noticed that the increasing of the spacing between the coil turns does not significantly affect the coil behavior with respect to the variation of the concrete resistivity. The results obtained from Mod3 (Figure 19, Figure 20 and Figure 21) show instead that the overall coil behavior is significantly affected by the thickness of the insulator which separates the copper turns from the concrete.
Finally, in order to allow a comprehensive understanding of the effects related to the spacing between the turns, thickness of the insulator, and the concrete resistivity, frequency sweep simulations from 10 kHz to 100 kHz have been carried out for Mod1, Mod2, and Mod3 by selecting three different values of the concrete resistivity, i.e., 10 m, 100 m, and 1000 m. The results for the three models are shown in Figure 22, Figure 23 and Figure 24 in terms of equivalent impedance (amplitude and phase) and compared with the values obtained in a pre-embedment condition.
5. Interpretation of the Results
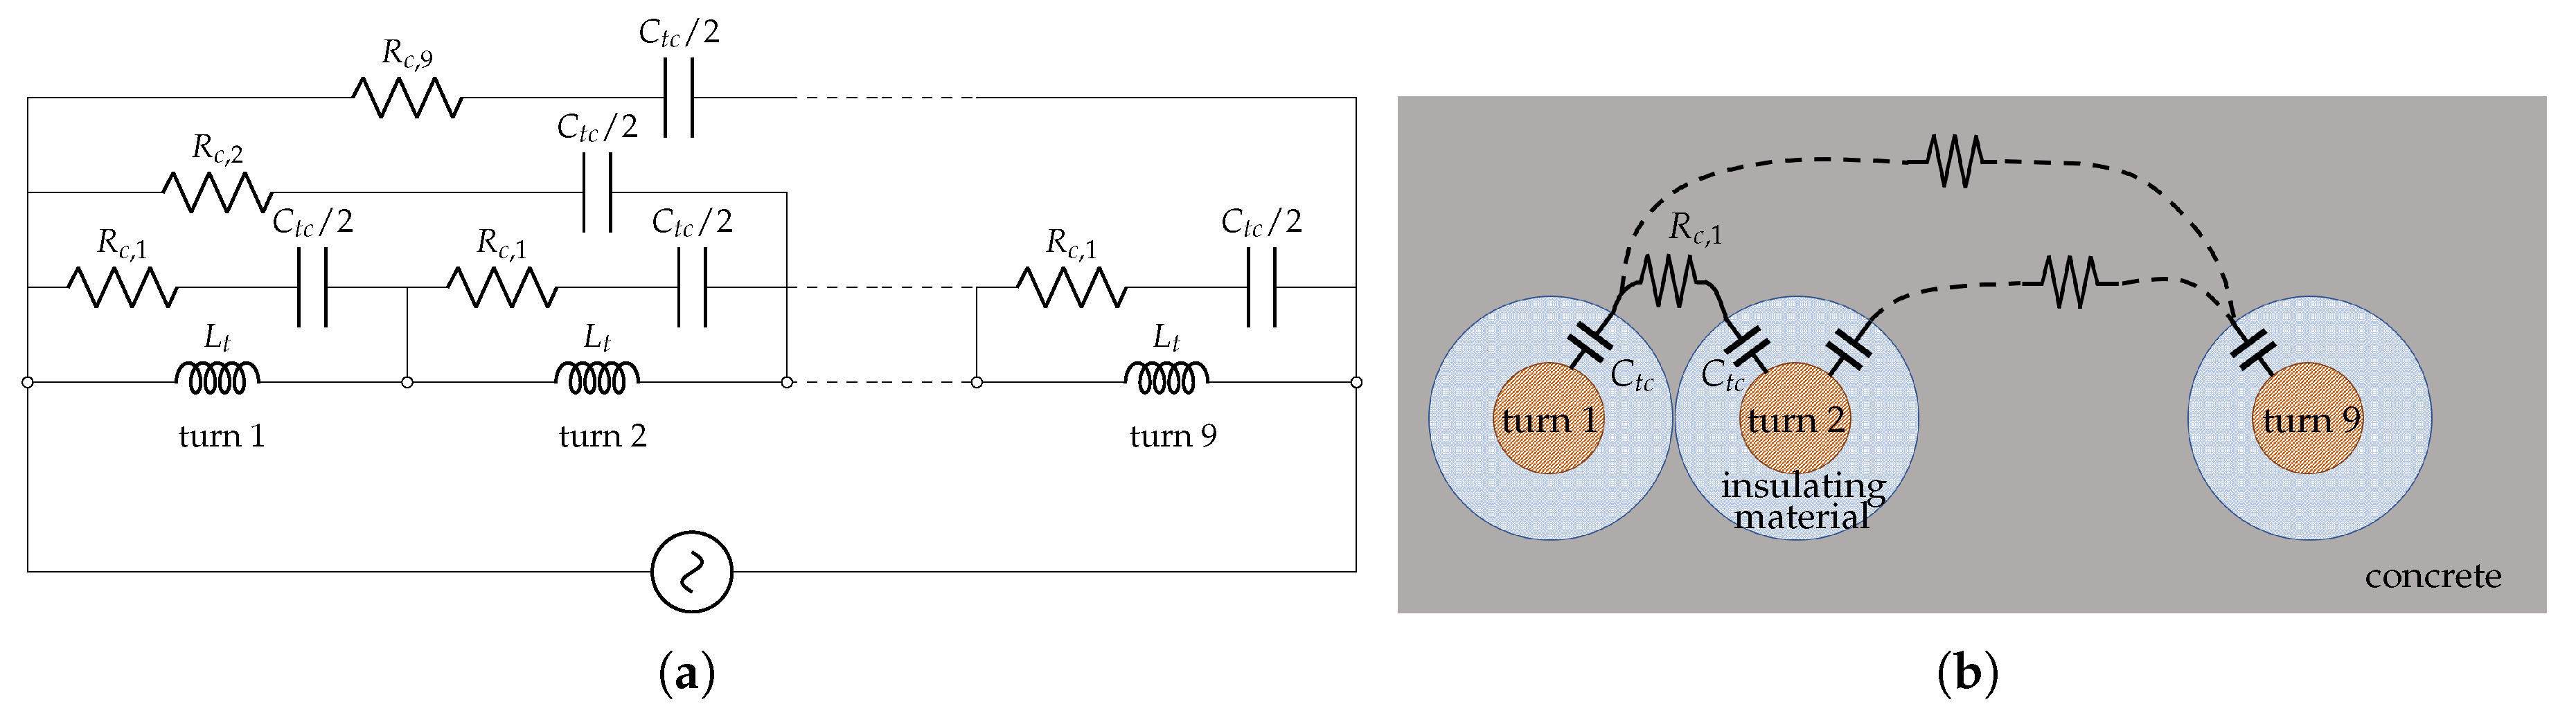
An intuitive interpretation of the phenomena explained by means of the carried out analysis can be exemplified by means of the electric circuit model shown in Figure 25a. In this model, the nine turns of the embedded coil are represented by nine ideal inductors indicated as sequentially connected and fed by an ideal voltage source. Clearly, this model neglects several other phenomena like the resistance of the conductors and the magnetic and capacitive coupling between them. The resistive-capacitive circuit branches represent the path crossed by the electric currents that jumps from one turn to another in the embedded condition. models the resistive voltage drop due to the passage of the current through the concrete ( indicates the length of the path through the concrete between turns). represents the capacitive coupling between one turn and the concrete through the insulating material. Indeed, due to the conductive behavior of the concrete, free electric charges can lay on the interfaces between the turns and the concrete, which can be interpreted as two opposite surfaces of a capacitor filled by the insulating material according to the representation sketched in Figure 25b.
With the increase of the resistivity of concrete and with the increase of the spacing between the turns, the value of increases. Moreover, with the increasing of the spacing between the turns, the capacitive coupling between two turns decreases while the coupling turn-concrete (i.e., ) remains essentially unchanged. For these reasons, the increasing of the spacing between the coil turns may help on reducing unwanted distortion on the electromagnetic behavior of the designed device, but it is not a fully resolutive solution (Figure 22 vs. Figure 23). Instead, the reduction of unwanted capacitive coupling can be obtained by increasing the thickness of the insulator which divides the turns from the concrete (Figure 24). By doing so, the capacitive coupling between turns and concrete can be damped, thus the value of decreases, increasing the related impedance.
It is worth noting that the above considerations concerning the circuit interpretation of the embedded WPT coil have the only purpose of providing an easy and intuitive interpretation of the overall phenomenon. However, as clearly stated in the paper, a comprehensive representation of the phenomenon can only be attained by means of an appropriate full electromagnetic problem simulation.
6. Conclusions
In this work, the influence of the electromagnetic parameters of the concrete on the direct road embedment of a transmitting coil for a WPT system for electric vehicles has been investigated. Such the study has been motivated by the issues which emerged during the experimental experience of the direct road embedment of a coil. The main results of this work consist of:
- the electromagnetic characterization of the concrete involved in the road embedment (at 28 days after pouring),
- the study of the influence of the turns spacing, the insulator thickness, and the concrete resistivity and relative permittivity on the overall electromagnetic behavior of the embedded coil.
The results obtained from the parametric analysis support some general conclusions concerning the direct embedment of transmitting coils.
A first consideration is that only the concrete close to the coil turns significantly affects the electromagnetic behavior of the device. Thus, the electromagnetic model of the embedded coil can be reduced, significantly saving on the computational effort required by the numerical simulations. Moreover, when the performances of a direct embedded transmitting coil want to be tested, a reduced amount of concrete can be used. In this work, the concrete model which surrounds the nine turns has been modeled with a thickness equal to almost three times the diameter of the copper coils.
A second consideration is that the overall coil behavior is weakly affected by the relative permittivity of the materials surrounding the coil turns, whose effects on the value of the equivalent impedance are visible only for the highest values of concrete resistivity.
Instead, the resistivity of the concrete considerably affects the overall electromagnetic behavior of the device. Thus, the adoption of a highly resistive concrete would be a possible choice to avoid unwanted capacitive phenomena due to the embedment. However, in the context of a real installation, the electric resistivity of the concrete should be monitored during the whole road embedment of the device. Moreover, the electromagnetic resistivity of the concrete could be significantly affected by its chemical components and by external environmental parameters (e.g., temperature and water) which may make this solution complex in practice.
From a practical point of view, the increasing of the spacing between the coil turns may help in reducing the distortion on the overall electromagnetic behavior of the device. However, the increasing of the spacing between the turns may clash against design constrains (e.g., maximum size allowed for the transmitting coil) leading to a reduced area of the coil, then a reduced coupling between the transmitting and the receiving coils (i.e., the mutual inductance decreases) and therefore a lower efficiency of the device.
The most promising solution seems to be the increase of the thickness of the insulating material which separates the copper turns from the concrete. Indeed, this measure directly affects the major source of the problem, i.e., the capacitive coupling between the coil turns and the conductive concrete. An implemented technical solution steamed from this consideration has been described in [34].
As a last option, a lower working frequency of the WPT system could be selected. Indeed, the results of Figure 15, Figure 16, Figure 17, Figure 18 and Figure 19 show that, at 20 kHz, the equivalent impedance of the device is basically not affected by the electromagnetic parameters of the concrete and, at 50 kHz, the issues are less pronounced. This result adds important information to be taken into account during the design of the system and the choice of the working frequency that, up to now, has been mainly dictated by the technology of the power electronic switching components and the materials for the construction of the magnetic structures of the coils. The model and the measurements resulting by this work will provide the basis for future investigations in which the stochastic variation of the material properties will be considered [35].
As a final remark, it is important to underline that the pointed out phenomena of interaction between the coil and the surrounding materials are qualitatively valid for every coil directly embedded in the road pavement independently on the adopted coil topology. Clearly, the extent of the analysed phenomena can change depending on the coil geometry, but the provided results can be still considered as a reference during the design.
Author Contributions
All the authors gave their contribution to all of the aspects of the manuscript.
Funding
This research received no external funding.
Conflicts of Interest
The authors declare no conflicts of interest.
References
- Bernhart, W.; Schlick, T.; Olschewski, I.; Busse, A.; Riederle, S.; Pieper, G. E-mobility Index 2018; Roland Berger GmbH Automotive Competence Center: Munich, Germany; Forschungsgesellschaft Kraftfahrwesen mbH Aachen: Aachen, Germany, 2018. [Google Scholar]
- Bateman, D.; Leal, D.; Reeves, S.; Emre, M.; Stark, L.; Ognissanto, F.; Myers, R.; Lamb, M. Electric Road Systems: A Solution for the Future—TRL ACADEMY REPORT PPR875; TRL: Wokingham, UK, 2018. [Google Scholar]
- Cirimele, V.; Diana, M.; Freschi, F.; Mitolo, M. Inductive Power Transfer for Automotive Applications: State-of-the-Art and Future Trends. IEEE Trans. Ind. Appl. 2018, 54, 4069–4079. [Google Scholar] [CrossRef]
- Choi, S.Y.; Gu, B.W.; Jeong, S.Y.; Rim, C.T. Advances in wireless power transfer systems for roadway-powered electric vehicles. IEEE J. Emerg. Sel. Top. Power Electron. 2015, 3, 18–36. [Google Scholar] [CrossRef]
- Amditis, A.; Karaseitanidis, G.; Damousis, I.; Guglielmi, P.; Cirimele, V. Dynamic wireless charging for more efficient FEVS: The fabric project concept. In Proceedings of the MedPower 2014, Athens, Greece, 2–5 November 2014. [Google Scholar]
- FABRIC Project. Available online: https://fabric-project.eu (accessed on 8 July 2019).
- Choi, S.Y.; Gu, B.W.; Jeong, S.Y.; Rim, C.T. UltraslimS-typepower supply rails for roadway-powered electric vehicles. IEEE Trans. Power Electron. 2015, 30, 6456–6468. [Google Scholar] [CrossRef]
- Villa, J.; Sanz, J.; Peri, J.; Acerete, R. Victoria project: Static and dynamic wireless charging for electric buses. In Proceedings of the Business Intelligence on Emerging Technologies IDTechEX Conference, Berlin, Germany, 27–28 April 2016. [Google Scholar]
- Azad, A.N.; Echols, A.; Kulyukin, V.A.; Zane, R.; Pantic, Z. Analysis, Optimization, and Demonstration of a Vehicular Detection System Intended for Dynamic Wireless Charging Applications. IEEE Trans. Transp. Electr. 2019, 5, 147–161. [Google Scholar] [CrossRef]
- Chen, F.; Kringos, N. Towards new infrastructure materials for on-the-road charging. In Proceedings of the IEEE International Electric Vehicle Conference (IEVC), Florence, Italy, 17–19 December 2014. [Google Scholar]
- International SAE J2954 Standard. Wireless Power Transfer for Light-Duty Plug-In/Electric Vehicles and Alignment Methodology; SAE International: Warrendale, PA, USA, 2017. [Google Scholar]
- Lee, S.H.; Lee, B.S.; Lee, J.H. A new design methodology for a 300-kW, low flux density, large air gap, online wireless power transfer system. IEEE Trans. Ind. Appl. 2016, 52, 4234–4242. [Google Scholar] [CrossRef]
- Nikolaides, A. Highway Engineering: Pavements, Materials and Control of Quality; CRC Press: Boca Raton, FL, USA, 2014. [Google Scholar]
- Sandrolini, L.; Reggiani, U.; Ogunsola, A. Modelling the electrical properties of concrete for shielding effectiveness prediction. J. Phys. D Appl. Phys. 2007, 40, 5366. [Google Scholar] [CrossRef]
- Daniels, D. Ground Penetrating Radar, 2nd ed.; The Institute of Electrical Engineers: London, UK, 2004. [Google Scholar]
- IEEE Guide for Safety in AC Substation Grounding; IEEE Std 80-2000 (Revision of IEEE Std 80-1986); IEEE: New York, NY, USA, 2000.
- Wilson, J.G.; Whittington, H.W. Variations in the electrical properties of concrete with change in frequency. IEE Proc. A-Phys. Sci. Meas. Instrum. Manag. Educ. 1990, 137, 246–254. [Google Scholar] [CrossRef]
- Whittington, H.W.; McCarter, J.; Forde, M.C. The conduction of electricity through concrete. Mag. Concr. Res. 1981, 33, 48–60. [Google Scholar] [CrossRef]
- Reilly, J.P. Applied Bioelectricity: From Electrical Stimulation to Electropathology; Springer Science & Business Media: Berlin, Germany, 2012. [Google Scholar]
- Chen, F.; Taylor, N.; Kringos, N.; Birgisson, B. A study on dielectric response of bitumen in the low-frequency range. Road Mater. Pavement Des. 2015, 16 (Suppl. S1), 153–169. [Google Scholar] [CrossRef]
- Chen, F.; Taylor, N.; Balieu, R.; Kringos, N. Dynamic application of the Inductive Power Transfer (IPT) systems in an electrified road: Dielectric power loss due to pavement materials. Constr. Build. Mater. 2017, 147, 9–16. [Google Scholar] [CrossRef]
- Bishop, C. The relationship between loss, conductivity, and dielectric constant. Adv. Eng. Electromagn. 2001. Available online: http://pleclair.ua.edu/impedance/The%20Relationship%20Between%20Loss.pdf (accessed on 8 July 2019).
- Lorrain, P.; Corson, D.R.; Lorrain, F. Electromagnetic Fields and Waves; Freeman: Dallas, TX, USA, 1988. [Google Scholar]
- Torchio, R.; Alotto, P.; Bettini, P.; Voltolina, D.; Moro, F. A 3D PEEC formulation based on the cell method for full-wave analyses with conductive, dielectric, and magnetic media. IEEE Trans. Magn. 2017, 54, 1–4. [Google Scholar] [CrossRef]
- Freschi, F.; Repetto, M. A general framework for mixed structured/unstructured PEEC modelling. Appl. Comput. Electromagn. Soc. J. 2008, 23, 200–206. [Google Scholar]
- Torchio, R.; Moro, F.; Meunier, G.; Guichon, J.-M.; Chadebec, O. An Extension of Unstructured-PEEC Method to Magnetic Media. IEEE Trans. Magn. 2019, 55, 1–4. [Google Scholar] [CrossRef]
- Kriemann, R. HLIBPro (v.2.7.1). Available online: http://www.hlibpro.com (accessed on 18 May 2019).
- Torchio, R.; Bettini, P.; Alotto, P. PEEC-Based Analysis of Complex Fusion Magnets During Fast Voltage Transients With H-Matrix Compression. IEEE Trans. Magn. 2017, 53, 1–4. [Google Scholar] [CrossRef]
- Voltolina, D.; Bettini., P.; Alotto, P.; Moro, F.; Torchio, F. High-Performance PEEC Analysis of Electromagnetic Scatterers. IEEE Trans. Magn. 2019, 55, 1–4. [Google Scholar] [CrossRef]
- Fabbri, M. Magnetic flux density and vector potential of uniform polyhedral sources. IEEE Trans. Magn. 2018, 44, 32–36. [Google Scholar] [CrossRef]
- Järvenpää, S.; Taskinen, M.; Ylä-Oijala, P. Singularity extraction technique for integral equation methods with higher order basis functions on plane triangles and tetrahedra. Int. J. Numer. Methods Eng. 2003, 58, 1149–1165. [Google Scholar] [CrossRef]
- Arcioni, P.; Bressan, M.; Perregrini, L. On the evaluation of the double surface integrals arising in the application of the boundary integral method to 3D problems. IEEE Trans. Microw. Theory Tech. 1997, 45, 436–439. [Google Scholar] [CrossRef]
- Sievers, D.; Eibert, T.F.; Hansen, V. Correction to “On the Calculation of Potential Integrals for Linear Source Distributions on Triangular Domains”. IEEE Trans. Antennas Propag. 2005, 53, 3113. [Google Scholar] [CrossRef]
- Guglielmi, P.; Cirimele, V.; Perrone, W. Procedimento per l’installazione Diretta su Strada di Induttori per Trasferimento Induttivo di Potenza Elettrica. Italian Patent 102018000006495, 20 June 2018. [Google Scholar]
- Torchio, R.; Di Rienzo, L.; Codecasa, L. Stochastic PEEC Method Based on Polynomial Chaos Expansion. IEEE Trans. Magn. 2019, 53, 1–4. [Google Scholar] [CrossRef]
Figure 1.
Phases of the coil embedment. Coil placed on the concrete basement (a); coil covered with a second concrete layer (b); coil covered with a final cold asphalt layer (c).
Figure 1.
Phases of the coil embedment. Coil placed on the concrete basement (a); coil covered with a second concrete layer (b); coil covered with a final cold asphalt layer (c).

Figure 2.
Test setup for the measurement of the embedded coil impedance.

Figure 3.
Comparison of amplitude and phase of the coil impedance before (pre) and after (post) embedment measured by means of the LCR meter. Amplitude (a); phase (b).
Figure 3.
Comparison of amplitude and phase of the coil impedance before (pre) and after (post) embedment measured by means of the LCR meter. Amplitude (a); phase (b).

Figure 4.
Qualitative representation of the possible flaws that can be encountered when measuring the electrical parameters by using a parallel-plates capacitor. Incorrect parallelism of plates with good adhesion of the material under test (a); incorrect parallelism of plates with the presence of an air-gap (b); bad adhesion of the material under test (c).

Figure 5.
Cylindrical electrodes inserted in the resin base used for the measurement of the electric parameters. The dashed orange lines represent the shape of the PVC tube used to create the container using the resin base as cap.
Figure 5.
Cylindrical electrodes inserted in the resin base used for the measurement of the electric parameters. The dashed orange lines represent the shape of the PVC tube used to create the container using the resin base as cap.

Figure 6.
Schematization of the cross section of the device for the measurement of electric resistivity and permittivity. The lumped capacitances and resistances between the electrodes associated with the different materials are indicated in red.
Figure 6.
Schematization of the cross section of the device for the measurement of electric resistivity and permittivity. The lumped capacitances and resistances between the electrodes associated with the different materials are indicated in red.

Figure 7.
Preparation of the device for the measurement of electric parameters (resistivity and permittivity). Kneading of the concrete components (a); filling of the container with the measurement electrodes (b); hammering to facilitate the air expulsion and the homogenization of the concrete inside the container (c).
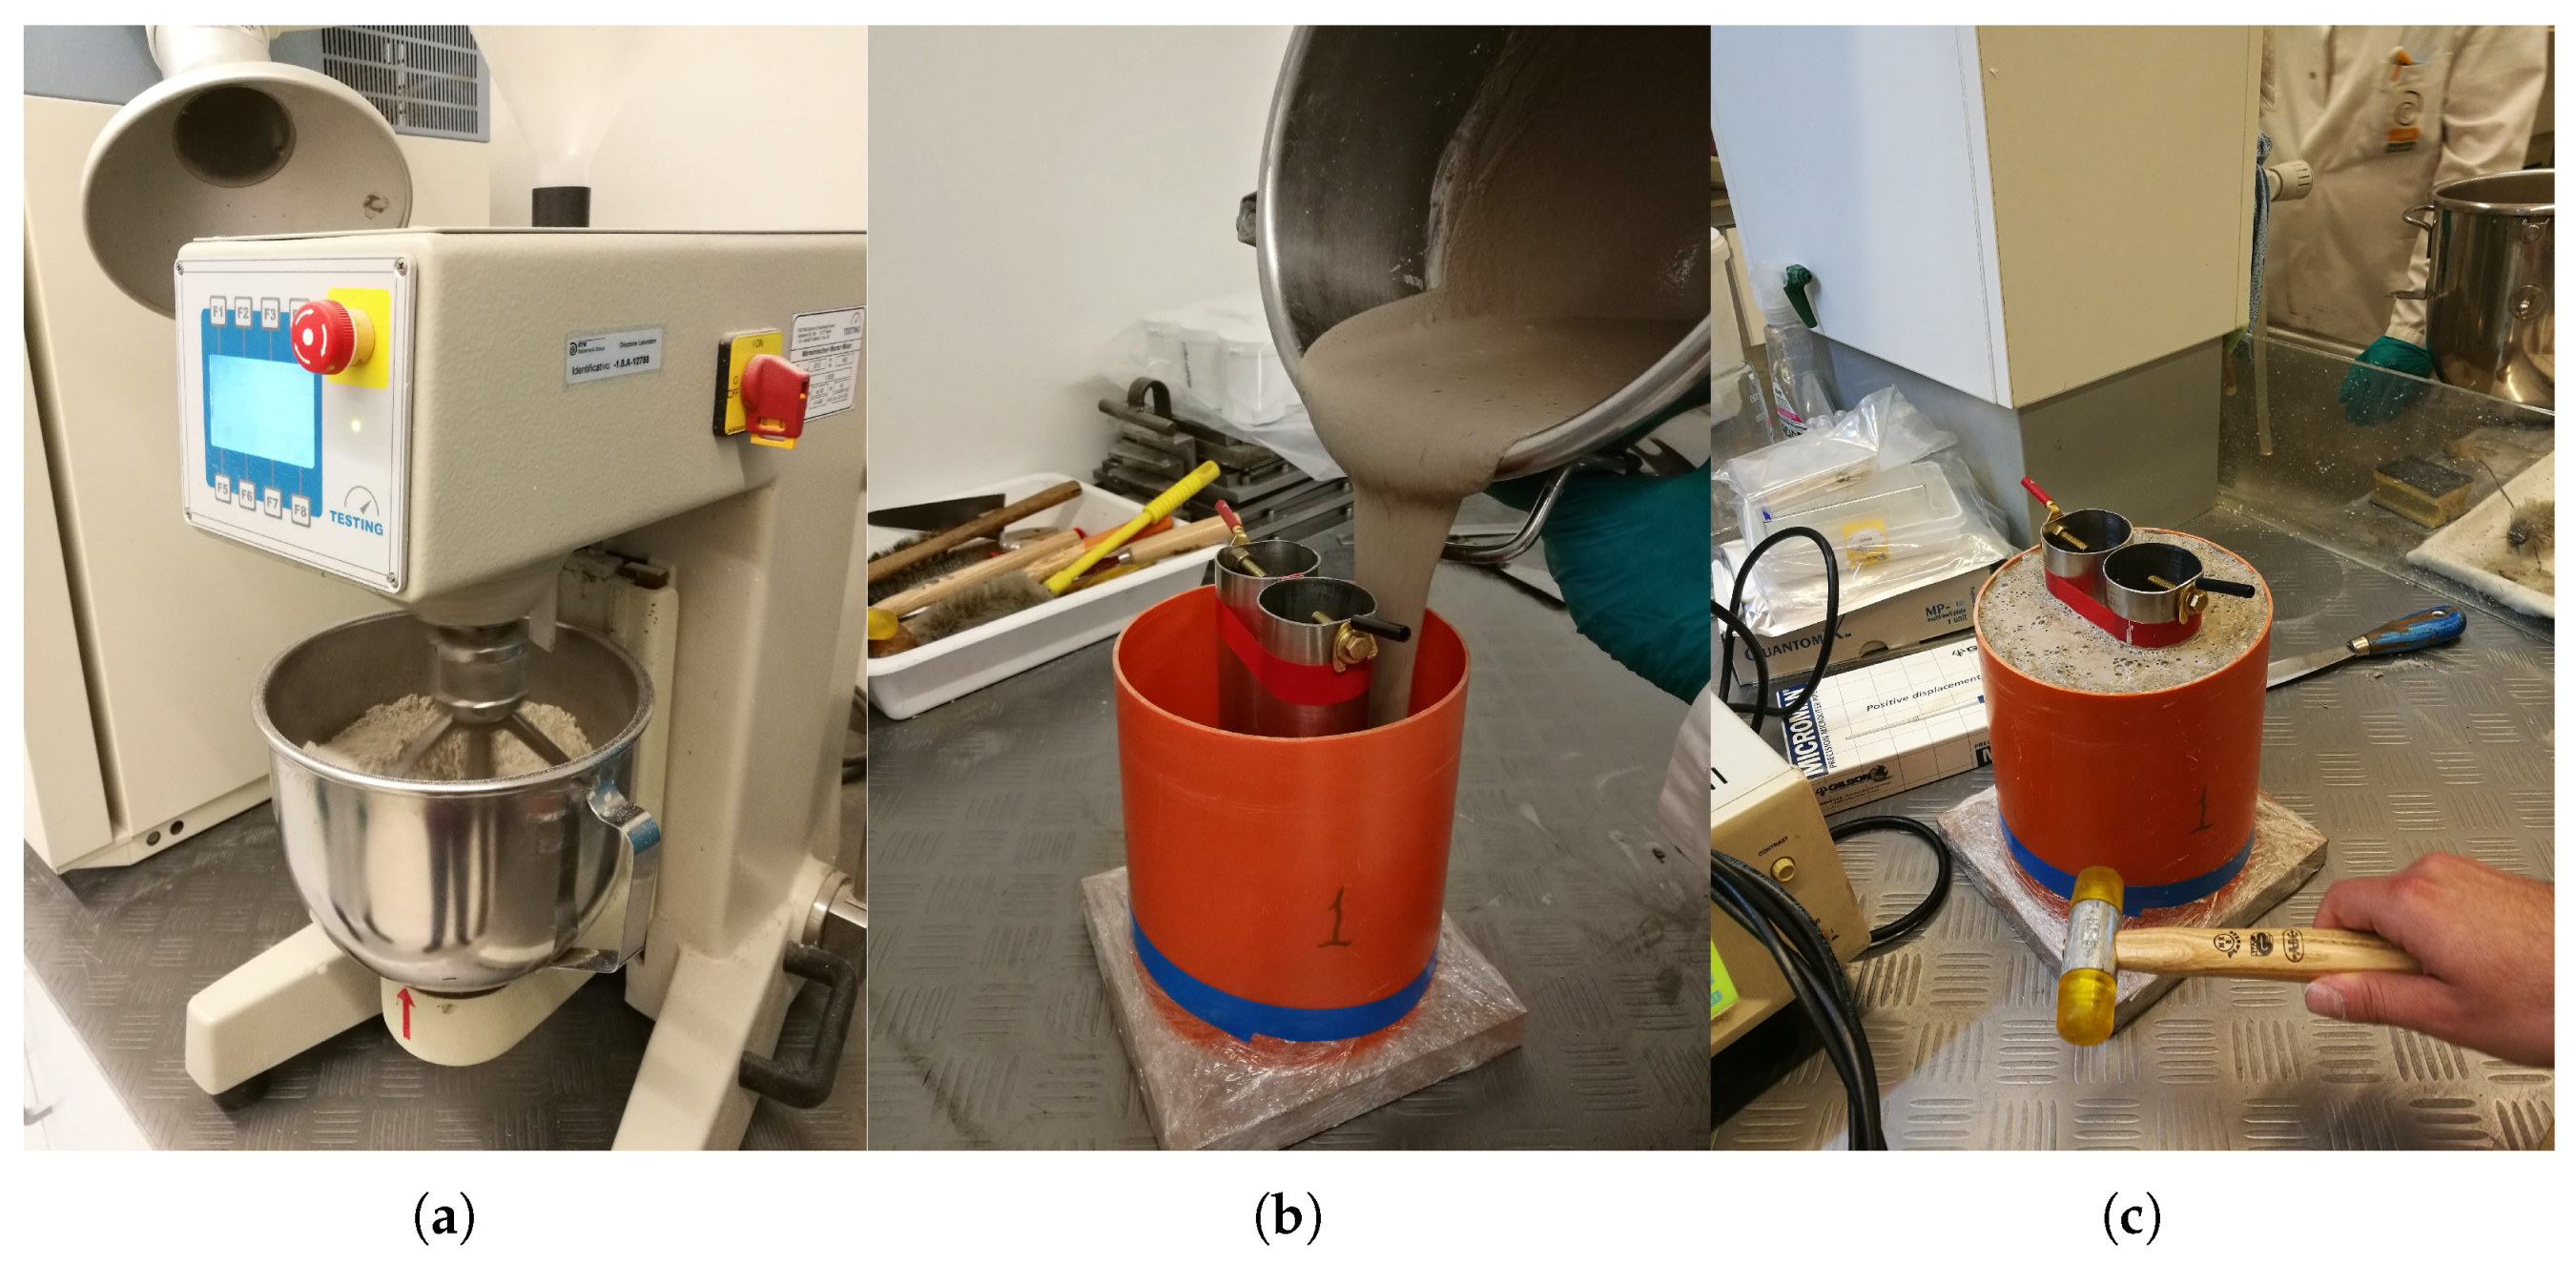
Figure 8.
Test setup for the measurement of the capacitance.
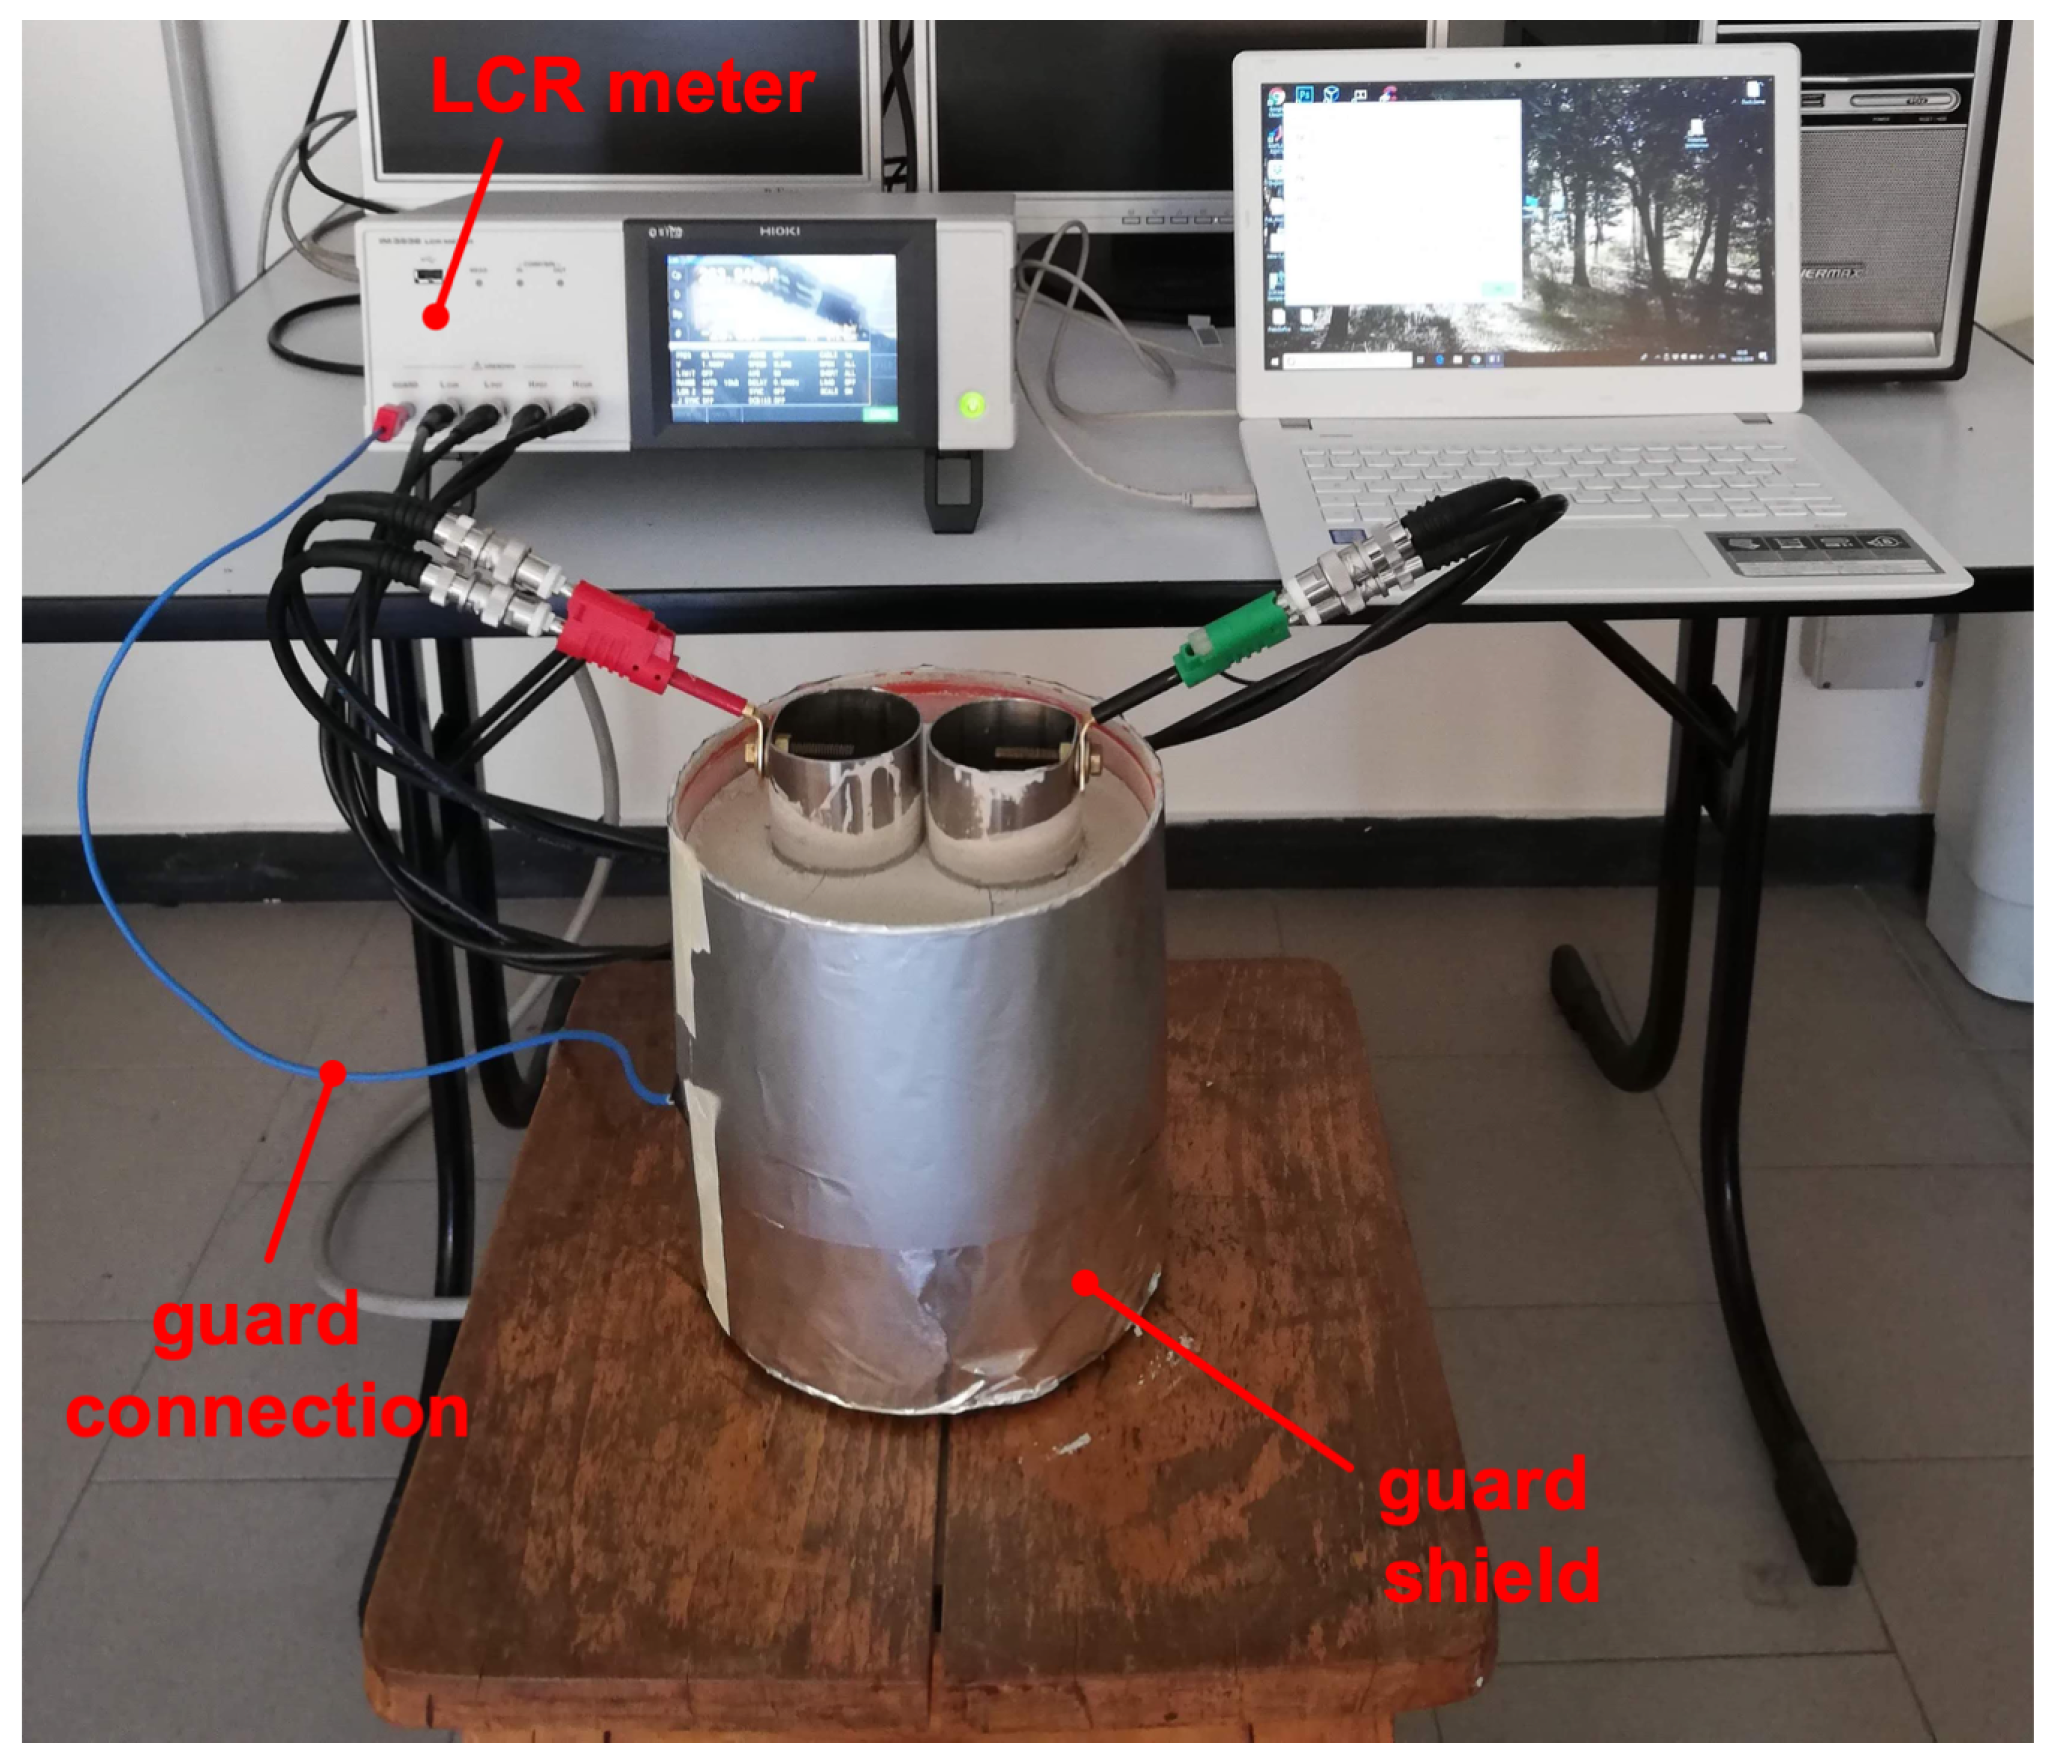
Figure 9.
Measured concrete relative permittivity and resistivity versus frequency at 28 days after pouring.
Figure 9.
Measured concrete relative permittivity and resistivity versus frequency at 28 days after pouring.

Figure 10.
PEEC model of the embedded coil. (a) full model; (b) detail of the connection between the nine coil turns and the lumped shorts.
Figure 10.
PEEC model of the embedded coil. (a) full model; (b) detail of the connection between the nine coil turns and the lumped shorts.
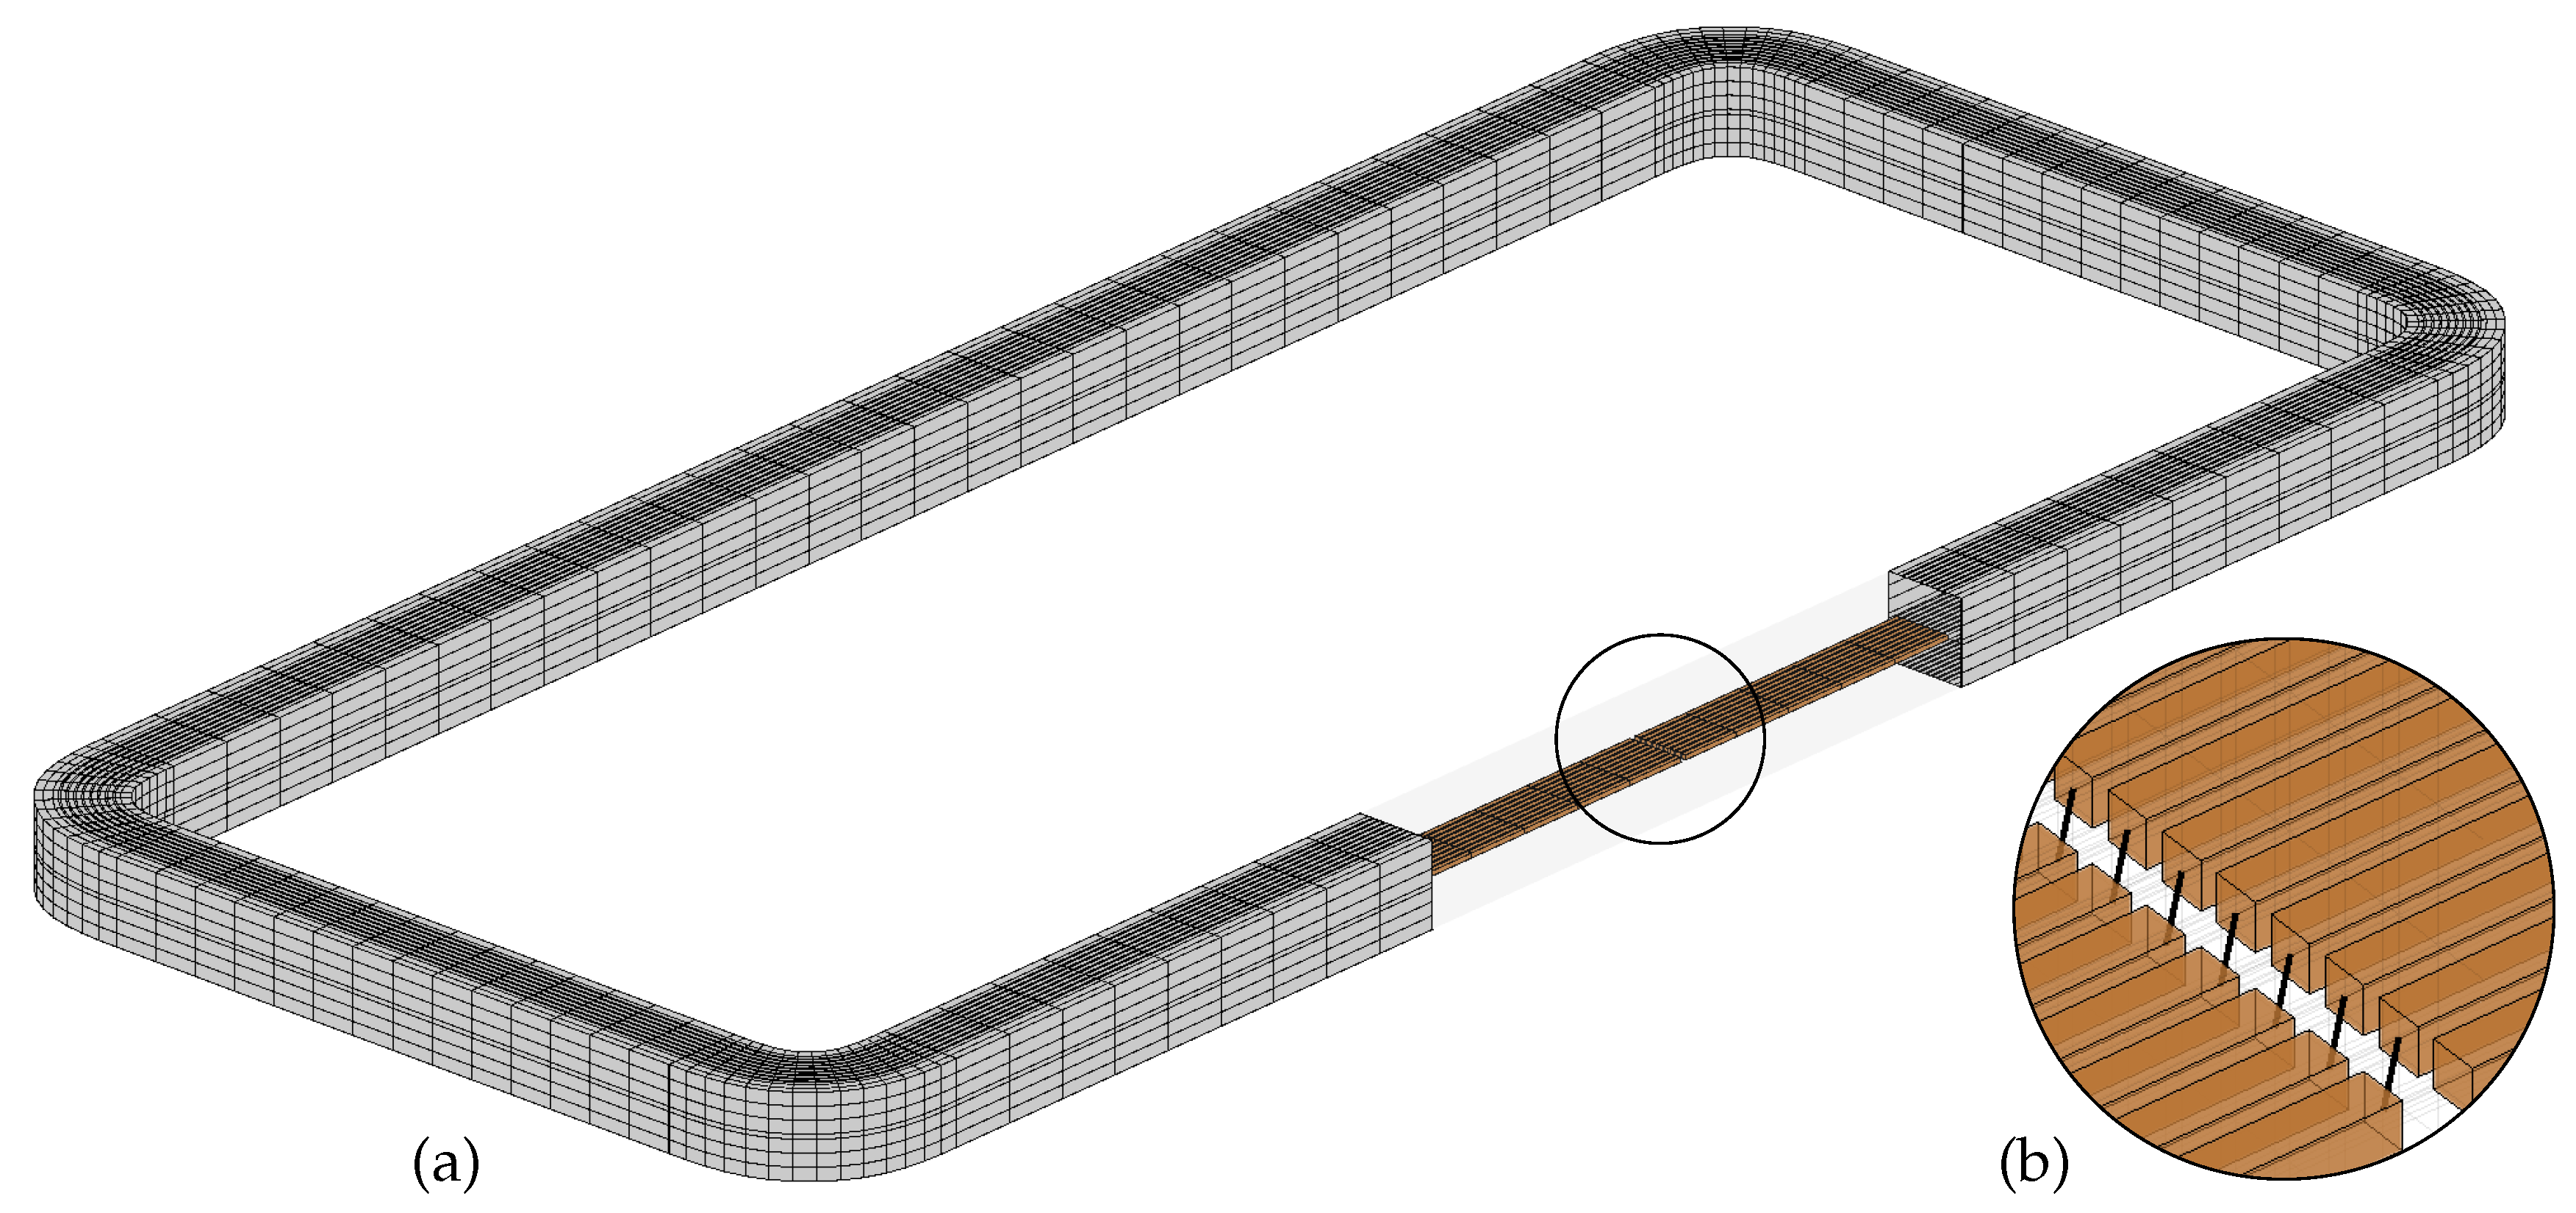
Figure 11.
Equivalent impedance of the embedded coil, measures vs. PEEC results. Amplitude (a); phase (b).
Figure 11.
Equivalent impedance of the embedded coil, measures vs. PEEC results. Amplitude (a); phase (b).
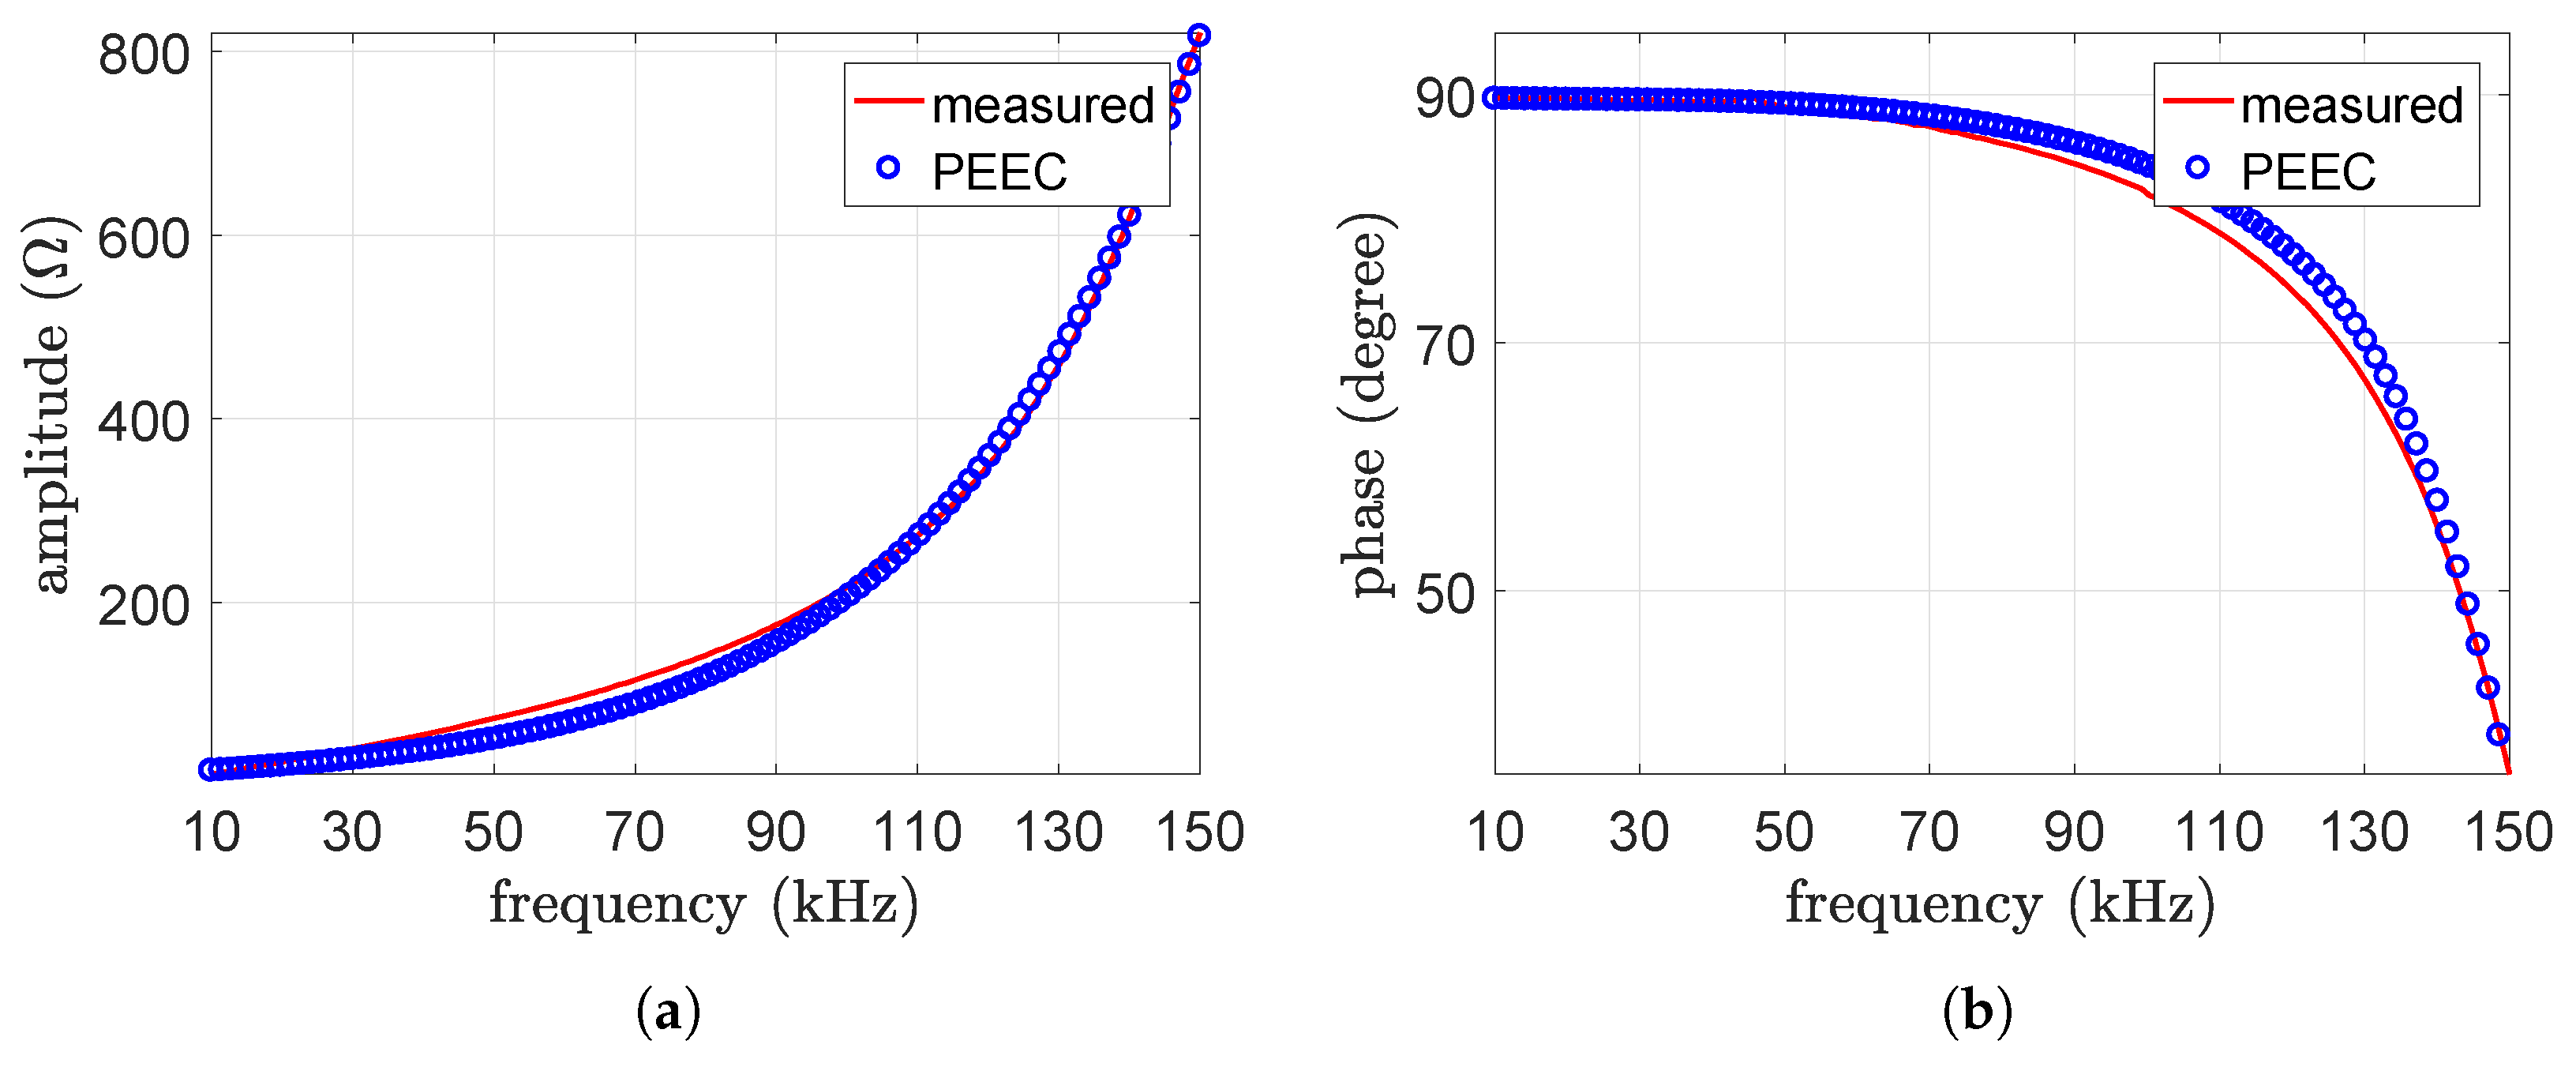
Figure 12.
PEEC model simulation: distribution of in the concrete. Inductive component predominant (a); capacitive component predominant (b). (a) and (b) not in the same scale.
Figure 12.
PEEC model simulation: distribution of in the concrete. Inductive component predominant (a); capacitive component predominant (b). (a) and (b) not in the same scale.

Figure 13.
Equivalent impedance of the embedded coil (Mod1) at 85 kHz for a concrete resistivity from 10 m to 1000 m, parametrized for equal to 5, 40, and 80. Amplitude (a); phase (b).
Figure 13.
Equivalent impedance of the embedded coil (Mod1) at 85 kHz for a concrete resistivity from 10 m to 1000 m, parametrized for equal to 5, 40, and 80. Amplitude (a); phase (b).

Figure 14.
Equivalent impedance of the embedded coil (Mod1) at 50 kHz for a concrete resistivity from 10 m to 1000 m, parametrized for equal to 5, 40, and 80. Amplitude (a); phase (b).
Figure 14.
Equivalent impedance of the embedded coil (Mod1) at 50 kHz for a concrete resistivity from 10 m to 1000 m, parametrized for equal to 5, 40, and 80. Amplitude (a); phase (b).

Figure 15.
Equivalent impedance of the embedded coil (Mod1) at 20 kHz for a concrete resistivity from 10 m to 1000 m, parametrized for equal to 5, 40, and 80. Amplitude (a); phase (b).
Figure 15.
Equivalent impedance of the embedded coil (Mod1) at 20 kHz for a concrete resistivity from 10 m to 1000 m, parametrized for equal to 5, 40, and 80. Amplitude (a); phase (b).

Figure 16.
Equivalent impedance of the embedded coil (Mod2) at 85 kHz for a concrete resistivity from 10 m to 1000 m, parametrized for equal to 5, 40, and 80. Amplitude (a); phase (b).
Figure 16.
Equivalent impedance of the embedded coil (Mod2) at 85 kHz for a concrete resistivity from 10 m to 1000 m, parametrized for equal to 5, 40, and 80. Amplitude (a); phase (b).
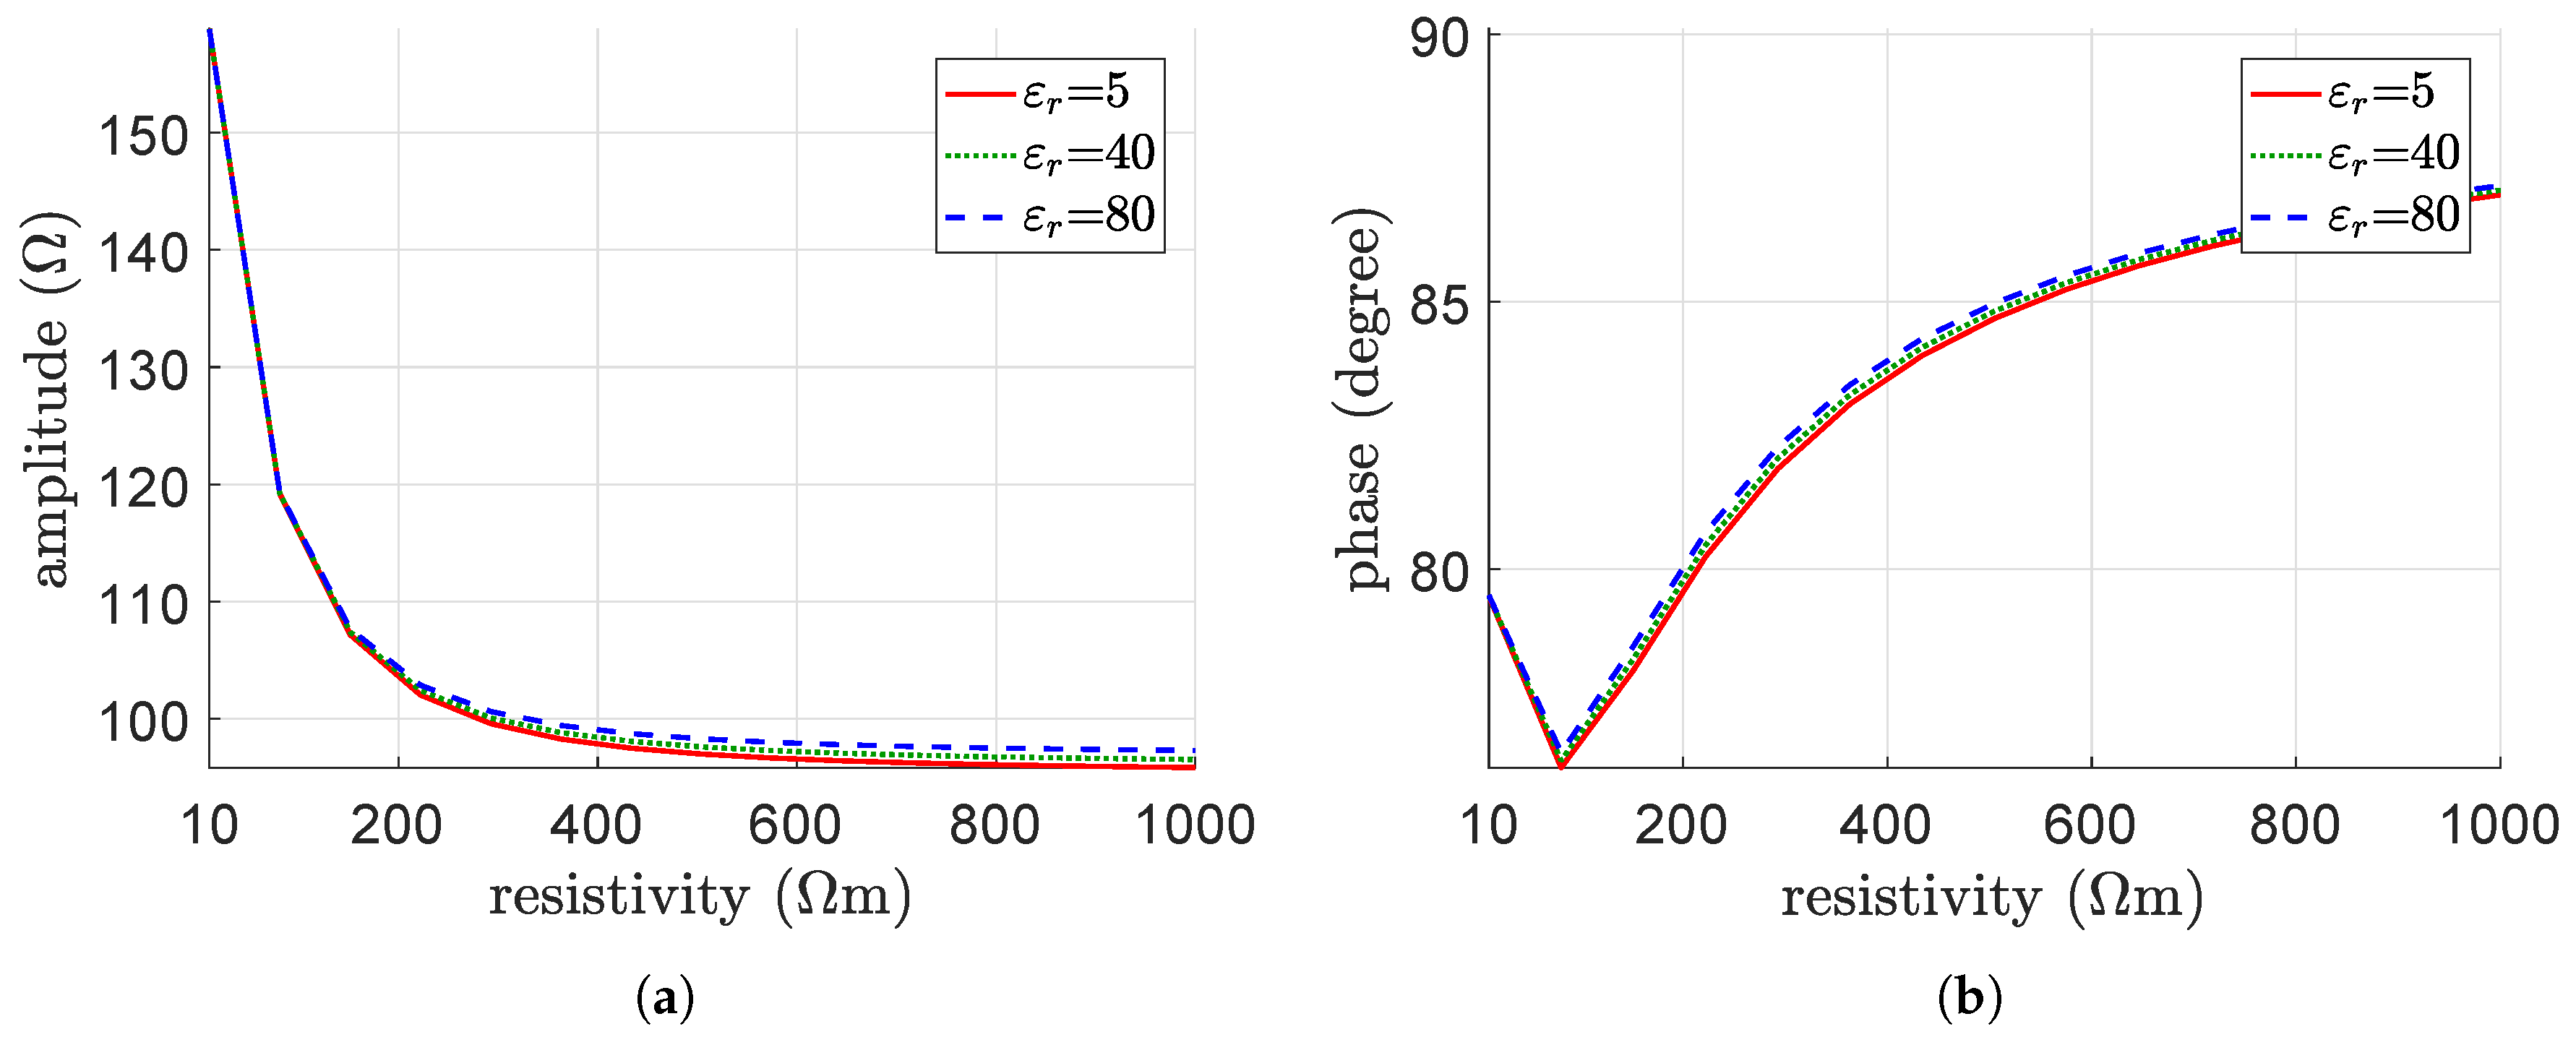
Figure 17.
Equivalent impedance of the embedded coil (Mod2) at 50 kHz for a concrete resistivity from 10 m to 1000 m, parametrized for equal to 5, 40, and 80. Amplitude (a); phase (b).
Figure 17.
Equivalent impedance of the embedded coil (Mod2) at 50 kHz for a concrete resistivity from 10 m to 1000 m, parametrized for equal to 5, 40, and 80. Amplitude (a); phase (b).

Figure 18.
Equivalent impedance of the embedded coil (Mod2) at 20 kHz for a concrete resistivity from 10 m to 1000 m, parametrized for equal to 5, 40, and 80. Amplitude (a); phase (b).
Figure 18.
Equivalent impedance of the embedded coil (Mod2) at 20 kHz for a concrete resistivity from 10 m to 1000 m, parametrized for equal to 5, 40, and 80. Amplitude (a); phase (b).

Figure 19.
Equivalent impedance of the embedded coil (Mod3) at 85 kHz for a concrete resistivity from 10 m to 1000 m, parametrized for equal to 5, 40, and 80. Amplitude (a); phase (b).
Figure 19.
Equivalent impedance of the embedded coil (Mod3) at 85 kHz for a concrete resistivity from 10 m to 1000 m, parametrized for equal to 5, 40, and 80. Amplitude (a); phase (b).

Figure 20.
Equivalent impedance of the embedded coil (Mod3) at 50 kHz for a concrete resistivity from 10 m to 1000 m, parametrized for equal to 5, 40, and 80. Amplitude (a); phase (b).
Figure 20.
Equivalent impedance of the embedded coil (Mod3) at 50 kHz for a concrete resistivity from 10 m to 1000 m, parametrized for equal to 5, 40, and 80. Amplitude (a); phase (b).

Figure 21.
Equivalent impedance of the embedded coil (Mod3) at 20 kHz for a concrete resistivity from 10 m to 1000 m, parametrized for equal to 5, 40, and 80. Amplitude (a); phase (b).
Figure 21.
Equivalent impedance of the embedded coil (Mod3) at 20 kHz for a concrete resistivity from 10 m to 1000 m, parametrized for equal to 5, 40, and 80. Amplitude (a); phase (b).

Figure 22.
Equivalent impedance of the embedded coil (Mod1) vs. frequency parametrized for equal to 10 m, 100 m, and 1000 m. Amplitude (a); phase (b).
Figure 22.
Equivalent impedance of the embedded coil (Mod1) vs. frequency parametrized for equal to 10 m, 100 m, and 1000 m. Amplitude (a); phase (b).

Figure 23.
Equivalent impedance of the embedded coil (Mod2) vs frequency parametrized for equal to 10 m, 100 m, and 1000 m. Amplitude (a); phase (b).
Figure 23.
Equivalent impedance of the embedded coil (Mod2) vs frequency parametrized for equal to 10 m, 100 m, and 1000 m. Amplitude (a); phase (b).

Figure 24.
Equivalent impedance of the embedded coil (Mod3) vs. frequency parametrized for equal to 10 m, 100 m, and 1000 m. Amplitude (a); phase (b).
Figure 24.
Equivalent impedance of the embedded coil (Mod3) vs. frequency parametrized for equal to 10 m, 100 m, and 1000 m. Amplitude (a); phase (b).

Figure 25.
Electric circuit exemplification of the embedded coil. Electric circuit representation (a); model detail of the circuit interpretation (b).
Figure 25.
Electric circuit exemplification of the embedded coil. Electric circuit representation (a); model detail of the circuit interpretation (b).


Table 1.
Values of the form factors associated with the different layers of materials.
| Layer Length | Capacitance Form Factor | Resistance form Factor | |
|---|---|---|---|
| air | mm | m | - |
| concrete | mm | m | m |
| resin | mm | m | - |
Table 2.
Values of relative permittivity and resistivity at three different frequencies after 28 days from pouring.
Table 2.
Values of relative permittivity and resistivity at three different frequencies after 28 days from pouring.
| Frequency (kHz) | ||
|---|---|---|
| 20 | ||
| 85 | ||
| 200 | ||
| asym. value | - |
© 2019 by the authors. Licensee MDPI, Basel, Switzerland. This article is an open access article distributed under the terms and conditions of the Creative Commons Attribution (CC BY) license (http://creativecommons.org/licenses/by/4.0/).
Share and Cite
MDPI and ACS Style
Cirimele, V.; Torchio, R.; Virgillito, A.; Freschi, F.; Alotto, P. Challenges in the Electromagnetic Modeling of Road Embedded Wireless Power Transfer. Energies 2019, 12, 2677. https://doi.org/10.3390/en12142677
AMA Style
Cirimele V, Torchio R, Virgillito A, Freschi F, Alotto P. Challenges in the Electromagnetic Modeling of Road Embedded Wireless Power Transfer. Energies. 2019; 12(14):2677. https://doi.org/10.3390/en12142677
Chicago/Turabian StyleCirimele, Vincenzo, Riccardo Torchio, Antonio Virgillito, Fabio Freschi, and Piergiorgio Alotto. 2019. "Challenges in the Electromagnetic Modeling of Road Embedded Wireless Power Transfer" Energies 12, no. 14: 2677. https://doi.org/10.3390/en12142677
Note that from the first issue of 2016, this journal uses article numbers instead of page numbers. See further details here.