Statistical Study on Space Charge effects and Stage Characteristics of Needle-Plate Corona Discharge under DC Voltage


State Key Laboratory of Power Transmission Equipment and System Security and New Technology, Chongqing University, Chongqing 400030, China
*
Author to whom correspondence should be addressed.
Energies 2019, 12(14), 2732; https://doi.org/10.3390/en12142732
Submission received: 30 June 2019
/
Revised: 9 July 2019
/
Accepted: 12 July 2019
/
Published: 17 July 2019
(This article belongs to the Special Issue Selected Papers from 2018 IEEE International Conference on High Voltage Engineering (ICHVE 2018))
Abstract
:The air’s partial discharges (PD) under DC voltage are obviously affected by space charges. Discharge pulse parameters have statistical regularity, which can be applied to analyze the space charge effects and discharge characteristics during the discharge process. Paper studies air corona discharge under DC voltage with needle-plate model. Statistical rules of repetition rate (n), amplitude (V) and interval time (∆t) are extracted, and corresponding space charge effects and electric field distributions in PD process are analyzed. The discharge stages of corona discharge under DC voltage are divided. Furthermore, reflected space charge effects, electric field distributions and discharge characteristics of each stages are summarized to better explain the stage discharge mechanism. This research verifies that microcosmic process of PD under DC voltage can be described based on statistical method. It contributes to the microcosmic illustration of gas PD with space charges.
1. Introduction
Nowadays, the insulation requirements of DC equipment are further improved, with the wide application of DC system in high voltage direct current (HVDC) transmission and other aspects. As a reflection of insulation faults in DC system, PD under DC is also concerned in many researches.
Gas partial discharge (PD) under DC voltage is a process closely related to the generation, migration and dissipation of space charges. The main forms of gas PD in DC system are the surface discharge on dielectric materials and the corona discharges under non-uniform electric field [1,2]. Researches on gas corona discharges under DC mainly includes three directions. One is researching on microcosmic discharge theory and discharge mechanism explanation [3,4,5]. Another one is considering influencing factors of discharge [6,7,8,9], such as electrode structure [6,7], air pressure [8] and air flow [9]. The rest one is studying discharge parameters characteristics, and apply them to pattern recognition and stage division of discharges [10,11,12,13,14].
Different from the periodic generation and dissipation of space charges under alternate current (AC), many space charges will be retained in discharge region under DC because the polarity of electric field does not change. Therefore, one of the main points in the gas corona discharge researches under DC is the space charge effect and the electric field distortion caused by it. As yet, due to the lack of space charge measurement methods in gas, it is difficult to describe the space charge and the electric field distributions through testing. Reference [15] studies calibration of field-mill to measure DC electric field with space charges. However, the measurement scope cannot reach the distance of molecular level, so it still cannot precisely describe the distribution of space charge and electric field. Some researches apply simulation methods to describe the discharge mechanism [16,17]. In [17], applying corona discharge fluid model, space charge intensity and electric field variation during a single discharge process are described. But the simulation starts with none space charge situation and only lasts for the short time of a single discharge, which does not take the retained space charges into account. Space charge distribution are also studied in some experimental methods [18,19]. References [19] describes the corona layer morphology by gray value and thickness on the luminescent image. In this method, only space discharges distribution of ionization region can be obtained. In addition, the space charge behaviors and electric field variation of a single discharge cannot be described. Therefore, proposing new method to reflect the space charge effect and the electric field distortion is of significance.
It is obvious that the variation of electric field will affect PD phenomenon, and reflects in PD parameters. In theory, through the deep analysis of discharge parameter characteristics, the space charge and electric field distribution can be reflected. While existing researches on the discharge parameters characteristics are either focused on the differences of characteristics from other discharge stages and patterns [10,11,12], or focused on the characteristic extraction [13,14]. Few researches relate the statistical rules to the space charge effect and electric field distribution.
So in this paper, it is proposed to apply mathematical statistics methods and microcosmic discharge and space charge theories, to analyze space charge effect and electric field distribution on the basis of characteristic parameter rules of PD pulses.
In this paper, the air discharge of needle-plate model under DC is researched. Applying mathematical statistics, the stage characteristics of repetition rate (n), amplitude (V) and interval time (∆t) characteristic parameters are figured out to divide the discharge stages. The variation rule of characteristic parameters of each stage and transition process are explained by the space charge effects and electric field distribution. Furthermore, deduced space charge effects, electric field distributions and discharge characteristics of each stages are summarized to better explain the stage discharge mechanism.
2. Principle
2.1. Experiment Platform and Method
The schematic diagram of the experiment platform is shown in Figure 1. DC voltages are generated by the high voltage (HV) DC power supply Matsusada AU-30R2, whose output voltage range is ±30 kV. PD pulse acquisition adopts pulse current method. Oscilloscope is adapted to measure the voltage pulse signals on the 50 Ω non-inductive resistance. The needle-plate model is set in a cylindrical organic glass box (radius of 0.1 m), which is filled with air and blocks air flow. The curvature radius of needle tip r is 0.5 mm, and the distance between the needle and plate d is 15 mm. d/r is greater than 4, and the needle-plate electrical field is extremely uneven [20].
During the experiment process, applied voltage is raised with step-rise method. After initial discharge voltage are found, the voltage is increased to a certain voltage level with step of 0.25 kV (0.1 kV for some continuous voltage levels with marked PD signal change), and then sustains. Under each voltage level, when PD are relatively stabilized, PD signals in window width of 0.1 s are acquired with the sampling frequency of 500 MHz, which is repeated with 2 min interval. 5 groups of signals are recorded under each voltage level. To avoid occasionality, whole experiment process is repeated more than three times under each polarity. The temperature range is 293 K to 295 K, and humidity range is 75% to 79% during the experiment processes.
2.2. Relevant Space Charge Theory
According to the streamer theory, in a long gap, the PD will develop in form of streamer. When electric field intensity (E) on the head of streamer reaches a certain level, photons excited in strong ionizations induce photoelectric ionization, which produces new electrons and forms the secondary electron avalanches. Then the streamer can self-sustaining develop. The self-sustaining process of streamer is described in [21] under negative polarity needle-plate model. The ions on the head of streamer are considered to aggregate as a sphere, and self-sustaining condition can be expressed as:
where r is the radius of the sphere. ρ denotes radius of the photons from the center. R is the radius of the region where photons can induce photoionization, which is related to E. p denotes the probability of photoionization. d is the distance between the electrodes, and x1 is the distance between the trigged electrons and the plate. The collision ionization coefficient α is related to E and pressure P, which can be expressed as:
where A, B are coefficients. According to Equation (1) and Equation (2), E has obvious influence on the self-sustaining development of the streamer. When other variables are confirmed, the minima electric field intensity which meets the self-sustaining condition (E0) can be determined.
During the formation process of electron avalanches, ionizations produce electrons and cations. Migration velocity v of ions is connected with the E. The charge–mass ratio of electron is much lower than ions, thus its migration rate is about two magnitudes higher. For needle-plate module, E in tiny region near the needle tip is significantly higher. Under high E, produced electrons mainly have migrated away from the discharge region when self-sustaining discharge stops. Meanwhile, high-speed electrons can hardly be trapped by molecules, thus merely small proportion of the electrons form anions in ionization region. Only in low E regions can more anions be formed gradually. Therefore, in the development path of streamers, the densities of retained electrons and anions are relatively low. Low-speed cations almost retain and play a major role.
2.3. PD Pulse Characteristic Parameters
The acquired PD pulses reflect the electric field variation of the gap in a discharge process, which is caused by the instantaneous change of electric charge quantity (q). Characteristic parameters amplitude (V), interval time (∆t) and repetition rate (n) of the PD pulses are selected for statistical study.
V can reflect the maximum change of q in a single discharge. From the beginning to the end of a streamer, space charges produced before are not completely dissipated by migration and recombination. Thus space charges retain and q rises. The maximum q should occur at the moment the self-sustaining discharge stops. Combined with the discussions above, amplitude of discharge pulse is related to E0.
∆t is defined as the time interval from the end of a PD pulse to the beginning of the next. It is mainly composed of the electric field recovery time and the discharge delay of the next pulse. Discharge delay refers to the time delay of a pulse after applied voltage reaches the initial discharge voltage value. For streamer-type PD, discharge delay is about 10−8 s and can be ignored. The recovery time of electric field is related to the dissipation of space charges, which is influenced by q of the retained space charges and E of the space after a streamer. According to the analysis above, the maximum q in a discharge determines V. Therefore, ∆t should have relationship with V if E is similar.
n is defined as the discharge repeating times per millisecond, which is related to ∆t and mainly used for auxiliary analysis of discharge rules when ∆t is too small to figure out its variation.
Acquired PD pulses under positive or negative polarity DC voltage are shown in Figure 2. In this research, the first peak value of a pulse is recorded as V. For positive polarity, the trigger voltage level is 0.2 V. For negative polarity, the trigger level is −0.1 V.
3. Statistic Rules and Stage Characteristics of Positive PD
3.1. Formation of Positive PD Pulse
First of all, how space charge behaviors and electric field variation contribute to the formation of a PD pulse is deduced.
When E of the tiny region near the needle tip reaches the initial discharge value, electron avalanches occur here. When electron avalanche develops forward, produced ions will reduce E in the region where ionizations just happen. Thus ionizations mainly happen on the head regions. When ionizations on the head stop, so does the whole electron avalanche.
For positive polarity voltage, cations are concentrated in the head of electron avalanches. When the self-sustaining condition is satisfied, electron avalanche discharge transfers to streamer discharge. The cations produced by secondary electron avalanches further increase the density of cations on the head of the streamer. Cations can be approximately considered as motionless in the discharge path during the short time of discharge. While electrons generated by secondary electron avalanches are injected into the body of the streamer, and most are transformed to anions because of the low E. Then, the anions and the cations form plasma, which is approximately electrically neutral inside. Thus the streamer shows positive polarity on the whole affected by the high-density cations on the head during the discharge process. Because the charge–mass ratio of cations is relatively high, the interaction effect between cations is low. The paths of streamers under positive polarity DC voltage are relatively concentrated. An instantaneous, enhanced positive polarity electric field will be generated by the cations near the needle tip. The E near the plate will also increase. A growing number of electrons flow toward the gap from the plate, thus forming the rising edge of the pulse current on the sampling resistance.
The streamer continues to develop towards the plate until E is insufficient to maintain self-sustaining discharges on the head. Then under the action of electric field, retained cations migrate toward the plate and anions migrate toward the needle. The electric field intensity gradually returns to the initial value, and the enhanced electric field decreases. The number of electrons flowing from the plate decreases gradually, and the falling edge of PD pulse occurs. Because the E on the discharge path at the falling stage is lower than before, the falling time is longer than the rising time. When the electric field intensity of the region resumes to the initial discharge value, a new PD can be generated.
3.2. Discharge Stages
Air corona discharge of the needle-plate module under DC has obvious space charge effect. When E of discharge paths resumes to the initial discharge value, part of ions still retain. After multiple discharges, ion densities reaches an equilibrium state. The cation density near the needle tip should be higher than the average. When the density reaches a certain level, the ionic electric field will distort to the original electric field.
The minimum applied voltage under which the PD pulse can be detected is defined as the initial discharge voltage. First, the average value of parameters n, V and ∆t are extract. The expression of the average value is:
where N denotes the number of data, and yi denotes the i th data.
In this research, for each voltage level, five or more groups of acquired PD data (0.1 s each) are chosen from different measurements, ensuring that inside which are at least one hundred pulses. Then characteristic parameters are extracted from these PD pulse data.
Figure 3 shows the average value of PD parameters under each voltages. According to rules of
, and t, the discharge stages are divided. The discharge process can be divided into three stages: initial streamer stage, glow-like discharge stage and breakdown streamer stage.
The initial streamer stage is 8.8 kV to 9 kV. The density of retained cations at this stage is relatively low and is close to the needle tip, so the effect of cation electric field is weak. E of outer regions is below E0. Thus the development degrees of streamers are similar, and the generated space charge amounts of each discharge are close. Thus, basically retains unchanged. Under initial discharge voltage, the high-intensity electric field region is tiny. The discharges is random, thus t is large (84.44 ms, not shown in Figure 3). With the increase of applied voltage, amount of retained cations increases. Because the cations group is close to the tip, thus their main effect is enhancing original E near the needle tip. The amount of produced cations and anions is relatively small, so when E increases, the electric field recovers quickly, thus rises.
Nine kV to 9.5 kV is the transition stage, where the cation group gradually becomes intensive and moves away from the needle tip. For the electric field between cations and the needle tip, the cation group generates an opposite electric field and weakens the original one. In some regions, E is weakened to the value below E0, so some streamers are weakened and stopped inside cation group. While in some regions, the lowest E in cation group is higher than E0, and even stronger more outside, streamers are enhanced. So on average, changes little. Weakened E inside results in the increasing of electric field recovery time. So t increases.
The glow-like discharge stage is about 9.5 kV to 13.5 kV. At this stage, the development of streamer is significantly inhibited by the cations group. The cations group stays at a certain distance from the tip and the opposite electric field is more remarkable. Majority of streamers are stopped inside the cation group. In this situation, the equipotential line of E where E is equal to the E0 is basically unchanged, so the development degrees of the streamers at the initial stage are similar. is basically unchanged. Then at the later transition stage, the distance of the cation group from the needle expands under the action of the needle-tip electric field. The cation electric field cannot offset the original electric field increases. So E gradually increases and streamers develop further. rises slightly. At the initial stage, due to the increasing amount of generated space charges and the decreasing E, the discharge recovery time increases and t is large. In 10 kV to 11.5 kV, E inside decreases significantly and t reaches the maximum value. Then with the expansion of the cation group and the slightly increase of E, recovery time slightly decreases, and so does t.
As E between the needle tip and the cation group is weakened, electrons are more likely to form anions and accumulate near the needle tip under the action of the electric field. If the curvature radius of the positive polarity electrode is relatively large, the density of accumulated anions can reach a certain level and anion group can be formed. The electric field between the anion group and the needle tip will be enhanced, while the electric field between anion group and the cation group will be further weakened. Then, the stable glow discharge may occur between the needle tip and the cations. There is no obvious glow discharge phenomenon under positive polarity voltage in this needle–plate gap.
At the breakdown streamer stage (13.5 kV to 16 kV), the cations group is far away from the needle tip and its density is also relatively reduced. Its weakening effect to the electric field is reduced, and the streamers can develop through the cation region. As a result, the streamers are stronger than the stage before. Raising the applied voltage, more cations are generated and rises. E in the discharge regions increases. The recovery time decreases significantly and so does t.
When it close to breakdown (after 15.5 kV), the negative polarity plate begins to affect the discharge process. At this time, the head of streamers will be close to the negative polarity plate. Due to the high conductivity of the plasma, the electric field between the streamer head and the plate electrode is significantly enhanced, which is conducive to ionization. The streamers will be strongly enhanced here. Therefore, V increases with obviously rising trend. After a discharge, E of the discharge path is still in an enhanced state. So ∆t decreases a lot (about 0.23 ms at 16 kV). Continue to increase the applied voltage, streamers link the gap and breakdown occurs quickly. Due to the randomness of the breakdown streamer, the breakdown may occur under a certain applied voltage within the scope of 16.5 kV to 17.5 kV.
3.3. Derived Parameter Rule
The equivalent charge quantity q is defined as the charge quantity of electrons passing through the sampling resistance in unit time, which can indirectly reflect the changes of the space electric field and discharge energy. Regarding single PD pulse as a triangular wave approximately, the expression of q is:
where tw denotes single PD pulse width, which is set as 50 ns. R denotes the sampling resistance value.
Equivalent charge quantities of positive PD are shown in Figure 4. At the initial streamer stage, there is an obvious q, while at the glow-like discharge stage q is close to 0. Then in the breakdown streamer stage, q increases obviously, especially near breakdown. It indicates that the discharges of glow-like stage are obviously inhibited under the action of space charges, which also means that the electric field variation is little, and the discharges consume less energy. q is obvious at breakdown streamer stage.
The variation coefficient (VC) is adopted to reflect the fluctuation of PD parameters under different voltages, furthermore, to judge the unevenness of electric field distribution. The expression of variation coefficient is:
The VC of V and ∆t under different voltages are shown in Figure 5. VC for V basically remains unchanged at the initial streamer stage. Then VC decreases at the early stage of glow-like discharge and reaches the lowest value. It rises at the end of glow-like discharge stage, and reaches a higher value at the breakdown streamer stage and then retains. When approaching breakdown, VC has a small increase. Amplitude fluctuation in the glow-like discharge stage are relatively smaller, indicating that the streamers are relatively regular, and the electric field distribution of discharge regions is even at this stage because of the cation group. Especially at the initial stage of glow-like discharge, the space charge electric field plays an obvious role.
The VC for ∆t increases at the initial streamer stage where space charges are few, and decreases at the transition stage with the increasing density of cations. Then VC sustains in glow-like discharge stage. At last, it decreases again near breakdown. It can be seen that the fluctuation of ∆t will be lower with certain cation density, because space charges retained after a single discharge have less effect on the electric field. The cation group contributes to a relatively stable electric field in discharge regions, thus ions migrate regularly and the fluctuation of discharge recovery time is low.
3.4. ∆t–V Distribution Rules
Discharges of initial streamer stage are very few and relatively random, whose ∆t–V distribution is not researched. Instead, typical ∆t–V distribution of transition stage after initial streamer stage is described. In Figure 6, the ∆t–V points is concentrated in two regions, which forms two “sharp peaks”. As discussed before, the points in high-amplitude peak represent the pulses generated by the streamers passing through the cation group, while points in low-amplitude peak represent the pulses generated by the streamers stopped inside. Figure 7 shows V and ∆t proportion distribution respectively. Each ∆t proportion curves has two peaks. While in each ∆t proportion curve, there is only one peak, and low-value ∆t makes up the majority. Combined with Figure 6, it can be concluded that the difference of the two forms of discharges is mainly reflected in the amplitude. ∆t distributions of this two forms of discharges are basically the same. It may because the streamers corresponding to the high-amplitude pulses generate more ions, but after the discharge, the recovery electric field for ion migration has a higher E.
The typical ∆t–V scatter diagram of glow-like discharge stage is shown in Figure 8a,b. At the initial stage, the discharges are restrained on weaken electric field inside action group. V changes little, so ∆t–V scatters basically form a horizontal line. Notice that the central value of V in 10 kV is close to that of the low-value peaks in 9 kV (about 0.65 V), which demonstrates the two discharge forms are similar. Then at the later stage of glow-like discharge, the range of V enhances. ∆t–V points still distribute in a horizontal ribbon basically. Figure 9a,b show the proportion distributions of V and ∆t. At the beginning, V is relatively concentrated (10 kV–11 kV). But at later stage, V gradually distributes dispersedly. The abscissa of the peak point is larger. For ∆t, the abscissa of the highest proportion point and the abscissa ranges of each proportion curve are basically the same. It can be observed that the distribution curves of ∆t can be divided into two parts. One part is of peak shape in abscissa of 0 to 0.005 s. Another part is of flat shape in 0.005 s to 0.01 s. The flat part may represent the ∆t after the streamers that pass though the cation group region, since the ions take a long time to migrate because of the low E in this region. For ∆t, their distribution are dispersed at the early stage. The abscissa of the highest proportion point decreases with applied voltage rises, reaching the lowest value under 11 kV. The ∆t points then become more concentrated at the later stage, and the highest proportion value rises.
At breakdown streamer stage, E in the cation group region can satisfy self-sustaining condition and majority of streamers can pass through the cation region. As shown in Figure 10a, the main ∆t–V points form a triangular. When ∆t abscissa is small, the density of points is large and V range is wide. With the increase of ∆t, density of point and V range are decreased. Compared Figure 10a to Figure 10b, with the increase of applied voltage, the range of V increases, and the ∆t decreases. Figure 11a,b show the V and ∆t distribution proportions. For V, the shapes of the proportion curves are similar in the beginning, and the abscissa of the highest proportion point gradually increases. While V overall increases, and V range expands significantly near breakdown. For ∆t, with the increase of applied voltage, the concentration degree of ∆t is significantly increased. The highest proposition of the curve increases, and the abscissa of highest proposition point decreases. Similarly, the variations are especially obvious near the breakdown. It can be concluded that breakdown streamers in positive polarity are strong and intensive.
4. Statistic Rules and Stage Characteristics of Negative PD
4.1. Formation of Negative PD Pulse
For negative polarity PD, there are many electrons in the head of streamers, which is different from the positive polarity situation. Due to the large charge–mass ratio, interaction forces between electrons play a role. As electrons migrate away from the needle tip dispersively, the discharge paths of the streamers are also dispersive. Retained space charges will distribute with a wider radius.
When streamers stop, the generated electrons are repelled by the electric field and leave the discharge regions quickly. Cations are regarded as immobile during the discharge process.
When the electron avalanches are transformed to streamers, the secondary collapses produce more cations, which gather in the head of the streamer. The ion density in the head of the streamer is high, and E in this region is low. Many electrons are transformed to anions. Cations main form plasma with the anions in the body of the streamer. Since the plasma is electrical neutrality, the main electrical property displayed by the streamer is negative polarity during the discharge process, which is caused by the electrons and anions in the front of streamer head. Thus an instantaneous negative polarity electric field toward the plate electrode will be generated, and E near the plate also increases instantaneously. Growing number of electrons flow towards plate, forming the rising edge of pulse. When streamer stops, the ions migrate to the electrodes, and E gradually recovers. The enhanced negative polarity electric field decreases, forming the falling edge of pulse. When the space charge dissipates, E near the needle tip returns to initial discharge value, and a new PD may be generated.
4.2. Discharge Stages
Due to the slow migration velocity, cations may retain in discharge regions. Meanwhile, the density of anions outside will increase. Under the influence of ion electric field, different forms of discharge are also formed under negative polarity voltage.
Similarly, average values of n, V and ∆t are extracted and are shown in Figure 12. According to the rules of n, V and ∆t, process of negative polarity corona discharge can be distinguished as four stages: initial streamer stage, Trichel discharge stage, glow-discharge stage and breakdown streamer stage.
The initial streamer stage is −8.5 kV to −9.0 kV. At the initial discharge voltage, E is low and the streamers are weak. V is low and ∆t is large. With the increase of the applied voltage, the amount of cations increases, and E between needle tip and cations increased slightly. Recovery time of the electric field becomes shorter; thus n rises. Streamers are strengthened, and the space charges generated by a single discharge are also slightly increased, so V increased slightly.
The Trichel discharge stage is −9.0 kV to −12.25 kV. At this stage, the density of cations near the needle tip reaches a certain level, forming a cation layer because of the dispersive development streamers. Cation layer greatly enhances the electric field between the needle tip and the cation layer. Outside the cation layer, E toward the plate is weakened, and anions in space also play a weaken role.
The Trichel discharge stage can be divided into initial and later stages. At initial stage, the streamers stop in the weakened periphery region of cation region. Since the weaken effect of cations layer basically offsets the increase of E produced by of applied voltage, streamers almost stop at same distance from the needle tip, and the development degrees of the stream are approximately the same. V is almost unchanged. E between the cation layer and the needle tip is flat and steady increases, so that n basically presents a linear growth trend.
At the later stage, electrons begin to form anions very close to the outer edge of cation layer, and plasma layer is formed when cations and anions are both very intensive. Variation of E in the plasma layer is very low. As the anions and cations get closer and closer, plasma layer gradually takes place the peripheral cation layer. E inside plasma layer increases. It is easier for E to recover to E0 after a streamer, and ion variation generated by a single discharge is relatively less. Therefore, the recovery time of electric field decreases. n increases significantly, reaching the maximum value under −12.25 kV. Ion variation generated by a single streamer is less and density of original ions grows, thus single streamer affect the electric field less and less, instantaneous variation of space charge intensity is low. So V decreases.
After that, with the increase of applied voltage, E between the needle electrode and the cation layer is so high that it will not drop blow E0 even after a streamer. So stable glow discharges occur (−12.5 kV to −24 kV). At this time, the generation and dissipation of ions basically reach a dynamic balance. Almost no instantaneous space charge changes occur, so there is no PD pulse. E is very low on the outer edge of the plasma layer, where streamers can hardly be produced. PD pulses will be generated only in a few of the peripheral regions of the cation layer when the E is weakened and may drop below E0 after a streamer. These streamers are soon stopped by the plasma layer, so V is small. n is also small at this stage. Within a certain voltage range, the increase of applied voltage only causes the expanding of cation layer. The periphery weakened electric field still cannot supports streamers, so the negative polarity glow discharge stage lasts long.
The breakdown streamer stage is −24 kV to breakdown voltage. Glow discharges still happen inside. E on the outer edge of the plasma layer has risen high enough. So streamers are generated from the plasma region and continues to develop outward. Streamers are stronger and E in discharge regions increases. So both n and V increases. When breakdown streamer occurs, breakdown will happen soon when applied voltage increases a little. The breakdown voltage is approximately −27 kV to −28 kV.
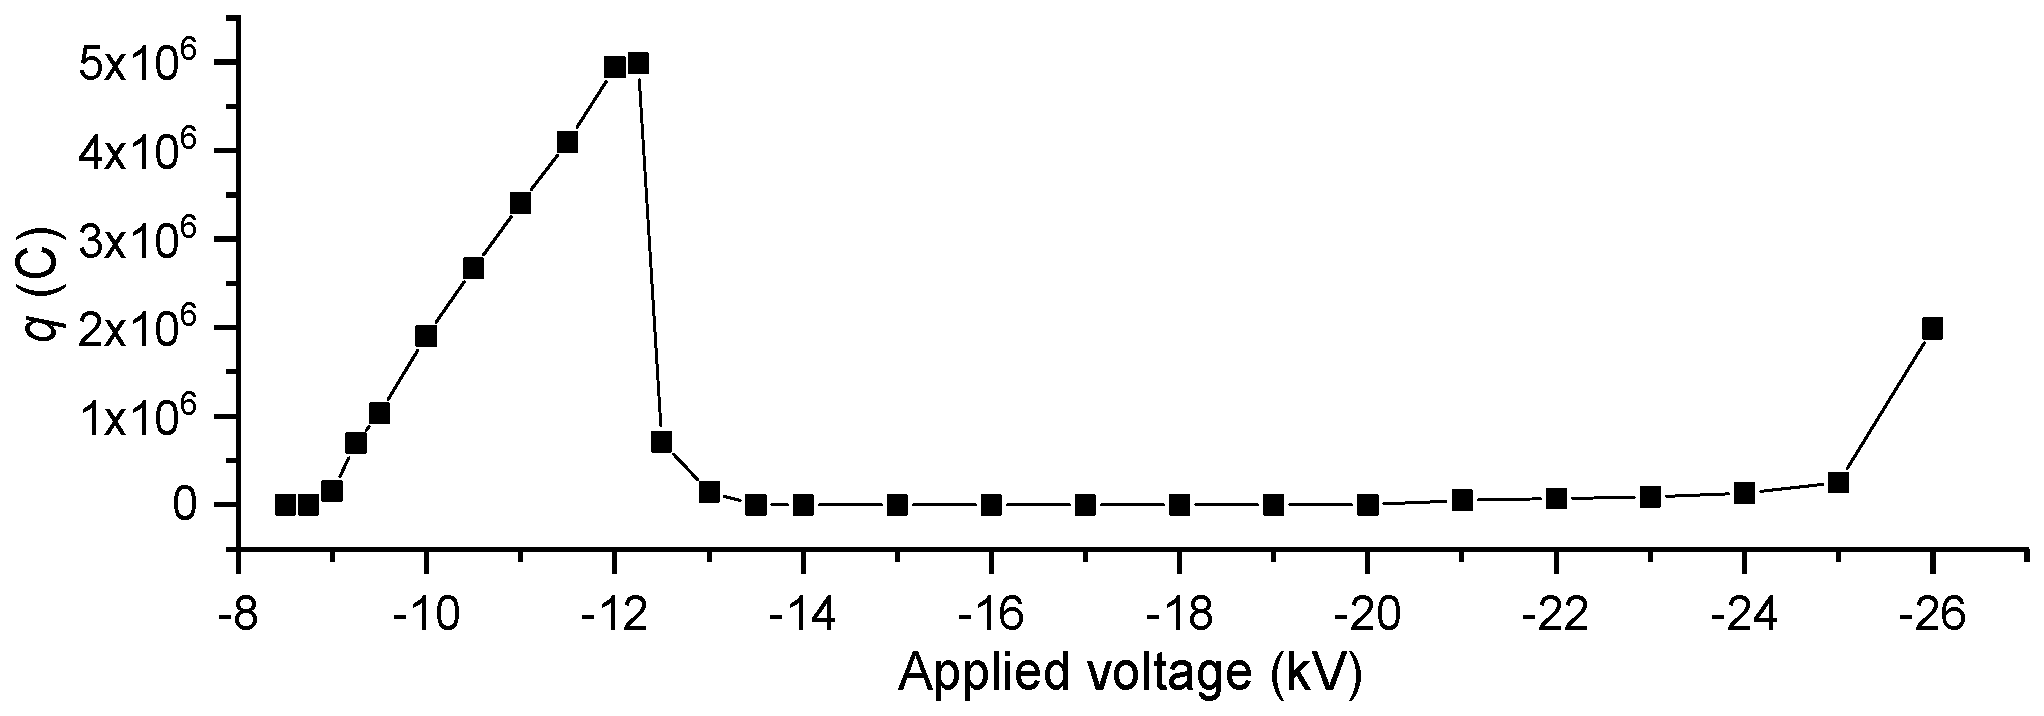
4.3. Derived Parameter Rule
The q diagram of negative polarity discharge pulse is shown in Figure 13. At initial streamer stage, q is small. Then, in the Trichel discharge stage, q increases linearly throughout the stage, which is verified in Figure 14b. The linear increase of q in the Trichel discharge stage also indicates that the electric field inside the cations layer is relatively flat. Subsequently, in glow discharge stage, q is approximately 0. When it comes to the breakdown streamer stage, q rises again.
PD fluctuation is researched by VC. As shown in Figure 15, for V, VC increases at initial streamer stage, has a sudden rise in −9 kV and then stable at the initial stage of Trichel discharge. It indicates that the gradually formed cation layer makes the electric field distribution uniform. At the later stage of Trichel discharge, VC remains stable after rising to a certain extent. It is because with the increase of plasma, E between the needle tip and the plasma layer is quicker strengthened. The electric field intensity in a certain region is all higher than E0, so the streamer may develop in many paths within the region. The development degree of the streamer varies, and the fluctuation of V is relatively large. At the glow discharge stage, only few PD happen in peripheral regions of plasma. Few PD pulses with small V are achieved in tiny peripheral regions. So VC basically remains stable at glow discharge stage, and it slightly decreases at the streamer breakdown stage.
For ∆t, due to the generation of the cation layer and the plasma layer, the fluctuation is relatively small. The remarkable characteristic is that VC remains low throughout the Trichel discharge stage. It indicates that the space charge migration after a single discharge is under a relatively stable electric field, and the recovery times of the electric field are similar. Subsequently, VC in glow discharge stage maintains in a larger value, and decreases a little in the breakdown streamer stage. It means discharges in the breakdown streamer stage are more regular than that in the glow-discharge stage.
4.4. ∆t–V Distribution Rules
The typical ∆t–V scatter diagram of the initial streamer stage is shown in Figure 16. When discharges are relatively regular, the scatter points of ∆t–V basically form a horizontal line. It indicates that the discharge region is tiny. The development degree of streamers are similar, so V of PD pulses are unchanged. Figure 17 shows proportion distribution of V. When applied voltage increases, abscissas of V become bigger and the abscissa range is enhanced. Highest proportion value decreases. It indicates that the effect of ion electric field is weak, and the electric field generated by the needle tip mainly plays a role. So the change of applied voltage has a greater impact on the V. At this stage, ∆t is large and decreases sharply with the increase of applied voltage. The scatter diagram of ∆t is not listed.
The typical ∆t–V scatter diagram of the Trichel discharge stage is shown in Figure 18. Some ∆t–V points form an inclined spindle. It indicates there is an approximate proportional relationship between V and ∆t, which confirms the analysis in Section 2.3. In Figure 18a, at the initial stage, the points in high ∆t abscissas are relatively intensive. In Figure 18b, the points in low ∆t abscissas are intensive. The density of the points outside the spindle rises because plasma layers form in some regions. The weaken effect of cation layer for electric field outside decrease because of the plasma. So regions where E is higher than E0 were enhanced in some directions. Some ∆t–V points in low-∆t abscissas have higher V, and their distribution does not follow the original proportional relationship.
At the initial stage, the proportion distribution of V under different applied voltage are approximately similar, as shown in Figure 19a. At the later stage, the distribution curve of V overall moves to lower V abscissas gradually, and the highest proportion gradually increases, as shown in Figure 20a.
As shown in Figure 19b, the range of ∆t decreases overall when applied voltage rises. Notice that ∆t curves can be divided into two parts. One part is of flat shape and low proportion in low ∆t abscissas, the other one is of peak shape and high proportion in high ∆t abscissas. The flat shape part is caused by the plasma in some regions, because part of cation layer is transformed to plasma layer, and high E regions expand. At the later stage, as shown Figure 20b, with the increase of applied voltage, the proportion of the flat shape part increases, at last flat shape part becomes the main body. It indicates that diffuse plasma layer is formed, which almost covers all discharge regions.
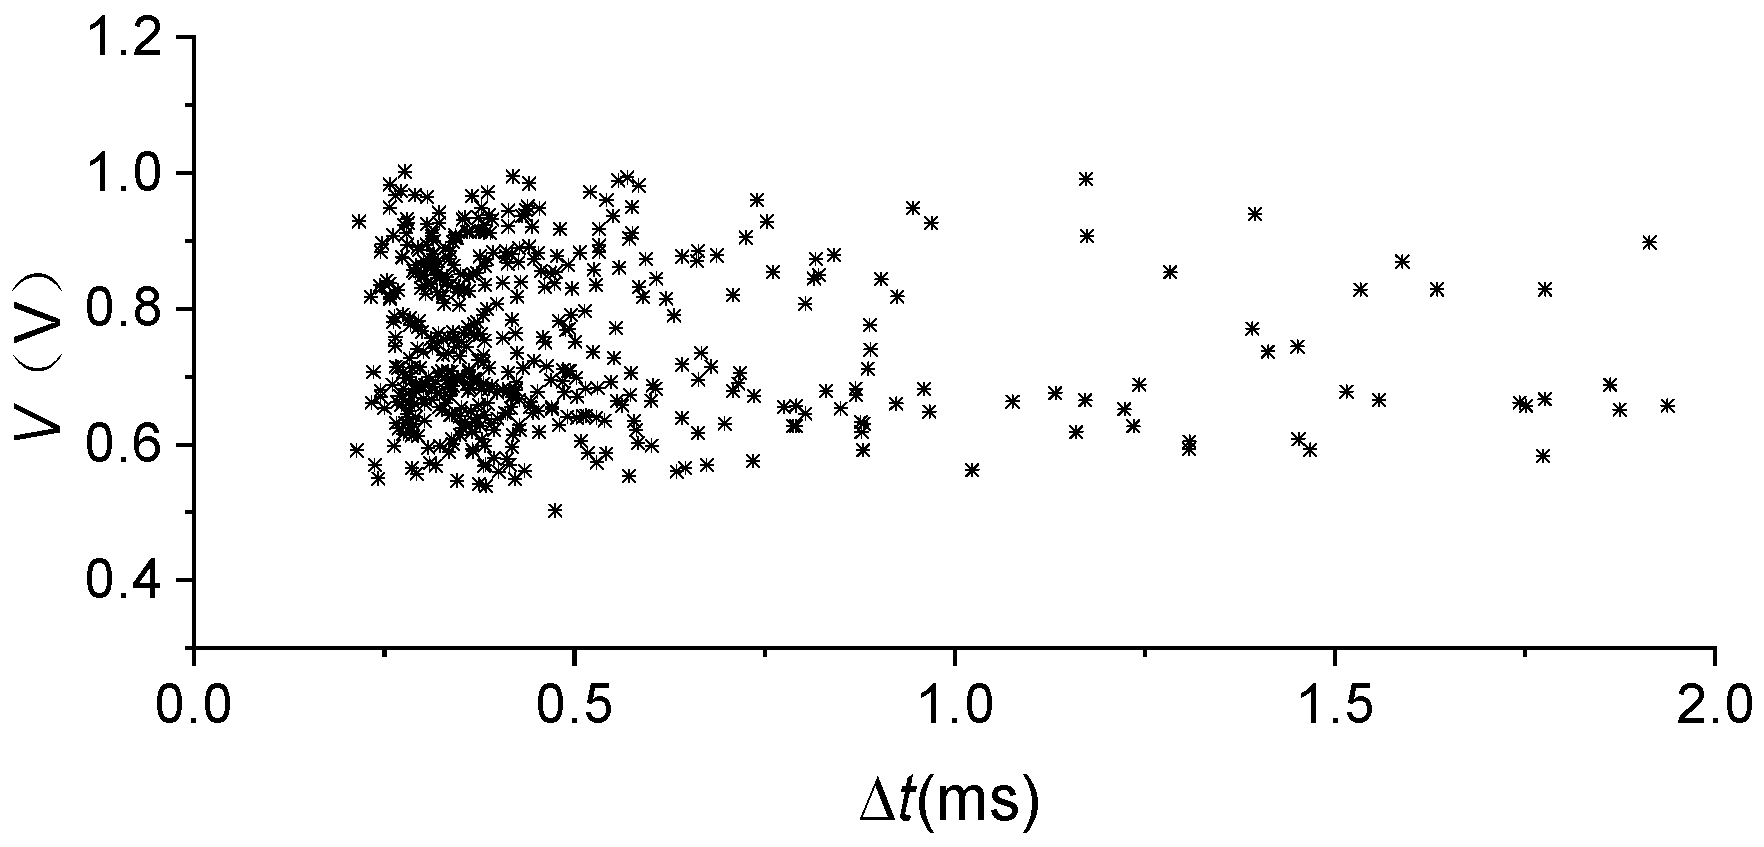
Since PD in the glow-discharge stage are very few, only ∆t–V distribution of the transition stages before and after glow-discharge stage are analyzed. The typical ∆t–V scatter diagrams are shown in Figure 21a,b. The ∆t–V points basically distribute in a horizontal band, which means V changes little, because PD can be measured are only generated in tiny regions. ∆t–V distribution is similar to that of initial streamer stage.
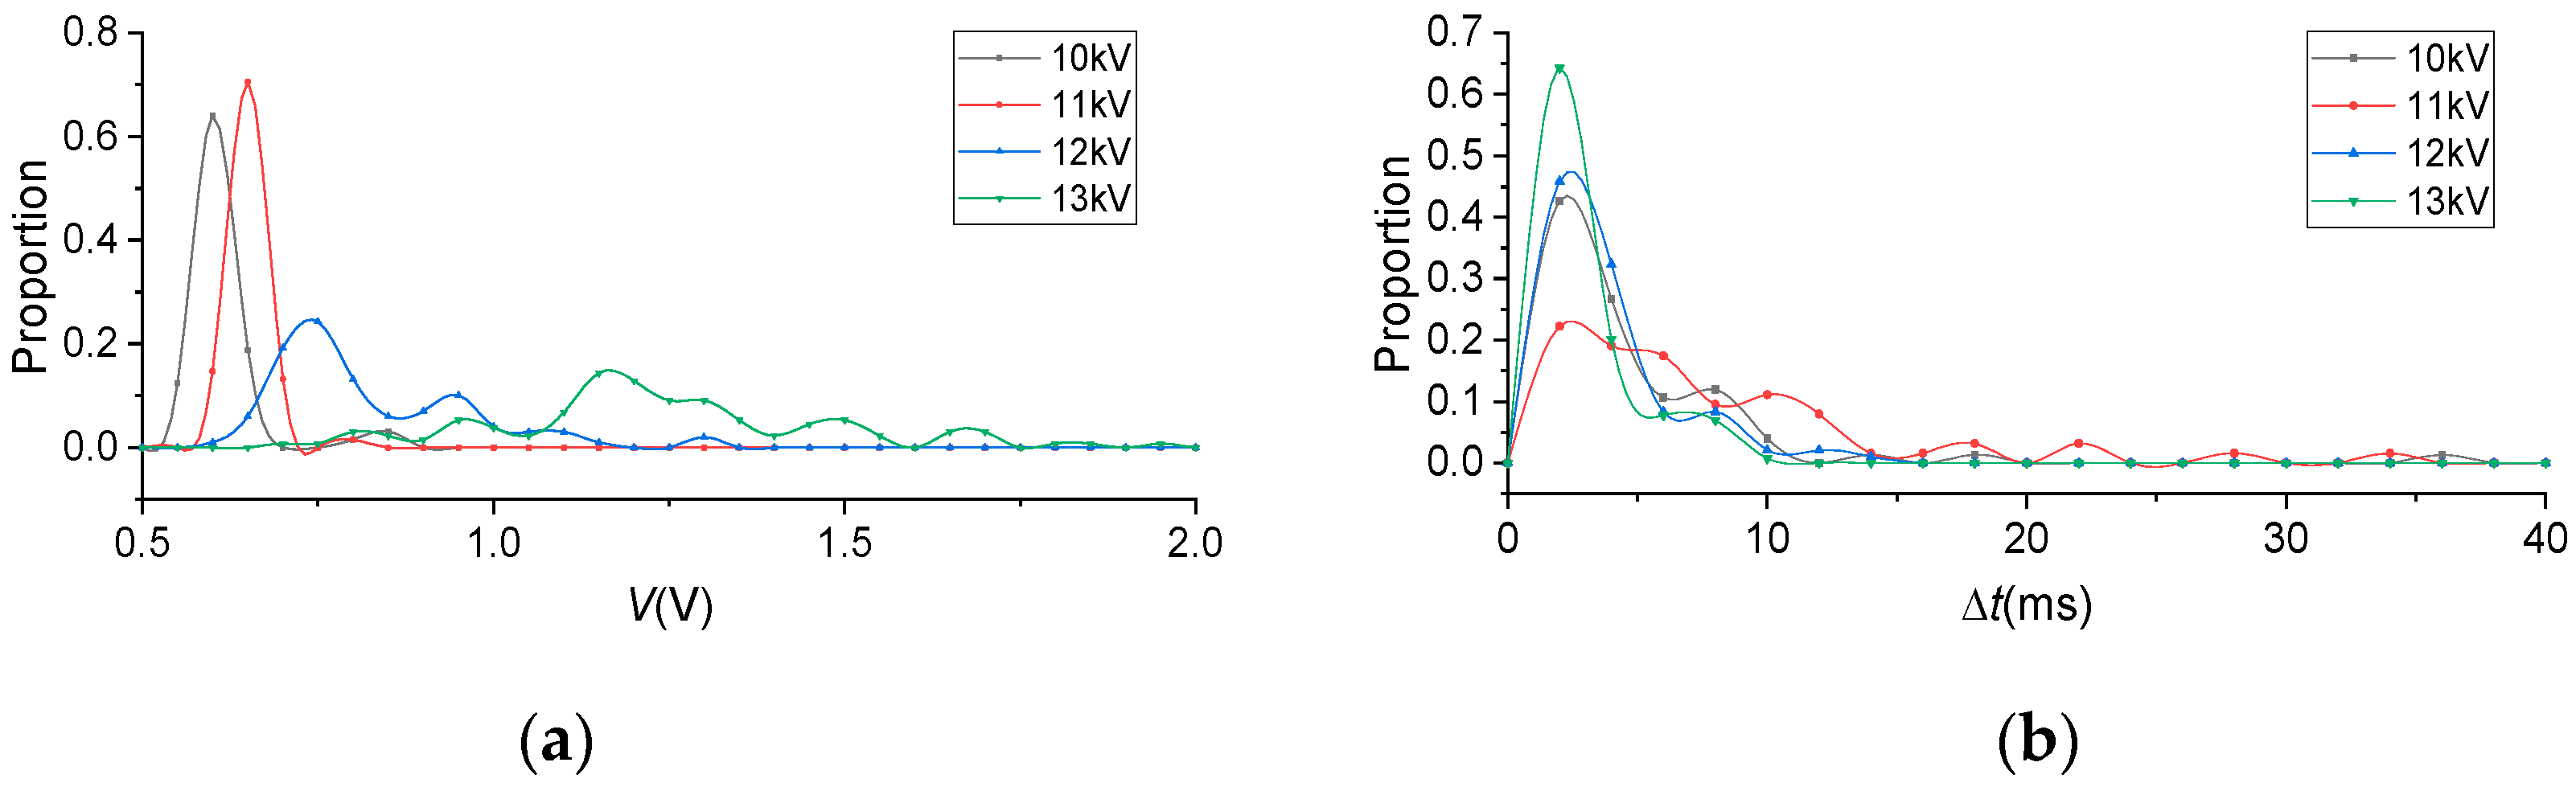
Proportion distributions of V and ∆t at glow discharge stage are shown in Figure 22. In Figure 22a, it can be found that the V proportion curves at transition stage after glow discharge have double peak. The points in low-V abscissas peak should link to PD in few peripheral regions of cation layer where E drops below E0 after a streamer. So the low V abscissas peak in proportion curves of transition stage after the glow discharge, are similar to the single peak in proportion curves of transition stage before the glow discharge. The points in high V peak link to PD starting from the outer edge of plasma layer. The two forms of discharge streamers have obvious difference, thus form the double peaks.
At breakdown streamer stage, ∆t significantly decreases. The typical ∆t–V scatter diagram is shown in Figure 23. The distribution of ∆t–V points form a sharp cone like shape. In this situation, the discharge region is close to the plate, and the axial electric field is stronger than other directions. In axial direction streamers are continuously produced. Therefore, low ∆t and high V discharge pulses account for the main proportion. Proportion distribution characteristics of V and ∆t at breakdown discharge stage are also shown in Figure 24. In Figure 24b, it can be observed that the concentration degree of ∆t is significantly increased as it approaches breakdown.
5. Discussion
The deduced space charge effect in the corona discharge development process of both polarities are concluded and compared, to further discuss the PD mechanisms.
For initial streamer stage, space charge effect is weak. Streamers develops when E of tiny region reaches E0. The development degree of streamers is low, so V is low and ∆t is short. Discharges are relatively random.
Then space charges begin to retain, and actions play a main role. At transition stage of positive PD, the action group weaken the internal electric field while strengthen the external one. But E of the weaken regions are not even. In central axial region, electric field is the strongest and still higher than E0 after being weakened. While E of regions around is not, so streams develop toward these regions are stopped earlier. Thus, two forms of streamer occur.
At Trichel discharge stage of negative PD, the action layer strengthen the internal electric field while weaken the external one. Actions are more dispersive and intensive, and are closer to the needle tip. Because of the strengthen effect, from needle tip to action layer, electric field decreases little, or even increase. While the E’s outside cation layers are basically lower than E0, which stops streamers in a similar degree and causes unchanged V. The electric field inside cation layer is high, flat, and linear, and grows with the increase of applied voltage, so some ∆t–V has an approximate proportional relationship. Recovery times are short and stable, so n rises in a linear fashion. Discharges inside the cation layer are strong. More anions are transformed and gradually become close to cations at the later stage.
Because actions are more intensive and closer to the needle tip on negative polarity, its effects are more obvious, which reflects on the variations of parameters, especially n, q.
Next, retained space charges increase to a certain level, electric effects are obvious. At glow-like discharge stage of positive PD, the effect of actions are more obvious because of higher density. The streamers are basically limited inside action group and cause unchanged V. Notice that PD parameter rules of this stage are similar to that of Trichel discharges in negative polarity. So it can be concluded that the electric field distribution of discharge regions are similar at two stages. The phenomenon delay and are not so obvious on negative polarity because of the different effects of actions. At the later transition stage, because cation group expands and becomes sparse, its effect is weakened and streamers in some regions are not limited, discharge form is transforming to breakdown streamer.
At the glow-discharge stage of negative PD, intensive anions occur close to the outer edge of cation layer, and plasma layer is formed. Stable glow discharges occur inside plasma layer, which does not produce a PD pulse without instantaneous space charge variations. In a few regions of the cation layer and plasma layer, some intermittent streamers occur. Because the regions are tiny and E is relatively weak, the PD is weak. Within a certain voltage range, the increase of applied voltage only causes the expanding of cation layer, so negative polarity glow discharge stage lasts long.
At last, streamers with few limitation occur gradually and cause breakdown. At breakdown streamer stage of positive PD, the cations group is far from the needle tip and its density decreases. Its effects are reduced, and the streamers are almost not limited and become strong. While at breakdown streamer stage of negative PD, cation layer and plasma layer still work. When the plasma layer is close to the plate, the high E regions in peripheral regions of plasma expand, the negative streamers ‘restart’ and develop without much limitation. As such, the negative streamers are relatively weak, and cause a breakdown sooner because they start near the plate.
The statistic rules of PD parameters in this paper and others support each other in some aspects [10,11,12,13,14]. The mechanism explanations are based on the classical theories and well-founded. The deduced result can be interpreted in perspective of previous studies, for example, space charge and plasma distribution at some stages can be verified by luminescent image [19]. In follow-up research, we are hopeful the deduced space charge effects and electric field distributions will be verified by a simulation on the basis of the corona discharge fluid model mentioned previously [17].
The statistical analysis method and some deduced rules may also be effective in other gas PD under an uneven electric field, with DC voltage and AC voltage with low frequency, where space charges have enough time to retain.
6. Conclusions
In this paper, a 15-mm needle-plate model is adopted to study the air corona discharge under positive and negative polarity DC voltage. The statistical rules of characteristic parameters of each stage and transition process are explained by the space charge effects and electric field distributions. Furthermore, the discharge characteristics, the reflected space charge effects of each stage are summarized and compared. Discharge mechanisms are explained in microcosmic angle. Microcosmic process of PD under DC voltage can be described based on statistical methods, and several conclusions can be drawn.
Space charges obviously distort electric fields, and the most effective influence to PD development is decreasing E down to E0 somewhere. For positive corona discharge, the space charge effects are most obvious at the glow-like discharge stage, where cations play a main role. The internal electric field of cation group is weakened but its distribution is relatively flat. The cation group inhibits the development of streamer, but inhibition effect is weakened later. At the breakdown flow stage, the influence of the action group is almost not reflected. For negative corona discharge, at Trichel discharge stage, cations work obviously, producing an electric field distribution with high and flat E inside. Then anions take part in and plasma layer forms in peripheral regions of cation layer, and further weakens the periphery electric field. At the glow discharge stage, E inside is high enough to sustain stable glow discharges inside. While E outside plasma layer is low, until in the breakdown streamer stage, E in outer edge of plasma layer reaches E0 and streamers ‘restart’.
Space charge effects are connected with PD parameter by electric field, and some electrical field distributions contribute to obviously PD parameter rules. When discharge regions are tiny and E is relatively weak, it may cause unchanged V, and ∆t–V points distribute horizontally, which are shown at initial discharge stages of both polarities and transition stages of negative-glow discharge. When the electric field is high and relatively flat, ∆t–V may have an approximate proportional relationship, and ∆t–V points distribute inclined, which is shown at Trichel discharge stage of negative polarity.
Different forms of discharges may happen under a certain voltage, especially at transition stages, and different forms of discharges can be distinguished on PD parameters. For example, the V proportion distribution at glow-like stage of positive polarity, and ∆t proportion distribution at Trichel discharge stage of negative polarity. The phenomenon arises in that E varies significantly in different discharge regions, which, to a large extent, are caused by the existence of cations and plasmas.
Author Contributions
Conceptualization, D.W. and L.D.; Methodology, D.W.; Software, D.W.; Validation, D.W.; Formal Analysis, D.W.; Investigation, D.W.; Resources, L.D. and C.Y.; Writing-Original Draft Preparation, D.W.; Writing-Review & Editing, L.D. and C.Y.; Visualization, D.W.; Project Administration, L.D.; Funding Acquisition, L.D.
Funding
This research was funded by “the National Key R&D Program” grant number “2017YFB0902400”.
Acknowledgments
Many thanks to Deming Zhan and Han Yan for their contributions in experiments and investigations.
Conflicts of Interest
The authors declare no conflict of interest.
References
- Lutz, B.; Kindersberger, J. Surface charge accumulation on cylindrical polymeric model insulators in air: Simulation and measurement. IEEE Trans. Electr. Insul. 2011, 18, 2040–2048. [Google Scholar] [CrossRef]
- Zhang, Z.J.; Zhang, D.D.; Zhang, W.; Yang, C.; Jiang, X.L.; Hu, J.L. DC flashover performance of insulator string with fan-shaped non-uniform pollution. IEEE Trans. Electr. Insul. 2015, 22, 177–184. [Google Scholar] [CrossRef]
- Thomson, J.J.; Thomson, G.P. Conduction of Electricity through Gases; Cambridge University: London, UK, 1933. [Google Scholar]
- Trichel, G.W. Mechanism of the negative point-to-plate corona near onset. Phys. Rev. 1938, 54, 1078–1084. [Google Scholar] [CrossRef]
- Morshuis, P.H.F.; Smit, J.J. Partial discharge at DC voltage: their mechanism, detection and analysis. IEEE Trans. Dielectr. Electr. Insul. 2005, 12, 328–340. [Google Scholar] [CrossRef]
- Kachi, M.; Nadjem, A.; Moussaoui, A. Corona discharge as affected by the presence of various dielectric materials on the surface of a grounded electrode. IEEE Trans. Dielectr. Electr. Insul. 2018, 25, 390–395. [Google Scholar] [CrossRef]
- Piccin, R.; Mor, A.R.; Morshuis, P. Partial discharge analysis of gas insulated systems at high voltage AC and DC. IEEE Trans. Dielectr. Electr. Insul. 2015, 22, 218–228. [Google Scholar] [CrossRef]
- Marek, F.; Barbara, F.; Pawel, Z. Partial discharge forms for DC insulating systems at higher air pressure. IET Sci. Meas. Technol. 2016, 10, 150–157. [Google Scholar]
- Stephan, V.; Joachim, H. Experimental evaluation of discharge characteristics in inhomogeneous fields under air flow. IEEE Trans. Dielectr. Electr. Insul. 2018, 25, 721–728. [Google Scholar]
- Si, W.R.; Li, J.H.; Yuan, P.; Li, Y.M. Digital detection, grouping and classification of partial discharge signals at DC voltage. IEEE Trans. Electr. Insul. 2008, 15, 1663–1674. [Google Scholar]
- Tang, J.; Liu, F.; Zhang, X.X.; Meng, Q.H.; Zhou, J.B. Partial discharge recognition through an analysis of SF6 decomposition product part 1 decomposition characteristics of SF6 under four different partial discharges. IEEE Trans. Electr. Insul. 2012, 19, 19–36. [Google Scholar] [CrossRef]
- Liu, M.; Tang, J.; Pan, C. Development processes of positive and negative DC corona under needle-plate electrode in the air. High Voltage Eng. 2016, 42, 1018–1027. [Google Scholar]
- Wei, G.; Tang, J.; Zhang, X.X.; Lin, J.Y. Gray intensity image feature extraction of partial discharge in high-voltage cross-linked polyethylene power cable joint. IEEE Trans. Electr. Insul. 2016, 23, 1076–1087. [Google Scholar] [CrossRef]
- Zhang, S.Q.; Li, C.R.; Wang, K.; Li, J.Z.; Liao, R.J.; Zhou, T.C.; Zhang, Y.Y. Improving recognition accuracy of partial discharge patterns by image-oriented feature extraction and selection technique. IEEE Trans. Dielectr. Electr. Insul. 2016, 23, 1076–1087. [Google Scholar] [CrossRef]
- Zhang, B.; Wang, W.; He, J. Impact factors in calibration and application of field mill for measurement of DC electric field with space charges. CSEE J. Power Energy Syst. 2015, 1, 31–36. [Google Scholar] [CrossRef]
- Abdel-Salam, M.; Wiitanen, D. Calculation of corona onset voltage for duct-type precipitators. Ind. Appl. 1993, 29, 274–280. [Google Scholar] [CrossRef]
- Wu, F. Numerical analysis on microcosmic process of corona discharge and ionized filed of HVDC transmission lines. Ph.D. Thesis, Chongqing University, Chongqing, China, 2014. [Google Scholar]
- Liu, K. Study on the effect of corona discharge space charge background on gap discharge. Master’s Thesis, Huazhong University of Science and Technology, Wuhan, China, 2013. [Google Scholar]
- Liu, Z.; Liu, T.; Miao, X.; Guo, W. Research on corona layer of needle-plate discharge in atmosphere. Sci. Technol. Eng. 2013, 13, 1553–1556. [Google Scholar]
- Yang, J. Gas Discharge, 1st ed.; Science Press: Beijing, China, 1983; pp. 154–196. [Google Scholar]
- Yan, Z.; Zhu, D. High Voltage Insulation Technology, 2nd ed.; China electric power press: Beijing, China, 2007; pp. 47–76. [Google Scholar]
Figure 1.
Schematic diagram of the experimental platform.

Figure 2.
Single pulse under positive or negative polarity DC voltage. (a) Positive pulse; (b) Negative pulse.
Figure 2.
Single pulse under positive or negative polarity DC voltage. (a) Positive pulse; (b) Negative pulse.

Figure 3.
Average value diagram of n, V and ∆t on positive polarity.

Figure 4.
Equivalent charge quantity diagram of positive PD.

Figure 5.
Variation coefficients diagram of positive polarity.

Figure 6.
∆t–V distribution of 9 kV at the transition stage.

Figure 7.
Proportion distribution diagrams at the transition stage. (a) Proportion distribution of V; (b) Proportion distribution of ∆t.
Figure 7.
Proportion distribution diagrams at the transition stage. (a) Proportion distribution of V; (b) Proportion distribution of ∆t.

Figure 8.
∆t–V distribution of glow-like discharge stage. (a) ∆t–V distribution of 10 kV; (b) ∆t–V distribution of 13 kV.
Figure 8.
∆t–V distribution of glow-like discharge stage. (a) ∆t–V distribution of 10 kV; (b) ∆t–V distribution of 13 kV.

Figure 9.
Proportion distribution diagrams at the glow-like discharge stage. (a) Proportion distribution of V; (b) Proportion distribution of ∆t.
Figure 9.
Proportion distribution diagrams at the glow-like discharge stage. (a) Proportion distribution of V; (b) Proportion distribution of ∆t.

Figure 10.
∆t–V distribution of breakdown streamer stage. (a) ∆t–V distribution of 15 kV; (b) ∆t–V distribution of 16 kV.
Figure 10.
∆t–V distribution of breakdown streamer stage. (a) ∆t–V distribution of 15 kV; (b) ∆t–V distribution of 16 kV.

Figure 11.
Proportion distribution diagrams at breakdown streamer. (a) Proportion distribution of V; (b) Proportion distribution of ∆t.
Figure 11.
Proportion distribution diagrams at breakdown streamer. (a) Proportion distribution of V; (b) Proportion distribution of ∆t.

Figure 12.
Average value diagram of n, V and ∆t on negative polarity.

Figure 13.
Equivalent charge quantity diagram of negative PD.

Figure 14.
Linear fit analysis of n, q at Trichel discharge stage. (a) Linear fit of n; (b) Linear fit of q.
Figure 14.
Linear fit analysis of n, q at Trichel discharge stage. (a) Linear fit of n; (b) Linear fit of q.

Figure 15.
Variation coefficients diagram of negative polarity.

Figure 16.
∆t–V distribution diagram of −8.75 kV at initial streamer stage.

Figure 17.
Proportion distribution diagrams of V at the initial streamer stage.

Figure 18.
∆t–V distribution diagrams at Trichel discharge stage. (a) ∆t–V distribution of −10 kV; (b) ∆t–V distribution of −12 kV.
Figure 18.
∆t–V distribution diagrams at Trichel discharge stage. (a) ∆t–V distribution of −10 kV; (b) ∆t–V distribution of −12 kV.

Figure 19.
Proportion distribution diagrams at the initial stage of Trichel discharge. (a) Proportion distribution of V; (b) Proportion distribution of ∆t.
Figure 19.
Proportion distribution diagrams at the initial stage of Trichel discharge. (a) Proportion distribution of V; (b) Proportion distribution of ∆t.

Figure 20.
Proportion distribution diagrams at the last stage of Trichel discharge. (a) Proportion distribution of V; (b) Proportion distribution of ∆t.
Figure 20.
Proportion distribution diagrams at the last stage of Trichel discharge. (a) Proportion distribution of V; (b) Proportion distribution of ∆t.

Figure 21.
∆t–V distribution diagrams of glow discharge stage. (a) ∆t–V distribution of −13 kV; (b) ∆t–V distribution of −24 kV.
Figure 21.
∆t–V distribution diagrams of glow discharge stage. (a) ∆t–V distribution of −13 kV; (b) ∆t–V distribution of −24 kV.

Figure 22.
Proportion distribution diagrams at glow discharge stage. (a) Proportion distribution of V; (b) Proportion distribution of ∆t.
Figure 22.
Proportion distribution diagrams at glow discharge stage. (a) Proportion distribution of V; (b) Proportion distribution of ∆t.

Figure 23.
∆t–V distribution of −26 kV at breakdown streamer stage.

Figure 24.
Proportion distribution diagrams at breakdown streamer stage. (a) Proportion distribution of V; (b) Proportion distribution of ∆t.
Figure 24.
Proportion distribution diagrams at breakdown streamer stage. (a) Proportion distribution of V; (b) Proportion distribution of ∆t.

© 2019 by the authors. Licensee MDPI, Basel, Switzerland. This article is an open access article distributed under the terms and conditions of the Creative Commons Attribution (CC BY) license (http://creativecommons.org/licenses/by/4.0/).
Share and Cite
MDPI and ACS Style
Wang, D.; Du, L.; Yao, C. Statistical Study on Space Charge effects and Stage Characteristics of Needle-Plate Corona Discharge under DC Voltage. Energies 2019, 12, 2732. https://doi.org/10.3390/en12142732
AMA Style
Wang D, Du L, Yao C. Statistical Study on Space Charge effects and Stage Characteristics of Needle-Plate Corona Discharge under DC Voltage. Energies. 2019; 12(14):2732. https://doi.org/10.3390/en12142732
Chicago/Turabian StyleWang, Disheng, Lin Du, and Chenguo Yao. 2019. "Statistical Study on Space Charge effects and Stage Characteristics of Needle-Plate Corona Discharge under DC Voltage" Energies 12, no. 14: 2732. https://doi.org/10.3390/en12142732
Note that from the first issue of 2016, this journal uses article numbers instead of page numbers. See further details here.