Article

Environmental Challenges in the Residential Sector: Life Cycle Assessment of Mexican Social Housing

by
Diana Carolina Gámez-García
1,
Héctor Saldaña-Márquez
1,
José Manuel Gómez-Soberón
2,*,
Susana Paola Arredondo-Rea
3,
María Consolación Gómez-Soberón
4 and
Ramón Corral-Higuera
3
1
Barcelona School of Architecture, Polytechnic University of Catalonia, 649 Diagonal Avenue, 08028 Barcelona, Spain
2
Barcelona School of Building Construction, Polytechnic University of Catalonia, 44-50 Doctor Marañón Avenue, 08028 Barcelona, Spain
3
Mochis Faculty of Engineering, Autonomous University of Sinaloa, no number Fuente de Poseidón y Ángel Flores, Los Mochis 81210, Mexico
4
Civil Engineering School, Metropolitan Autonomous University. Av. San Pablo 180, Mexico City 02200, Mexico
*
Author to whom correspondence should be addressed.
Energies 2019, 12(14), 2837; https://doi.org/10.3390/en12142837
Submission received: 5 July 2019 / Revised: 19 July 2019 / Accepted: 22 July 2019 / Published: 23 July 2019
(This article belongs to the Special Issue Life Cycle Energy Assessment on Buildings)

Abstract

:
Social Housing (SH) in Mexico has a potentially important role in reducing both the emission of greenhouse gases and the use of non-renewable resources, two of the main challenges facing not only Mexico but the planet as a whole. This work assesses the environmental impact generated by the embodied stages of a typical SH throughout its life cycle (cradle to grave), by means of a Life Cycle Assessment (LCA). Two types of envelope and interior walls and three types of windows are compared. It was found that SH emits 309 kg CO2 eq/m2 and consumes 3911 MJ eq/m2 in the product stages (A1 to A3) and construction process (A4 to A5); the most important stages are those referring to the products, namely, A1 to A3, B4 (replacement) and B2 (maintenance). Additionally, benefits were found in the use of lightweight and thermal materials, such as concrete blocks lightened with pumice or windows made of PVC or wood. Although the use of LCA is incipient in the housing and construction sector in Mexico, this work shows how its application is not only feasible but recommended as it may become a basic tool in the search for sustainability.

Graphical Abstract

1. Introduction

The population of Latin America and the Caribbean (LAC) represents 8.55% of the world population [1], of which 75% is concentrated in countries with emerging economies (32% Brazil, 20% Mexico, and 22% for Colombia, Argentina, Peru and, Chile together) [1,2]. The high metabolic rates of this region have obliged governments to design and introduce new approaches to separate their economic growth from the use of resources and, consequently, their environmental impact [3].
Although the LAC countries have twice the population of the United States (U.S.), they produce a lower global warming effect. This is similar to the case of the Asian giants, where India emits just 24% of the Greenhouse Gases (GHG) produced by China, despite each being home to 18% of the world’s population. Regarding energy consumption, the USA, the European Union (EU), and China consume 4.15, 1.89, and 1.26 times more than the world per capita average respectively, while India and LAC consume 3.88 and 1.47 times less (Table 1). This indicates that the environmental impact indices generated by each country (and region) are discordant with the number of people living in them.
The emerging economies of LAC must face up to important environmental challenges in order to avoid replicating the throwaway society model of the industrialized nations [10]. Among the most important problems is the rise in annual temperature caused by the increase of GHGs and the wasteful consumption of energy (from renewable and non-renewable sources); there are also the residues generated by this consumption, such as Construction and Demolition Waste (CDW) and Municipal Solid Waste (MSW), which play an important part due to the quantities involved.
To overcome their own environmental challenges, LAC countries need to set up schemes to achieve economic and social growth that will avoid unsustainable environmental damage, that is, plans in line with the objectives of the new sustainable development agenda, which are governed by three cardinal axes: Eradicating poverty, protecting the planet, and ensuring prosperity for all [11].
Mexico has the second largest population of the countries in LAC, with more than 129 million inhabitants (80% concentrated in urban areas) [1]. Over the last ten years it has had economic growth of 2.2% [12] and, up to 2017, annual population increase of 1.3% [8] (Table 2); therefore, an increase in energy needs and consumption of natural resources can be expected in coming years, as well as GHG emissions and the CDW and MSW that generate them.

2. Environmental Challenges in Mexico

In Mexico, the national inventory of greenhouse gases and compounds is closely linked to scientific and technical criteria established by the Intergovernmental Panel on Climate Change (IPCC). It reported that in 2015 a total of 683 million tons (Gg) of CO2 eq were emitted, of which 71% were Carbon Dioxide (CO2) and 21% Methane (CH4). The inventory also counted 148 Gg absorbed by vegetation (mainly forest and jungle), bringing the net emissions balance to 535 Gg of CO2 eq (Table 3). Additionally, 1.4% of the total CO2 and 1.24% of the total CO2 eq in the world was generated in 2012 (in the LAC group, only surpassed by Brazil) (Table 2).
Of all the emissions (Figure 1), the housing sector emits 3.1% of CO2 eq, derived from compounds of CO2, CH4 and Nitrous Oxide (N2O) generated by the consumption of natural gas, liquid petroleum gas, kerosene and diesel; there is also CH4 and N2O due to the burning of firewood in homes, the emissions generated by their operational energy. Other emissions related to the residential sector are those caused by the energy needed for transport (25.1%) and the construction and manufacturing industry (9.3%); the mineral and metal industries (5.5%) and the elimination of solid waste (3.2%). However, the corresponding proportional part of each must be obtained. It is essential to analyze exhaustively the GHGs that generate the activities that are carried out throughout the life cycle of the residential sector, especially social housing. Which, due to its high representation (88%) in the homes of the country, is a dominant relevance.
Moreover, in 2017, Mexico ranked 16th in the list of countries with the highest energy consumption in the world, reporting the third consecutive year with an energy independence index equivalent to 0.76; that is, 24% less energy was produced than necessary for the various consumption activities within the national territory [14]. This is despite the country’s wealth of natural resources such as gas, coal and renewable energy sources (water, wind, solar and marine energy); however, its economy and energy supply are dependent on fossil fuels, which together with the lack of energy planning is a major cause for concern [15].
The national energy balance in 2017 (Figure 2), shows that the national energy consumption for this year was 9249.75 Petajoules (PJ), of which the 58% corresponding to total energy consumption and 32% to activities inherent to the energy sector (transformation, own consumption, and losses) stand out (Figure 2a). The total energy consumption (Figure 2b) in this year was 5362.8 PJ, which is attributed to the internal market or the productive activities of the national economy, of which the housing sector is responsible for 14%, due to the operating requirements of housing [14]. Additionally, other data needed for this sector is that referring to the proportional part of transport (44%) and industry (35%).
Regarding the waste products (Table 4), Mexico generates 0.4% of the world total of CDW and 3.4% of the MSW (second in the LAC region), and although the sum of its waste is lower than that of countries such as China (1,130,000,000 t CDW; 328,922,213 t MSW), U.S (548,000,000 t CDW; 240,380,753 t MSW) and India (530,000,000 t CDW), the impact on a national scale should not be ignored as it has limited management protocols and lacks the infrastructure for waste processing [16].
Of the CDW generated in public and private works, 20% is disposed of in authorized dumps and only 3% is recycled; the rest is used in site levelling, landfills and, inappropriately, in road or street repairs [16]. In this respect, the NOM-161-SEMARNAT-2011 norm came into effect in 2013, stating that construction waste shall be classified as special handling waste, requiring action to be taken for its reuse and recycling or, where appropriate, for its proper disposal [17]. In the case of the 44 million MSW generated annually [18], despite having the General Law for the Prevention and Management of Waste, only 84% are collected, 78.5% are dumped in final disposal sites, and only 9.6% are recycled [19].

2.1. Life Cycle Assessment in Mexico

Various methods have been used in recent decades to measure the environmental performance of human and natural activities. One of these is the Life Cycle Assessment (LCA). “LCA, has become a key methodology to evaluate the environmental performance of products, services and processes and it is considered a powerful tool for decision makers” [25]. In Mexico, the LCA was used for the first time in the late 1990s and early 2000s, in a study on waste management carried out by the National Institute of Ecology and Climate [26]. The methodology has been used in several economic sectors in the country, such as the energy [27] or mining industries [28]. According to the study conducted by Valdivia, until 2014 Mexico was the second ranking LAC country in terms of publications referring to LCA (101 articles) [3].
Until 2010 research using LCA had a preferential focus on waste management issues; from that year onwards, studies focused on topics such as the energy sector, the analysis of carbon and water footprints and the construction sector [26]. Within the latter, studies have been carried out on the co-processing of municipal waste used as fuel for a cement kiln [29], as well as the publication of a book on LCA in construction, where topics such as social housing (SH) are analyzed [30].
The housing sector began to attract attention in 2006, when the government introduced life cycle thinking into the National Housing Law [31]. In this respect, Cerón-Palma et al. (2013) measured the Global Warming Potential (GWP) of the operating energy of a SH [32]; as well as proposing strategies to reduce energy demand [33], other studies have focused on optimizing rainwater [34,35]. In addition to the LCA, other tools such as the Building Sustainability Rating Systems [36] and product environmental statements [31,37] have been used.
Although in Mexico the use of LCA in the construction and residential sector is basically nil, its application is feasible and can become a valuable tool in the search for environmental solutions as it has been in various regions of the world [38].

2.2. Housing in Mexico

Housing types in Mexico are classified according to their constructed surface: Economic (30 m2), popular (42.5 m2), and traditional (62.5 m2), known together as SH. There are also medium (97.5 m2), residential (145 m2), and residential plus (225 m2) [39]. In the last five years, more than 2.58 million housing units have been built, of which 88% are SH (11% economic, 47% popular, 30% traditional), while the remaining 12% corresponds to the medium, residential and residential plus models [40]. It is estimated that 600,000 new housing units will be needed annually during the next decade [41].
Due to the high representation of the SH, the National Development Plan 2013–2018 has promoted the issue of sustainable construction in this sector [31]. As a result, in the last decade, Mexico has stood out among the middle-high income level countries due to its Finance Program for Housing Solutions, which aims to provide more sustainable SH. These actions have been considered exemplary with respect to global good practices [36].
According to data compiled up to 2010 by the National Housing Commission (CONAVI), 86% of the housing stock is in use (80.12% permanent use and 5.65% temporary use), while 14% is unoccupied [42]. Until 2015, the inventory of occupied housing showed 31,949,709 private units with an average of 3.7 habitants each [43]; of these, 73% are single-family, 19% are two-family, and 7% are multifamily housing. Multifamily housing is mainly concentrated in the states with the highest population density of the Republic (41% in Mexico City, 15% Mexico State, 7% in Jalisco and 5% in Puebla), while it is practically nil in the rest of the country (an average of 1% per state) due to the persistence of the single-family dwelling [44].
Housing in Mexico has great challenges to face; on the one hand, there are impacts generated throughout its use, and on the other hand, there are environmental impacts arising from the incorporated stages of materials and processes necessary for construction. National inventories of energy and greenhouse gases and compounds have clearly established the impacts generated by the residential sector in its operation (B6, Operational energy [45]); however, it is necessary to define the environmental burdens that are generated from the incorporated activities of its life cycle to consider a “from the cradle to the grave” approach.

2.3. Objectives of the Study

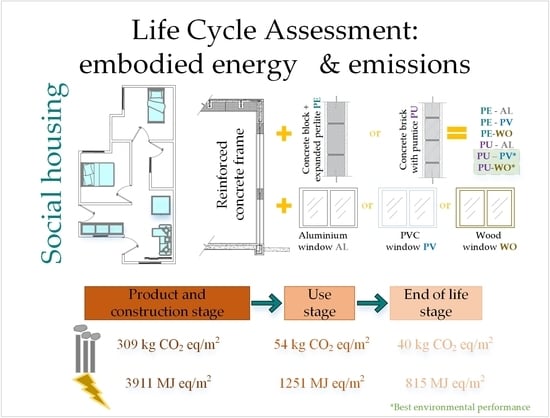
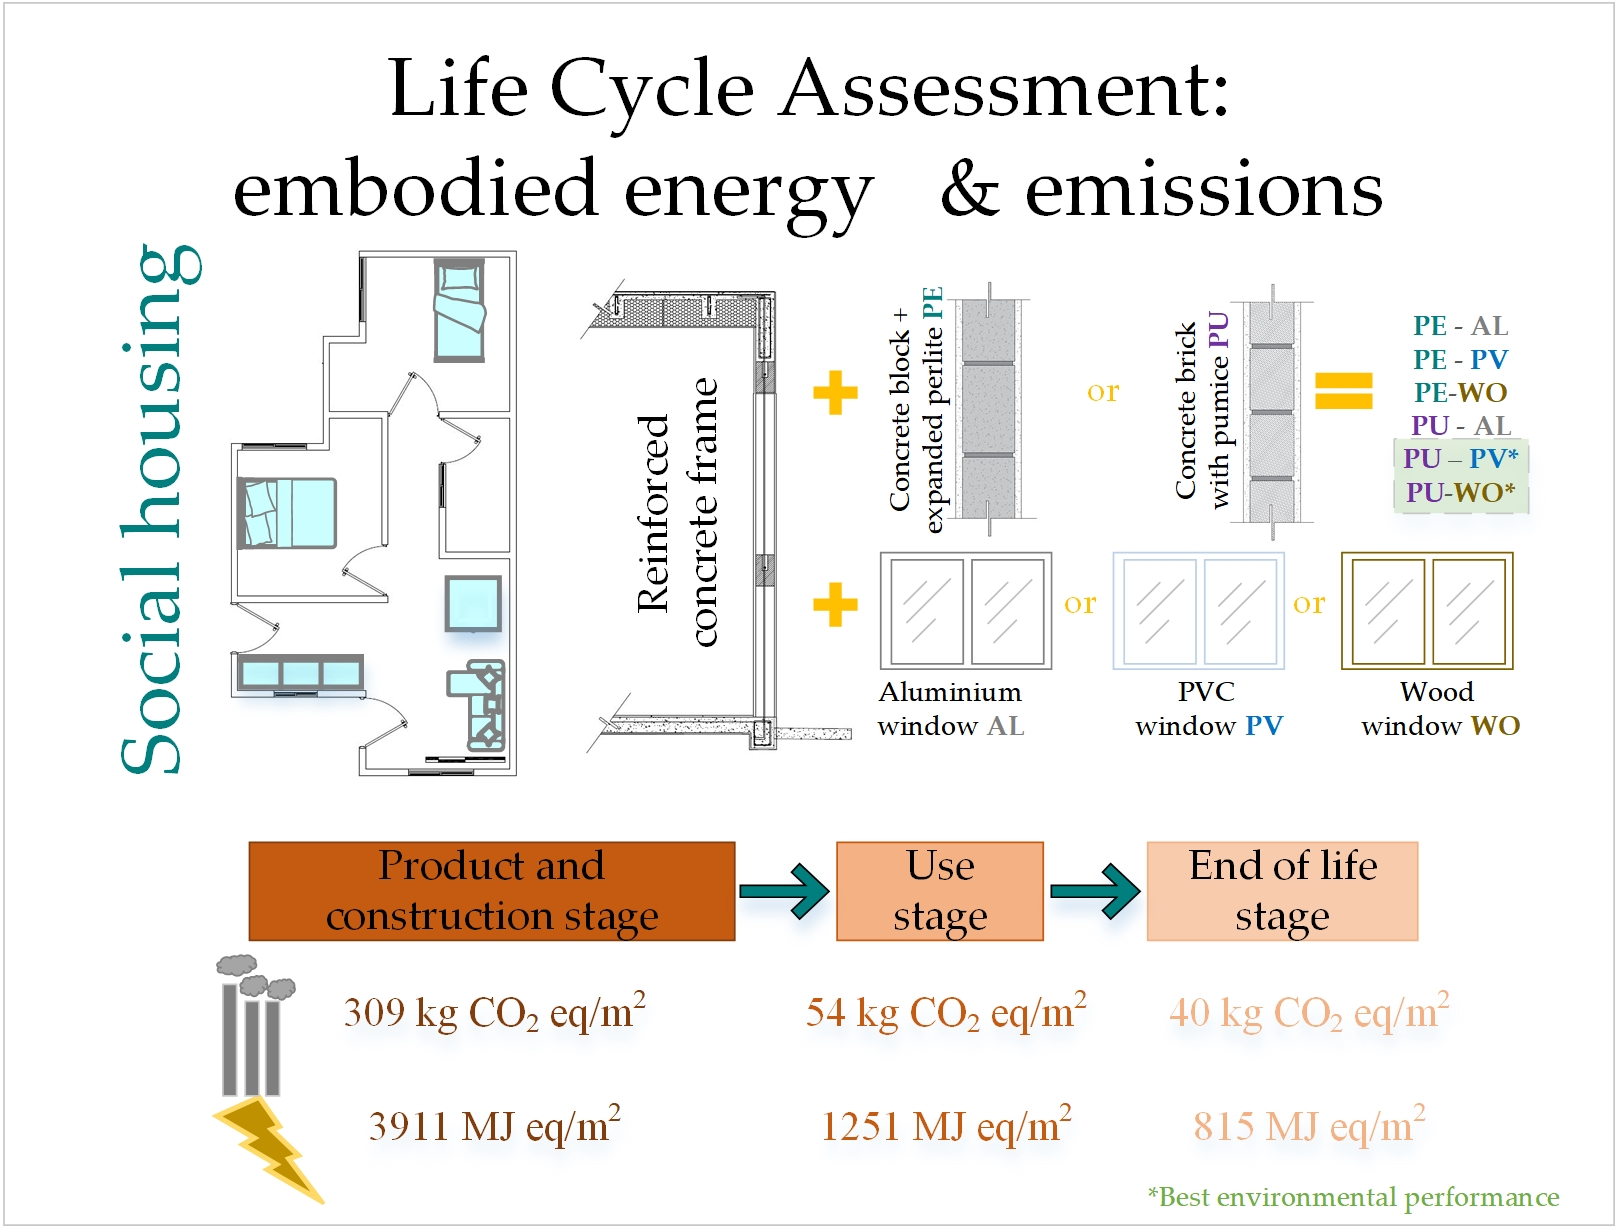
The objectives of this research are (1) to identify the state of the most relevant environmental impacts occurring in Mexico, emphasizing the residential sector, and (2) to achieve an approximation of the environmental impacts generated by this sector. To reach the latter objective, an LCA methodology applied to a representative SH of the Mexican ambit will be used; the elements that make up its envelope will be varied, resulting in a total of six options to be analyzed throughout its life cycle.

3. Materials and Methods

3.1. Goal and Scope of the LCA

The objective of the LCA was to establish the environmental impacts generated by a typical SH in Mexico throughout its life cycle. For the analysis the constructive elements that make up the structure, the envelope (opaque and transparent parts) and the internal partitions were considered, as well as their basic finishes. Previous studies have analyzed the structure, the envelope [46,47,48,49,50] and the interior walls [51,52] of a building because of their contribution to the total environmental loads generated by their incorporated stages and also because of the impact these elements (especially the envelope) have on the energy performance of the building’s operational stage.
The reference dwelling is a built and practical prototype in the Mexican ambit; five additional alternatives are proposed by varying interchangeable and feasible materials and construction solutions in the local practices. Of the six options to be analyzed, all have in common the structure (consisting of foundation slabs, columns and beams of reinforced concrete, and roof slab of reinforced concrete lightened with Expanded Polystyrene Pieces, EPS), the exterior and interior wooden doors, and the basic finishes (1.5 cm thick mortar for exterior and interior walls, 1.5 cm thick plaster for roof slab, and vinyl paint for all cases). The elements that differed were the exterior and interior walls (two types of concrete pieces: (1) Hollow Block of 12 × 20 × 40 Filled with Expanded Perlite (PE) and (2) Solid Partition of Lightened Concrete with Pumice Aggregates of 10 × 14 × 28 (PU)) and windows (three types: Aluminum (AL), PVC (PV) or Wood (WO)). The nomenclature used is shown in Figure 3.
The basic characteristics of the structure are illustrated in Figure 4, and Figure 5 shows the configuration of the exterior and interior walls, as well as the location and dimensions of the doors and windows of the SH.
The established functional unit was the 42 m2 dwelling (Figure 5), with a useful life of 50 years according to previous research [53,54,55,56]. Its dimensions correspond to those of popular housing, which is nationally the most representative (47% which, together with the traditional and economic housing, makes up 88% of the SH [40]). The analyzed elements allow an approximate estimate of the environmental impact generated by a Mexican SH in all stages of its life cycle; in addition, any changes of the proposed elements are required to be equivalent with respect to their thermal, structural, and functional capacities, thus allowing for their possible comparison and the best environmental choice.
Despite the initiatives of CONAVI aimed at the construction of sustainable housing and related programs, it has not yet been possible to comply with the regulations on energy efficiency in SH; however, these efforts have led to the search for solutions and practices that show a continual improvement, as reported in previous studies [36]. The walls of the reference prototype are one example of this. They have eco-technology used in SH (expanded perlite insulation to fill the concrete blocks, with a thermal conductivity coefficient (λ) of 0.042 W/mK); however, its Thermal Transmittance (U), equal to 1.07 W/m2K, does not comply with NOM-020-2011 (U = 0.476 W/m2K for cities with extremely hot climates to U = 0.909 W/m2K for cities with temperate-cold climates [57]). Therefore, the construction of concrete walls lightened with pumice aggregates (λ = 0.052 W/mK) was proposed, with similar characteristics of functionality and compressive strength (13 cm thick, F´c > 90 kg/cm2), but with improved thermal performance due to the intrinsic properties of the material. This results in walls with a U equal to 0.46 W/m2K (complying with NOM-020-2011 for the least favorable case; Figure 5).

3.2. Boundaries and Functional Unit

The analysis considered the Stages of Product (A1 to A3) and Construction Process (A4 to A5); Maintenance (B2) and Replacement (B4), Demolition (C1), Transport (C2) and Disposal (C4). The Use (B1), Repair (B3), and Refurbishment (B5) stages were excluded, being considered dependent on the user; Waste Processing (C3) was also omitted as immediate dumping is the single most used scenario in the Mexican context [16]. The analysis may be considered cradle to grave, according to the proposal of annex 57 of the IEA EBC for evaluating the incorporated energy and the CO2 eq emissions. Annex 57 complements the international ISO 21931-1 and European EN 15978 standards for the evaluation of building structures to improve transparency for the multiple stakeholders in the LCA process [58]. The limits of the LCA system are shown in Figure 6.

3.3. Life Cycle Inventory

Two databases were used, one specializing in the quantification of materials and construction processes at the Mexican level, CYPE [59], and another specializing in life cycle inventories, ecoinvent 3.1 (2014) [60]. However, since ecoinvent initially included products and activities exclusively at the European—in particular the Swiss—level, recent versions incorporate global, and sometimes specific, processes from countries outside Europe, as in the case of Mexico or North America. Previous studies conducted in Mexico using ecoinvent have obtained favorable results [29,32,61,62,63,64]; and although their use might presuppose a limitation, this is in turn an available tool that generates reliable approaches to environmental impacts.

3.3.1. Product Stage (A1 to A3)

The product stage included the manufacture of the structure, the envelope, the internal partitions, and the basic finishes. The weights obtained from the inventory were also considered with a 5% waste rate. The required quantities of each material used and the corresponding dataset are shown in Table 5. The processes and materials used (taken from ecoinvent) were adapted to the conditions of the SH; however, in the specific case of the windows (AL, PV, and WO), the dataset analyzed represents a more efficient window than those used for the SH; although the weights and dimensions were adapted to the conditions of the project, in the case of these elements, it is prudent to consider the results as values of close environmental impact.

3.3.2. Construction Process Stage (A4 to A5)

In Mexico the greatest impact on the demand for electricity in homes occurs in the northern and coastal areas of the country—warm climates—where the use of cooling equipment is more common than heating equipment [57]; therefore, for better representativeness, the analyzed SH is assumed to be located in the Northwest of Mexico, using in this work the proposed alternative that satisfies the most unfavorable U-value corresponding to the cities of Hermosillo, Guaymas, and Mexicali (0.476 W/m2K).
The environmental impact generated by a truck operating with a load capacity of 7.5–16 t, measured in Tons-kilometers (tkm), was determined for a complete travel cycle (round trip) of the material. The maximum dimensions of the truck correspond to those established by the communications and transport secretariat for long distance roads ET-A (maximum load of 17.5 t) and for short distance roads D (maximum load of 11 t) and Euro 4 engine [65].
The values considered for the distances travelled were an average of the journeys between the hypothetical center of each capital of the north-western states of the country (Baja California, Baja California Sur, Chihuahua, Durango, Sinaloa, and Sonora) and the nearest factories of each type of material previously established in the inventory (determined using Google maps). The resulting values were: 15 km for concrete, steel, EPS, doors, and windows; 20 km for vinyl paint; 400 km for ceramic floors; 470 km for steel; and 510 km for expanded perlite (methodology used in previous studies [66,67]). The quantities required for each construction alternative are shown in Table 6.
For the assessment of the Construction Stage (A5), the processes and materials necessary for the formwork of the structure (with wood and steel) were considered, as well as those for the transport, discharge, and vibration of the concrete used in the structure and for mixing the mortar used in the walls. The quantities used are shown in Table 7.

3.3.3. Use Stage (B2, B4)

Of the stage of use, those stages corresponding to the useful life of each material during the building’s 50 years of useful life were considered, that is, the Maintenance (B2) and the Replacement (B4) of the elements. The maintenance intervals and replacement cycles obtained from the literature are shown in Table 8.
The elements that needed Maintenance (B2) were the doors, the windows (painting every ten years = 3 cycles) and the walls (painting every five years = 9 cycles). In the Replacement stage (B4), the doors and windows are the elements with a useful life less than the SH, and so their replacement is considered at 30 years (one replacement cycle in the total timeline of the SH). The quantities required are listed in Table 9.

3.3.4. End of Life Stage (C1, C2, C4)

The CDW management scenarios in Mexico are limited by the scarcity or even lack of infrastructure. There is only one CDW recycling plant in the whole country, in Mexico City (Recycled concretes); nevertheless, this is a pioneering initiative not only in Mexico but also in the LAC region [73]. The NOM-161-2011 [74] sets out the requirements for special waste management (where the CDW are included) and is obligatory for large-scale generators of waste (>80 m3).
In this sense, at the end of life stage, the energy required for the operation of the demolition equipment of the structure and walls (C1) of the SH (pneumatic hammer, cutting equipment, and portable compressor) was considered. Subsequently, the effect of the operation of the transport truck (C2) was obtained by the same process previously established in A4. The average distance between the hypothetical center of each reference city to the dump was 30 km. Finally, the total amount of CDW generated by SH was calculated to obtain the impact of its landfill disposal (C4) (processing in a recycling plant being currently impossible). The materials used were considered inert, as being of petrous, metallic, and petroleum origin, so their processing did not pose a potential risk. The quantities are shown in Table 10.

3.4. Environmental Impact Assessment

More than 40% of world energy consumption and 30% of the GHGs can be attributed to the construction industry [58]. Therefore, both effects measured in their respective impact categories have been considered inherent to this sector and have been addressed in previous investigations [75,76,77,78,79]. In this sense, the categories of impact selected for analysis in this study are those referring to energy and embodied emissions of SH, which are climate change and embodied energy. Additionally, to complete the information, two more categories have been chosen, which like the previously mentioned have been considered to have a global effect: Human toxicity and Abiotic Depletion Potential (ADP). The environmental impact methods used were, therefore, IPCC 2013 for the GWP (climate change), Cumulative Energy Demand (CED, for embodied energy), and CML 2001 for Human Toxicity Potential (HTP) and ADP.

4. Results

The analyzed SH generates an environmental burden (including all the stages of A to C) of 17 t CO2 eq, 252.5 Gigajoules (GJ) eq, 104.3 kg antimony eq, and 9.4 t Paradichlorobenzene (1,4-DCB) eq (average of the six options). Of these, just the construction of the SH (finished product A1 to A5) generates a load of 13 t CO2 eq, 165 GJ eq, 71 kg antimony eq, and 7 t 1,4-DCB eq (Table 11), i.e., more than 70% of the average impacts of all the categories analyzed when the embodied stages of the life cycle are considered.
The product stage is established as that of greatest contribution (A1 to A3: 57% CED, 61% ADP, 71% HTP-GWP), followed by that of replacement (B4: 6% GWP, 8% ADP, 12% CED, 15% HTP) and maintenance (B2: 6% HTP, 7% GWP, 9% ADP-CED); it is therefore established that the stages with greater environmental effects are those involving finished products (A1 to A3, B2 and B4: 78% CED-ADP; 85% GWP; 91% HTP), in this case, those used in constructing the building, the paint for its maintenance, and the replaceable objects (windows and doors). Meanwhile, the stages referring to the processes produce significantly less effect; from greater to lesser, they are those relating to transport (A4 + C2: 3.3% HTP, 7.7% GWP, 9.3% CED, 10.1% ADP), to construction/demolition (A5-C1: 3.7% HTP, 6.1% GWP, 7.6% ADP, 9% CED), and lastly, to their final disposition (C4: 1.5% GWP, 1.6% HTP, 3.7% CED and 3.9% ADP) (Figure 7).
Previous research has dealt with the embodied impacts of a building (or its elements), studying different stages such as A1 to A4 [80], A1 to A5 [66,79,81], A and C [51] and A to C [48,49,82,83]; similar to this study, these works found that the greatest environmental detriment occurs in stage A1 to A3, with values ranging from 85% to 99% for those who evaluated up to A1 to A5 [51,66,79,80,81] and from 60% to 80% for those who evaluated the complete cycle (A to C) [48,49,82,83]. For the rest of the stages, the results depended on the different criteria established in each study, so there are still discrepancies in the results obtained. Nevertheless, the data obtained in this work is found within the previously reported intervals; for example, the studies that evaluated B1-B5 reported values ranging from 11% to 25% [48,49], those that studied A4, from 1% to 9% [51,66,79,80,81], those that evaluated A5 from 1% to 8% [49,51,66,79,80,81], while those that studied the C stages showed intervals from 1% to 3% [48,51] up to 23% [49], this stage showing the most variation.
Figure 7 shows how the greater variability occurs when a wood or PVC window is changed to aluminum for the HTP, going from 11–12% to 19% of the total damage. This can be attributed to the high amounts of contamination produced in the aluminum production process, which includes substances such as CO2, Sulfur Dioxide (SO2), Polycyclic Aromatic Hydrocarbons (HAP), Perfluorocarbons (PFC), Tetrafluoromethane (CF4) and Hexafluoroethane (C2F6) [84]. Similar to the study by Yasantha et al. (2007), where it was found that although wooden windows have a better environmental (and economic) performance, aluminum windows were preferred socially [85].
On the other hand, the damage caused by A1 to A3 is more evident for the GWP (70–72%), which is because the most representative materials used in the SH (concrete, steel, ceramic pieces, mortar) are linked with the emission of GHGs [13,66,67,86], due to the chemical reactions in their manufacturing processes and the high content of carbonates in their basic components, such as limestone or clay [87,88]. The greatest variation found in the impact categories was in stage A1 to A3, with a difference of 14% between the GWP (72%) and the CED (58%). This difference in the representation of the CED is spread over the rest of the stages, above all in B4 and B2 (because the manufacture of paint and window materials is more closely linked to energy consumption [86,89] than to GHG emissions) and in A5 and C1 (for the energy used by the machinery).
Analyzing each impact category separately (Figure 8), it was seen that the least favorable option in all cases was that of the reference (PE-AL), which is more pronounced in the stages A1 to A3 and B4. Previous studies have found that the production of aluminum (stages A1 to A3 or B4) requires high energy consumption [89], up to six times that of steel per unit of weight [86], as well as the inherent contaminants [84]. Therefore, the least favorable of the six combinations analyzed is that which includes heavy material with a moderate load potential and light material with a high load potential.
Furthermore, when the stages with higher variability are discarded (A1 to A3 and B4, Figure 8), it can be seen that the options using PU are more favorable than those using PE, which can be attributed to the fact that the pumice aggregates are lighter than the conventional ones [90]. This coincides with previous research that recommends the use of volcanic materials—among them pumice—as they may significantly reduce the environmental damage [91]. Therefore, the options with the best environmental performance in all the impact categories were the PU-WO and the PU-PV.
Given the importance of the construction industry in the use of energy [47] and GHG emissions [92], in Figure 9 these categories are dealt with separately, breaking the CED down into its proportional Renewable (Re) and Non-Renewable parts (n-Re). The percentage of CED (n-Re) for all cases is significantly higher than the CED (Re), being 84.8% for stage A, 67.6% for stage B and 98.8% for stage C of the CED total. Of the three stages, B makes greater use of renewable sources due to the use of wood in the doors and windows, followed by A, especially when the options PE-WO and PU-WO are evaluated. Some authors mention the advantages of using wood due to the low energy requirements of its manufacture [76]. Similarly, it can be seen that stage C is practically dependent on CED (n-Re), due to the machinery (C1) and vehicles (C2) used.
The results found for the CO2 eq emissions and the consumption of incorporated energy are figures that are found in the list of effects reported by other researchers (Table 12). The information has been compared with that of residential, office, and commercial buildings, all of which have similar characteristics in terms of the materials used in their construction (reinforced concrete framework and traditional masonry). The majority evaluate the same components of the building (including the structure and envelope) which enables comparison. In SH the interior partitions are also evaluated.
The SH analyzed emits 309 kg CO2 eq/m2 and needs 3911 MJ eq to perform stages A1 to A5; it also emits 54 kg CO2 eq/m2 and needs 1251 MJ eq for stages B2 and B4, similar to what was reported by Iddon et al. (2013) [93], Islam et al. (2015) [48] and Gustavsson et al. (2010) [94]. Additionally, when the impacts of the SH are compared with multi-story commercial or office buildings, although the results alternate within the same level of effect, the values tend to be higher in an interval of 30% to 40%. The stage showing most variation was C; as each study focused on specific end of life scenarios, their comparison was not feasible.
For stages A and B, the level of comparison is especially interesting, as each study was carried out in different geographical regions and with different databases. Therefore, it can be argued that the LCA is an objective methodology which allows global results in the residential sector to be obtained and it has been possible to standardize them, above all in the Product Stage (A1 to A3).
Considering the representativeness of the housing types in Mexico (11% economic, 47% popular, 30% traditional, 12% medium, residential, and residential plus [40], each of which was assigned 4%), it was possible to obtain an approximation of the effects of their embodied stages. One square meter of construction (A1 to A5) produces 309 kg of CO2 eq and needs 3,911 MJ; as about 600,000 new housing units are built annually in Mexico [41], the total annual effect of the residential sector in stages A1 to A5 (until the finished house) is 11,275.8 Gg CO2 eq and 142.5 PJ eq of energy (Table 13).
Additionally, using the national inventory of CO2 eq emissions and compounds, these figures represent 2.1% of the net emissions (taking absorption into account), and 1.7% if total emissions are considered. Added to the 4% emissions from the housing sector due to consumption of natural gas, liquid petroleum gas, kerosene, diesel, and firewood in the operating stage [13], this means that 6.1% of the annual emissions may be attributed to the residential sector. Similarly, as regards the national energy inventory [14], the figures represent 2,7% of the annual consumption. This, when added to the 14% operational energy consumption, gives an estimated total of 16.7% of energy attributed to the residential sector (Table 14).
Although it is evident that performance in the housing sector in Mexico is steadily improving, it is essential to deal with the accelerated changes that are being caused by environmental damage, not only at a regional level but also at a global one. The residential sector has an enormous potential to reduce these environmental burdens (including those of greatest concern today, such as climate change and the depletion of resources and non-renewable energy), throughout the various sectors that are required for its praxis. In this regard, it is necessary to opt for locally available materials, with high percentages of reuse, with thermal properties that enable energy optimization and, of course, that these should come where possible from renewable resources or from the discreet use of non-renewable resources.
On the other hand, while the importance of SH in the residential sector is indisputable, there is also a need to apply sustainability criteria to medium and residential housing. Although their representativeness is lower, in this work it was estimated that the resources invested in them (because of their size) could generate loads greater than 30% in GWP and CED, and the application of eco-technologies could be economically feasible (limitation present in the SH).
Moreover, while it is true that the LCA is a methodology that has been used in Mexico for decades [26], extending its application to one of the country’s most demanding sectors would provide opportunities for reducing environmental burdens. This, through knowledge of the most commonly used materials and the processes required throughout the life cycle of a dwelling. This knowledge would enable the best environmental performance options to be chosen, and the opportunities for improvement would be identified.

5. Conclusions

The present study has assessed the environmental impacts generated by an SH throughout its embodied life cycle; a comparison of six alternatives was made by varying their elements (walls and windows), and it was possible to apply the LCA methodology to Mexico’s residential sector with promising results. In addition, a review of the country’s environmental situation focusing on the most relevant problems facing the residential sector was made.
It was found that throughout the cycle the SH analyzed generates an environmental burden of 17 t CO2 eq, 252.5 GJ eq, 104.3 kg antimony eq, and 9.4 t 1.4-DCB eq; the requirements of stages A1 to A5 stand out, exceeding 70% of the impact in all the categories analyzed. In general, the stages with the greatest environmental effect are those containing a finished product (A1 to A3, B2, and B4: 78% CED-ADP; 85% GWP; 91% HTP), while the stages referring to the processes have a considerably lower impact. For A4 + C2 the figures are 3.3% HTP, 7.7% GWP, 9.3% CED, and 10.1% ADP. For A5 + C1 they are 3.7% HTP, 6.1% GWP, 7.6% ADP, and 9% CED. Finally, C4 has 1.5% GWP, 1.6% HTP, 3.7% CED, and 3.9% ADP.
The greatest variability in the results comes from changing the wood or PVC windows for aluminum windows in the HTP category, passing from 11–12% to 19% of the total damage, which is attributed to the aluminum production process.
The most unfavorable of the six cases analyzed was the reference sample (PE-AL), while the options with the best environmental performance were PU-WO and PU-PV for all impact categories. Environmental advantages can arise from using aggregates that could lighten the concrete for configuring the walls, as long as their environmental burden is equal to or less than that of conventional aggregates, and their basic attributes are not reduced.
The SH evaluated emits 309 kg CO2 eq/m2 in A1 to A5, 54 kg CO2 eq/m2 in B2 and B4, and 40 kg CO2 eq/m2 in C1, C2, and C4. It requires 3,911 MJ eq in A1 to A5, 1,251 MJ eq in B2 and B4, and 815 MJ eq in C1, C2, and C4. This data was collated with recent studies and, although they were carried out in different regions and developed with different databases, the results show consistency. Therefore, it was concluded that the methodology generates objective and global results in the residential sector and that, with the continuous improvement in standardization, it is increasingly possible to apply around the planet, especially in stages A1 to A3.
On the other hand, although ecoinvent regularly incorporates information from different regions of the world, it is urgent to create local databases in Latin America or in the case of Mexico expand the number of data for the existing one—mexicaniuh [96].
Considering the annual amount of the different types of dwellings built and their effect per m2 as obtained in this study, an estimate of the annual impact of the residential sector on the finished housing (A1 to A5) was obtained. This was 11,275.8 Gg CO2 eq, or 2.1% of net emissions. When added to the 4% emitted in the operation of the dwelling (B6) and the compound emissions, according to the national GHG inventory, this gives a total of 6.1% emissions attributed to the residential sector. Similarly, according to the national energy inventory, the estimated energy required by the residential sector in its finished housing phases (A1 to A5) is 142.5 PJ, or 2.7% of annual consumption. When added to the 14% operational energy consumption, this gives a total estimate of 16.7% of energy attributed to the residential sector.
Finally, it will be interesting in future research to obtain the CO2 eq emissions of the residential sector and the energy eq required to carry out phases B and C annually, as well as to know the environmental impacts produced by public and commercial buildings (in addition to civil works), with the aim of obtaining the total burden generated by the construction industry in Mexico.

Author Contributions

Conceptualization, D.C.G.-G. and J.M.G.-S.; methodology, D.C.G.-G., H.S.-M., and J.M.G.-S.; validation, R.C.-H.; formal analysis, D.C.G.-G. and J.M.G.-S.; investigation, H.S.-M. and S.P.A.-R.; resources, J.M.G.-S. and M.C.G.-S.; data curation, D.C.G.-G. and H.S.-M.; writing—original draft preparation, D.C.G.-G. and R.C.-H.; writing—review and editing, M.C.G.-S.; supervision, S.P.A.-R. and R.C.-H.; project administration, S.P.A.-R. and M.C.G.-S.; funding acquisition, J.M.G.-S.

Funding

This research received no external funding.

Acknowledgments

The authors would like to thank CONACYT for its doctoral scholarship program, the Barcelona School of Building Construction-UPC, the Department of Architecture Technology-EPSEB-UPC and the School of Engineering Mochis-UAS. Acknowledgements also go to Grupo Mezta for providing information related to the case study.

Conflicts of Interest

The authors declare no conflicts of interest.

Abbreviations

1,4-DCBpara-dichlorobenzene
A1 to A3Product stage
A4 to A5Construction process stage
ADPAbiotic depletion potential
ALAluminum
B1Use
B2Maintenance
B3Repair
B4Replacement
B5Refurbishment
C1Deconstruction/demolition
C2Transport
C2F6Hexafluoroethane
C3Waste processing
C4Disposal
CDWConstruction and demolition waste
CEDCumulative energy demand
CF4Tetrafluoromethane
CH4Methane
CO2Carbon dioxide
CONAVINational Housing Commission
EPSExpanded polystyrene
EUEuropean Union
GgMillions of tons
GHGsGreenhouse gases
GJGigajoules
GLOGlobal
GWPGlobal warming potential
HAPPolycyclic Aromatic Hydrocarbons
HTPHuman toxicity potential
IPCCIntergovernmental Panel on Climate Change
LACLatin America and the Caribbean
LCALife Cycle Assessment
MSWMunicipal solid waste
N2ONitrous oxide
n-ReNon-Renewable
PEHollow block of 12 × 20 × 40 filled with expanded perlite
PFCPerfluorocarbons
PJPetajoules
PUSolid concrete brick lightened with pumice aggregates of 10 × 14 × 28
PVPVC
ReRenewable
RNANorthern America
RoWRest of the World
SHSocial housing
SO2Sulfur dioxide
tkmton-kilometer
UThermal transmittance
U.S.United States
WOWood
λCoefficient of thermal conductivity

References

  1. The World Bank. Total Population 2017. Available online: https://data.worldbank.org/indicator/SP.POP.TOTL?view=chart (accessed on 19 June 2019).
  2. MSCI. Results of the MSCI 2018 Annual Market Classification Review 2018. Available online: https://www.msci.com/market-classification (accessed on 19 June 2019).
  3. Valdivia, S.; Sonnemann, G.; Milà i Canals, L. LCA mainstreaming conditions in Latin America—based on learnings from 2005 to 2014. Int. J. Life Cycle Assess. 2017, 22, 485–491. [Google Scholar] [CrossRef]
  4. The World Bank. Urban Population 2017. Available online: https://data.worldbank.org/indicator/sp.urb.totl.in.zs (accessed on 19 June 2019).
  5. The World Bank. CO2 Emissions 2012. Available online: https://data.worldbank.org/indicator/en.atm.co2e.pc (accessed on 19 June 2019).
  6. The World Bank. Total Greenhouse Gas Emissions for 2012. Available online: https://data.worldbank.org/indicator/en.atm.ghgt.kt.ce (accessed on 19 June 2019).
  7. The World Bank. Electric Power Consumption 2014. Available online: https://data.worldbank.org/indicator/EG.USE.ELEC.KH.PC (accessed on 19 June 2019).
  8. The World Bank. Population Growth 2017. Available online: https://data.worldbank.org/indicator/SP.POP.GROW?view=chart (accessed on 19 June 2019).
  9. United Nations. Household Size and Composition 2018. Available online: https://population.un.org/Household/index.html#/countries/484 (accessed on 19 June 2019).
  10. Valdivia, S.; Suh, S.; Aldaya, M.; Sandoval, C.; Tonda, E. The State of Natural Resource Management in Latin America and the Caribbean. UNEP. 2014. Available online: https://www.oneplanetnetwork.org/sites/default/files/the_state_of_natural_resource_management_in_latin_america_and_the_caribbean.pdf (accessed on 19 June 2019).
  11. United Nations. Sustainable Development Goals 2016. Available online: https://www.un.org/sustainabledevelopment/sustainable-development-goals/ (accessed on 19 June 2019).
  12. Proyectos México. Crecimiento Económico. Available online: https://www.proyectosmexico.gob.mx/por-que-invertir-en-mexico/economia-solida/crecimiento-economico/ (accessed on 19 June 2019).
  13. INECC. Inventario Nacional de Emisiones de Gases y Compuestos de Efecto Invernadero 2015. Available online: https://www.gob.mx/inecc/acciones-y-programas/inventario-nacional-de-emisiones-de-gases-y-compuestos-de-efecto-invernadero (accessed on 10 January 2019).
  14. SENER. Balance Nacional de Energía 2017. Available online: https://www.gob.mx/cms/uploads/attachment/file/414843/Balance_Nacional_de_Energ_a_2017.pdf (accessed on 10 January 2019).
  15. Santoyo-Castelazo, E.; Stamford, L.; Azapagic, A. Environmental implications of decarbonising electricity supply in large economies: The case of Mexico. Energy Convers. Manag. 2014, 85, 272–291. [Google Scholar] [CrossRef]
  16. CMIC. Plan de Manejo de Residuos de la Construcción y la Demolición 2013. Available online: https://www.cmic.org.mx/comisiones/Sectoriales/medioambiente/Flayer/PM%20RCD%20Completo.pdf (accessed on 19 June 2019).
  17. IIUNAM. Residuos de Construcción y Demolición 2015. Available online: http://www.iingen.unam.mx/esmx/Publicaciones/GacetaElectronica/Febrero2015/Paginas/Residuosdeconstruccion.aspx (accessed on 19 June 2019).
  18. OECD. Municipal Waste 2019. Available online: https://data.oecd.org/waste/municipal-waste.htm (accessed on 19 June 2019).
  19. SEMARNAT. Residuos Sólidos Urbanos 2017. Available online: https://www.gob.mx/semarnat/acciones-y-programas/residuos-solidos-urbanos-rsu (accessed on 19 June 2019).
  20. Akhtar, A.; Sarmah, A.K. Construction and demolition waste generation and properties of recycled aggregate concrete: A global perspective. J. Clean. Prod. 2018, 186, 262–281. [Google Scholar] [CrossRef]
  21. De Souza-Marotta-Alfaia, R.G.; Moraes-Costa, A.; Carbonelli-Campos, J. Municipal solid waste in Brazil: A review. Waste Manag. Res. 2017, 35, 1195–1209. [Google Scholar] [CrossRef] [Green Version]
  22. Hoornweg, D.; Giannelli, N. Managing municipal solid waste in Latin America and the Caribbean: Integrating the private sector, harnessing incentives. Gridlines 2007, 28. Available online: https://openknowledge.worldbank.org/handle/10986/10639 (accessed on 19 June 2019).
  23. Sharholy, M.; Ahmad, K. Municipal solid waste management in Indian cities—A review. Waste Manag. 2008, 28, 459–467. [Google Scholar] [CrossRef] [PubMed]
  24. Mian, M.; Zeng, X.; Bin, N.; Al-Hamadani, S. Municipal solid waste management in China: A comparative analysis. J. Mater. Cycles Waste Manag. 2017, 19, 1127–1135. [Google Scholar] [CrossRef]
  25. Galvez-Martos, J.; Schoenberger, H. An analysis of the use of life cycle assessment for waste co-incineration in cement kilns. Resour. Conserv. Recycl. 2014, 86, 118–131. [Google Scholar] [CrossRef]
  26. Güereca, L.P.; Ochoa-Sosa, R.; Gilbert, H.E.; Suppen-Reynaga, N. Life cycle assessment in Mexico: Overview of development and implementation. Int. J. Life Cycle Assess. 2015, 20, 311–317. [Google Scholar] [CrossRef]
  27. Dante, R.C.; Güereca, L.P.; Neri, L.; Escamilla, J.L.; Aquino, L.; Celis, J. Life cycle analysis of hydrogen fuel: A methodology for a strategic approach of decision making. Int. J. Hydrog. Energy. 2002, 27, 131–133. [Google Scholar] [CrossRef]
  28. Suppen, N.; Carranza, M.; Huerta, M.; Hernández, M.A. Environmental management and life cycle approaches in the Mexican mining industry. J. Clean. Prod. 2006, 14, 1101–1115. [Google Scholar] [CrossRef]
  29. Güereca, L.P.; Torres, N.; Juárez-López, C.R. The co-processing of municipal waste in a cement kiln in Mexico. A life-cycle assessment approach. J. Clean. Prod. 2015, 107, 741–748. [Google Scholar] [CrossRef]
  30. Escalante-García, J.I.; Gómez-Azpeitia, G.; Arvizu-Piña, V.; Arena-Granados, P.; Valdez-Medina, E.A.; Argüello-Méndez, T.R.; Castañeda-Nolasco, G.; Jimenez-Albores, J.L.; Calderón-Vázquez, R.; Domínguez-Lepe, J.A.; et al. Análisis de Ciclo de Vida y Ecodiseño Para la Construcción en México, 1st ed.; Suppen, N., Ed.; Hábitat Sustentable, Universidad Autónoma de San Luis Potosí and CADIS: San Luis Potosí, Mexico, 2013. [Google Scholar]
  31. Arvizu-Piña, V.A.; Cuchí Burgos, A. Promoting sustainability in Mexico’s building sector via environmental product declarations. Int. J. Life Cycle Assess. 2017, 22, 1744–1759. [Google Scholar] [CrossRef]
  32. Cerón-Palma, I.; Sanyé-Mengual, E.; Oliver-Solà, J.; Montero, J.I.; Ponce-Caballero, C.; Rieradevall, J. Towards a green sustainable strategy for social neighbourhoods in Latin America: Case from social housing in Merida, Yucatan, Mexico. Habitat Int. 2013, 38, 47–56. [Google Scholar] [CrossRef]
  33. Cerón-Palma, I.; Sanyé-Mengual, E.; Oliver-Solà, J.; Montero, J.I.; Ponce-Caballero, C.; Rieradevall, J. Integrating LCA in the selection of strategies for reducing the energy demand in Mexican social housing. In Proceedings of the 5th International Conference on Life Cycle Assessment CILCA 2013, Mendoza, Argentina, 24–27 March 2013; pp. 234–238. [Google Scholar]
  34. Valdez, M.C.; Adler, I.; Barrett, M.; Ochoa, R.; Pérez, A. The Water-Energy-Carbon Nexus: Optimising rainwater harvesting in Mexico City. Environ. Process. 2016, 3, 307–323. [Google Scholar] [CrossRef]
  35. García-Montoya, M.; Sengupta, D.; Nápoles-Rivera, F.; Ponce-Ortega, J.M.; El-Halwagi, M.M. Environmental and economic analysis for the optimal reuse of water in a residential complex. J. Clean. Prod. 2016, 130, 82–91. [Google Scholar] [CrossRef]
  36. Saldaña-Márquez, H.; Gómez-Soberón, J.M.; Arredondo-Rea, S.P.; Gámez-García, D.C.; Corral-Higuera, R. Sustainable social housing: The comparison of the Mexican funding program for housing solutions and building sustainability rating systems. Build. Environ. 2018, 133, 103–122. [Google Scholar] [CrossRef]
  37. Arvizu-Piña, V.A.; Cuchí-Burgos, A.; Chargoy-Amador, J.P. A bottom-up approach for implementation of Environmental Product Declarations in Mexico’s housing sector. Int. J. Life Cycle Assess. 2019, 1–20. [Google Scholar] [CrossRef]
  38. Buyle, M.; Braet, J.; Audenaert, A. Life cycle assessment in the construction sector: A review. Renew. Sustain. Energy Rev. 2013, 26, 379–388. [Google Scholar] [CrossRef]
  39. CONAVI. Código de Edificación de Vivienda 2010. Available online: https://www.gob.mx/cms/uploads/attachment/file/85460/Codigo_de_Edificacion_de_Vivienda.pdf (accessed on 19 June 2019).
  40. CONAVI. Inventario de Vivienda Vigente Por Valor de la Vivienda. Available online: http://www.conavi.gob.mx:8080/Reports/Inv_Viv_Vig/Inv_x_TipViv.aspx (accessed on 11 January 2019).
  41. BMUB and DECC. Implementation of the New Housing NAMA Mexico, NAMA Facility 2014. Available online: https://www.nama-facility.org/fileadmin/user_upload/publications/factsheets/2014-07_factsheet_nama-facility_new-housing-mexico.pdf (accessed on 11 January 2019).
  42. CONAVI. Parque Habitacional. Available online: http://sniiv.beta.conavi.gob.mx/oferta/parque_habitacional.aspx (accessed on 11 January 2019).
  43. INEGI. Vivienda 2015. Available online: https://www.inegi.org.mx/temas/vivienda/default.html#Informacion_general (accessed on 19 June 2019).
  44. CONAVI. Características de las Viviendas Particulares Habitadas. Available online: http://www.conavi.gob.mx:8080/oferta/NumeroVivienda.aspx (accessed on 11 January 2019).
  45. Spanish Association for Standardization and Certification. UNE-EN 15804:2012+A1. Sustainability of Construction Works-Environmental Product Declarations. Core Rules for the Product Category of Construction Products; AENOR: Madrid, Spain, 2014. [Google Scholar]
  46. Lei, J.; Yang, J.; Yang, E.-H. Energy performance of building envelopes integrated with phase change materials for cooling load reduction in tropical Singapore. Appl. Energy 2016, 162, 207–217. [Google Scholar] [CrossRef]
  47. Han, B.; Wang, R.; Yao, L.; Liu, H.; Wang, Z. Life cycle assessment of ceramic façade material and its comparative analysis with three other common façade materials. J. Clean. Prod. 2015, 99, 86–93. [Google Scholar] [CrossRef]
  48. Islam, H.; Jollands, M.; Setunge, S.; Haque, N.; Bhuiyan, M.A. Life cycle assessment and life cycle cost implications for roofing and floor designs in residential buildings. Energy Build. 2015, 104, 250–263. [Google Scholar] [CrossRef]
  49. Alshamrani, O.S. Life cycle assessment of low-rise office building with different structure-envelope configurations. Can. J. Civ. Eng. 2016, 43, 193–200. [Google Scholar] [CrossRef]
  50. Radhi, H.; Sharples, S. Global warming implications of facade parameters: A life cycle assessment of residential buildings in Bahrain. Environ. Impact Assess. Rev. 2013, 38, 99–108. [Google Scholar] [CrossRef]
  51. Ortiz, O.; Pasqualino, J.C.; Díez, G.; Castells, F. The environmental impact of the construction phase: An application to composite walls from a life cycle perspective. Resour. Conserv. Recycl. 2010, 54, 832–840. [Google Scholar] [CrossRef]
  52. Ferrández-García, A.; Ibáñez-Forés, V.; Bovea, M.D. Eco-efficiency analysis of the life cycle of interior partition walls: A comparison of alternative solutions. J. Clean. Prod. 2016, 112, 649–665. [Google Scholar] [CrossRef]
  53. Huberman, N.; Pearlmutter, D. A life-cycle energy analysis of building materials in the Negev desert. Energy Build. 2008, 40, 837–848. [Google Scholar] [CrossRef]
  54. Pal, S.K.; Takano, A.; Alanne, K.; Palonen, M.; Siren, K. A multi-objective life cycle approach for optimal building design: A case study in Finnish context. J. Clean. Prod. 2017, 143, 1021–1035. [Google Scholar] [CrossRef]
  55. Cuéllar-Franca, R.M.; Azapagic, A. Environmental impacts of the UK residential sector: Life cycle assessment of houses. Build. Environ. 2012, 54, 86–99. [Google Scholar] [CrossRef]
  56. Zabalza-Bribián, I.; Aranda-Usón, A.; Scarpellini, S. Life cycle assessment in buildings: State-of-the-art and simplified LCA methodology as a complement for building certification. Build. Environ. 2009, 44, 2510–2520. [Google Scholar] [CrossRef]
  57. Diario Oficial de la Federación. Norma Oficial Mexicana NOM-020-ENER-2011. Eficiencia Energética en Edificaciones. Envolvente de Edificios Para uso Habitacional; DOF: Mexico City, Mexico, 2011. Available online: http://dof.gob.mx/nota_detalle.php?codigo=5203931&fecha=09/08/2011 (accessed on 19 June 2019).
  58. Birgisdottir, H.; Moncaster, A.; Houlihan-Wiberg, A.; Chae, C.; Yokoyama, K.; Balouktsi, M.; Seo, S.; Oka, T.; Lützkendorf, T.; Malmqvist, T. Replication Studies paper IEA EBC annex 57 ‘evaluation of embodied energy and CO2eq for building construction’. Energy Build. 2017, 154, 72–80. [Google Scholar] [CrossRef]
  59. CYPE. Home Page of CYPELATAM 2017. Available online: http://www.cypelatam.com/ (accessed on 19 June 2019).
  60. Ecoinvent Centre. Home Page of Ecoinvent 2014. Available online: https://www.ecoinvent.org/database/introduction-to-ecoinvent-3/introduction-to-ecoinvent-version-3.html (accessed on 19 June 2019).
  61. Escamilla-Alvarado, C.; Poggi-Varaldo, H.M.; Ponce-Noyola, M.T. Bioenergy and bioproducts from municipal organic waste as alternative to landfilling: A comparative life cycle assessment with prospective application to Mexico. Environ. Sci. Pollut. Res. 2017, 24, 25602–25617. [Google Scholar] [CrossRef] [PubMed]
  62. Lares-Orozco, M.F.; Robles-Morúa, A.; Yepez, E.A.; Handler, R.M. Global warming potential of intensive wheat production in the Yaqui Valley, Mexico: A resource for the design of localized mitigation strategies. J. Clean. Prod. 2016, 127, 522–532. [Google Scholar] [CrossRef]
  63. Vargas, A.V.; Zenón, E.; Oswald, U.; Islas, J.M.; Güereca, L.P.; Manzini, F.L. Life cycle assessment: A case study of two wind turbines used in Mexico. Appl. Therm. Eng. 2015, 75, 1210–1216. [Google Scholar] [CrossRef]
  64. Gavilán-García, I.C.; Fernández-Villagomez, G.; Gavilán-García, A.; Alcántara-Concepcion, V. Alternatives of management and disposal for mercury thermometers at the end of their life from Mexican health care institutions. J. Clean. Prod. 2015, 86, 118–124. [Google Scholar] [CrossRef]
  65. Diario Oficial de la Federación. Norma Oficial Mexicana NOM-012-SCT-2-2017, Sobre el Peso y Dimensiones Máximas con los que Pueden Circular los Vehículos de Autotransporte que Transitan en las vías Generales de Comunicación de Jurisdicción Federal; DOF: Mexico City, Mexico, 2017; Available online: https://www.dof.gob.mx/nota_detalle.php?codigo=5508944&fecha=26/12/2017 (accessed on 19 June 2019).
  66. Gámez-García, D.C.; Gómez-Soberón, J.M.; Corral-Higuera, R.; Saldaña-Márquez, H.; Gómez-Soberón, M.C.; Arredondo-Rea, S.P. A cradle to handover life cycle assessment of external walls: Choice of materials and prognosis of elements. Sustainability 2018, 10, 2748. [Google Scholar] [CrossRef]
  67. Gámez-García, D.C.; Saldaña-Márquez, H.; Gómez-Soberón, J.M.; Corral-Higuera, R.; Arredondo-Rea, S.P. Life cycle assessment of residential streets from the perspective of favoring the human scale and reducing motorized traffic flow. From cradle to handover approach. Sustain. Cities Soc. 2019, 44, 332–342. [Google Scholar] [CrossRef]
  68. Huedo, P.; Mulet, E.; López-Mesa, B. A model for the sustainable selection of building envelope assemblies. Environ. Impact Assess. Rev. 2016, 57, 63–77. [Google Scholar] [CrossRef] [Green Version]
  69. Kellenberger, D.; Althaus, H.-J. Relevance of simplifications in LCA of building components. Build. Environ. 2009, 44, 818–825. [Google Scholar] [CrossRef]
  70. Broun, R.; Menzies, G.F. Life cycle energy and environmental analysis of partition wall systems in the UK. Procedia Eng. 2011, 21, 864–873. [Google Scholar] [CrossRef]
  71. Thiers, S.; Peuportier, B. Energy and environmental assessment of two high energy performance residential buildings. Build. Environ. 2012, 51, 276–284. [Google Scholar] [CrossRef]
  72. Guggemos, A.A.; Horvath, A. Comparison of environmental effects of steel- and concrete-framed buildings. J. Infrastruct. Syst. 2005, 11, 93–101. [Google Scholar] [CrossRef]
  73. Concretos Reciclados. Home Page of Concretos Reciclados 2019. Available online: http://www.concretosreciclados.com.mx/ (accessed on 19 June 2019).
  74. Diario Oficial de la Federación. Norma Oficial Mexicana NOM-161-SEMARNAT-2011, Que Establece los Criterios Para Clasificar a los Residuos de Manejo Especial y Determinar Cuáles Están Sujetos a Plan de MANEJO; el Listado de los Mismos, el Procedimiento para la Inclusión o Exclusión a Dicho Listado; así Como los Elementos y Procedimientos para la Formulación de los Planes de Manejo; DOF: Mexico City, Mexico, 2013. Available online: http://www.dof.gob.mx/nota_detalle.php?codigo=5286505&fecha=01/02/2013 (accessed on 19 June 2019).
  75. Wen, T.J.; Siong, H.C.; Noor, Z.Z. Assessment of embodied energy and global warming potential of building construction using life cycle analysis approach: Case studies of residential buildings in Iskandar Malaysia. Energy Build. 2015, 93, 295–302. [Google Scholar] [CrossRef]
  76. Vilčeková, S.; Čuláková, M.; Burdová, E.K.; Katunská, J. Energy and environmental evaluation of non-transparent constructions of building envelope for wooden houses. Energies 2015, 8, 11047–11075. [Google Scholar] [CrossRef]
  77. Aye, L.; Ngo, T.; Crawford, R.H.; Gammampila, R.; Mendis, P. Life cycle greenhouse gas emissions and energy analysis of prefabricated reusable building modules. Energy Build. 2012, 47, 159–168. [Google Scholar] [CrossRef]
  78. Sandanayake, M.; Lokuge, W.; Zhang, G.; Setunge, S.; Thushar, Q. Greenhouse gas emissions during timber and concrete building construction—A scenario based comparative case study. Sustain. Cities Soc. 2018, 38, 91–97. [Google Scholar] [CrossRef]
  79. Chang, Y.; Ries, R.J.; Lei, S. The embodied energy and emissions of a high-rise education building: A quantification using process-based hybrid life cycle inventory model. Energy Build. 2012, 55, 790–798. [Google Scholar] [CrossRef]
  80. Gardezi, S.S.S.; Shafiq, N.; Zawawi, N.A.W.A.; Khamidi, M.F.; Farhan, S.A. A multivariable regression tool for embodied carbon footprint prediction in housing habitat. Habitat Int. 2016, 53, 292–300. [Google Scholar] [CrossRef]
  81. Jang, M.; Hong, T.; Ji, C. Hybrid LCA model for assessing the embodied environmental impacts of buildings in South Korea. Environ. Impact Assess. Rev. 2015, 50, 143–155. [Google Scholar] [CrossRef]
  82. Fouquet, M.; Levasseur, A.; Margni, M.; Lebert, A.; Lasvaux, S.; Souyri, B.; Buhé, C.; Woloszyn, M. Methodological challenges and developments in LCA of low energy buildings: Application to biogenic carbon and global warming assessment. Build. Environ. 2015, 90, 51–59. [Google Scholar] [CrossRef]
  83. Rossi, B.; Marique, A.F.; Glaumann, M.; Reiter, S. Life-cycle assessment of residential buildings in three different European locations, basic tool. Build. Environ. 2012, 51, 395–401. [Google Scholar] [CrossRef]
  84. Asif, M.; Muneer, T.; Kelley, R. Life cycle assessment: A case study of a dwelling home in Scotland. Build. Environ. 2007, 42, 1391–1394. [Google Scholar] [CrossRef]
  85. Abeysundra, U.G.Y.; Babel, S.; Gheewala, S.; Sharp, A. Environmental, economic and social analysis of materials for doors and windows in Sri Lanka. Build. Environ. 2007, 42, 2141–2149. [Google Scholar] [CrossRef]
  86. Venkatarama Reddy, B.V.; Jagadish, K.S. Embodied energy of common and alternative building materials and technologies. Energy Build. 2003, 35, 129–137. [Google Scholar] [CrossRef]
  87. Damtoft, J.S.; Lukasik, J.; Herfort, D.; Sorrentino, D.; Gartner, E.M. Sustainable development and climate change initiatives. Cem. Concr. Res. 2008, 38, 115–127. [Google Scholar] [CrossRef]
  88. Bustillo-Revuelta, M. Hormigones y Morteros; Fueyo Editores: Madrid, Spain, 2008; pp. 104–166. ISBN 978-84-935279-1-4. [Google Scholar]
  89. Iyer-Raniga, U.; Wong, J.P.C. Evaluation of whole life cycle assessment for heritage buildings in Australia. Build. Environ. 2012, 47, 138–149. [Google Scholar] [CrossRef]
  90. CTE WEB. Código Técnico la Edificación. 2007. Available online: http://cte-web.iccl.es (accessed on 8 May 2019).
  91. Cai, G.; Noguchi, T.; Degée, H.; Zhao, J.; Kitagaki, R. Volcano-related materials in concretes: A comprehensive review. Environ. Sci. Pollut. Res. 2016, 23, 7220–7243. [Google Scholar] [CrossRef]
  92. Häfliger, I.F.; John, V.; Passer, A.; Lasvaux, S.; Hoxha, E.; Saade, M.R.M.; Habert, G. Buildings environmental impacts’ sensitivity related to LCA modelling choices of construction materials. J. Clean. Prod. 2017, 156, 805–816. [Google Scholar] [CrossRef]
  93. Iddon, C.R.; Firth, S.K. Embodied and operational energy for new-build housing: A case study of construction methods in the UK. Energy Build. 2013, 67, 479–488. [Google Scholar] [CrossRef]
  94. Gustavsson, L.; Joelsson, A. Life cycle primary energy analysis of residential buildings. Energy Build. 2010, 42, 210–220. [Google Scholar] [CrossRef]
  95. Goggins, J.; Keane, T.; Kelly, A. The assessment of embodied energy in typical reinforced concrete building structures in Ireland. Energy Build. 2010, 42, 735–744. [Google Scholar] [CrossRef]
  96. CADIS. Software Mexicaniuh. Available online: http://mexicaniuh.net/CadisBootstrap/mexicaniuh.php (accessed on 17 July 2019).
Figure 1. National inventory of greenhouse gas emissions and compounds. Data from: [13].
Energies 12 02837 g001
Figure 2. (a) National energy consumption: 9249.75 PJ; (b) Total energy consumption: 5362.8 PJ. Data from: [14].
Energies 12 02837 g002
Figure 3. Nomenclature and elements of the options analyzed.
Energies 12 02837 g003
Figure 4. Cross section of basic characteristics of the structure.
Energies 12 02837 g004
Figure 5. Social housing area, dimensions of doors and windows, and configuration of the exterior and interior walls.
Energies 12 02837 g005
Figure 6. The life cycle of SH in Mexico.
Energies 12 02837 g006
Figure 7. Percentage of environmental damage generated by each stage analyzed in the entire life cycle for: (a) PE-AL, (b) PE-PV, (c) PE-WO, (d) PU-AL, (e) PU-PV and, (f) PU-WO.
Energies 12 02837 g007
Figure 8. Environmental damage generated by each stage analyzed of the six alternatives of SH in the four impact categories: (a) GWP, (b) CED, (c) ADP and, (d) HTP.
Energies 12 02837 g008
Figure 9. GWP, CED (Re), and CED (n-Re) caused at each stage of the SH: (a) A1 to A5, (b) B2, B4 and, (c) C1, C2, C4.
Energies 12 02837 g009
Table 1. Global basic indicators. Data from: [1,4,5,6,7,8,9].
Country/RegionTotal Population (People) [1]Urban Population (%) [4]CO2 Emissions (%) [5]CO2 eq Emissions (%) [6]Energy Consumption (kwh/Capita) [7]Population Growth (Annual %) [8]Household Size (People) [9]
China1,386,395,0005828.2723.2739270.63.4
India1,339,180,127345.695.618051.14.6
U.S325,719,1788214.4311.8512,9840.72.5
EU512,461,290759.858.7859080.2-
LAC644,137,666805.2110.7421291.0-
World7,530,360,14955100100.0031271.2-
Table 2. Basic indicators in LAC. Data from: [1,4,5,6,7,8,9].
Country/RegionTotal Population (People) [1]Urban Population (%) [4]CO2 Emissions (%) [5]CO2 eq Emissions (%) [6]Energy Consumption (kwh/Capita) [7]Population Growth 6 (Annual %) [8]Household Size (People) [9]
Argentina44,271,0419210.76.630521.03.3
Brazil209,288,2788627.752.026010.83.3
Chile18,054,726874.32.139120.83.6
Colombia49,065,615804.43.012900.83.5
Mexico129,163,2768025.111.520901.33.7
Peru32,165,485783.21.313081.23.8
LAC644,137,6668010010021291.0-
Table 3. National inventory of greenhouse emissions and compounds. Data from: [13].
CategoryNet Emissions Gg CO2 eqTotal Emissions Gg CO2 eq
1 Energy480,878.831480,878.831
2 Industrial processes and use of products54,111.76154,111.761
3 Agriculture, forestry and other land uses−46,286.569102,059.499
4 Residues45,909.01045,909.010
Total534,613.033682,959.101
Table 4. CDW and MSW. Data from: [18,20,21,22,23,24].
CountryCDW [20]MSWMSW
Region(t/Year)(t/Year)(kg/Capita.Year)
Brazil70,000,00079,900,000 [21]382 [21]
China1,130,000,000328,922,214 [24]237 [24]
India530,000,00090,000,000 [23]67 [23]
México12,000,00044,432,167 [18]344 [18]
U.S.519,000,000240,380,753 [18]738 [18]
EU830,000,000247,518,803 [18]483 [18]
LAC-131,000,000 [22]203 [22]
World3,000,000,0001,300,000,000 [24]173 [24]
Table 5. Inventory of materials of the product stage.
ElementMaterialQuantityEcoinvent Dataset1
StructureConcrete (m3)13.8Concrete production 20 MPa, RNA only, RoW
Steel (kg)975.4Reinforcing steel production, RoW
EPS (kg)193.1Polystyrene foam slab production, RoW
Block (kg)1869.0Concrete block production, RoW
Mortar (kg)211.8Cement mortar production, RoW
Water (m3)0.05Tap water production, conventional treatment, RoW
Ceramic tile (kg)776.3Ceramic tile production, RoW
Cement (kg)316.9Cement production, Portland, RoW
Plaster (kg)633.8Stucco production, RoW
DoorsExterior doors (m2)3.8Door production, outer, wood-glass, RoW
Interior doors (m2)5.5Door production, inner, wood, RoW
PE wallBlock 12 × 20 × 40 (kg)12,199.5Concrete block production, RoW
Mortar (kg)6638.5Cement mortar production, RoW
Water (m3)0.3Tap water production, conventional treatment, RoW
Expanded perlite (kg)196.8Expanded perlite production, RoW
Vinyl paint (kg)24.3Alkyd paint production, white, water-based, product in 60% solution state, RoW
PU wallPumice block (kg)8155.9Lightweight concrete block production, pumice, RoW
Water (m3)0.3Tap water production, conventional treatment, RoW
Mortar (kg)6941.9Cement mortar production, RoW
Vinyl paint (kg)19.7Alkyd paint production, white, water-based, product in 60% solution state, RoW
WindowsAluminum-window (m2)0.8Market for window frame, aluminum, U = 1.6 W/m2K, GLO 2
PVC-window (m2)0.8Market for window frame, poly vinyl chloride, U = 1.6 W/m2K, GLO 2
Wood-window (m2)0.8Market for window frame, wood, U = 1.5 W/m2K, GLO 2
Glazing 3 mm (kg)2.4Market for glazing, double, U < 1.1 W/m2K, GLO
1 RNA: Northern America; RoW: Rest of the World; GLO: Global. 2 Its characteristics correspond to a window with measurements of 1.6 × 1.3 m, with frame visible area ≈ 0.5 m2, and U value of 1.6 W/m2K, weight per m2 of frame visible area of 50.7 kg for aluminum, 94.5 kg for PVC and, 80.2 kg for wood.
Table 6. Inventory of processes of transport from factory to site (A4).
ProcessPE-ALPE-PVPE-WOPU-ALPU-PVPU-WOEcoinvent Dataset
Lorry operation (tkm)345434553455314131423142Transport, freight, lorry 7.5–16 metric ton, EURO4
Table 7. Inventory of materials/processes of the construction process (A5).
ElementMaterial/ProcessUse TimeEcoinvent Dataset 1
Formwork of the structureSteel (kg)37.51Reinforcing steel production, RoW
Wood (m3)0.23Sawnwood production, softwood, kiln dried, planed, RoW
PE alternativesPotency less than 18 kW (h)8.73Machine operation, diesel, <18.64 kW, steady-state, GLO
Potency greater than 75 kW (h)1.76Machine operation, diesel, ≥74.57 kW, steady-state, GLO
PU alternativesPotency less than 18 kW (h)9.01Machine operation, diesel, <18.64 kW, steady-state, GLO
Potency greater than 75 kW (h)1.76Machine operation, diesel, ≥74.57 kW, steady-state, GLO
1 RoW: Rest of the World; GLO: Global.
Table 8. Maintenance intervals and replacement cycles for SH elements. Data from: [54,55,68,69,70,71,72].
ElementUseful Life (Years)Activity MaintenanceMaintenance CycleReplacement Cycle
Reinforced concrete structure50 [68]---
External and internal walls >50 [69,70]---
Ceramic tiles50 [68]---
Interior and exterior doors30 [55,71]Paint every 10 years [54]31
Windows30 [54]Paint every 10 years [54]31
Vinyl paint5 [72]Paint every 5 years9-
Table 9. Inventory of materials/processes of maintenance and replacement.
StageElementQuantityEcoinvent Dataset
B2Paint doors (kg)5.94Alkyd paint production, white, water-based, product in 60% solution state, RoW1
Paint windows WO (kg)0.52Alkyd paint production, white, water-based, product in 60% solution state, RoW1
Paint walls (kg)218.25Alkyd paint production, white, water-based, product in 60% solution state, RoW1
Transport for WO (PE/PU, tkm)8.99Transport, freight, lorry 7.5–16 metric ton, EURO4
Transport for AL-PV (PE/PU, tkm)8.97Transport, freight, lorry 7.5–16 metric ton, EURO4
B4Exterior doors (m2)3.8Door production, outer, wood-glass, RoW1
Interior doors (m2)5.5Door production, inner, wood, RoW1
Aluminum windows (m2)0.8Market for window frame, aluminum, U = 1.6 W/m2K, GLO1
PVC windows (m2)0.8Market for window frame, poly vinyl chloride, U = 1.6 W/m2K, GLO1
Wood windows (m2)0.8Market for window frame, wood, U = 1.5 W/m2K, GLO1
Glazing 3 mm (kg)2.4Market for glazing, double, U < 1.1 W/m2K, GLO1
1 RoW: Rest of the World; GLO: Global.
Table 10. Inventory of materials/processes of the end of life. Data from: [60].
StageProcessQuantityEcoinvent Dataset
C1Use time PE alternatives (h)187.54Machine operation, diesel, <18.64 kW, steady-state, GLO1
Use time PU alternatives (h)185.33Machine operation, diesel, <18.64 kW, steady-state, GLO1
C2Lorry operation PE-AL (tkm)3477.44Transport, freight, lorry 7.5–16 metric ton, EURO4
Lorry operation PE-PV (tkm)3479.56Transport, freight, lorry 7.5–16 metric ton, EURO4
Lorry operation PE-WO (tkm)3478.87Transport, freight, lorry 7.5–16 metric ton, EURO4
Lorry operation PU-AL (tkm)3241.22Transport, freight, lorry 7.5–16 metric ton, EURO4
Lorry operation PU-PV (tkm)3243.34Transport, freight, lorry 7.5–16 metric ton, EURO4
Lorry operation PU-WO (tkm)3242.64Transport, freight, lorry 7.5–16 metric ton, EURO4
C4Inert waste PE-AL (kg)57,319.06Treatment of inert waste, inert material landfill, RoW1,2
Inert waste PE-PV (kg)57,957.34Treatment of inert waste, inert material landfill, RoW1,2
Inert waste PE-WO (kg)57,992.62Treatment of inert waste, inert material landfill, RoW1,2
Inert waste PU-AL (kg)54,020.30Treatment of inert waste, inert material landfill, RoW1,2
Inert waste PU-PV (kg)54,055.59Treatment of inert waste, inert material landfill, RoW1,2
Inert waste PU-WO (kg)54,044.07Treatment of inert waste, inert material landfill, RoW1,2
1 RoW: Rest of the World; GLO: Global. 2 Module Treatment of inert waste, inert material landfill, RoW, contains exchanges to process-specific burdens (energy, land use) and infrastructure.
Table 11. Impacts generated by the SH in stages A, B, and C.
Impact Category1PE-ALPE-PVPE-WOPU-ALPU-PVPU-WOAVERAGE
ABCABCABCABCABCABCABC
GWP13.32.51.713.02.21.712.92.11.713.32.51.613.02.21.612.92.11.613.12.31.7
EE1705435167513516853351645434161513416253341655334.4
ADP73.719.615.671.917.815.670.916.915.671.319.614.969.417.814.968.516.914.971.018.115.3
HTP7.92.70.56.81.60.56.81.60.57.62.70.56.61.60.56.51.60.57.02.00.5
1 GWP: t CO2 eq; EE: GJ eq; ADP: kg antimony eq; HTP: t 1,4-DCB-Eq.
Table 12. kg CO2 eq and MJ eq generated by 1 m2 of building in stages A, B and C. Data from: [48,49,78,93,94,95].
kg CO2 eq/m2MJ eq/m2
StudyDatabaseBuilding TypeLocationABCABC
Current studyecoinvent 3.4Detached houseMexico309544039111251815
Iddon et al. [93]ICE 2.0Detached houseUK296-----
Islam et al. [48]AusLCIAttached houseAustralia25764-37431257-
Othman et al. [49]AthenaOffice buildingU.S.48077127559711332030
Goggins et al. (floor slab) [95]BibliographyOffice buildingIreland211--1167--
Gustavsson et al. [94]ENSYSTResidential buildingSweden---3569-159
Sandanyake et al. [78]AGGA/AlcornCommercial buildingAustralia524-----
Table 13. Gg CO2 eq and PJ eq generated annually by the construction of housing in Mexico.
HousingAreaGg CO2 eq/m2PJ eq/m2Annual Housing ConstructionGg CO2 eq/m2PJ eq/m2
Economic30.009284.30117,318.5066,000.00612.767.74
Popular42.5013,152.75166,201.21282,000.003709.0846.87
Traditional62.5019,342.28244,413.55180,000.003481.6143.99
Medium97.5030,173.96381,285.1324,000.00724.189.15
Residential145.0044,874.09567,039.4324,000.001076.9813.61
Residential +225.0069,632.22879,888.7724,000.001671.1721.12
Total 600,000.0011,275.78142.48
Table 14. GHGs and energy of the residential sector necessary for the construction of housing (A1 to A5) and its operational energy (B6). Data from [13,14].
Impacts of Residential Sector in Mexico (Stage)QuantityNational Representativeness
Emissions Gg CO2 eq (A1 to A5)11,275.82.1% 11.7% 2
Emissions Gg CO2 eq (B6) [13]21,279.94.0% 13.1% 2
Net emissions Gg CO2 eq [13]534,613.0
Total emissions Gg CO2 eq [13]682,959.0
Energy consumption PJ eq (A1 to A5)142.52.7%
Energy consumption PJ eq (B6) [14]751.614.0%
Total energy consumption PJ eq [14]5362.8
1 Considering net emissions. 2 Considering total emissions.

