Analysis of Battery Reduction for an Improved Opportunistic Wireless-Charged Electric Bus


1
School of Automotive and Transportation Engineering, Hefei University of Technology, Hefei 230009, China
2
National and Local Union Research Center for Automotive Technology &Equipment Engineering, Hefei University of Technology, Hefei 230009, China
*
Author to whom correspondence should be addressed.
Energies 2019, 12(15), 2866; https://doi.org/10.3390/en12152866
Submission received: 11 June 2019
/
Revised: 22 July 2019
/
Accepted: 23 July 2019
/
Published: 25 July 2019
(This article belongs to the Special Issue Intelligent Wireless Power Transfer System and Its Application)
Abstract
:As an attractive alternative to the traditional plug-in charged electric vehicles (EVs), wireless-charged EVs have recently been in the spotlight. Opportunistically charged utilizing the wireless-charging infrastructure installed under the road at bus stops, an electric bus can have a smaller and lighter battery pack. In this paper, an improved opportunistic wireless-charging system (OWCS) for electric bus is introduced, which includes the opportunistic stationary wireless-charging system (OSWCS) and opportunistic hybrid wireless-charging system (OHWCS) consisting of stationary wireless-charging and dynamic wireless-charging. A general battery reduction model is established for the opportunistic wireless-charged electric bus (OWCEB). Two different battery-reduction models are built separately for OWCEB on account of the characteristics of OSWCS and OHWCS. Additionally, the cost saving models including the production cost saving, the operation cost saving and total cost saving are established. Then, the mathematical models are demonstrated with a numerical example intuitively. Furthermore, we analyze several parameters that influence the effectiveness of battery reduction due to the application of an opportunistic wireless-charging system on an electric bus. Finally, some points worth discussing in this work are performed.
1. Introduction
With the growing severity of environmental problem and energy shortage, electric vehicles (EVs) have been deemed as alternatives to the internal combustion engine vehicles [1,2,3]. However, the short driving range, long recharging time and limited charging stations have become obstacles to the rapid development of EVs. In order to achieve the same operating range as an internal combustion engine vehicle, it is necessary for a pure EV to be equipped with a big and heavy battery. One of the biggest challenges for the popularization of EVs is to make a breakthrough in the electricity storage technology [1]. Lithium-ion batteries are considered as a better solution to possibly meet all conditions for a pure EV due to their properties of high energy and power density [4,5,6,7]. However, the gravimetric energy density of the commercialized lithium-ion battery pack is only 0.11–0.16 kWh/kg, which is not quite satisfactory. Moreover, the cost of the lithium-ion battery pack is still quite high nowadays. It is about 400$/kWh in 2018. The cost of a lithium-ion battery pack is about 25–30% of the cost of an electric car [8]. For a pure electric bus, a larger and heavier battery is indispensable obviously, which is bound to lead to higher costs. The lithium iron phosphate battery cost is 39% of the total cost of a pure electric bus [9].
Fortunately, as a novel charging method, wireless power transfer (WPT) technology has been applied on electric vehicles to make up for the inherent defects above of the battery-powered vehicles [10,11,12,13]. Additionally, avoiding the hazards of a tripping, arc or being electrocuted mentioned in [14,15], wireless chargers are more convenient, dependable, and safer than traditional plug-in chargers [16,17]. The WPT technology applied on EVs can be classified into stationary WPT and dynamic WPT [18,19] according to different working modes. For the stationary WPT system, the wireless-charging infrastructure can be deployed at the parking lots, garages or traffic signals where EVs are in stationary modes and can be charged wirelessly. For the dynamic WPT system, the power track is installed underneath the road surface where EVs can be charged in motion.
In particular, applying wireless charging technology on electric transit bus is easier to implement because the buses usually run follow regular routes. The biggest obstacle to electric buses can be overcome if WPT technology is applied.
On one hand, this allows smaller and lighter batteries to be used on electric buses due to the frequent charging using the wireless-charging infrastructure embedded under road [20,21,22,23]. As a result, not only the battery cost can be saved on significantly, but also the energy consumption rate can be reduced to some extent which will lead to less operation cost. In [24], it was concluded that it is possible to reduce the battery mass of the plug-in charged electric bus by two-thirds if stationary wireless charging is used.
On the other hand, the driving range of an electric bus will be extended if WPT technology is applied. According to a study by the Center for Energy, Transportation and the Environment at the University of Tennessee at Chattanooga aimed at increasing the range of an electric bus, after it was charged for one-minute’s duration at 60 kilowatts the electric bus can run one mile approximately. As a result, the driving range of an electric bus can be increased from less than 50 miles on batteries alone to more than 120 miles due to the application of WPT technology [25]. If more wireless-charging infrastructure is deployed, the electric bus can travel farther theoretically.
A dynamic wireless-charging system, developed for the shuttle buses at the Korean Advanced Institute of Science and Technology campus, has been operating since 2012 [26]. An optimal system design of the online electric vehicle (OLEV) utilizing WPT technology is presented in order to balance the battery capacity and the allocation of the power transmitters [27]. An economic analysis based on OLEV is also presented using a mathematical optimization model [20,28]. The benefits of the OLEV-based electric transit bus system are analyzed from the energy logistics perspective which is of great significance to the commercialization and layout of the electric bus system using wireless-charging technology [22]. Additionally, considering the city running cycle data and different charging power levels, the potential battery reduction and driving range extension contributed by opportunistic wireless charging were investigated in [29], which shows that the battery reduction from 6% to 85% or the range extension between 7% and 600% are possible.
However, most research about the impact of wireless-charging technology on an electric bus are conducted on a system level. The mathematical model of the battery mass/energy reduction and its influence factors are out their scope.
In this paper, the improved opportunistic wireless-charging system (OWCS) for an electric bus we introduce includes the opportunistic stationary wireless-charging system (OSWCS) and the opportunistic hybrid wireless-charging system (OHWCS), consisting of stationary wireless charging and dynamic wireless charging. Utilizing the OSWCS, the buses can be charged while loading and unloading passengers at bus stops. Utilizing the OHWCS, the buses can be charged while not only loading and unloading passengers, but also passing though the power tracks installed near bus stops.
We aim to answer the following research questions with the proposed OWCS for the electric bus.
- How much battery energy capacity and mass of the electric bus can be reduced by using a wireless-charging system, compared with a plug-in charging system?
- How much cost can be saved due to the battery reduction?
- What are the effects of the key parameters on the battery reduction of the opportunistic wireless-charged electric bus?
The rest of this paper is organized as following. The battery reduction models and cost saving models of the electric bus due to the application of the opportunistic wireless-charging system are presented in Section 2. A numerical example of the models built in Section 2 is studied in Section 3. The parameters that influence the effectiveness of the battery reduction and cost saving are also analyzed in Section 3. Then, some points worth discussing in this work are performed in Section 4. The conclusion is summarized in Section 5.
2. The Battery-Reduction Models and Cost-Saving Models of the Improved Opportunistic Wireless-Charged Electric Bus
2.1. System Architecture
The typical operating environment of a conventional plug-in charged electric bus is given as following. The bus carries passengers from one stop to the next, circulating Nc cycles on a fixed circle route. The number of stops of the round trip is Ns, including starting station and terminal station. The total length of the circular route is L (km). Some other parameters of the plug-in charged electric bus are defined as following. MBus (kg) is the mass of the plug-in charged electric bus. M (kg) and E (kWh) are the mass and energy capacity of the battery, respectively. b (kWh/km) is the energy consumption rate of the electric bus.
Additionally, EH (kWh) and EL (kWh), as shown in Equation (1), are the high and low limits of the battery level, respectively. Usually given by the battery provider, the upper and lower limit coefficients, i.e., λH and λL are set to maximize the battery life.
EE (kWh) is defined as the effective battery energy capacity and expressed as Equation (2).
where,
Furthermore, it is assumed that the battery is always charged to EH overnight, and consumed to EL at the end of daily duty. Therefore, the effective battery energy capacity (EE) is also the energy which the electric bus consumed in daily duty, as shown in Equation (3).
when it comes to the opportunistic wireless-charged electric bus, the following assumptions should be satisfied:
- The operating environment of the wireless-charged electric bus is same as that of the conventional plug-in charged electric bus mentioned above.
- The bus is also same as the conventional plug-in charged electric bus, except the battery and pickup device.
- Each station is equipped with wireless-charging infrastructure.
As shown in Figure 1, the diagram illustrates a typical wireless-charging system for electric bus. It mainly consists of: (1) the power converters; (2) the compensation networks; (3) the transmitting coil/track and receiving device and (4) the controllers.
2.2. Battery-Reduction Models of the Improved Opportunistic Wireless-Charged Electric Bus (OWCEB)
As can be seen from the above, the opportunistic wireless-charged electric bus can receive “opportunistic charges” frequently from the wireless-charging infrastructures installed at/near the stops, where the bus stops to load/unload passengers. Em,n (kWh) is defined as the amount of energy supplied by the nth stop of the mth cycle. So, after Nc cycles, the total amount of energy supplied by wireless-charging systems (ΔEWPT, kWh) can be expressed as Equation (4):
Intuitively, the battery energy of an OWCEB is ΔEWPT less than that of a plug-in charged electric bus. However, the less battery energy the OWCEB needs, the less mass the battery possesses. As a consequence, travelling the same distance, the bus will consume less energy. Therefore, the energy of the battery can be further reduced due to the mass reduction. The less energy consumed, the less battery mass required, and the less battery mass required, the less energy consumed. This forms an infinite iteration [24]. The mathematical model is established as following.
For the ith iteration (i = 1, 2, 3, …), ΔEi (kWh) battery energy reduction will lead to ΔMi (kg) battery mass reduction, which can be expressed as Equation (5):
Then, the apparent energy consumption rate bi of the ith iteration can be described as a function of the mass of the bus, as expressed in Equation (6).
Therefore, it is reasonable to derive the relationship between the apparent energy consumption rate variation (Δbi, kWh/km) and the battery pack mass reduction of the ith iteration as Equation (7):
If the length of one drive cycle is L (km), then the following Equation (8) can be obtained.
So, the battery reduction, which refers to the energy capacity and mass reductions, due to the application of the wireless-charging system on an electric bus, ΔEΣ (kWh) and ΔMΣ (kg), can be derived as Equation (9).
In this work, the gravimetric energy density of the battery pack (α, kWh/kg), which represents the ability to store energy per unit mass, is assumed to be constant for a specific type of battery. Then, the relationship between the reduced battery energy and the reduced battery mass could be obtained by Equation (10).
In order to identify the relationship between the energy consumption rate variation and the bus mass reduction, which is equal to the battery mass reduction, a simulation is presented. In simulation, the influences of different bus mass on the energy consumption rate are shown in Figure 2, which illustrates that the energy consumption rate is approximately linearly proportional to the bus mass. Moreover, if the bus mass reduces per 1000 kg, the corresponding energy consumption rate reduces 0.032–0.036 kWh/km. In other words, a 10% reduction in bus mass leads to a 4.2–4.8% reduction in energy consumption rate. Therefore, it is reasonable, which is also agreed in [24], to assume that energy consumption rate decreases by 4.5% if the mass is reduced by 10% for a pure electric bus. Based on this assumption, Equation (7) can be rewritten as Equation (11).
For simplification, a proportion coefficient β (kWh/kg/km), called specific energy reduction per kilometer, is defined and expressed as Equation (12):
According to Equations (4)–(12), the battery reduction model of the OWCEB can be obtained as Equation (13), whose proof procedure could be found in Appendix A.
Deducting ΔEΣ from E and ΔMΣ from M, the energy and the mass of the redesigned battery of the OWCEB can be quantified.
Although complying with the classification of the wireless-charging system basically, the classification of opportunistic wireless electric bus charging system is different due to the distinctive operation scenario of the public transit bus. In this work, it has two types: one is the opportunistic stationary wireless electric bus charging system which receives energy when the electric bus stops at bus stops; the other is the opportunistic hybrid wireless electric bus charging system which receives energy both during the time when the electric bus stops at bus stops and when it is moving. Their battery reduction models are established as follows separately.
2.2.1. The Battery-Reduction Model of the Opportunistic Stationary Wireless-Charged Electric Bus (OSWCEB)
In the opportunistic stationary wireless electric bus charging scenario, a primary coil is installed at the stopping zone, where the bus makes a complete stop to load/unload passengers and is charged wirelessly, as shown in Figure 3.
In this work, we assume that the input power of the opportunistic stationary wireless-charging system is the same for each stop and the operating conditions of the bus is the same for each cycle. Then, the battery reduction model of the opportunistic stationary wireless-charged electric bus (OSWCEB) can be written as Equation (14):
where P (kWh) is the charging power, referring to input power of the wireless charger in this paper; tm,n (s) is the charging time of the nth stop of the mth cycle; ηs (%) is the efficiency of the stationary wireless-charging system.
In order to simplify calculating, t (s) is defined as the average stop time at each stop so that Equation (14) can be further expressed as Equation (15).
2.2.2. The Battery-Reduction Model of the Opportunistic Hybrid Wireless-Charged Electric Bus (OHWCEB)
In the hybrid wireless electric bus charging scenario, a lumped track is installed at the bus stop, as shown in Figure 4. If the lumped track for dynamic wireless charging system is deployed adjoining the stationary wireless-charging pad, the power converters and controller can be shared. Besides, the speed of the bus is low when it is approaching to or departing from the stop. Therefore, more energy can be transferred wirelessly compared to that if the bus operated at a high speed through a track of the same length. By applying the opportunistic hybrid wireless-charging system, the battery of electric bus can be charged wirelessly during the time not only when the bus stops to load/unload passengers, but also when it is moving over the power track. Obviously, traveling the same distance and with the same average speed, the OHWCEB could receive more energy than the OSWCEB. Therefore, the battery of OHWCEB could be smaller than that of OSWCEB.
In addition to the assumption in the stationary wireless electric bus charging scenario, we defined ln (m) as the length of the power track installed near the nth stop and vm,n (km/h) as the average speed of OHWCEB passing through the nth power track in the mth cycle. Therefore the battery-reduction model of the OHWCEB can be written as Equation (16):
where ηd (%) is the efficiency of the dynamic wireless-charging system.
Similarly, in order to simplify calculating, we make a simple but reasonable assumption that l (m) and v (km/h) are the length of the power track installed near each stop and the average speed of OHWCEB passing through each power track in each cycle, respectively. So, Equation (17) can be further expressed as follows.
Figure 5 illustrates the energy dynamics of plug-in charged electric bus, OSWCEB and OHWCEB during a day. Although the battery energy variation is not absolutely proportional to the time, a linear approximation can be utilized to approximate their relationship in this model. The patterns filled with squares, triangles and circles represent plug-in charged electric bus discharging, OSWCEB discharging and OHWCEB discharging, respectively. The downward diagonal, upward diagonal and diamond filling patterns stand for the stationary wireless charging, dynamic wireless charging and plug-in charging, respectively.
If all types of electric buses are operated following the same travelling pattern, it can be found that the battery energy capacity of the wireless-charged electric bus is smaller than that of the plug-in charged electric bus. Moreover, utilizing the hybrid wireless-charging system has the greatest effect on the battery reduction of the electric bus.
2.3. Cost-Saving Models
In this section, the cost saving due to the battery reduction, which is caused by the application of wireless-charging technology on electric bus, is studied. This specific cost saving consists of production cost saving and operation cost saving. Additionally, considering the infrastructure cost, a general total cost saving model is established so as to analyze the economy of the opportunistic wireless-charging system.
2.3.1. Production Cost Saving
The battery pack installed on the bus is composed of multiple battery cells. The energy of the battery pack is normally quantified by the cell energy capacity and the number of cells in it. Therefore, the battery pack with more energy needs more battery cells, which results in higher battery costs. Although, the cost of the battery pack is different from that of the battery cell, it is reasonable to assume that the battery cost is linearly proportional to the energy of the battery. This type of cost saving is the result of the reduction in battery size, which happens during the manufacturing.
Therefore, we call it the production cost saving, denoted as PCS ($). It is the cost saving due to the battery energy capacity reduction (ΔEΣ) of the OWCEB and can be expressed as Equation (18).
where pb ($/kWh) is the battery cost per unit of energy capacity.
2.3.2. Operation Cost Saving
According to above analysis, it is known that the total battery energy capacity reduction (ΔEΣ) of mainly includes two parts. One is contributed by the wireless-charging infrastructure installed at/near bus stops and the other is contributed by the reduction of energy consumption rate, which is denoted as ΔEECR (kWh), can be calculated by Equation (19):
The reduction of energy consumption rate, which means less energy consumption during the whole operating life of the electric bus, leads to a considerable cost saving. We call it the operation cost saving. The operation cost saving or the cost saving due to the reduction of energy consumption rate during the lifetime of the battery, which is denoted as OCS ($), can be obtained as Equation (20) if an OWCEB runs Nd days per year and the life of its battery is Ny.
where, pe ($/kWh) is the price of electricity per kilowatt-hour.
2.3.3. Total Cost Saving
Although the application of the opportunistic wireless-charging system brings production cost saving and operation cost saving, infrastructure cost increases because wireless chargers are installed at/near every bus stop. In this paper, the infrastructure cost of one bus route consists of the cost of power tracks (or transmitting coils) and the cost of auxiliary equipment such as inverters, controllers, etc.
For the opportunistic stationary wireless electric bus charging system, the infrastructure cost depends on how many bus stops are installed with wireless chargers. It can be expressed as Equation (21):
where pcoil ($/each) and paux ($/each) are the price of per transmitting coil and per set of auxiliary equipment, respectively.
For the opportunistic hybrid wireless electric bus charging system, the infrastructure cost also depends on the length of power track. Then, the infrastructure cost can be obtained by Equation (22):
where ptrack ($/m) is the price of per unit length of power track. Note that the price of auxiliary equipment of the opportunistic hybrid wireless electric bus charging system is same as that of the opportunistic stationary wireless electric bus charging system. With the same assumption in the above section that the length of every power track is identical and equal to l (m), Equation (22) can be expressed as Equation (23):
The production cost saving and operation cost saving in the above context refer to the production cost saving and operation cost saving of one bus. So, in order to make the analysis objects consistent, the total cost saving of one bus (TCS, $) is used to reflect the economy of one bus route. The infrastructure cost of one bus route (Cinfra, $) should be apportioned equally among each bus. Therefore, the general total cost saving of one bus on a bus route (TCS, $) can be expressed as Equation (24):
where NBus is the number of electric buses operating on the route.
3. Numerical Example and Parameter Analysis
3.1. Numerical Example and Computational Results
As analyzed above, battery reduction and cost saving are two typical benefits brought by applying wireless charging technology on an electric bus. In order to demonstrate this intuitively, a numerical case is presented in this section using the actual data collected from a plug-in charged electric bus. In this paper, the parameters of this numerical case are denoted as X0 where X is M, E, Nc, Ns, L and so on.
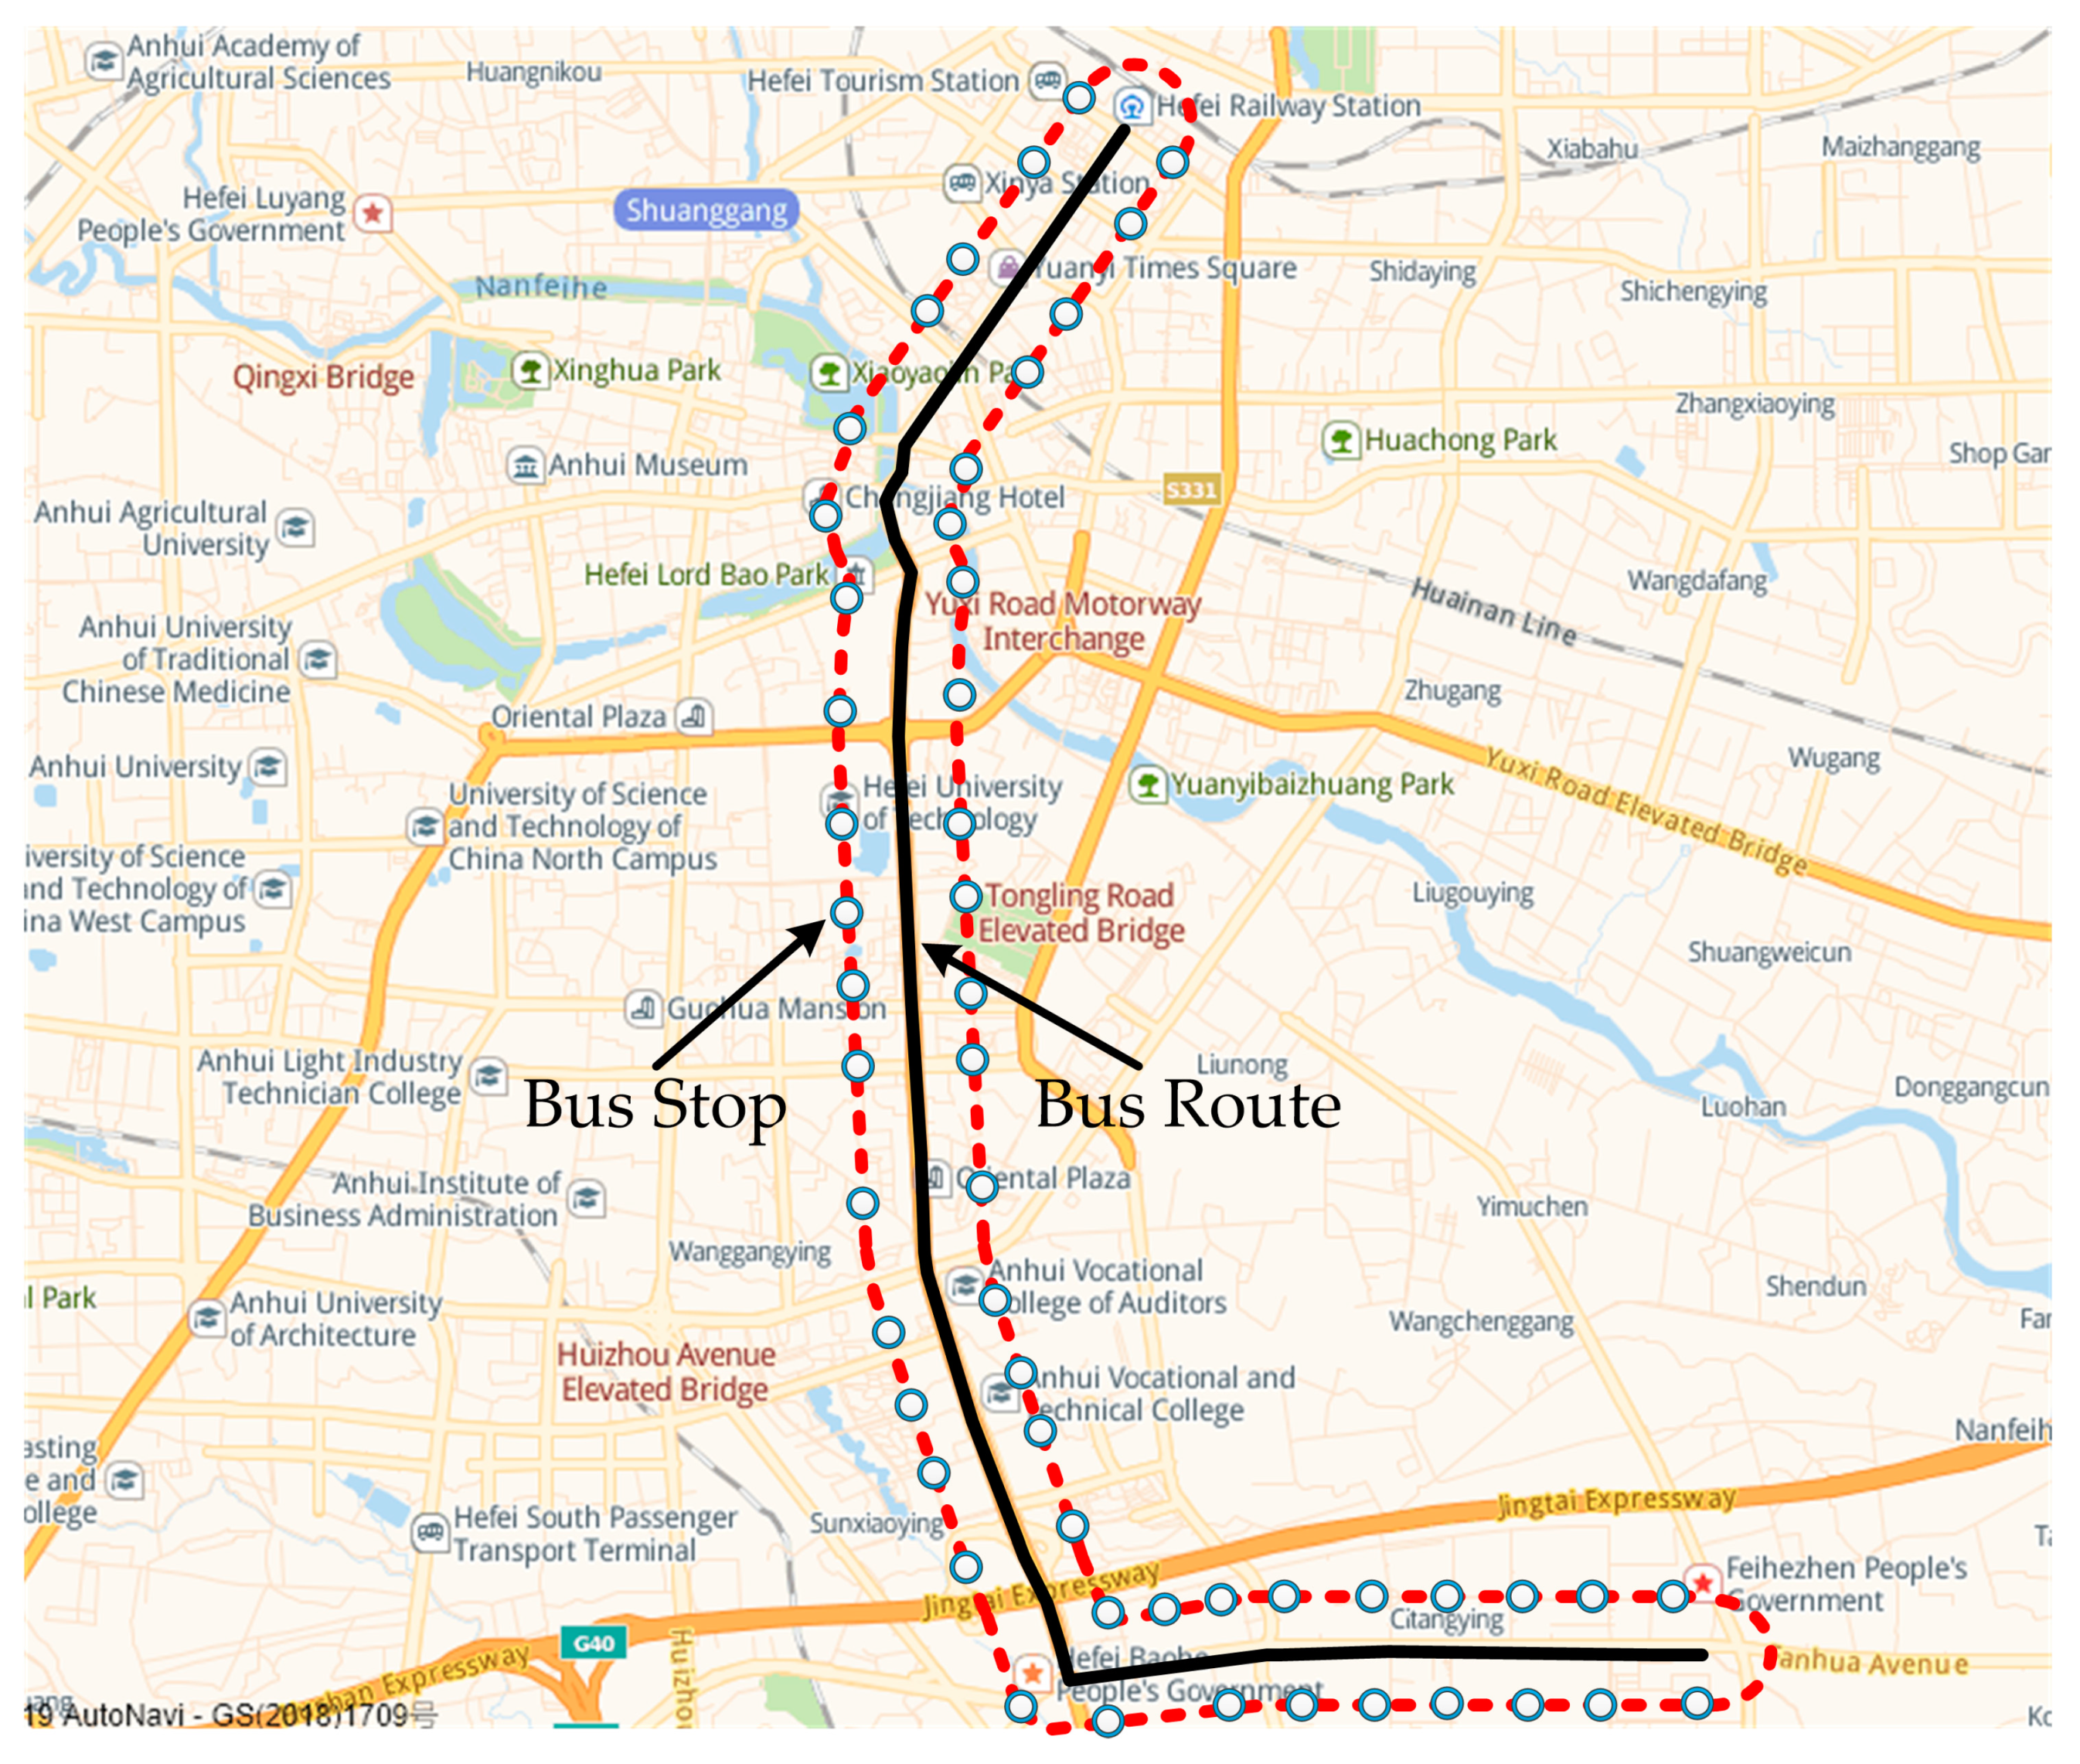
An actual electric bus operating in Hefei, Anhui, China is used as the basis for the simulation. According to List of New Energy Vehicle Models Exempted From Vehicle Purchase Tax (the 12th Batch, China), the detailed parameters of the plug-in charged electric bus are shown in Table 1. Travelling along a 35 km-long circular route, which is shown in Figure 6, the bus runs about six cycles every day, i.e., L0 = 35 km and Nc0 = 6. Additionally, there are 12 electric buses operating on the route and 52 stops in one cycle including starting station and terminal station, i.e., NBus0 = 12 and Ns0 = 52.
In this numerical case study, every stop is assumed to be equipped with the same wireless-charging infrastructure. As mentioned above, the stationary wireless charging happens when passengers get on and off the bus at each stop. So, we recorded the duration of the passengers getting on and off the bus at each stop in each cycle for a week. According to the recorded data, the average stop time at each stop (t) is about 11 s, i.e., t0 = 11 s. While, for the dynamic wireless charging, in this simulation, the length of the power track installed near each stop (l) and the average speed of the OHWCEB passing through each power track in each cycle (v) are assumed to be 24 m and 20 km/h, respectively, i.e., l0 = 24 m and v0 = 20 km/h.
Due to the limitation of the performance of the battery, the charging current should be within a certain range. Currently, the charging C-rate of the original overnight charger of the basis electric bus is about 0.5 C. In other words, the maximum output power of the charger (Pout, kW) should be about 166 kW. Actually, the charging C-rate of the quick charger for electric vehicles has been 2 C or even higher. Therefore, considering the characteristics of the opportunistic wireless-charging system and the effect of charging C-rate on the battery, we set the output power of the wireless charger as 200 kW in this simulation.
The relationship between the output power of the wireless charger (Pout) and the charging power (P), namely the input power of the wireless charger, can be expressed as Equation (25):
where η (%) is the efficiency of the wireless charger.
According to Equation (25), the charging power (P) is also influenced by the charging efficiency. In the simulation, it is assumed that the efficiency of the stationary wireless-charging system (ηs) is 95% and efficiency of the dynamic wireless-charging system (ηd) is 85% [13,30]. In the opportunistic hybrid wireless-charging system, the input powers of the stationary wireless-charging system and dynamic wireless-charging system are the same due to the assumption that they share the power converters and controllers. So, in order to meet the requirements of the charging power of the battery during the dynamic wireless charging, the charging power (P) should be calculated based on the system with low efficiency.
The parameters used in our numerical analysis are summarized in Table 2. The cost of power track per unit meter and the cost of per set of auxiliary equipment in can be found in [27]. The cost of per transmitting coil is approximately equal to that of power track per unit meter. It is assumed that the bus runs 350 days per year and the battery life is 10 years [6,31].
Based on the analysis above, the results of this numerical example are summarized in Table 3, which shows the battery energy capacity reductions, mass reductions and cost savings, if the stationary and hybrid wireless-charging systems are applied on the electric bus, respectively. The results illustrate that the battery energy capacity and battery mass can be reduced by 201.63 kWh and 1680.28 kg, respectively, if the plug-in charged electric bus is modified into an opportunistic stationary wireless-charged electric bus. This leads to a production cost saving of about 80,653.28 dollars. Additionally, the energy consumption of the OSWCEB reduces about 10.97 kWh per day, which results in an operation cost saving of 1.53 dollars per day or 5352.26 dollars in the lifetime, due to the battery lightweighting. Moreover, 304.16 kWh of battery energy capacity and 2534.67 kg of battery mass can be reduced with the application of the opportunistic hybrid wireless-charging system instead of the opportunistic stationary wireless-charging system. Also, 121,664.36 dollars can be saved from the manufacturing of one electric bus. Correspondingly, about 2.31 dollars per day can be saved, which is due to 16.54 kWh of energy consumption reduction for one-day operation. Therefore, 8071.28 dollars can be saved in the lifetime of one OHWCEB. If the infrastructure cost is considered, the specific total cost savings for the OSWCEB and OHWCEB will be $64,078.87 and $101,828.97, respectively.
3.2. Parameter Analysis
Wireless-charging technology will definitely bring merits to an electric bus system. As analyzed above, the cost saving, which is brought about by the reduction of the battery, is the direct benefit. According to Section 2, the battery energy capacity and mass reductions are affected by many parameters, such as charging power (P), charging time (t), the gravimetric energy density of battery pack (α), the number of cycles (Nc), the length of the power track (l), the average speed of the OHWCEB passing through the power track (v), etc. which are listed in Table 2.
In this section, due to the unpredictable market prices of batteries and electricity, the direct influence of parameters on the cost savings was not analyzed. But, cost-related energy reduction is used to indirectly reflect the impact of parameters on the cost savings.
In our work, a simple but effective method, variable-controlling method, is used to analysis the parameters that influence the battery reduction.
3.2.1. Parameter Analysis of the Opportunistic Stationary Wireless-Charging System (OSWCS)
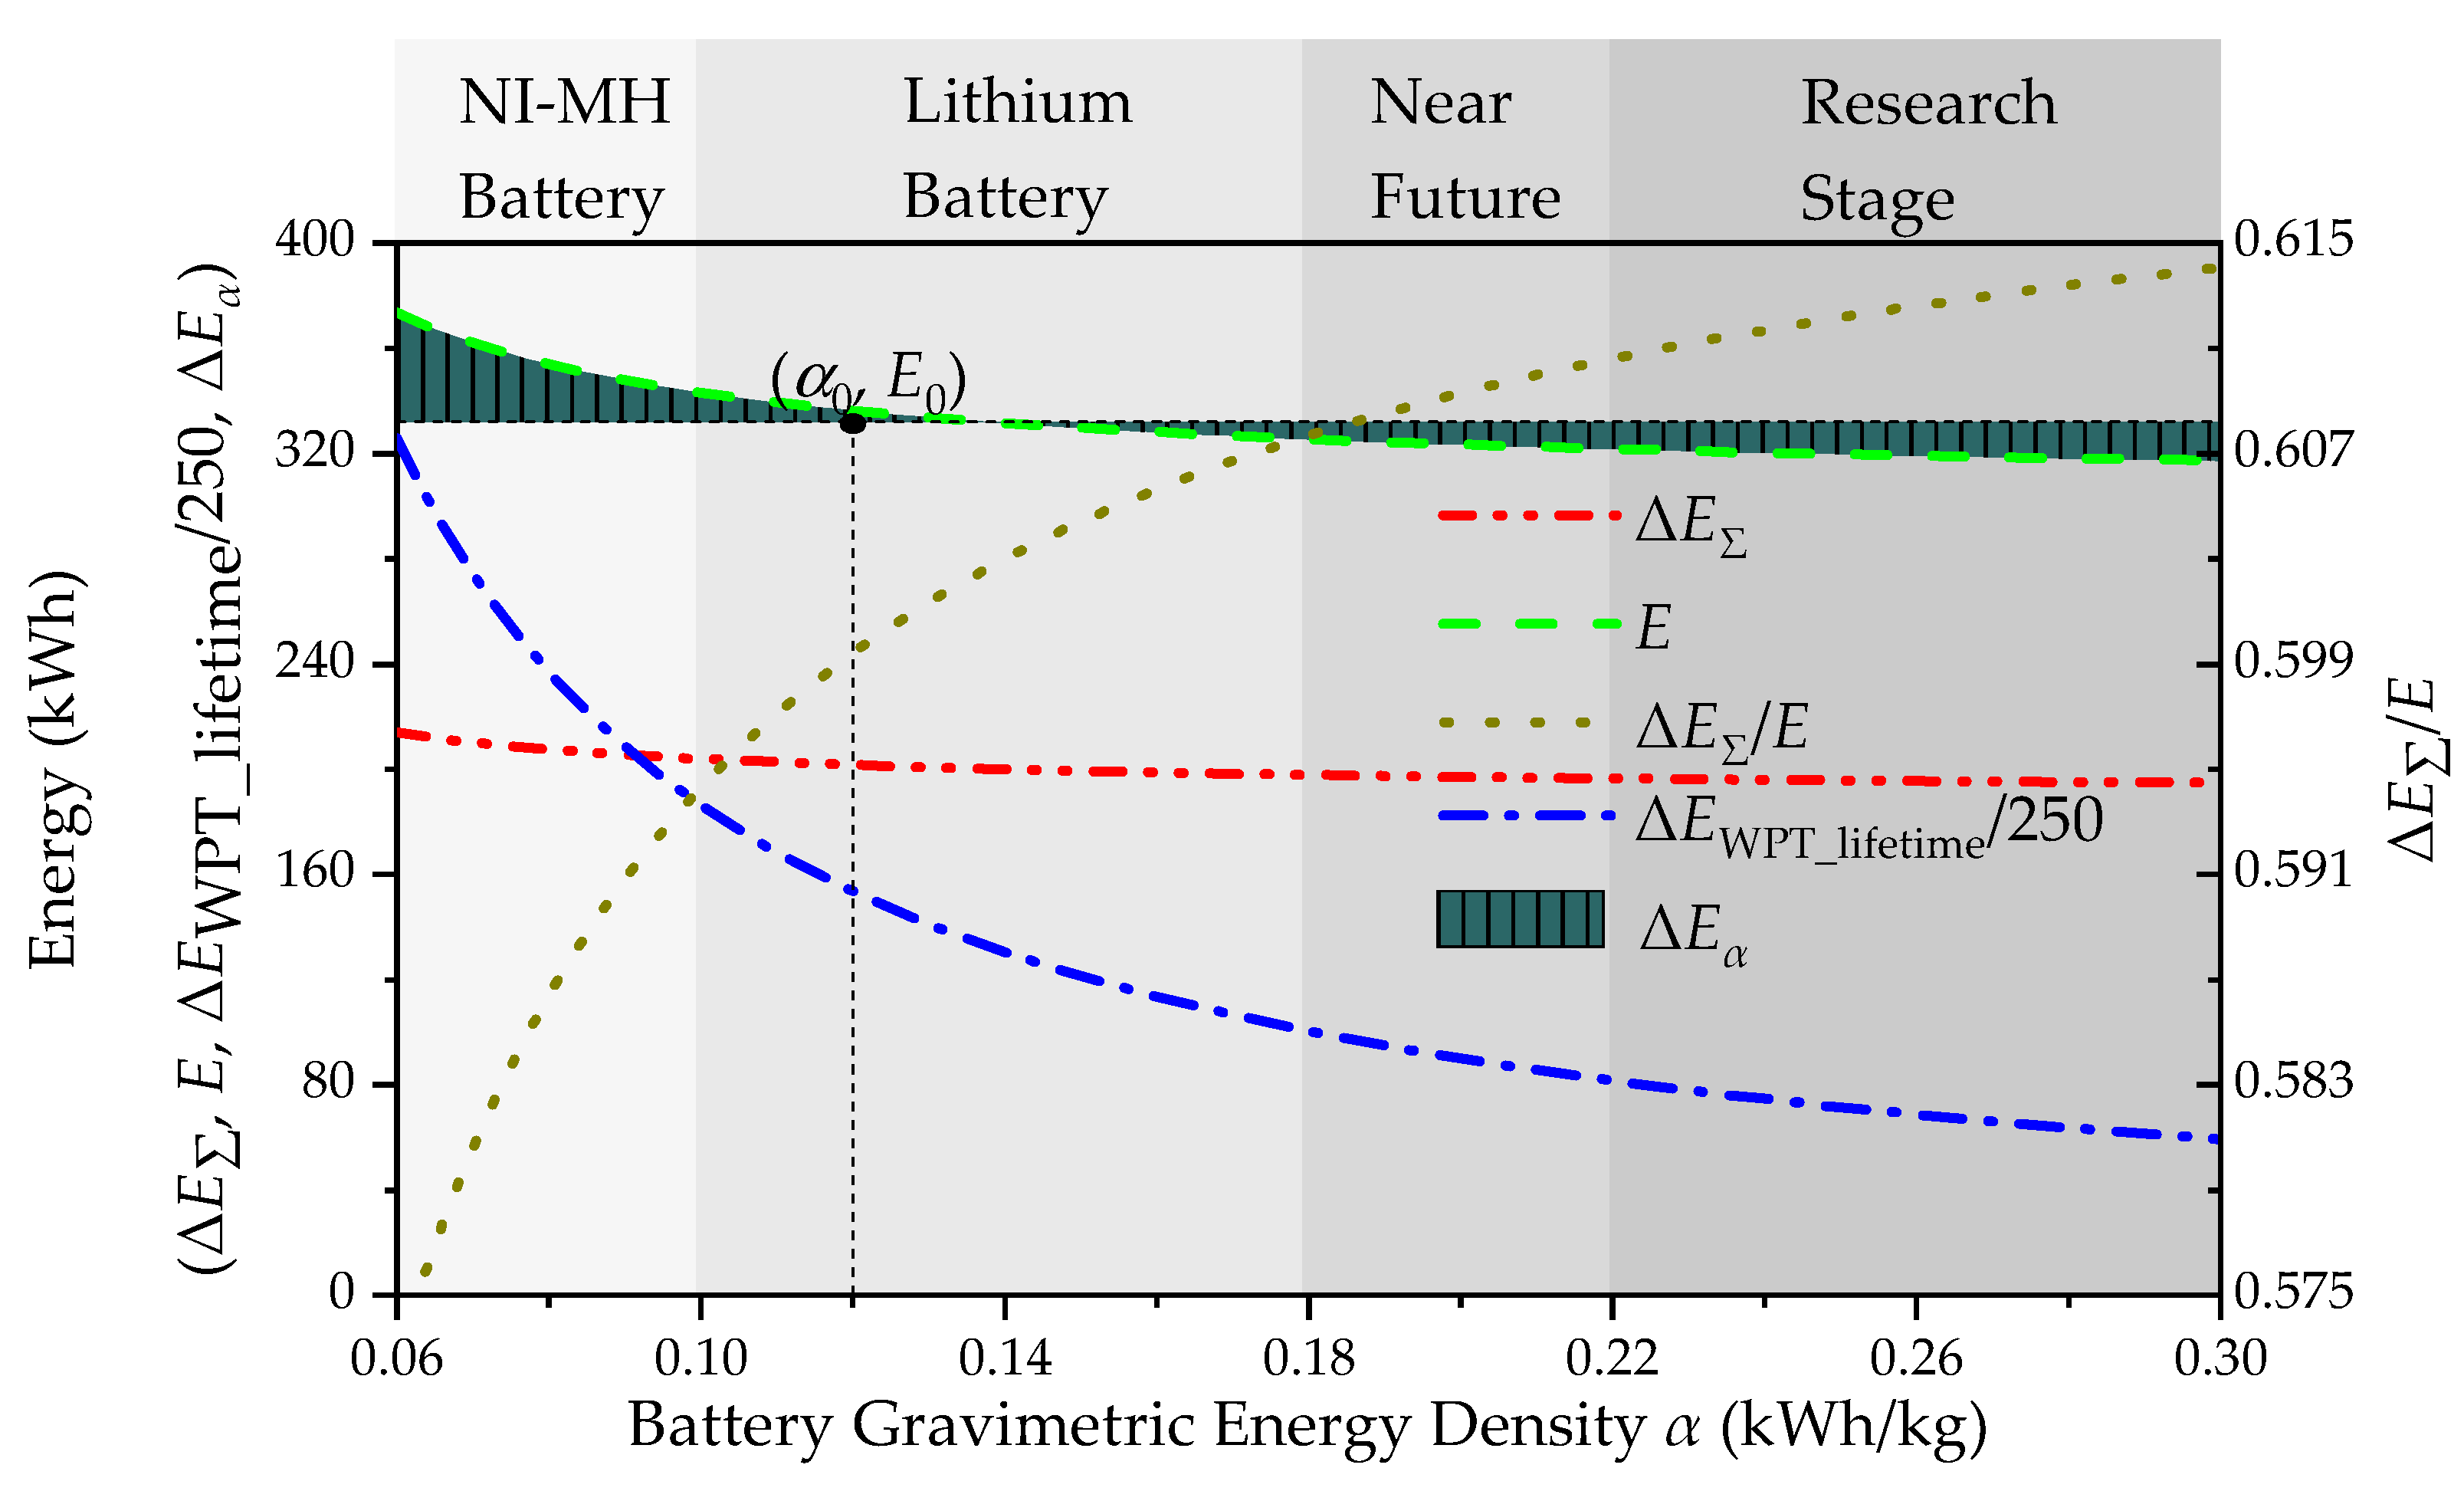
A. Battery Gravimetric Energy Density (α)
The battery gravimetric energy density, which is one of the most important battery parameters, has significant impacts on both electric bus and the application of the opportunistic wireless-charging system on an electric bus. The battery energy capacity and mass of the plug-in charged electric bus will definitely be reduced if a battery system with higher gravimetric energy density is applied. When we investigate the influence of the battery gravimetric energy density on the application of OSWCS on electric bus, the battery reduction due to the application of OSWCS should be differentiated from the battery reduction due to the higher battery gravimetric energy density before the OSWCS is applied.
We use the values of the parameters defined in numerical example as the reference. This work is equivalent to modify the plug-in charged electric bus mentioned in the numerical example into another plug-in charged electric bus without changing other parameters except the parameters related to the battery and the energy consumption rate. The equations in Section 2 still work and the following Equation (26), similar to that of Section 2, can be obtained:
where Δb0 (kWh/km) and ΔM0 (kg), expressed as Equation (27), are the variations of energy consumption rate and battery mass due to the change of the gravimetric energy density, respectively.
Considering the analysis in Section 2 and Equations (2), (26) and (27), the battery mass (M) and energy capacity (E) and the battery energy capacity reduction contributed by the change of the battery gravimetric energy density (ΔEα, kWh) can be obtained as Equation (28):
Then, this new plug-in charged electric bus is modified into an OSWCEB. The battery energy capacity reduction contributed by the application of the OSWCS on the electric bus (ΔEΣ) can be obtained as Equation (29), which also reflects the change of production cost saving in numbers.
According to Equations (28) and (29), both of the energy capacity of the battery (E) and the energy capacity reduction (ΔEΣ) vary with the battery gravimetric energy density of α. So, in this work, we use the ratio of them (ΔEΣ/E), expressed in Equation (30), to reflect the ability of wireless-charging technology to reduce the battery energy capacity when the gravimetric energy density of the battery is α.
Additionally, the operation cost saving can be reflected by the energy reduction contributed by the reduction of energy consumption rate during the lifetime of the battery (ΔEECR_lifetime, kWh), which can be expressed by Equation (31):
Figure 7 shows the gravimetric energy density ranges of different types of battery packs used in electric vehicles. Currently, NI-MH battery has gradually been eliminated, due to lower energy density and other drawbacks and the wide use of the lithium battery. The gravimetric energy density of the lithium battery pack is about 0.1–0.18 kWh/kg.
As shown in Figure 7, it is not difficult to find that the higher battery gravimetric energy density, the smaller the battery energy capacity. The reasons are as follows. It is assumed that the effective battery energy is equal to the energy which the electric bus consumed in daily duty. If the battery gravimetric energy density increases, the battery mass with the same energy will decrease which leads to a small energy consumption rate. As a result, the energy the electric bus consumed in daily duty will decrease, which results in a small battery energy capacity. Additionally, the variation of the energy consumption rate will be smaller and smaller with the increase of the battery gravimetric energy density, which leads to the descending rate of the change in battery capacity. Illustrated by the dark green vertical patterns in Figure 7, the battery energy capacity (E) before the use of OWCS has changed by ΔEα, compared with the battery reference parameter (E0). However, even though the battery gravimetric energy density increases to 0.3 kWh/kg, the battery energy capacity reduction contributed by the change of battery gravimetric energy density (ΔEα) is only about 4.4% (15 kWh). The total battery energy capacity reduction contributed by the application of OWCS also decreases as the battery gravimetric energy density increases, but the trend is not obvious. As shown in Figure 7, the total varying trend of the ratio of ΔEΣ and E is gradually ascending. This indicates that the higher the battery gravimetric energy density, the better the effectiveness of the application of OWCS, though the variation of the ratio is very small (about 0.015). The ratio of ΔEΣ and E is about 0.607 when the battery gravimetric energy density rises from 0.12 kWh/kg to 0.3 kWh/kg. This means that the production cost of battery can be reduced by about 60.7% if the OSWCS is applied on an electric bus.
Additionally, as shown in Figure 7, although the energy reduction contributed by the reduction of energy consumption rate during the lifetime of the battery goes down with the increase of the battery gravimetric energy density, the operation cost saving still remains 40% and is substantial due to the high ΔEECR_lifetime (about 15,000 kWh) when the battery gravimetric energy density is 0.3 kWh/kg. Moreover, in the near future, the gravimetric energy density of a battery pack may be improved to about 0.2 kWh/kg [8]. So, the application of OSWCS on an electric bus can still have significant advantages.
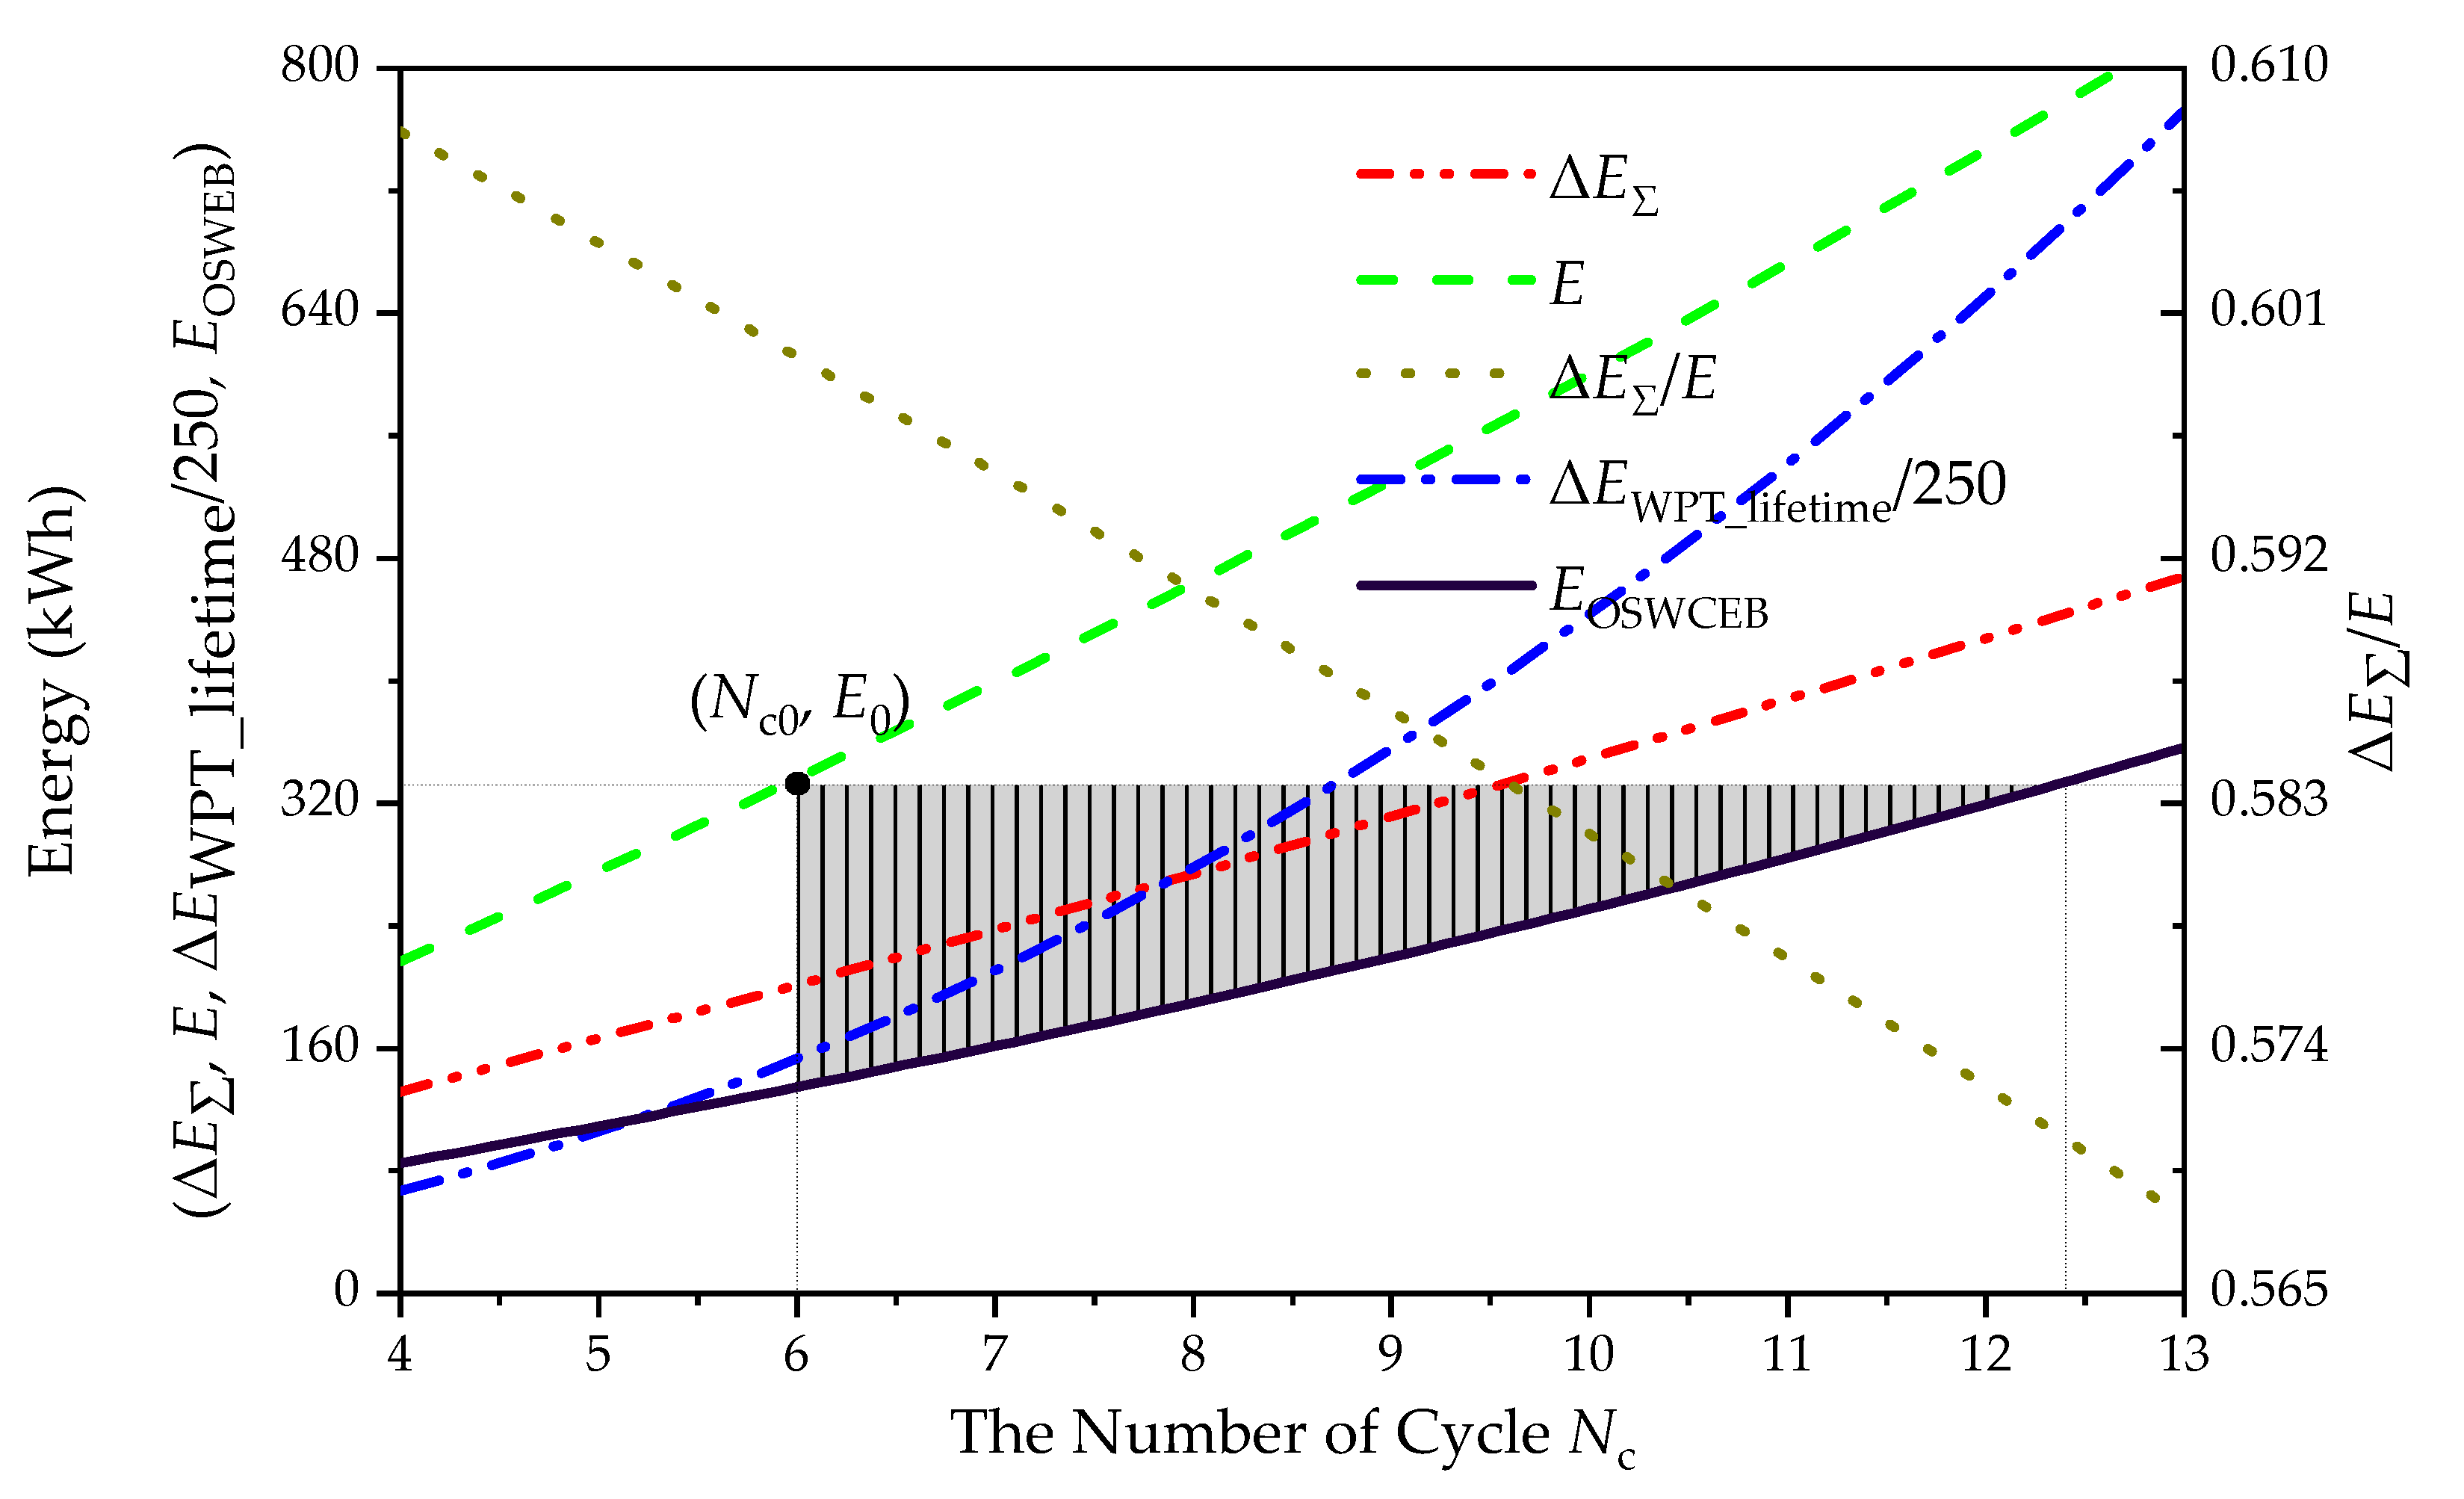
B. The Number of Cycles
Similarly, we then investigate the number of cycles. This work is equivalent to modifying the plug-in charged electric bus which can operate Nc0 cycles mentioned in the numerical example into another plug-in charged electric bus with a battery system which can operate Nc cycles. Similar to Equations (28)–(31), when the number of cycles is Nc, Equation (32) to can be obtained.
Additionally, the battery energy capacity of the OSWCEB (EOSWCEB, kWh) can be expressed as Equation (33).
As shown in Figure 8, the impacts of the number of cycles on OSWCEB are almost opposite to that of the battery gravimetric energy density. Firstly, as the increase of the number of cycles (Nc), the battery energy capacity (E) rises sharply, because the electric bus needs, beyond all doubt, a battery with larger energy capacity. But at the same time, the total battery energy capacity reduction contributed by the application of the opportunistic wireless-charging system also increases due to the increasing total time when the electric bus loads/unloads passengers. The ratio of ΔEΣ and E decreases with the increase of the number of cycles, which indicates that the higher the number of cycles, the worse the effectiveness of the application of OWCS. But the variation of the ratio is also very small (less than 0.03 even if the number of cycle increases to 12).
Similarly, Figure 8 shows that the production cost saving of the battery increases in number. But the proportion of the saved battery cost to the battery cost declines due to the descending ratio of ΔEΣ and E. The energy reduction contributed by the reduction of energy consumption rate during the lifetime of the battery increases as the number of cycles increases, which results in the increasing operation cost saving.
Furthermore, as shown in Figure 8, the number of cycles is more than 12 when the battery energy capacity of the OSWCEB goes up to 332 kWh. This means the electric bus can at least run 12 cycles due to the application of the OSWCS, twice as much as before, if the energy capacity of the battery is not changed. Note that the number of the operation cycles of the plug-in charged electric bus should meet the requirement of daily duty. Therefore, if the plug-in charged electric bus is converted into an opportunistic wireless-charged electric bus, the number of the operation cycles during a day should be constant, even though it can operate more cycles. But, the remaining battery energy can be used the next day. In other words, applying the wireless-charging technology, the electric bus with the same battery can at least run two working days. Additionally, for those electric buses which cannot run a whole day due to the small battery energy capacity, the OWCS may allow them to operate all day and even reduce the battery energy capacity at the same time.
As shown in the dark vertical pattern of Figure 8, when the number of cycles is between 6 and 12, EOSWCEB is less than 332 kWh. That is to say, we can choose to reduce the battery energy capacity or increase the number of cycle (between 6 and 12) when we apply the opportunistic wireless-charging technology.
C. Charging Time and Charging Power
As shown in Figure 9, it presents how the battery energy reduces with the increases of charging power and the average charging time of each stop. Intuitively, the longer the battery is charged wirelessly, the more electricity it will receive. So, to some extent, the required charging power can be decreased by increasing the charging time. The longer the bus is charged at bus stops, the more the battery capacity is reduced. Unfortunately, the charging time is limited due to the short loading/unloading passenger time. It is known that the long waiting time will cause the passengers unsatisfied. So, when loading/unloading passengers is completed, the extra waiting time is limited. It is reasonable to assume that passengers may accept an extra stop time of 3–5 s per stop. Then, according to Figure 9, the charging power can be decreased to about 165 kW (reducing by about 21%) if the extra waiting time is 3 s and about 145 kW (reducing by about 31%) if the extra waiting time is 5 s.
Charging power is another decisive factor of the battery reduction of the opportunistic wireless-charged electric bus. As shown in Figure 9, the battery energy reduction is linearly proportional to the charging power if the OWCS works at constant power mode. The battery energy capacity can be reduced by 3% with about an increase of 10 kW in charging power. As the battery capacity decreases, the charging/discharging C-rate of the battery will increase. The charging/discharging C-rate, which is equal to the charging/discharging current divided by the capacity of the battery, is one of the important factors that influence the battery life. Its effects are mainly shown in the following three aspects: (1) the effect on the degradation rate of the battery capacity; (2) the effect on the cycle performance of the battery; and (3) the effect on voltage platform length of the battery [32]. Unfortunately, the increase of the charging/discharging C-rate will cause larger capacity degradation and lower voltage platform of the battery. Therefore, it is crucial to maintain an appropriate C-rate, which means that the charging power should not be too high. However, the charging time at each stop, which is determined by the time taken to load/unload passengers and the extra waiting time base on the passenger satisfaction, is limited. A relatively high charging power is needed in order to receive a considerable energy from the wireless-charging system. Of course, none of the charging power and charging time can increase infinitely from the view of reality. Otherwise, the energy will be oversupplied.
The above analysis is based on the assumption that the battery of the OWCEB is charged with constant power. However, the lithium-ion battery is usually fully charged though a constant–current charging stage and a constant-voltage charging stage. In the electric vehicle application, the lithium-ion battery usually works at an ideal range of the state of charge (SOC) for the consideration of safe operation and lifespan prolongation. A battery working within this ideal SOC window, constant-current charging can be adopted. On the other hand, there may be more than 1 V variation of the open circuit voltage, which has a non-linear relation to SOC, to fully charge or discharge a single-cell lithium-ion battery (4.2 V/cell) [33]. Even for the lithium iron phosphate battery, which has a flat open circuit voltage curve, the variation of the open circuit voltage can be about 0.5 V [34]. Therefore, there is about 80–130 V variation for a high-voltage battery pack applied in electric bus (higher than 500 V). This will lead to the OSWCEB receiving different amounts of energy at different bus stops of different cycles. So, the amount of energy wirelessly received at a certain stop is determined by charging current, charging time and the SOC of the battery.
3.2.2. Parameter Analysis of the Opportunistic Hybrid Wireless-Charging System (OHWCS)
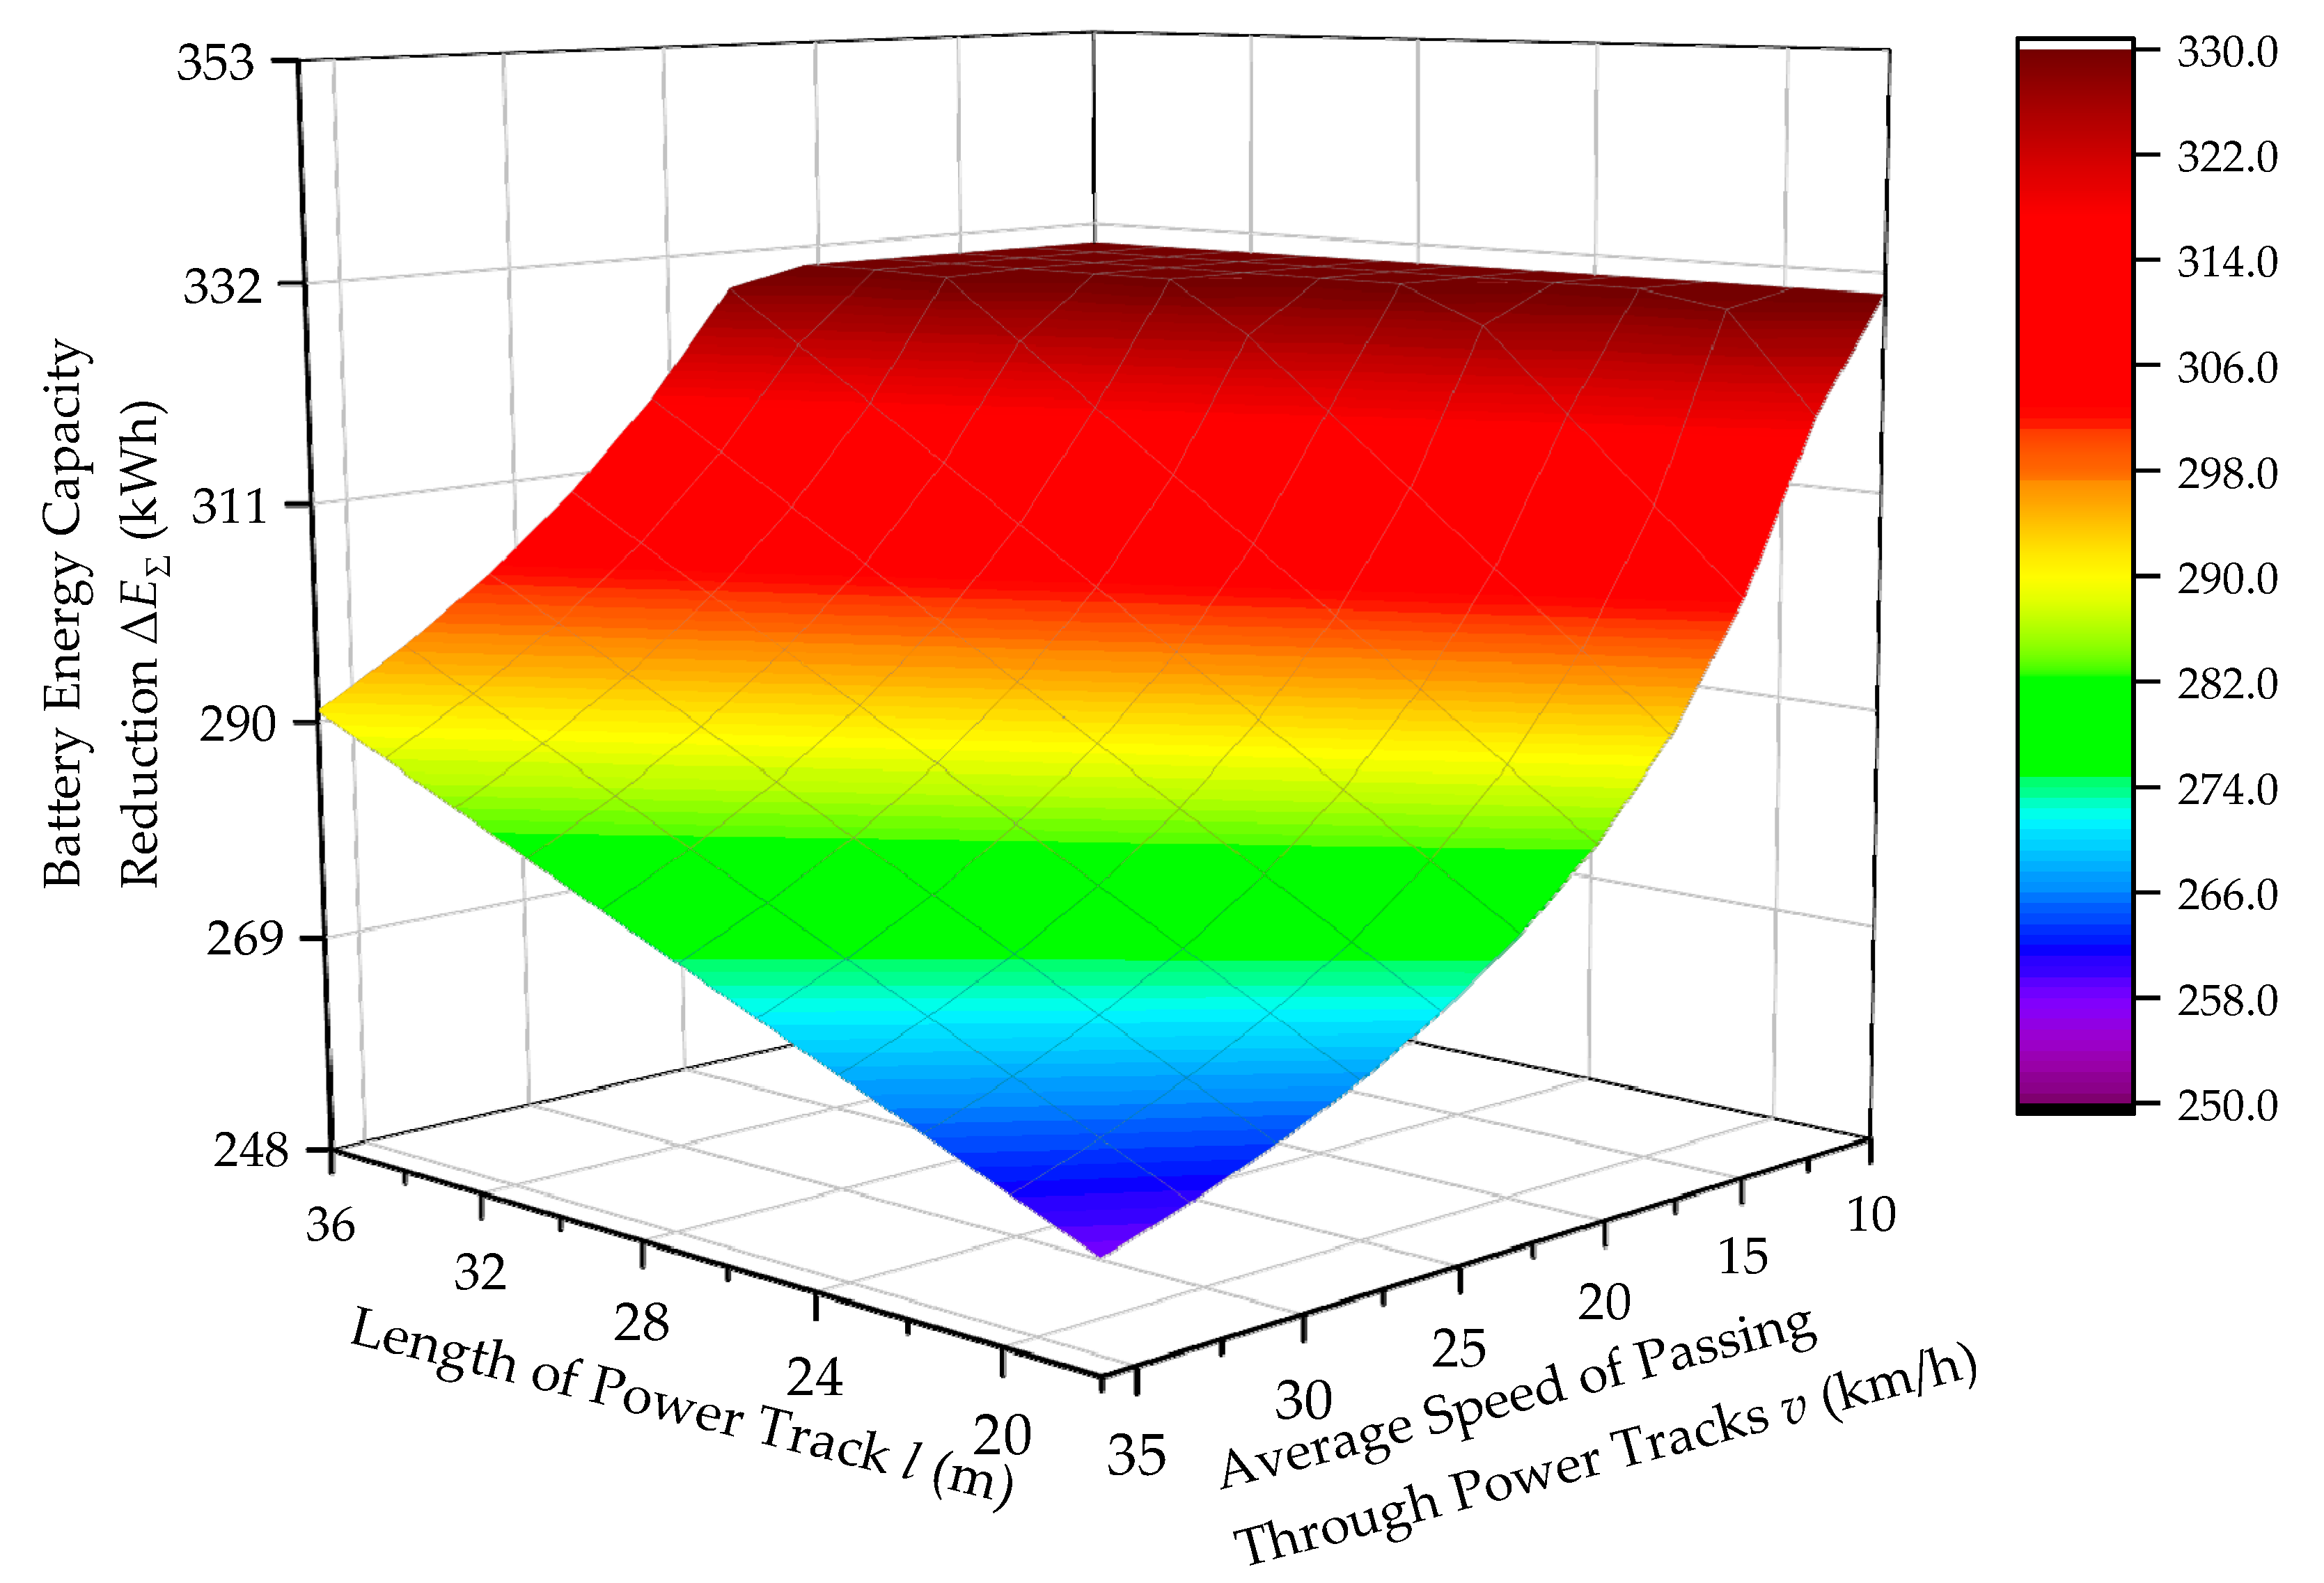
As mentioned above, the stationary wireless-charging system has some drawbacks. For example, the charging time will be very short if there are a few passengers getting on and off the bus. Worse still, the battery cannot be recharged if the bus does not stop at a station where no passengers get on or off. Fortunately, the dynamic wireless-charging system can make up for these defects in the stationary wireless-charging system perfectly. Passing over the power track installed near bus station, the bus can be charged without stopping. In this system, the length of power track plays an important role.
As shown in Figure 10, the battery capacity reduction is linearly proportional to the length of power track. The amount of energy supplied near a stop is actually proportional to the amount of time that a bus passes over the power track if the charging power is constant. Note that the maximum length of power track is the total travel length (L). At this point, the buses will no longer need batteries theoretically if the charging power is high enough. Moreover, if the length of power track is constant, the battery energy capacity reduction increases with the decrease of the average speed of passing through the power track. When the average speed is less than 20 km/h, the rate of increase rises sharply. All in all, the lower the speed of the bus passing through the power track, the more significant the impact of the length of the power track on the battery energy capacity reduction. But, the energy cannot be oversupplied.
4. Discussion
Although with the application of the wireless-charging system, not only can the electric bus be charged conveniently, but also the production cost and operation cost can be reduced drastically, there are many constraints that limit battery capacity reduction. Firstly, as analyzed in Section 3, short charging time and proper charging C-rate are the two main factors. Short charging time at each bus stop means that the charging power should be high enough to get a substantial battery reduction. However, if the charging power is too high, the charging C-rate will increase, as mentioned above, which will seriously damage the battery life. So, high power density battery or battery-ultracapacitor hybrid energy storage system is more suitable for OWCEB. Moreover, high charging power will also put a great burden on the power grid. Secondly, the battery life is another limiting factor. In order to travel the same journey as the original plug-in charged electric bus during a day, the number of charging/discharging cycles increases as the battery capacity decreases. Although the total energy required will also be reduced due to the decrease of energy consumption rate, it is smaller than the reduction of the battery energy. For example, assuming a fully charged battery of a plug-in charged electric bus is just enough to complete the work of a day. Then, the number of charging/discharging cycles of the battery will be double during a day, if the battery capacity is reduced to half by applying the opportunistic wireless charging technology. However, the number of charging/discharging cycles of a battery is limited [35,36]. Thus, the service life of the downsized battery will end earlier than that of the battery of a plug-in charged electric bus. But fortunately, just as the hybrid electric vehicle does, setting the SOC of the battery to be 50% and swings from 40% to 60% to preserve the battery life [37,38], an appropriate SOC range can be found for the opportunistic wireless-charged electric bus. The battery life of the wireless-charged electric bus may be as long as that of hybrid electric vehicle with a proper battery management strategy. This is worth studying further. Thirdly, the efficiency of the wireless-charging system is an important factor. Presently, the efficiency of the wireless-charging system is lower than that of the plug-in charging system. In addition to the structure of the system itself, there are many other factors affecting the efficiency of the wireless-charging system, such as the misalignment and the surrounding. For dynamic wireless-charging system, the speed passing through power tracks is also an important factor affecting the efficiency. Therefore, improving the efficiency of the OWCS is a research priority.
In the dynamic wireless-charging system, the assumption that the amount of energy supplied in each stop is linearly proportional to the length of the power track installed at the stop if the speed passing through power tracks is constant and results in an inaccurate model. For example, when a bus is ready to pull into a bus stop where another bus has already stopped, it must travel slowly which leads to more charging time. Conversely, if no buses stop at the stop, or even no passengers get on and off the bus, it can pass through the power track quickly. This will result in less charging time. Therefore, the battery reduction models need to be further optimized in future work.
Additionally, although some wireless-charged electric buses have come into use, they are still in the very early stage of commercialization. Therefore, some uncertainties, such as the labor cost and maintenance cost, are not included in the total cost-saving model due to lack of data on commercial construction and maintenance. Beyond that, buses on multiple routes may stop at the same bus stop. So, the wireless charger installed at/near one bus stop can be shared by the buses operating on multiple routes. As a result, the infrastructure cost of one wireless charger should also be shared by multiple routes, which leads to an increase of the total cost saving of one bus. On the other hand, although the battery can be reduced significantly and the total cost saving is also very substantial, applying the opportunistic wireless-charging system would lead to huge construction cost, or even wasted resources if wireless charger is installed at each stop. Actually, a tradeoff between the allocation of wireless-charging infrastructure, including the number of wireless-charging infrastructure and the length of the power track, and the battery capacity should be investigated to minimize the total investment cost. Therefore, the economic analysis and optimization of the opportunistic electric bus wireless-charging system from a systematic perspective should be investigated in future work.
Moreover, in this paper, it is not considered that the power required by buses varies from moment to moment with the change of the driving state, which may result in an inaccurate mathematical model. Many factors affect the amount of power a bus needs, such as speed, acceleration and the weight of the bus. Therefore, in order to achieve precise and real-time power values, there is a lot work to do.
5. Conclusions
In this paper, an opportunistic wireless-charging system for electric bus was introduced, including the opportunistic stationary wireless-charging system and opportunistic hybrid wireless-charging system. Battery reduction models were built to reflect the effects of the OSWCS and OHWCS on electric buses. Additionally, in order to analyze the economy of an opportunistic wireless-charging system, the cost saving due to the application of the OWCS on an electric bus was investigated in terms of aspects of production cost, operation cost and total cost. The proposed models were demonstrated with a numerical example. The simulation results show that: firstly, the battery energy capacity and mass can be reduced by about 60% for the OSWCEB and 90% for the OHWCEB. Secondly, the cost savings for the OSWCEB and OHWCEB due to the battery reduction reached about $86,000 and $130,000, respectively; the specific total cost savings, considering the infrastructure cost, for the OSWCEB and OHWCEB are about $64,078.87 and $101,828.97, respectively. Finally, the results of parameter analysis show that (1) the battery can be reduced by about 60% regardless of the improvement of the battery gravimetric energy density at a specific charging power; (2) the battery energy capacity can be reduced or the number of cycles can be increased when the OWCS is applied; (3) it is crucial to set and balance charging power and charging time on the basis of the battery performance and passenger satisfaction; (4) the tradeoff between the length of power tracks and the average speed passing through the bus stop is also of great significance to improve the effectiveness of the OHWCS.
Author Contributions
Conceptualization, S.W. and W.L.; methodology, S.W. and W.L.; validation, S.W., W.L. and A.Y.; investigation, S.W. and J.H.; writing—original draft preparation, S.W. and W.L.; writing—review and editing, W.L., A.Y. and J.H.; supervision, W.L. and A.Y.; project administration, W.L.; funding acquisition, W.L.
Funding
This research was funded by Natural Science Foundation of Anhui Province (grant number 1808085QE122) and the Fundamental Research Funds for the Central Universities (grant number JZ2017HGTA0174 and JZ2016HGBZ1020).
Conflicts of Interest
The authors declare no conflict of interest.
Nomenclature
| Abbreviation | |
| EV | Electric vehicle |
| ECR | Energy consumption rate |
| OLEV | Online electric vehicle |
| OWCS | Opportunistic wireless-charging system |
| OSWCS | Opportunistic stationary wireless-charging system |
| OHWCS | Opportunistic hybrid wireless-charging system |
| OWCEB | Opportunistic wireless-charged electric bus |
| OSWCEB | Opportunistic stationary wireless-charged electric bus |
| OHWCEB | Opportunistic hybrid wireless-charged electric bus |
| PCEB | Plug-in charged electric bus |
| WPT | Wireless power transfer |
| Parameter | |
| b | Energy consumption rate of the electric bus (kWh/km) |
| Cinfra | Infrastructure cost of one bus route ($) |
| E | Battery energy capacity (kWh) |
| Ec | The energy consumed at the energy consumption rate of b in Nc cycles (kWh) |
| EE | Effective battery energy capacity (kWh) |
| EH | High limit of the battery level (kWh) |
| EH_H | High limit of the battery level of OHWCEB (kWh) |
| EH_P | High limit of the battery level of PCEB (kWh) |
| EH_S | High limit of the battery level of OSWCEB (kWh) |
| EL | Low limit of the battery level (kWh) |
| EL_H | Low limit of the battery level of OHWCEB (kWh) |
| EL_P | Low limit of the battery level of PCEB (kWh) |
| EL_S | Low limit of the battery level of OSWCEB (kWh) |
| Em,n | The amount of energy supplied by the nth stop of the mth cycle (kWh) |
| EOSWCEB | Battery energy capacity of the OSWCEB (kWh) |
| l | Length of the power track installed near each stop (m) |
| L | Length of the circular route (km) |
| ln | Length of the power track installed near the nth stop (m) |
| M | Mass of the battery (kg) |
| MBus | Mass of the plug-in charged electric bus (kg) |
| MBusi | Mass of the plug-in charged electric bus of the ith iteration (kg) |
| Mc | The battery mass corresponding to the battery energy of Ec (kg) |
| NBus | The number of electric buses operating on the route |
| Nc | The number of cycle during a day |
| Nd | The number of working days of the bus per year (d) |
| Ns | The number of stop of the round trip |
| Ny | Battery life (y) |
| OCS | Operation cost saving ($) |
| P | Charging power referring to input power of the wireless charger (kW) |
| paux | Price of per set of auxiliary equipment ($/each) |
| pb | Battery cost per unit of energy capacity ($) |
| pcoil | Price of per transmitting coil ($/each) |
| pe | Price of electricity per kilowatt-hour ($) |
| Pout | Output power of the wireless charger (kW) |
| ptrack | Price of power track per unit meter ($/m) |
| PCS | Production cost saving ($) |
| t | Average stop time at each stop (s) |
| tm,n | Charging time of the nth stop of the mth cycle (s) |
| TCS | Total cost saving ($) |
| v | Average speed of the OHWCEB passing through power track in each cycle (km/h) |
| vm,n | Average speed of OHWCEB passing through the nth power track in the mth cycle (km/h) |
| α | Battery gravimetric energy density (kWh/kg) |
| β | Proportion coefficient between b and MBus |
| λ | Limit parameter of the battery level equal to the difference between λH and λL |
| λH | Upper limit coefficient set to maximize the battery life |
| λL | Lower limit coefficients set to maximize the battery life |
| η | Efficiency of the wireless charger (%) |
| ηd | Efficiency of the dynamic wireless-charging system (%) |
| ηs | Efficiency of the stationary wireless-charging system (%) |
| Δbi | Variation of energy consumption rate of the ith iteration (kWh/km) |
| ΔEECR | Battery energy capacity reduction contributed by the reduction of ECR (kWh) |
| ΔEECR_lifetime | Energy reduction due to the reduction of ECR during the lifetime of the battery (kWh) |
| ΔEi | Reduction of battery energy capacity of the ith iteration (kW) |
| ΔEWPT | Total amount of energy supplied by wireless-charging systems (kWh) |
| ΔEα | The battery energy capacity reduction contributed by the change of the battery gravimetric energy density (kWh) |
| ΔEΣ | Total battery energy capacity reduction (kWh) |
| ΔMi | Reduction of battery mass of the ith iteration (kg) |
| ΔEΣ | Total battery mass reduction (kg) |
Appendix A
Considering the Equations (4)–(12), Equation (9) can be simplified as Equation (A1):
It is defined that,
Next, we are to prove that q < 1.
If it is defined that Ec (kWh) is the energy consumed at the ECR of b in Nc cycles, then Ec can be expressed as Equation (A3):
The battery mass (Mc, kg) corresponding to Ec can be obtained from Equation (A4):
Considering Equations (A3) and (A4), Equation (A2) can be rewritten as Equation (A5):
Obviously, Mc < MBus. So, q < 1.
Therefore, the infinite series of Equation (A1) is convergent, when i tends to infinity. Then, Equation (13) can be easily obtained. EH_P, EH_S and EH_H are the high battery levels of PCEB, OSWCEB and OSWCEB respectively; EL_P, EL_S and EL_H are the low battery levels of PCEB, OSWCEB and OSWCEB
References
- Varga, B.O.; Sagoian, A.; Mariasiu, F. Prediction of Electric Vehicle Range: A Comprehensive Review of Current Issues and Challenges. Energies 2019, 12, 19. [Google Scholar] [CrossRef]
- Yuan, X.; Zhang, C.; Hong, G.; Huang, X.; Li, L. Method for evaluating the real-world driving energy consumptions of electric vehicles. Energy 2017, 141, 1955–1968. [Google Scholar] [CrossRef]
- Amjad, M.; Ahmad, A.; Rehmani, M.H.; Umer, T. A review of EVs charging: From the perspective of energy optimization, optimization approaches, and charging techniques. Transp. Res. Part D Transp. Environ. 2018, 62, 386–417. [Google Scholar] [CrossRef]
- Etacheri, V.; Marom, R.; Elazari, R.; Salitra, G.; Aurbach, D. Challenges in the development of advanced Li-ion batteries: A review. Energy Environ. Sci. 2011, 4, 3243–3262. [Google Scholar] [CrossRef]
- Liu, D.; Song, Y.; Li, L.; Liao, H.; Peng, Y. On-line life cycle health assessment for lithium-ion battery in electric vehicles. J. Clean. Prod. 2018, 199, 1050–1065. [Google Scholar] [CrossRef]
- Gerssen-Gondelach, S.J.; Faaij, A.P.C. Performance of batteries for electric vehicles on short and longer term. J. Power Sources 2012, 212, 111–129. [Google Scholar] [CrossRef]
- Lipu, M.S.H.; Hannan, M.A.; Hussain, A.; Hoque, M.M.; Ker, P.J.; Saad, M.H.M.; Ayob, A. A review of state of health and remaining useful life estimation methods for lithium-ion battery in electric vehicles: Challenges and recommendations. J. Clean. Prod. 2018, 205, 115–133. [Google Scholar] [CrossRef]
- Hannan, M.A.; Hoque, M.M.; Hussain, A.; Yusof, Y.; Ker, P.J. State-of-the-Art and Energy Management System of Lithium-Ion Batteries in Electric Vehicle Applications: Issues and Recommendations. IEEE Access 2018, 6, 19362–19378. [Google Scholar] [CrossRef]
- Sample, A.P.; Meyer, D.T.; Smith, J.R. Analysis, Experimental Results, and Range Adaptation of Magnetically Coupled Resonators for Wireless Power Transfer. IEEE Trans. Ind. Electron. 2011, 58, 544–554. [Google Scholar] [CrossRef]
- Chen, G.D.; Rao, C.; Sun, Y.; Chen, Z.X.; Tang, C.S.; Zhang, Z.P. Primary Control Method of Wireless Charging System Based on Load Characteristics. Energies 2019, 12, 17. [Google Scholar] [CrossRef]
- Joseph, P.K.; Elangovan, D. A review on renewable energy powered wireless power transmission techniques for light electric vehicle charging applications. J. Energy Storage 2018, 16, 145–155. [Google Scholar] [CrossRef]
- Zhang, Z.; Pang, H.; Georgiadis, A.; Cecati, C. Wireless Power Transfer—An Overview. IEEE Trans. Ind. Electron. 2019, 66, 1044–1058. [Google Scholar] [CrossRef]
- Bi, Z.C.; Kan, T.; Mi, C.C.; Zhang, Y.M.; Zhao, Z.M.; Keoleian, G.A. A review of wireless power transfer for electric vehicles: Prospects to enhance sustainable mobility. Appl. Energy 2016, 179, 413–425. [Google Scholar] [CrossRef] [Green Version]
- Sanchez-Sutil, F.; Hernández, J.C.; Tobajas, C. Overview of electrical protection requirements for integration of a smart DC node with bidirectional electric vehicle charging stations into existing AC and DC railway grids. Electr. Power Syst. Res. 2015, 122, 104–118. [Google Scholar] [CrossRef]
- Hernandez, J.C.; Sutil, F.S.; Vidal, P.G. Protection of a multiterminal DC compact node feeding electric vehicles on electric railway systems, secondary distribution networks, and PV systems. Turk. J. Electr. Eng. Comput. Sci. 2016, 24, 3123–3143. [Google Scholar] [CrossRef]
- Sun, L.; Ma, D.; Tang, H. A review of recent trends in wireless power transfer technology and its applications in electric vehicle wireless charging. Renew. Sustain. Energy Rev. 2018, 91, 490–503. [Google Scholar] [CrossRef]
- Vaka, R.; Keshri, R.K. Review on Contactless Power Transfer for Electric Vehicle Charging. Energies 2017, 10, 20. [Google Scholar]
- Panchal, C.; Stegen, S.; Lu, J. Review of static and dynamic wireless electric vehicle charging system. Eng. Sci. Technol. Int. J. 2018, 21, 922–937. [Google Scholar] [CrossRef]
- Lukic, S.; Pantic, Z. Cutting the Cord: Static and Dynamic Inductive Wireless Charging of Electric Vehicles. IEEE Electrif. Mag. 2013, 1, 57–64. [Google Scholar] [CrossRef]
- Jeong, S.; Jang, Y.J.; Kum, D. Economic Analysis of the Dynamic Charging Electric Vehicle. IEEE Trans. Power Electron. 2015, 30, 6368–6377. [Google Scholar] [CrossRef]
- Yang, C.; Lou, W.; Yao, J.; Xie, S. On Charging Scheduling Optimization for a Wirelessly Charged Electric Bus System. IEEE Trans. Intell. Transp. Syst. 2018, 19, 1814–1826. [Google Scholar] [CrossRef]
- Jang, Y.J.; Suh, E.S.; Kim, J.W. System Architecture and Mathematical Models of Electric Transit Bus System Utilizing Wireless Power Transfer Technology. IEEE Syst. J. 2016, 10, 495–506. [Google Scholar] [CrossRef]
- Hwang, I.; Jang, Y.J.; Ko, Y.D.; Lee, M.S. System Optimization for Dynamic Wireless Charging Electric Vehicles Operating in a Multiple-Route Environment. IEEE Trans. Intell. Transp. Syst. 2018, 19, 1709–1726. [Google Scholar] [CrossRef]
- Bi, Z.C.; Song, L.J.; De Kleine, R.; Mi, C.C.; Keoleian, G.A. Plug-in vs. wireless charging: Life cycle energy and greenhouse gas emissions for an electric bus system. Appl. Energy 2015, 146, 11–19. [Google Scholar] [CrossRef] [Green Version]
- Bailey, J.R.; Hairr, M.E. Wayside Charging and Hydrogen Hybrid Bus: Extending the Range of Electric Shuttle Buses; Department of Transportation Federal Transit Administration: Washing, DC, USA, 2012.
- Ahn, S.; Suh, N.P.; Cho, D. Charging up the road. IEEE Spectr. 2013, 50, 48–54. [Google Scholar] [CrossRef]
- Ko, Y.D.; Jang, Y.J. The Optimal System Design of the Online Electric Vehicle Utilizing Wireless Power Transmission Technology. IEEE Trans. Intell. Transp. Syst. 2013, 14, 1255–1265. [Google Scholar] [CrossRef]
- Jang, Y.J.; Jeong, S.; Lee, M.S. Initial Energy Logistics Cost Analysis for Stationary, Quasi-Dynamic, and Dynamic Wireless Charging Public Transportation Systems. Energies 2016, 9, 23. [Google Scholar] [CrossRef]
- Patnaik, L.; Huynh, P.S.; Vincent, D.; Williamson, S.S. Wireless Opportunity Charging as an Enabling Technology for EV Battery Size Reduction and Range Extension: Analysis of an Urban Drive Cycle Scenario. In Proceedings of the 2018 IEEE PELS Workshop on Emerging Technologies: Wireless Power Transfer (Wow), Montréal, QC, Canada, 3–7 June 2018; pp. 1–5. [Google Scholar]
- Kalwar, K.A.; Aamir, M.; Mekhilef, S. Inductively coupled power transfer (ICPT) for electric vehicle charging—A review. Renew. Sustain. Energy Rev. 2015, 47, 462–475. [Google Scholar] [CrossRef]
- Bunsen, T.; Cazzola, P.; Gorner, M.; Paoli, L.; Scheffer, S.; Schuitmaker, R.; Tattini, J.; Teter, J. Global EV Outlook 2018: Towards Cross-Modal Electrification; International Energy Agency: Paris, France, 2018. [Google Scholar]
- Gao, Y.; Jiang, J.C.; Zhang, C.P.; Zhang, W.G.; Ma, Z.Y.; Jiang, Y. Lithium-ion battery aging mechanisms and life model under different charging stresses. J. Power Sources 2017, 356, 103–114. [Google Scholar] [CrossRef]
- Xiong, R.; He, H.W.; Sun, F.C.; Zhao, K. Evaluation on State of Charge Estimation of Batteries with Adaptive Extended Kalman Filter by Experiment Approach. IEEE Trans. Veh. Technol. 2013, 62, 108–117. [Google Scholar] [CrossRef]
- Zheng, Y.; Ouyang, M.; Lu, L.; Li, J.; Han, X.; Xu, L.; Ma, H.; Dollmeyer, T.A.; Freyermuth, V. Cell state-of-charge inconsistency estimation for LiFePO4 battery pack in hybrid electric vehicles using mean-difference model. Appl. Energy 2013, 111, 571–580. [Google Scholar] [CrossRef]
- Birkl, C.R.; Roberts, M.R.; McTurk, E.; Bruce, P.G.; Howey, D.A. Degradation diagnostics for lithium ion cells. J. Power Sources 2017, 341, 373–386. [Google Scholar] [CrossRef]
- Marano, V.; Onori, S.; Guezennec, Y.; Rizzoni, G.; Madella, N. Lithium-ion Batteries Life Estimation for Plug-in Hybrid Electric Vehicles. In Proceedings of the 2009 IEEE Vehicle Power and Propulsion Conference, Dearborn, MI, USA, 7–10 September 2009; Volumes 1–3, pp. 476–483. [Google Scholar]
- Tang, L.; Rizzoni, G.; Onori, S. Energy Management Strategy for HEVs Including Battery Life Optimization. IEEE Trans. Transp. Electrif. 2015, 1, 211–222. [Google Scholar] [CrossRef]
- Samad, N.A.; Kim, Y.; Siegel, J.B.; Stefanopoulou, A.G. Influence of Battery Downsizing and SOC Operating Window on Battery Pack Performance in a Hybrid Electric Vehicle. In Proceedings of the 2015 IEEE Vehicle Power and Propulsion Conference (VPPC), Montreal, QC, Canada, 19–22 October 2015; pp. 1–6. [Google Scholar]
Figure 1.
Configuration of the basic structure of wireless-charging system for electric bus.
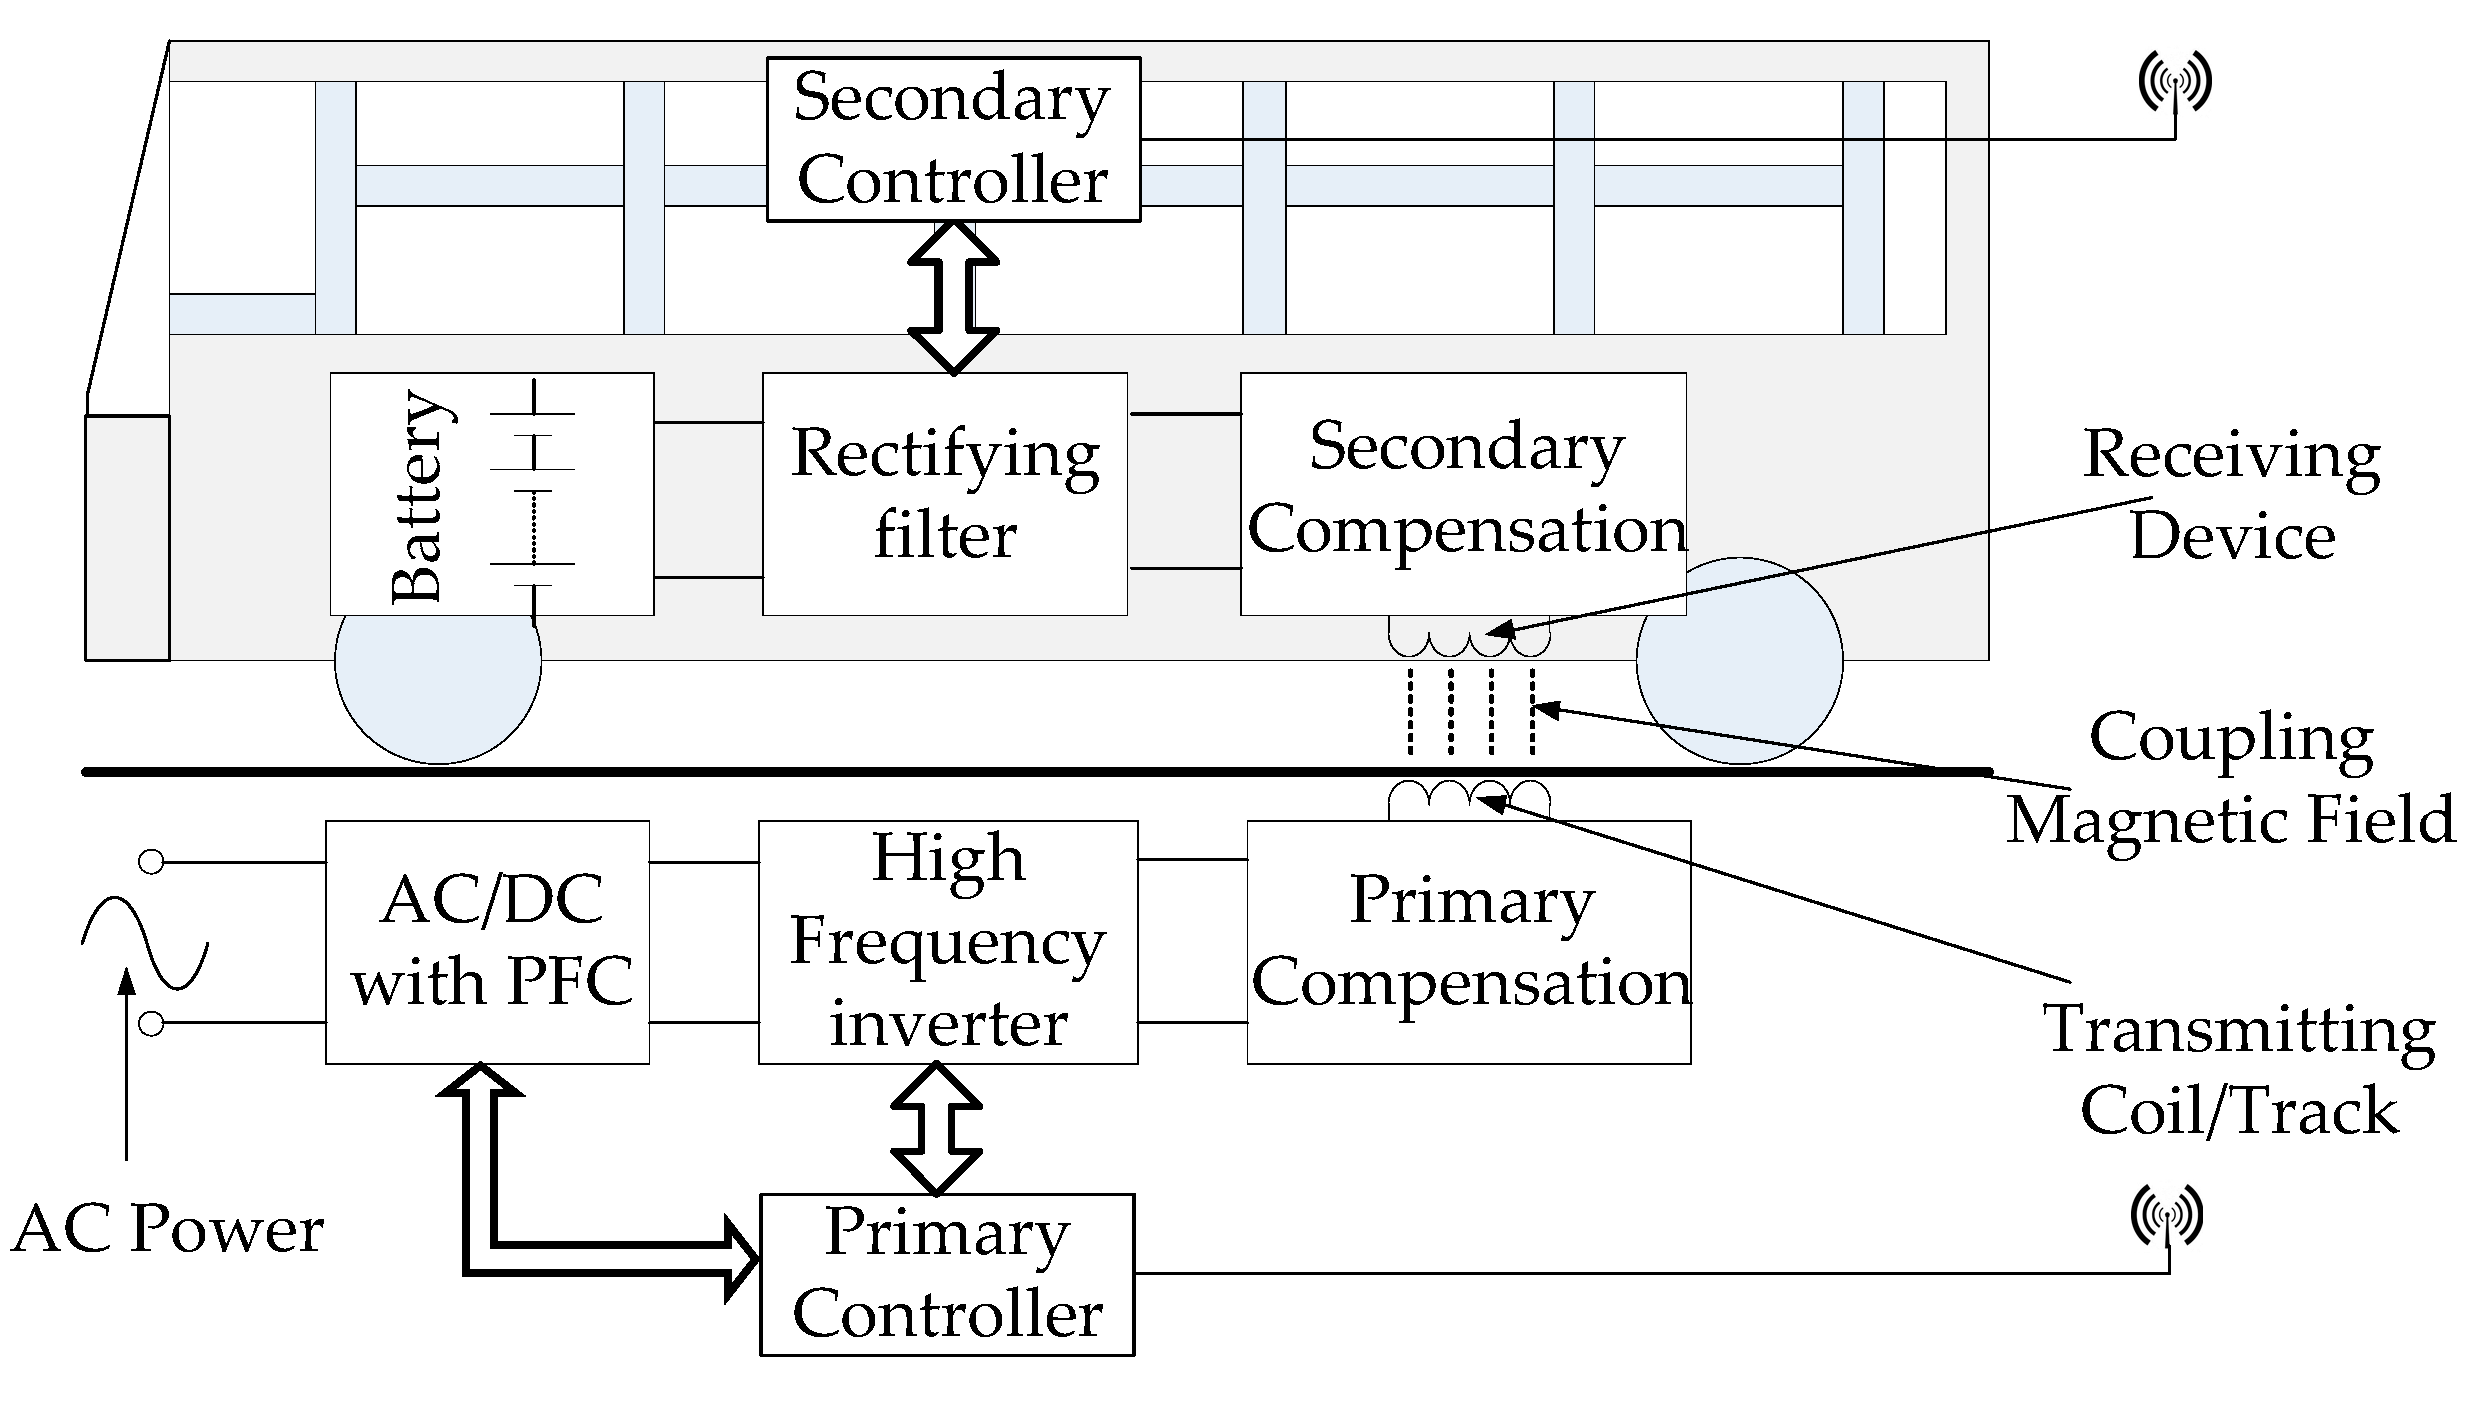
Figure 2.
Relationship between energy consumption rate (ECR) and the mass of the electric bus.
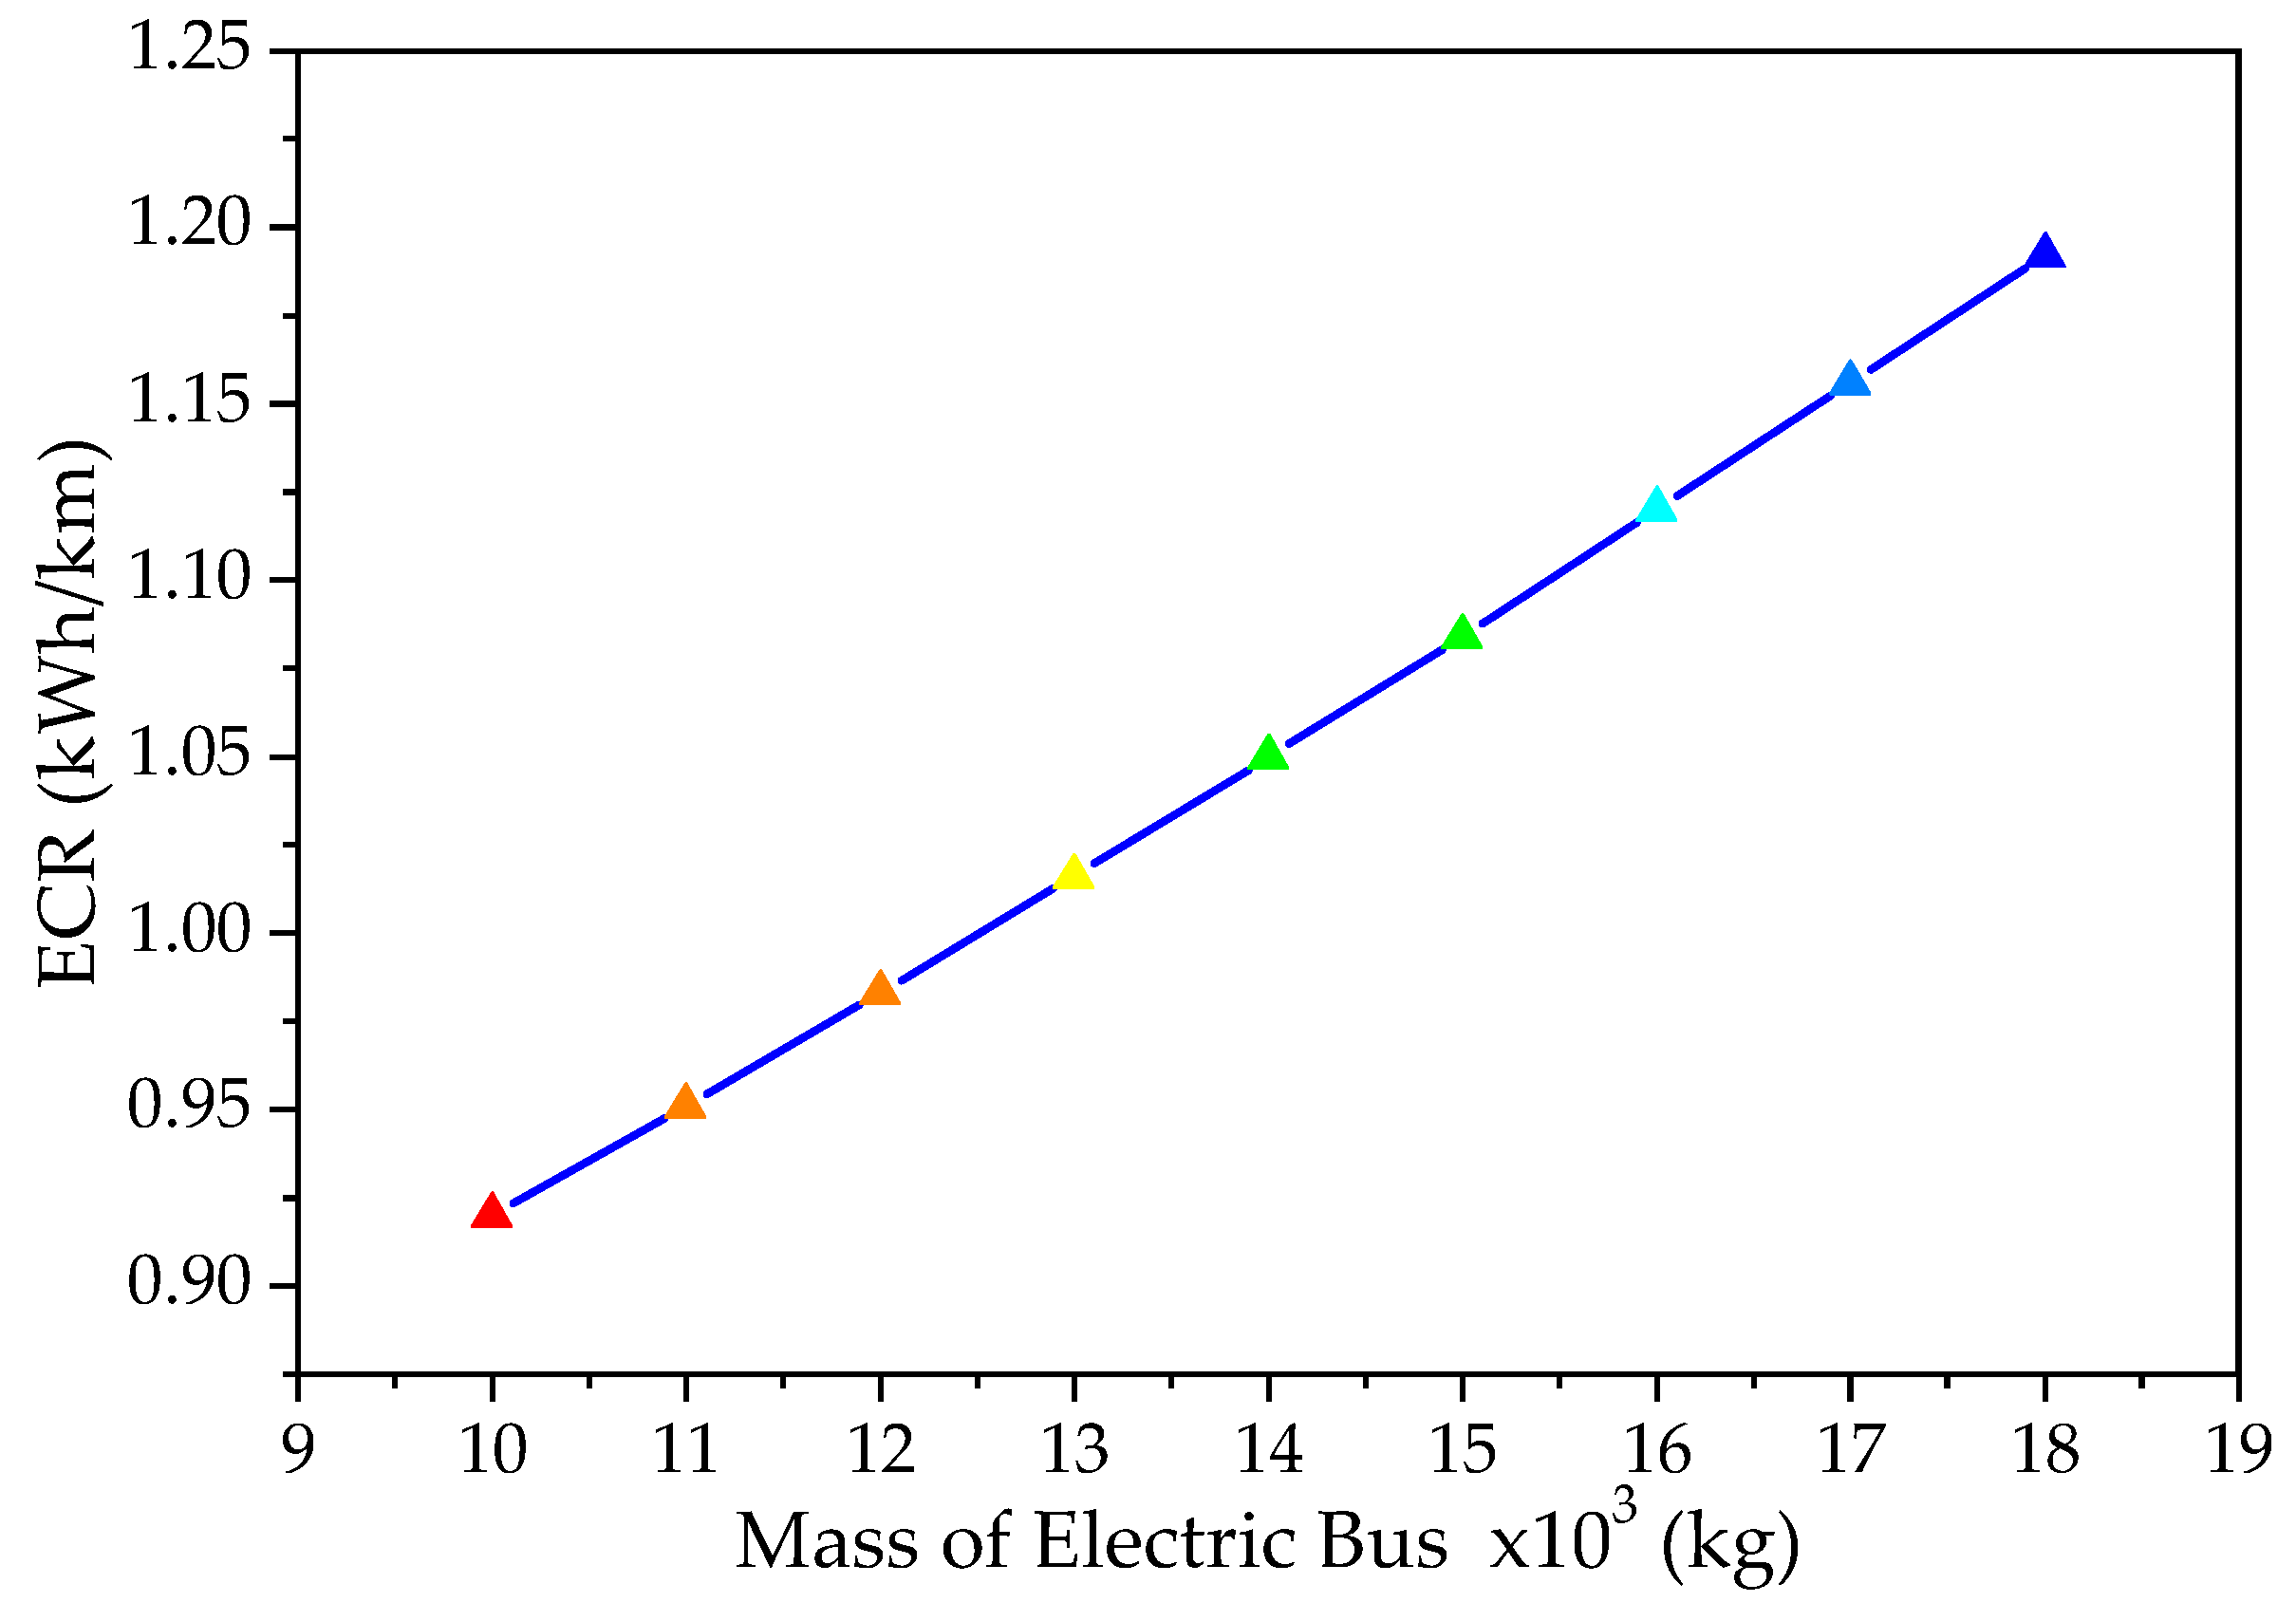
Figure 3.
The schematic diagram of the opportunistic stationary wireless-charging scenario for an electric bus.
Figure 3.
The schematic diagram of the opportunistic stationary wireless-charging scenario for an electric bus.
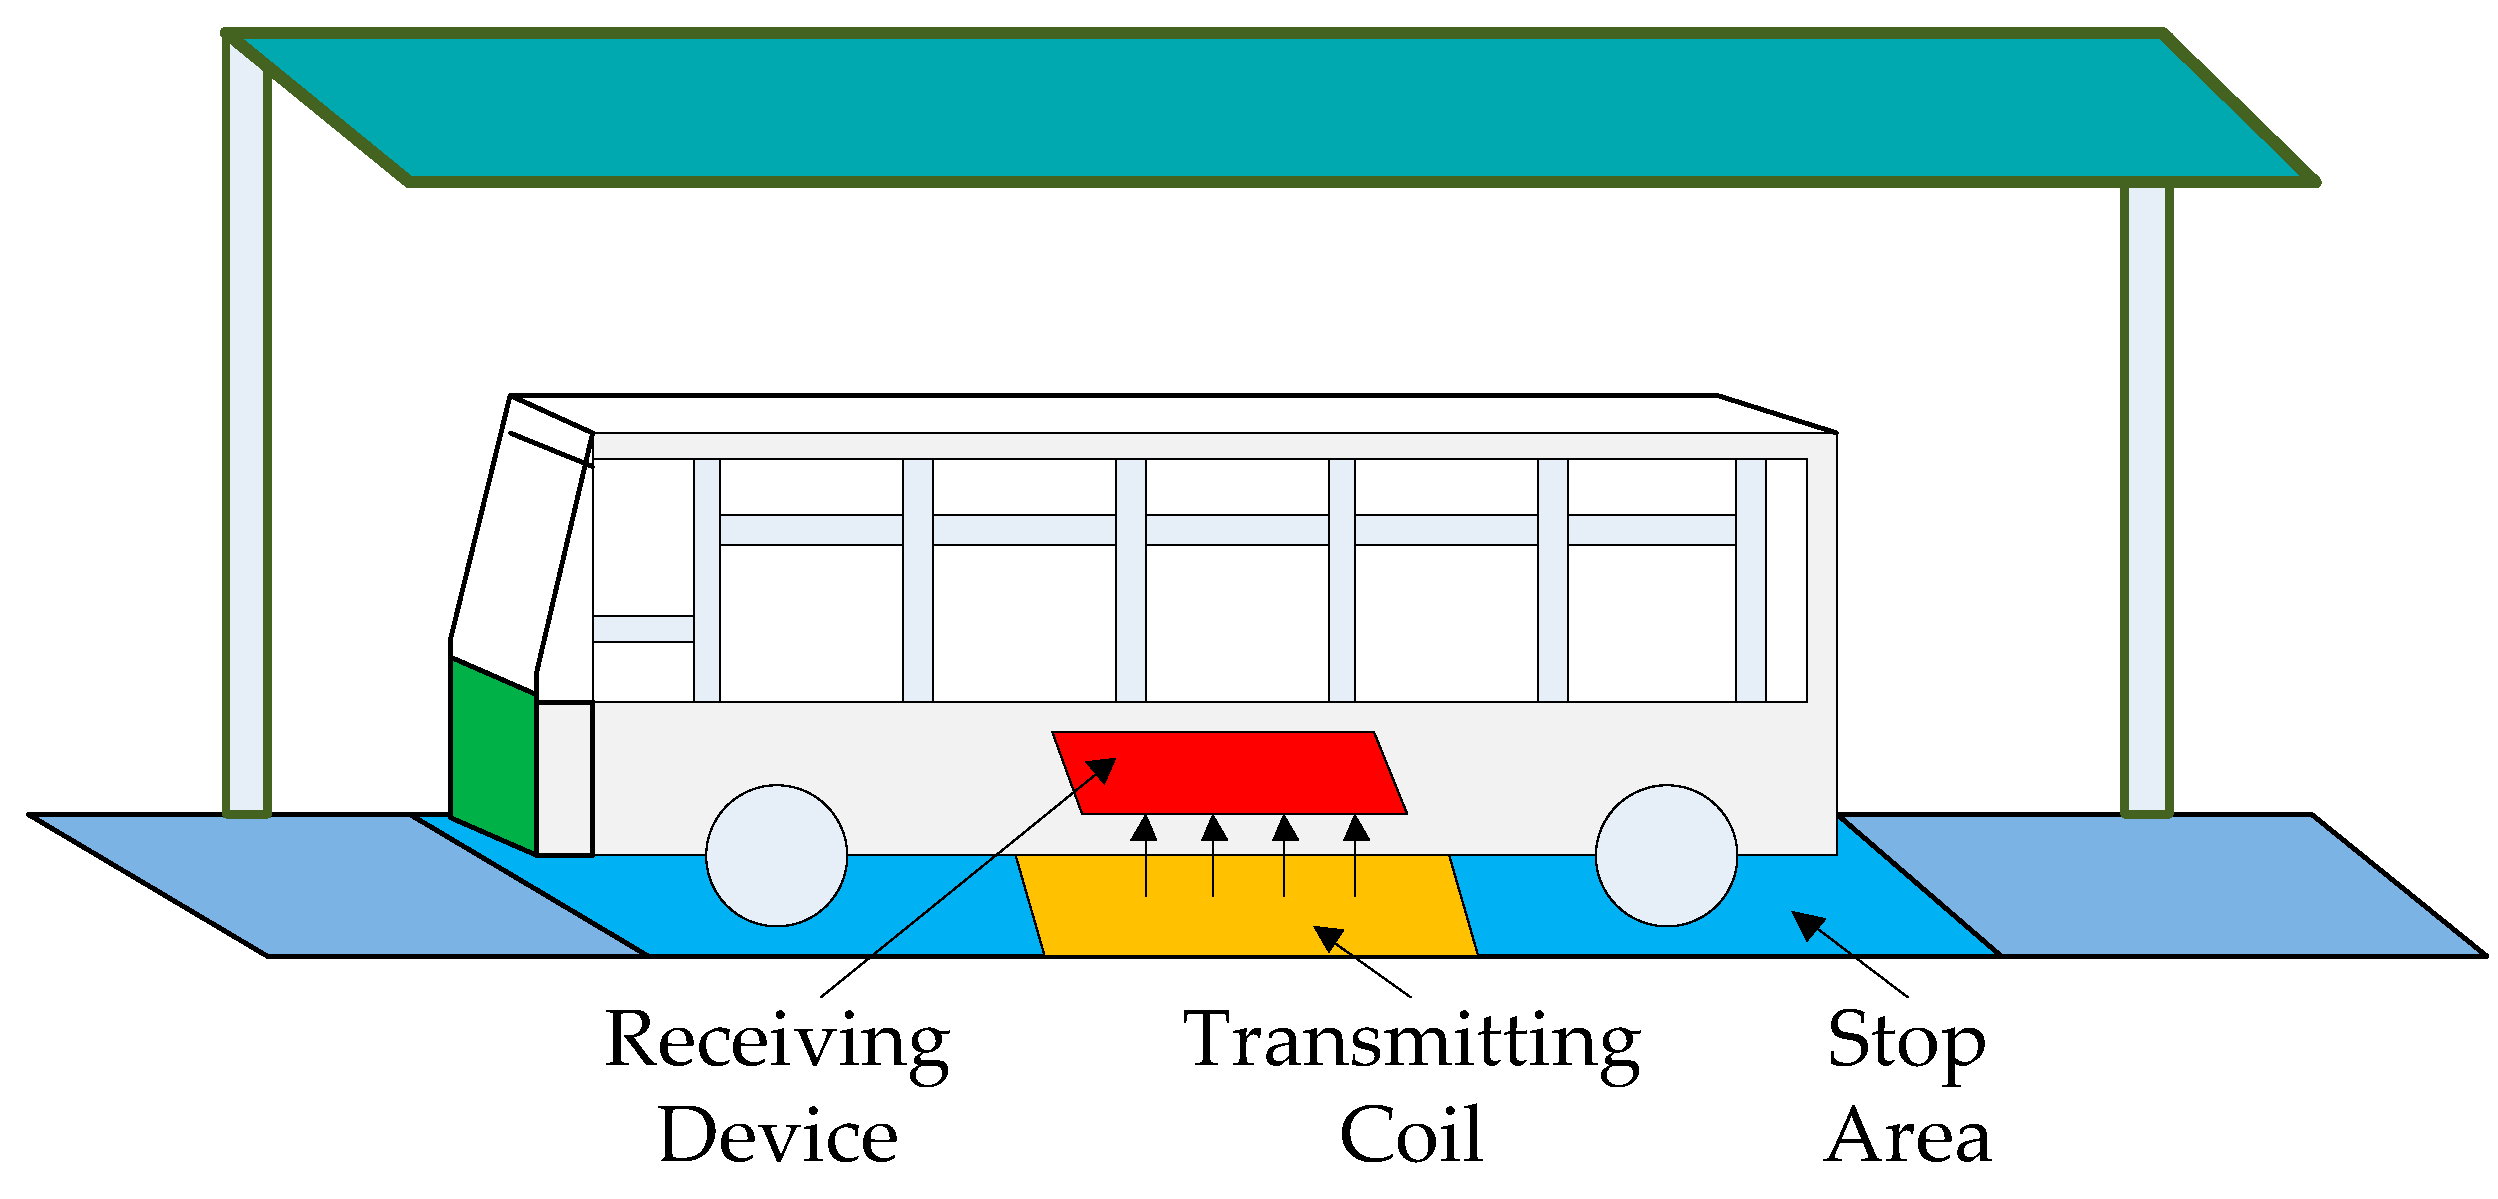
Figure 4.
The schematic diagram of the opportunistic hybrid wireless charging scenario for electric bus.
Figure 4.
The schematic diagram of the opportunistic hybrid wireless charging scenario for electric bus.
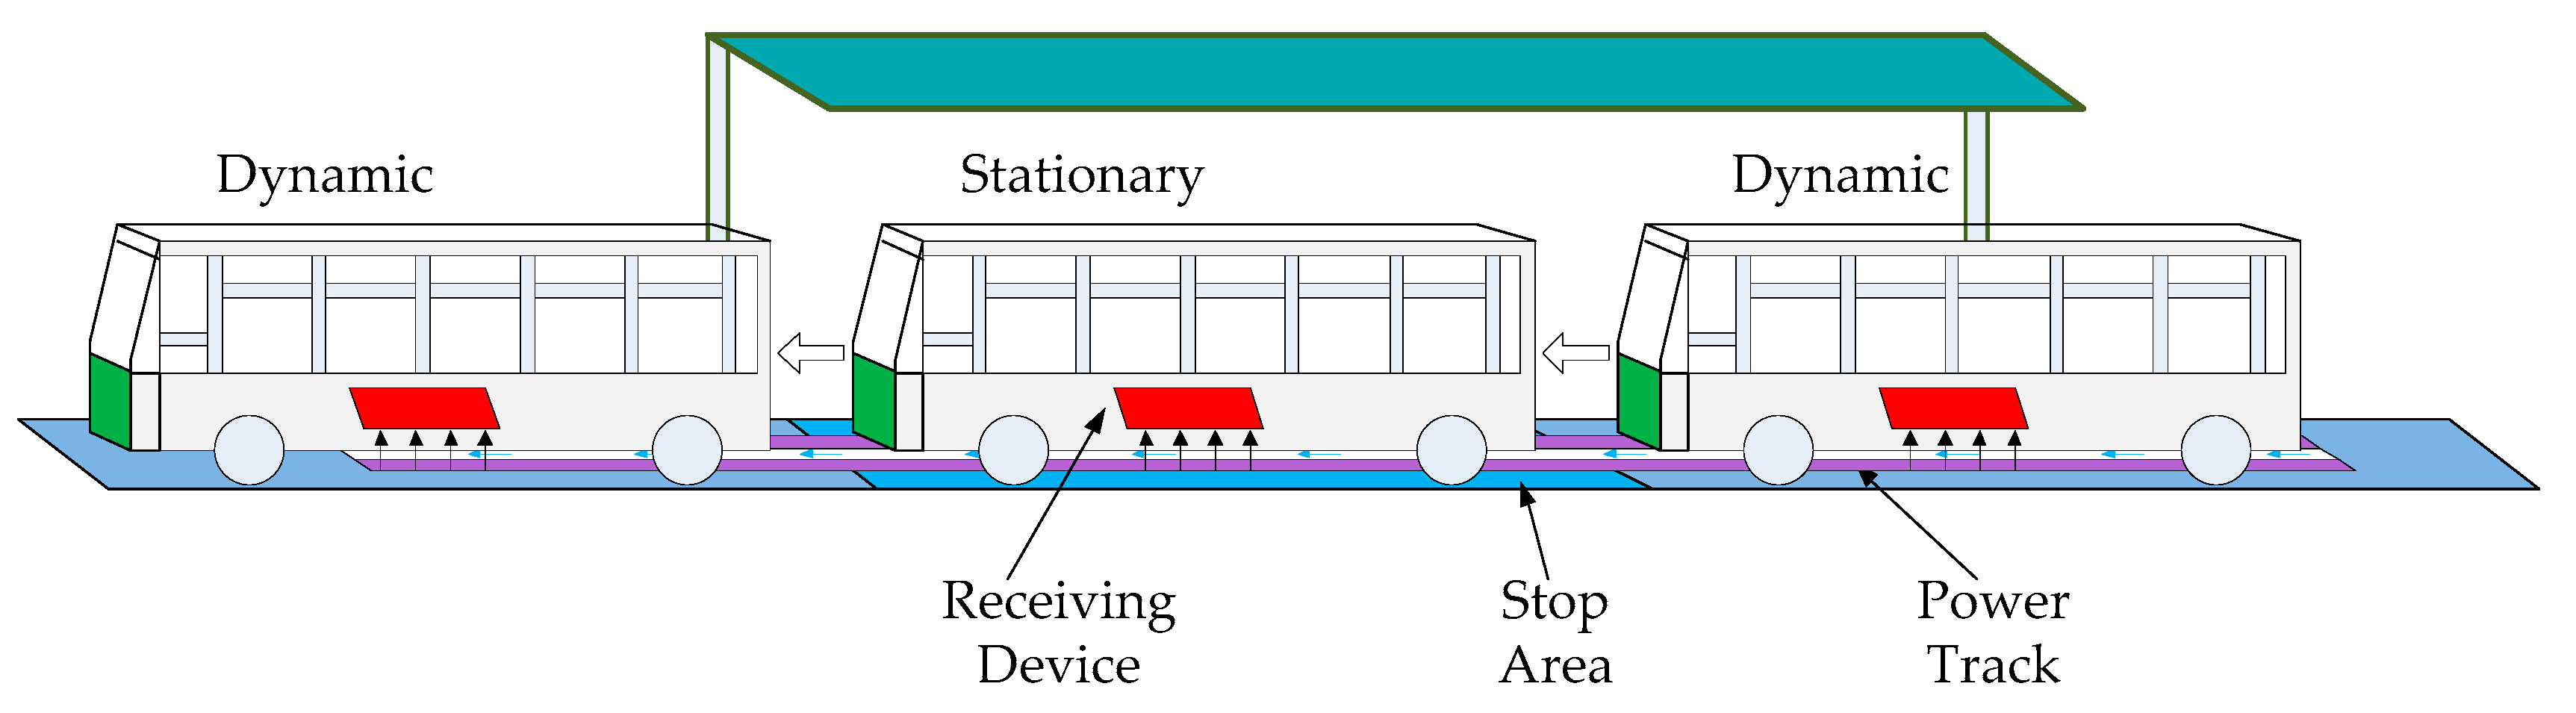
Figure 5.
Battery energy variations of plug-in charged electric bus (PCEB), opportunistic stationary wireless-charged electric bus (OSWCEB) and opportunistic hybrid wireless-charged electric bus (OHWCEB) during one full discharging-charging cycle. (EH_P, EH_S and EH_H are the high battery levels of PCEB, OSWCEB and OSWCEB respectively; EL_P, EL_S and EL_H are the low battery levels of PCEB, OSWCEB and OSWCEB respectively.).
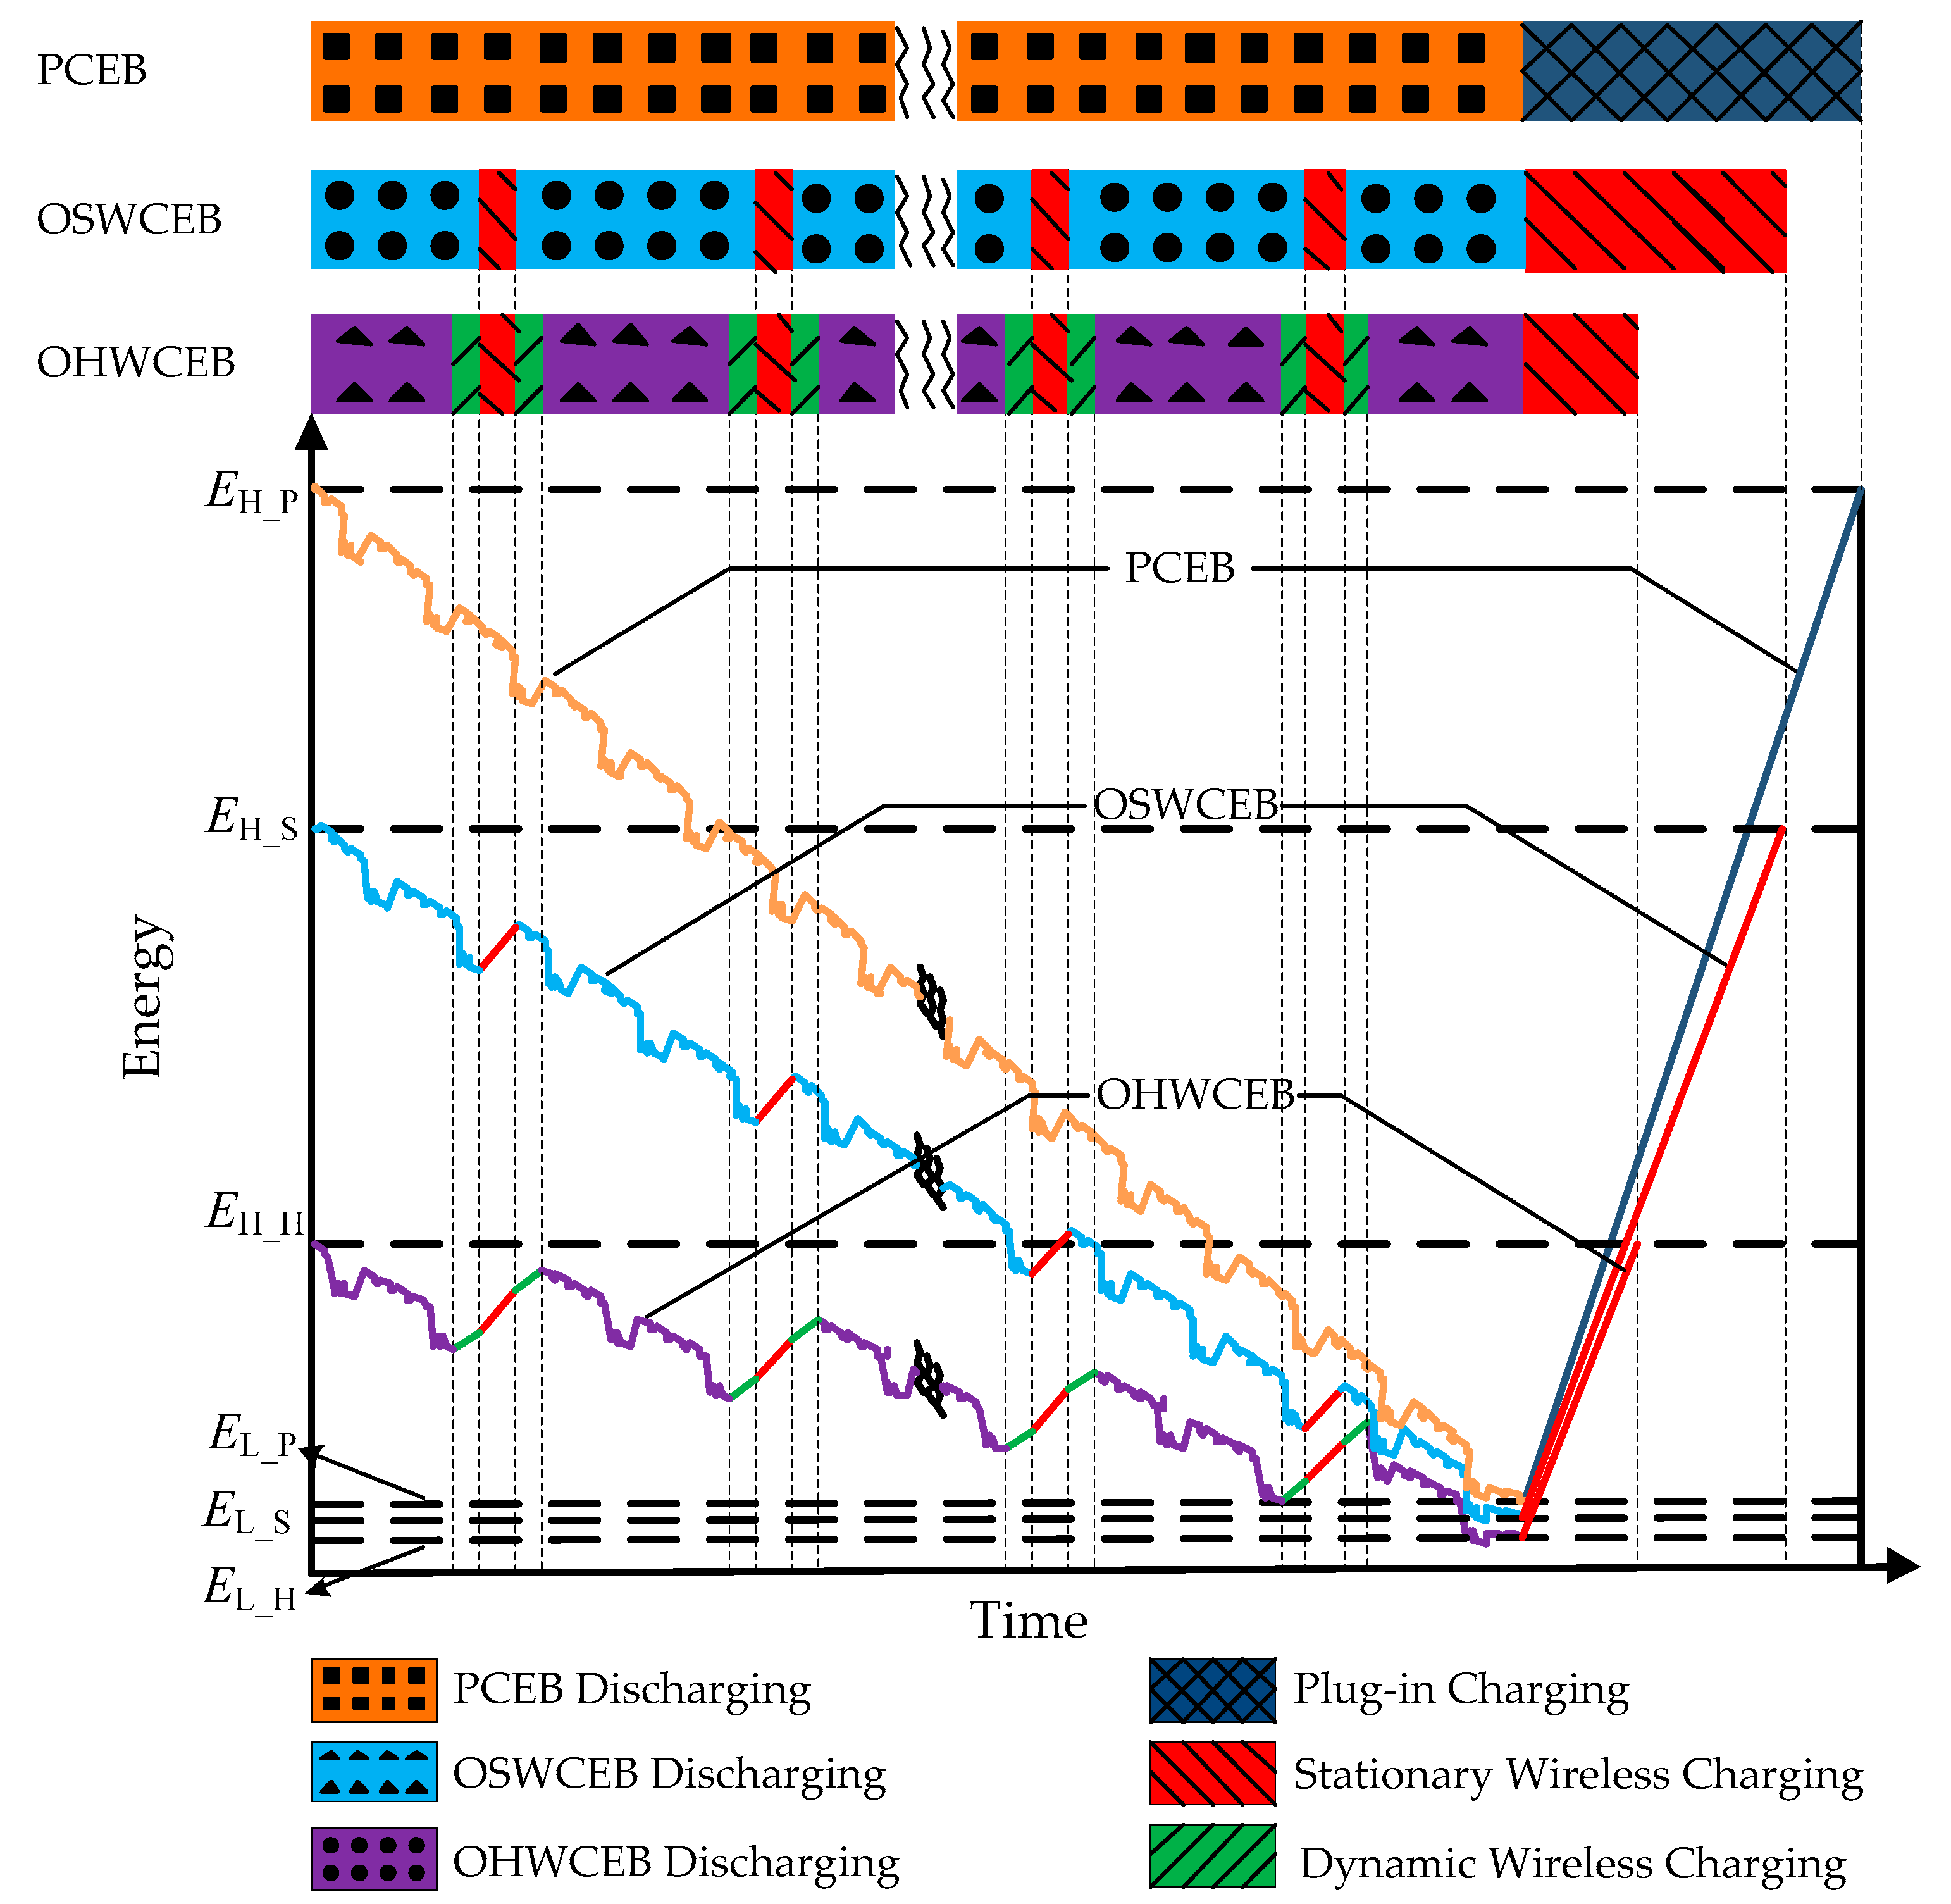
Figure 6.
The bus route in Hefei, Anhui, China used in the simulation.

Figure 7.
The effects of the battery gravimetric energy density.

Figure 8.
The effects of the number of cycles.

Figure 9.
The effects of the charging time on the battery energy capacity reduction under different charging power.
Figure 9.
The effects of the charging time on the battery energy capacity reduction under different charging power.
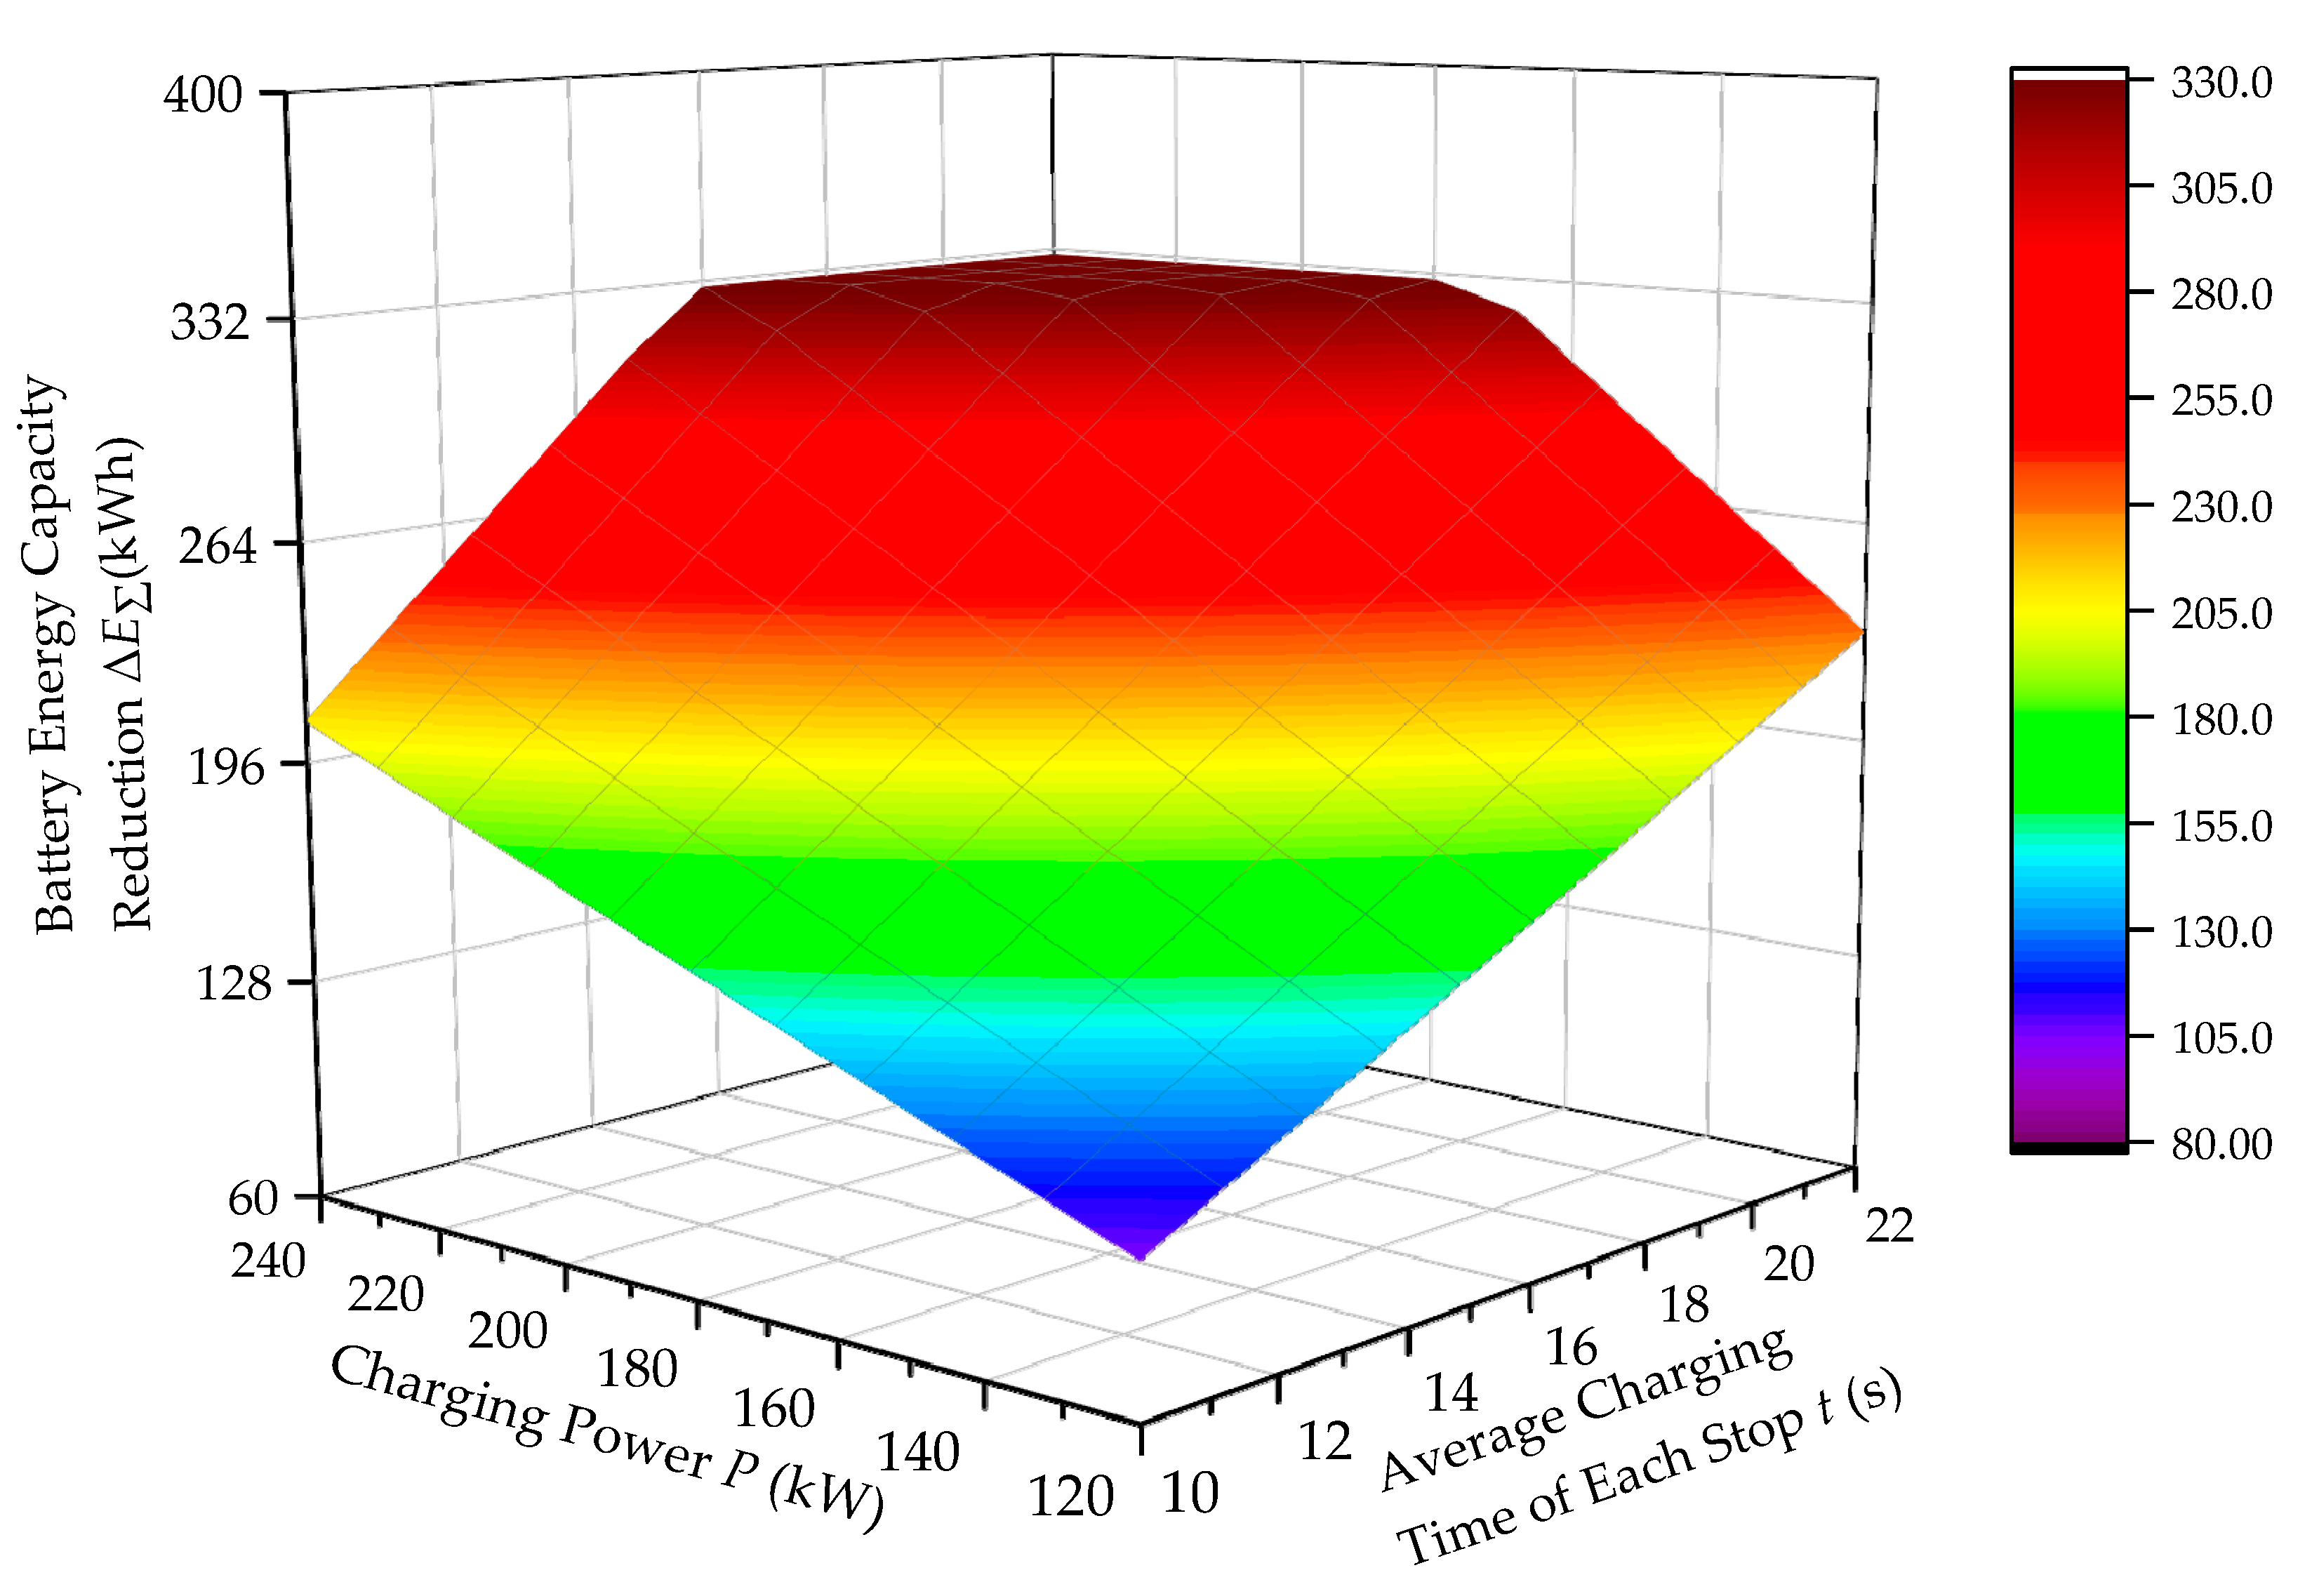
Figure 10.
The effects of the length of power track and average speed of the bus passing through the power track on the battery energy capacity reduction.
Figure 10.
The effects of the length of power track and average speed of the bus passing through the power track on the battery energy capacity reduction.

Table 1.
The parameters of the plug-in charged electric bus.
| Notation | Value |
|---|---|
| Mass of the electric bus (kg): MBus0 | 13,900 |
| ECR of the electric bus (kWh/km): b0 | 0.96 |
| Battery energy capacity (kWh): E0 | 332 |
| Mass of the battery pack (kg): M0 | 2768 |
| Battery gravimetric energy density (kWh/kg): α0 | 0.12 |
Table 2.
The input parameters for the numerical example.
| Notation | Value |
|---|---|
| Length of the circular route (km): L0 | 35 |
| The number of cycles during a day: Nc0 | 6 |
| The number of stop of the round trip: Ns0 | 52 |
| The output power of the wireless charger (kW): Pout | 200 |
| Average stop time at each stop (s): t0 | 11 |
| Length of the power track installed near each stop (m): l0 | 24 |
| Average speed of the OHWCEB passing through power track in each cycle (km/h): v0 | 20 |
| Efficiency of the stationary wireless-charging system (%): ηs0 | 95 |
| Efficiency of the dynamic wireless-charging system (%): ηd0 | 85 |
| Price of electricity per kilowatt-hour ($/kWh): pe0 | 0.1394 |
| Battery cost per unit of energy capacity ($/kWh): pb0 | 400 |
| Price of per transmitting coil: pcoil0 ($/each) | 60 |
| Price of per set of auxiliary equipment: paux0 ($/each) | 5000 |
| Price of power track per unit meter: ptrack0 ($/m) | 60 |
| The number of electric bus operating on the route: NBus0 | 12 |
| The number of working days of the bus per year (d): Nd0 | 350 |
| Battery life (y): Ny0 | 10 |
| Limit parameter of the battery level: λ0 | 0.6 |
Table 3.
The results of the numerical example.
| Notation | Value 1 (OSWCEB) | Value 2 (OHWCEB) |
|---|---|---|
| Battery energy capacity reduction (kWh): ΔEΣ | 201.63 | 304.16 |
| Battery mass reduction (kg): ΔMΣ | 1680.28 | 2534.67 |
| Battery energy capacity reduction contributed by the reduction of ECR (kWh): ΔEECR | 10.97 | 16.54 |
| Production cost saving ($): PCS | 80,653.28 | 121,664.36 |
| Operation cost saving ($): OCS | 5352.26 | 8071.28 |
| Total cost saving ($): TCS | 64,078.87 | 101,828.97 |
© 2019 by the authors. Licensee MDPI, Basel, Switzerland. This article is an open access article distributed under the terms and conditions of the Creative Commons Attribution (CC BY) license (http://creativecommons.org/licenses/by/4.0/).
Share and Cite
MDPI and ACS Style
Yin, A.; Wu, S.; Li, W.; Hu, J. Analysis of Battery Reduction for an Improved Opportunistic Wireless-Charged Electric Bus. Energies 2019, 12, 2866. https://doi.org/10.3390/en12152866
AMA Style
Yin A, Wu S, Li W, Hu J. Analysis of Battery Reduction for an Improved Opportunistic Wireless-Charged Electric Bus. Energies. 2019; 12(15):2866. https://doi.org/10.3390/en12152866
Chicago/Turabian StyleYin, Andong, Shenchun Wu, Weihan Li, and Jinfang Hu. 2019. "Analysis of Battery Reduction for an Improved Opportunistic Wireless-Charged Electric Bus" Energies 12, no. 15: 2866. https://doi.org/10.3390/en12152866
Note that from the first issue of 2016, this journal uses article numbers instead of page numbers. See further details here.