Modelling the EU Internal Electricity Market: The PRIMES-IEM Model

E3MLab – Energy Economy Environment Modelling Laboratory, National Technical University of Athens, 15773 Athens, Greece
*
Author to whom correspondence should be addressed.
Energies 2019, 12(15), 2887; https://doi.org/10.3390/en12152887
Submission received: 10 June 2019
/
Revised: 17 July 2019
/
Accepted: 24 July 2019
/
Published: 26 July 2019
(This article belongs to the Special Issue Climate Changes and Energy Markets)
Abstract
:The paper presents a newly built model used to simulate the European Union (EU) internal electricity market and assess market reform policies. The model performs an hourly simulation of all stages of the wholesale markets at a Pan-European scale, covering the sequence of day-ahead, intra-day, and balancing/reserve auctions. The model includes market coupling in all market stages, estimates scarcity bidding by generators endogenously, and determines electricity trade as a flow-based allocation of interconnections via the market auctions implicitly. The model solves a unit-commitment program, formulated as a mixed-integer optimisation problem, under demand and generation constraints, interconnection possibilities, technical restrictions of the cyclic operation of power plants, and the provision of ancillary services. The novelty of this approach is the inclusion of distortions in all stages of the markets to evaluate the impacts of their removal, and the operation of the markets in a segmented versus an integrated manner in the EU. The model calculates revenues and costs per power plant in the EU on a country basis and the value of cross-border flows. The model evaluated market reform measures, including the abolishment of priority dispatch of renewable energy plants, the establishment of flow-based allocation of interconnectors without NTC limitations, the activation of demand response, and the market coupling in intra-day markets. The model application has been in the context of the electricity market design initiative included in the “Clean Energy for all Europeans” policy package proposed by the European Commission in 2016.
1. Introduction
Over the years, the energy policy of the European Union (EU) has placed great focus on achieving a transition towards a low carbon emission EU energy system effectively, in compliance with the Paris Agreement. The already adopted 2030 EU climate & energy framework, the so-called “Clean Energy for all Europeans” package [1], sets the medium-term targets of the EU energy system as an intermediate step towards the long-term goal of a climate-neutral EU economy by 2050. The European Commission’s (EC) communication “A Clean Planet for all” [2] has explored scenarios foreseeing climate neutrality in the EU by 2050. In this transition process, the role of electricity is crucial to achieving carbon neutrality by 2050, thus putting the new electricity market design rules at the centre of the energy transition.
The EU power system of the future, according to the EC’s energy system scenarios for the EU [3] prepared by the PRIMES (price-induced market equilibrium system) model of E3MLab/NTUA [4], involves a vast penetration of renewables, especially variable renewables. Due to the intermittency of these resources, the expansion of variable renewables raises concerns regarding the adequacy of flexibility and reserve services, as discussed in [5], which are currently the subject of numerous studies, as in [6,7] among others. The completion of the internal energy market and the removal of barriers in the cross-border flow of electricity are key for the successful integration of the large-scale penetration of renewables. Meeting high flexibility and balancing requirements at a national level is less efficient than sharing resources in a broad multi-country market, as discussed in [8,9].
There is a consensus among analysts that currently, the electricity market suffers from distortions and segmentation. The process of market integration towards a fully functional Internal Energy Market is still in progress in the EU, while electricity markets are facing unprecedented challenges, which are emerging as they adapt to meet emissions reduction targets and increase the contribution by renewables [10]. Several distortions are present, see [11], which hinder the cost-efficient operation of the internal market in particular, as the planning foresees integration of renewables at a large scale. Some examples of distortions that persist are the following:
- Unnecessary restrictions of the use of interconnections (due to the setting of Net Transfer Capacity limits from a national, rather than a multi-country, perspective) hampering the optimal utilisation of interconnectors, thus limiting the volume of cross-border trade.
- Illiquid and uncoupled intra-day and balancing markets causing sub-optimal market prices and reducing the cross-border sharing of balancing resources, thus entailing unnecessary costs.
- Priority dispatch privileges granted to a significant part of generation and load, thus undermining the liquidity of the wholesale markets and the cost-effectiveness of costs and plant dispatching in the day-ahead.
- Lack of market liquidity combined with cross-border restrictions implying frequent market splitting in the market coupling and driving non-optimal re-dispatching and unnecessary costs.
- Lack of market participation by renewables and other power resources operating as “must-take”, which otherwise would optimise their operation and would have incentives to forecast the weather accurately to minimise exposure to balancing costs.
- Lack of close coordination in the management of control areas between the transmission system operators in the EU internal market of electricity, implying an increase in reserve and ancillary services costs due to the non-optimal definition of reserve requirements when defined from a national rather than multi-system perspective.
The new market design policy, which was under consideration in the period 2016–2018 (and has been adopted in 2019), had the ambition to improve market functioning by removing the distortions and fully integrate the national markets [12,13].
Our research aims to assess the market design options in terms of costs and effectiveness in the removal of market inefficiencies. A well-functioning electricity market is important for achieving the energy and climate policy targets set out by the European policy because in particular, it enables the transition to high amounts of renewables. In this context, sharing the balancing resources within the internal electricity market of the EU could logically bring benefits. Several non-market barriers currently obstruct the sharing.
The impact assessment of the market design initiative [14], which is part of the “Clean Energy for all Europeans” package of the European Commission, has dealt with the issues of removing electricity market distortions as a means of promoting clean energy and renewables in a cost-effective manner. For this purpose, it was crucial to develop a tool in order to simulate the sequence of the wholesale markets in the presence of increasing amounts of renewables, and to assess in this context various electricity market design options, including rules for merit order dispatching, market coupling, regional coordination of system operation, and the enhanced use of interconnectors.
This paper aims to propose a newly designed large-scale empirical model of the electricity systems and markets of Europe, which is useful for assessing the cost-effectiveness of various market designs, aiming at a well-functioning Pan-European market of electricity. The PRIMES-IEM model (price-induced market equilibrium system-internal energy market) simulates the electricity market following a staged approach consisting of the day-ahead, intra-day and balancing/reserves markets, estimates marginal system prices, and calculates the revenues and costs of power plants in the wholesale markets. The basic novelty of the model is the representation of different market stages and various policy options regarding the market design rules and the degree of integration of all wholesale market stages in Europe. As the model is very detailed in terms of hourly resolution, the representation of the individual power plants and interconnectors, it is possible to run scenarios and thus to compare the results in order to assess the impacts of various policy options for the market design. The PRIMES-IEM model presented in this paper has been used to assess the impacts of alternative policy options for the impact assessment of the market design initiative. To our knowledge, PRIMES-IEM is the first of the kind large-scale modelling approach which takes into account multiple stages of the electricity markets and can capture a wide variety of policies.
The remainder of this paper is structured as follows. Section 2 includes the literature review, offers a concise description of the PRIMES-IEM modelling approach, and elaborates on the different market features that the model can incorporate. Section 3 describes an application of the model to assess market design options in the context of a low-emissions EU electricity system in the year 2030. Finally, Section 4 concludes by summarising the key functions of the model and the case study results.
2. Modelling the European Electricity Markets
2.1. Existing Literature
Modelling the electricity markets has attracted a lot of attention in the research literature (see [15,16] for an overview). The large majority of the existing literature has a partial representation of the market, focusing on a single stage of the electricity market, usually the day-ahead market, or specific issues of market design. González et al. [17] present a detailed review of different approaches to energy and reserve modelling and undertakes a comparative assessment among the various approaches. Few approaches proposed in the literature dealt with more than one market stages. However, these approaches study specific aspects of the markets and do not propose a full modelling of the markets. Comprehensive modelling, covering the full sequence of markets from the day-ahead up to real-time, is a complex endeavour due to its complexity and computational burden.
Vijay et al. in [18] are among the rare researches that consider the stages of the market to analyse the value of electricity and reserves. The authors use a unit-commitment model to produce the scheduling of plants resulting from a day-ahead market and determine the wholesale electricity prices via the uplift of system marginal prices (SMP) with a mark-up. In the next stage, the modelling approach formulates a reserve model, to simulate the imbalances due to forecast errors and determine the reserve prices. The bidding behaviours of generators is exogenous in this model, and the paper assumes that perfect market competition prevails.
Oggioni et al. [19] study the impact of the priority dispatch policy measure in the European power system by comparing two different market architectures: a market coupling (zonal) and a nodal pricing regime. The model simulates market-clearing for the day-ahead market as a social surplus maximisation problem to represent transactions in a power exchange. In the next stage, the authors formulate a counter-trading model as minimisation of re-dispatching costs, to represent dispatch in real-time. The re-dispatching considers, as a sole driver, the deviations of wind generation between forecasts and real-time.
The modelling presented in the present paper extends the approach of the previously mentioned papers considerably. Firstly, the model considers several factors driving deviations and re-dispatching, including forecasting errors for solar and wind, unexpected variability of demand load and random outages of power plants and interconnections. Secondly, the model represents in detail the technical possibilities of the various power plants and other resources (demand response, storage and others) regarding ramping, cyclical operation, and provision of ancillary services. Thirdly, the model formulates the interconnection power system by respecting the two Kirchhoff’s laws, and not as a transportation network as many models do. Finally, the model fully represents the sequence of the markets, including the day-ahead, intra-day, and balancing markets, as well as the influence of stochasticity for deviations and reserves.
2.2. Overview of the PRIMES-IEM Modelling Approach
The objective of the modelling is to simulate the operation of the power plants in the Pan-European electricity system and markets, and to calculate the costs and revenues of market participants (the term “market participants” refers to generators, power storage operators, and demand responsive consumers) in a sequence of wholesale markets that operate daily, comprising the day-ahead, the intra-day, and the balancing/reserve markets (or reserve procurement procedure). We assume that all markets are pay-as-clear auctions where suppliers and demanders submit stepwise price-quantity bids. Thus, the prices result from the equilibrium between aggregate demand and supply. The determination of the price bidding by market participants is endogenous and of course, influences the market equilibrium. The bidding by consumers constitutes a demand response to market prices. The model assumes that the financial settlements are complete separately in each stage of the sequence of markets. The model bases the simulation of each market on the minimisation of total cost of electricity and ancillary services from the perspective of the buyer of energy or services. The endogenous simulation of the economic bidding by owners of generation resources is guided by profit maximisation. Nonetheless, the formulation does not handle profit maximisation explicitly, but only through a reduced form function which reflects the scarcity of resources and the degree of competition by other resources in the merit order.
The plant scheduling resulting from the day-ahead market is not fully implementable in real-time due to unexpected events, causing deviations. These events relate to forecasting errors of load and renewable generation levels, plants and interconnectors outages, all of which the modelling generates randomly. The intra-day market has the objective to balance resources and deviations, and to determine upward and downward modifications of the dispatching schedule. The market-clearing price is different for upward and downward balancing. The deviations derive from a comparison of the day-ahead scheduling modified by the random event to the results of a unit commitment model run, which uses the bidding in the day-ahead and the random events but also co-optimises for the ancillary services and respect the cyclical operation constraints of the plants. The unit commitment results represent a proxy of how the participants would bid in the intra-day market if they had a close-to-reality expectation regarding the schedule of the real-time operation. Closer to real-time stands the balancing and reserves market, which defines the procurement of ancillary services by a hypothetical transmission system operator (TSO). The eligible suppliers for each type of ancillary service, submit offers for one or more type of services and are remunerated by the clearing prices of the market for reserves (by type), which lay on the demand curve set by the TSO. Table 1 shows the sequence of model operation and Figure 1 provides a schematic representation of the modelling approach.
The newly built PRIMES-IEM model, presented in this paper, is a fully distinct model to the PRIMES energy system model. PRIMES-IEM simulates in detail and with fine resolution of time slices and generation resources the entire sequence of electricity markets operating from the day ahead up to the real-time dispatching. Within the sequence, the model applies stochastic events to derive deviations between the day-ahead scheduling and the intra-day markets. The PRIMES model, in contrast, applies dispatching simulation as a single-shot optimisation of the system and represents the time slices and the resources in a much more aggregated manner, the main aim is to study the long-term evolution of the power systems, and for this reason, it handles power generation and storage endogenously. PRIMES-IEM does not handle capacity expansion but only plant operation derived from the simulation of the markets and not from system optimisation.
The model simulates the simultaneous operation of the sequence of the markets over a Pan-European system, represented as an electricity network consisting of nodes (more than one in some countries) representing load and generation, and arcs representing interconnections. PRIMES-IEM covers all EU 28 member states individually and also represents Norway, Switzerland and the Western Balkan countries in order to account for electricity exchanges between the EU and neighbouring countries.
The model disaggregates the transmission network for the real-time operation to more than one node by country (we consider five nodes for France and Germany, and two nodes for Poland, Austria and Italy. The split of these countries is conducted in such a way as to capture the most important in-country congestions, after consulting relevant literature, as in [20]) to represent in-country grid congestions. The assumptions regarding the interconnections within each country and across the countries change over time, reflecting an exogenously assumed grid investment plan. Existing power capacity of transmission lines and new investments reflect the ENTSO-E data and the TYNDP 2014, as presented in [21]. The technical characteristics of the transmission lines (thermal limits and admittance factors) use statistics collected from TSOs. The flows over interconnectors respect the DC linear power-flow methodology, discussed in [22], which models the Kirchhoff’s laws. Logically, whenever there is no congestion in a linkage, the prices per node converge. Otherwise, they differ, the difference indicating the marginal value of congestion.
Institutional constraints apply to the markets and the use of interconnections, based on assumptions, that the modeller can change across scenarios. Among others, the model can handle nominations as block bidding at a zero price, priority dispatching privileges, administrative determination of prices in a market or a country rather than market-based, net transfer capacity restrictions on flows per pairs of countries, as well as price caps and assumptions about the level of market coupling in each stage of the wholesale markets.
The simulation of the wholesale markets runs on an hourly basis per year. The projections can vary the time horizon; in the application presented in this paper, the horizon is the year 2030. The simulation takes as given the power plant, storage and interconnector capacities, the demand for electricity and the load profiles, the fuel prices and the carbon prices in the ETS, as well as the hourly production of the variable renewable energy plants. These inputs come from projections using the full PRIMES energy system model.
2.3. Detailed Model Description
2.3.1. Bidding by Generators
Bidding by power plants in the various stages of the wholesale markets is endogenous, deriving from a scarcity bidding function, which is a simplified representation of supply function equilibrium, [25,26,27,28]. Scarcity bidding reflects the existence of market power in the EU markets, see for example [29]. A similar approach was used in [30], where Eager et al. introduce an uplift function, depending on the generation capacity margin, to reflect the market signals for new investments. They propose to construct the uplift function by combining two function forms, a hyperbolic and an exponential one, and keep the maximum of the mark-ups calculated by each form.
In our modelling, we make use of only an exponential form of the scarcity bidding function, as used in [31], to determine mark-ups applying on plant’s marginal costs. The plants submit priced offers in the day-ahead market, depending on the zone of the load curve (e.g., base-load, mid-merit and peak load) and the ranks in the merit order. We assume that market participants prefer being price-takers when they have certainty of getting a competitive position in the merit order, and take the risk of being price-makers, when they know that they are part of the group of marginal plants, and at the same time the system has a scarcity of generation capacities. A plant exercises market power when setting a non-zero mark-up; whether exercising market power is possible is optionally controlled in the model. Reliability standards that provide for abolishing the exercise of market power in the exchange of capacity remuneration is also an option in the model. The calculation also considers that the mark-ups have an upper bound that depends on the plant’s fixed costs, calculated from annualised capital costs and fixed operation and maintenance costs. The mark-ups can be restricted in the model by the market design option of imposing a price cap on the bids.
The scarcity bidding function () of each power plant at each time segment as shown in Equation (1) has an ascending slope as a function of scarcity of capacities in relation to load. In this equation, represents the marginal cost of the power plant, considered as the floor of the bidding price. The ratio represents capacity scarcity. Parameter acts as a ceiling of bid prices, irrespective of scarcity, whereas the coefficient reflects the steepness of the influence of scarcity on bidding behaviours. The steepness parameter may represent various factors that a bidder considers in his behaviour, including the degree of risk-prone behaviour, whether the plant is a peaking one or not (in the sense of taking the risk of price making), and the intensity of competition by other plants in the merit order of dispatching.
Figure 2 presents a graphical illustration of the scarcity bidding function used in the model. The horizontal axis represents the capacity margin index (, whereas the vertical axis represents the price of electricity submitted by a power plant as a bid. The three bidding functions, presented in the figure, have different slopes to denote different intensities of scarcity pricing of electricity by a bidder. The scarcity increases when the capacity margin of the system decreases, as shown by the horizontal axis of the graph. Also, a steep bidding function may reflect a risk-prone behaviour by a bidder. A bidder exercises scarcity bidding mostly when the plant is or is close to being, a price-maker in the market. However, the magnitude of the mark-up above marginal costs of the plants also depends on the degree of competition. Our algorithm determines the level of the mark-up as depending on the bidding of other plants placed above the bidder’s plant in the merit order. The algorithm is a proxy to a supply-function equilibrium approach. At times when the available capacity is scarce concerning load, peaking plants may adopt steeper bidding curves, thus applying high mark-ups, as compared to other times when the available capacity is in excess.
The model applies a similar bidding function also to the intra-day market, but differently for upward and downward adjustment due to different costs. In the reserve and ancillary services market model, the scarcity bidding depends on opportunity costs, reflecting the potential loss of revenues of a plant due to withholding of part of its capacity for reserve purposes.
The economic bids by the power plants include the costs implied by the EU ETS allowances of carbon dioxide emissions. The simulation of the EU ETS market is out of the scope of the PRIMES-IEM model. Also, the model considers the power plants and other resources as given and performs only operation dispatching and market simulation, as the model does not cover capacity expansion. It is out of the scope of the model to capture the aim of the EU ETS to incite modification of investment mix towards low carbon technologies. However, the model does capture the impact of the EU ETS on the modification of the plant scheduling induced by the cost of carbon dioxide allowances and the implications on market prices, hence on energy costs. The indirect support of renewables from EU-ETS allowances of CO2 emissions is important for the capacity expansion and the change in investment mix, which, as mentioned, is outside the scope of the model.
The PRIMES-IEM model can handle policies that support clean energy only concerning plant scheduling and market clearing. The model represents three main ways of supporting clean energy: (a) the influence of EU ETS carbon costs (or carbon taxes if applicable) on the plant scheduling, obviously acting in favour of increasing energy produced by cleaner resources; (b) market rule arrangements that may reduce curtailment of renewables due to technical reasons; and (c) the sharing of balancing resources via the increase in interconnection availability among countries in an aim to increase the integration of renewables in the system.
2.3.2. Nomenclature
Table 2 presents the nomenclature used in the detailed model description of the PRIMES-IEM modelling approach, as shown in the next sections.
2.3.3. Modelling of the Day-Ahead Market
In reality, the large majority of day-ahead markets in Europe operate as pure energy markets, in the sense that the derivation of plant scheduling and market clearing prices does not take into account the technical operation restrictions of plants and the ancillary services, but rather takes into consideration only the economic offers.
However, our model includes two options for the modelling of the day-ahead market. In the first option, we apply a pure energy-only market, and in the second option, we apply the full unit commitment algorithm to represent market clearing and the derivation of plant scheduling. The first approach builds on the EUPHEMIA algorithm, which is the algorithm that is currently used in the large majority of the European day-ahead markets, as discussed below (Section 2.3.3.1). In the second approach, we employ the full unit commitment algorithm (Section 2.3.3.2), which performs a co-optimisation of energy with ancillary services and take into account the technical restriction of plants operation. The second approach uses the unit commitment algorithm to produce a proxy of “perfect” behaviours of market participants, who submit rational bids that are optimal from a system’s perspective, as if the participants were pre-empting the technical constraints of the plant and the system’s reserves, aiming at minimising the exposure to re-dispatching and balancing costs in subsequent stages of the market.
2.3.3.1. Modelling a Pure Energy Market for the Day-Ahead
The modelling of the day-ahead market (DAM) builds on the EUPHEMIA algorithm [32]. The main addition is the modelling of bidding behaviour endogenously. The model includes user-defined options to control the bidding, for which at least two contrasting views are available. (A) Bidders submit only for energy injection and consumption without any other consideration, which implies that the DAM operates as a pure energy-only market. (B) The participants submit bids which are adjusted optimally after pre-empting operation limitations of plants (ramping rates, technical minimum and others) and system reserves for ancillary services that the plants have to supply in real-time operation. When applying the second option, the model uses the full unit-commitment algorithm (presented later on in this paper) to solve the DAM assuming that the participants’ bids prevail rather than marginal costs of the plants. The first option for the DAM model formulation is presented below. The solution algorithm simulates pure energy markets coupled together via interconnections and managed via flow-based allocation rules. For this option, the bids are price-quantity functions, which are endogenously defined assuming an ignorance of plant and system constraints that may render some of the bids not feasible. The non-feasibility causes deviations that subsequent stages of the markets need to address.
The objective function maximises social surplus, which is the sum of consumer and producer surplus, with denoting system nodes, the hourly time slices in a year, power plants, the hourly demand for electricity, the non-increasing demand function depending on prices, the generation by each power plant and the bids expressed as non-decreasing functions. Social surplus is the sum of consumer and producer surplus, which is maximum at the point of intersection of demand and supply curves. The supply curve uses prices derived from the financial bids, which include mark-ups applying on marginal costs. The power plants get revenues above marginal costs when placed below the marginal plant (i.e., the last plant in the merit order that serves to meet demand) in the merit order and also when being a marginal plant depending on the mark-up. Maximisation of social surplus is equivalent to a market equilibrium where the consumers minimise costs and producers maximise profits. The endogenous determination of mark-ups represents oligopoly competition.
The DAM optimises the objective function (2) to determine the optimal schedule of the plants (having requested remuneration equal or below the market-clearing price), the flows over interconnections and the part of the demand to meet (having the willingness to pay equal or above the market-clearing price). The optimisation is subject to the following constraints:
Equation (3) ensures the hourly balance of electricity demand and supply, where denotes the sum of energy inflows and outflows in a node and the power plants with priority dispatch, an assumption which may vary per scenario. The maximum generation for each plant has the given plant’s capacity () and the plant’s hourly availability factor, , as an upper bound, as in Equation (4). The maximum flow over each interconnector, , has the given thermal capacity of the line, , as an upper bound, as in Equation (5). The flows over interconnectors () may also be restricted by the administratively defined net transfer capacity limitations (), which apply to pairs of nodes, as in Equation (6). The model uses the DC power flow formulation, assuming one of the nodes as a reference (swing) node, , as shown in Equation (10). The power flow Equations (7)–(10) involve the phase angles for nodes, , the incidence matrix , , describing the topology of the network, the reverse incidence matrix , , and the matrix , , which includes the susceptance of each interconnector in the elements of the main diagonal.
After solving for the optimisation, the model determines the marginal price of the system (), from the demand curve, as in (11). This hourly price, which is the market-clearing price, serves to define all payments and revenues of the market participants.
2.3.3.2. Modelling of Co-Optimisation of Energy with Ancillary Services
As an extension of the modelling of the day-ahead market, the model integrates the co-optimisation of energy with ancillary services and also includes the plant-related technical restrictions, which are modelled using binary variables in a mixed-integer programming formulation. Essentially, the extended version applies a unit commitment algorithm, which also serves to simulate the system for real-time operation.
In the application of the algorithm for the DAM, the model uses the unit commitment approach to derive the optimal bidding of plants’ capacities for electricity generation and at the same time for reserves (ancillary services) while respecting the technical restrictions of the cyclic operation of the plants. In this way, the model mimics the way plant owners would pre-empt plant and system constraints and will not bid the entire capacity of the plant for electricity generation because the rest supplies reserve to ancillary services. Fast ramping, shut-downs, and start-ups, as needed to operate the system are also derived simultaneously to mimic the optimal bidding of plant capacities to achieve a robust system operation. But, contrary to some central dispatching approaches that use marginal costs of plants to determine the merit order, the modelling of the co-optimisation of energy and reserves used the financial bids as derived endogenously for a pure-energy market. The co-optimisation mimicking an optimal power system operation is equivalent to a market equilibrium where the market participants having perfect information would bid price-quantity pairs as appropriate to maximise the social surplus of the market and at the same time avoid any deviation when the system will operate in real-time. The model does not include imperfect information or other factors leading to sub-optimal bidding behaviours. Despite bidding to avoid deviations, deviations do occur in the modelling of the intra-day and balancing stages of the market, due to randomly generated events. In contrast, when applying the pure-energy version of the DAM, deviations also occur because of the absence of co-optimisation of energy and ancillary services.
In another option for the modelling of the DAM, the model represents block and complex orders (according to the terminology of EUPHEMIA) which apply on their portfolio of plants. In this case, the bidders consider the technical constraints only of the plants they own (e.g., ramping rates and others) but not for the entire fleet. They also include the provision of reserves for the ancillary services. In this way, the model partially co-optimises energy and ancillary services, as the participants have a limited view of the system constraints and act as if they were making a self-dispatching schedule of the plants they own. Due to the partial view, they bid to minimise exposure to the risk of deviations but are not able to fully eliminate this risk. The modelling of bidding using a block and complex form of orders requires additional binary variables and pays in terms of the computational burden.
The modelling option presented below applies the perfect information bidding that the model optimises for each plant separately to maximise the social surplus, respect the technical operation restrictions of the plants and meet the system demand for ancillary services optimally. As previously, the bidding functions relate prices and quantities in an ascending direction, and the demand functions relate prices and quantities in a descending direction.
Let’s denote as the set of ancillary services grouped by type. The contribution of a plant to each type of ancillary services can be upward, or downward . The power plants separately bid for energy and ancillary services, but the respective bids respect the technical constraints of the plant. The plants bid separately for upward and downward contribution using the functions and , respectively. The technical constraints of plant operation include the minimum stable generation level, , the ramping capability, , the minimum up-time, , and minimum downtime, . The mixed-integer programming formulation involves binary variables, denoting the status of plant operation, as follows: for the operating status, for a shutdown and for a start-up. The demand for ancillary services is represented by and .
The objective function (12), apart from the cost of energy and ancillary services represented by the bidding functions, also includes the costs of start-up and shut-down. It also includes the cost of curtailments of load, priced at the value of loss of load, ancillary services, prices differently by type of reserve, and variable renewables, priced at a value that depends on policy assumption (e.g., high price reflects priority dispatch of RES).
For simplicity, the objective function showed below does not include all the cost components.
The constraint (15) replaces the maximum capacity constraint (4). The equilibrium condition (3) and power-flow constraints (5) to (10) must be added to the above model to obtain the complete optimisation problem. The marginal price of the system is given by (11).
2.3.4. Generation of Random Events after the Day-Ahead Market
To mimic the occurrence of deviations between the plant scheduling derived by the DAM and the operation of the system, the PRIMES-IEM generates random events. Deviations are also due to the eventual non-full anticipation of technical plant and system constraints in the scheduling derived from the DAM. The random events include an unexpected variation of the hourly demand (), forecast errors of the availability of variable renewables sources (), forced outages of large power plants (), and unplanned loss of transmission lines (). These random events result in either upward or downward deviations. The random variables follow a normal distribution with a given variance-covariance matrix. The model assumes that the random variables follow a normal joint probability distribution with a known variance-covariance matrix. The random events generator applies a Monte Carlo technique to generate a large number of experiment scenarios, which are then reduced to a smaller number through scenario reduction techniques as available in the GAMS software [33].
For every scenario retained, the model performs a simulation of the intra-day market and the balancing and reserves market or procurement procedures. Final results are calculated by weighting the results of each experiment using the assigned frequency of occurrence of the scenario (i.e., as expected mean value).
2.3.5. Simulation of the Intra-Day Market
The participants in the intra-day markets have to submit financial offers for adjusting upwards or downwards their generation level, so as to facilitate the system in the settlement of upwards and downwards deviations occurring as mismatches of plant scheduling and the anticipation of real-time operation in the intra-day market. In each step of the intra-day markets, the participants improve the accuracy of the prediction of deviations and adjust their bids. In this way, the model mimics the way the system adjusts plant scheduling towards the real-time operation. The estimation by the model of deviations considers all technical constraints of plant operation and the demand for ancillary services. The model assumes that market participants anticipate the constraints and the reserves in the preparation of their bids.
The modelling of the intra-day markets applies a simplification of the problem by assuming that the intra-day market operates in a single-shot, rather than continuously as approaching the real-time operation. In other words, the model does not consider sequential intra-day markets, as in reality. The model also assumes that the participants have full information and predict the real-time operation perfectly. Thus, the model assumes that the participants also predict the occurrence of deviations between the plant scheduling derived by the DAM and the prediction of the real-time operation. The deviations also include random stochastic events, as mentioned above. The model simulates the intra-day market for each scenario retained after the Monte-Carlo sampling.
To mimic the perfect anticipation of the real-time operation, hence, to calculate “perfectly” the demand for upward and downward deviations, the model applies a unit commitment algorithm. The optimisation that runs at this stage includes the demand for ancillary services and the technical constraints of plant operation and repeats for each scenario representing the random events. The model to be solved comprises the Equations (3), (5)–(10) and (12)–(20) as constraints. The objective function incorporates penalty factors applying on deviations meant with respect of the day-ahead plant scheduling. The purpose is to mimic the obligation of the system operator to adjust the plant scheduling without deviating too much from the scheduling derived from the DAM and thus minimise the financial burden of the deviations for the market participants. For simplicity, Equation (12) does not show the penalty factors applying to deviations. As the sole purpose of this optimisation is to estimate the deviations as perceived by the market participants and not to estimate financial transactions, the Equation (11) is meaningless. The outcome of this optimisation is essentially a revised dispatching plant schedule.
The intra-day market involves the bidding by the participants for their offerings to settle upward and downward adjustments. Before bidding, the market participants consider the status of their portfolio as included in the scheduling derived from the DAM and after considering possible alterations due to the random events. The objective of the intra-day market is to ensure the adequacy of system operation in real-time and remunerate the participants for the adjustments of the power levels of their portfolio. The remuneration uses the market-clearing prices, estimated distinctly for upward and downward deviations. Depending on policy options, demand response is also included among the possible adjustments and may get similar remuneration.
The simulation of the intra-day market has the form of an optimisation problem with an objective function expressing the minimisation of total costs for meeting the deviations. In case demand response participates in the intra-day market, the formulation of the model transforms into an optimisation problem of maximisation of consumer surplus (not shown below for simplicity). The program needs to meet total demand for upward () and downward () deviations, which are determined by the method presented in the previous section. The unknown variables are the upward () and downward () adjustments of the scheduling of plants committed in the DAM-derived schedule; the upward adjustment (), provided by the possible start-up of an offline, in the DAM schedule, plant and the downward adjustment (), provided by the possible shut-down of a committed, in the DAM schedule, plant. The power plants submit price-quantity offers expressed by the bidding functions (, ), which reflect the scarcity of resources available for covering the adjustment in the intra-day market. Flows over interconnectors () may also contribute to the adjustment of deviations by increasing or decreasing the net position () of a node. The constraints of the grid apply, as explained in the modelling of the DAM. Also, user-defined options control whether flows over interconnections are eligible to participate in the intra-day market. In this way, the user can assess policies that aim to couple the markets also in the intra-day and for the provision of ancillary services.
Technical constraints apply to resources regarding their possible adjustments in the intra-day market. For example, a power plant having a change in its operating level in the opposite direction of the change of demand cannot adjust and causes a deviation. Figure 3 presents a graphical illustration of the calculation of deviations by the model regarding whether the direction of modification of operating level is in accordance or not with the direction of modification of the load minus renewables electricity. The accordance of directions implies that the resource is eligible for offering adjustment, downwards or upwards in the intra-day market. Non-accordance implies non-eligibility.
The figure above presents a simplified example of the way the model derives deviations that the intra-day market has to settle. Deviations are meant with respect to the schedule resulting from the day-ahead market and modified after the occurrence of random events. More specifically, the figure shows a case where the load level changes downwards. The generation resources should also adjust downwards to meet the change in demand. However, it is possible that technical constraints such as minimum stable generation, which may have not been respected by the schedule derived from the Day-Ahead market, oblige a generation resource to deviate upwards, that is, in the opposite direction of the change in demand. This is the case of plant A shown in Figure 3. The modelling of resources as eligible to adjust in the intra-day market assumes that the case of plant A is causing demand for deviations rather than supplying adjustment to the market of deviations. Of course, plant B, as shown in the figure, moving in the same direction as load is eligible to adjust in the intra-day market and offer resources to settle the deviations.
Also, the part of the capacities withheld for reserve purposes is not allowed to adjust in the intra-day market—as in Equations (23) and (24). However, they get remuneration for providing reserve and ancillary services. Renewables can only adjust downwards if they are eligible to participate in the market, according to a policy option. Similarly, demand response can only adjust downwards if allowed to participate in the intra-day market.
The mixed-integer programming formulation includes the binary variables representing the operating status of the plants (, , ), as in the model for the DAM. In addition, the model includes the binary variables and , which represent the deviation of the plant commitment status between the day-ahead and the intra-day and binary variables and , representing the choice of starting-up an offline in DAM plant or shutting down a committed in the DAM plant. The objective function includes the shut-down () and start-up () costs only for the plants performing start-up or shut-down specifically in the intra-day. The capacity constraints restricting depend on the operating status () and the power level of the plant in the DAM-derived schedule (), the withheld capacity for reserve purposes (, ) as well as the flows over interconnectors as in the DAM () and the inflows minus outflows per node considered as adjustments relative to the DAM ().
Equation (10) determining the reference node is also part of the above model. Equation (44) expresses the equilibrium in the intra-day per node and Equations (39)–(43) ensure the balance of the power-flows. The marginal system prices for upward and downward deviations derive as dual variables of constraints by the demand for deviations after solving the relaxed problem. The relaxed problem of a mixed-integer optimisation problem (MIP) is the linear equivalent problem, after replacing the integer (or binary) variables with parameters, which take values from the solution of the MIP problem.
2.3.6. Simulation of the Balancing/Reserves Market
In the last stage of market modelling, the PRIMES-IEM model simulates the procurement of reserves for ancillary services through auctions. The model minimises the cost of procurement of the services and accordingly selects the power resources that are eligible for the provision of ancillary services, which submit financial offers for this purpose. The choice is subject to constraints deriving from the scheduling of plants resulting from the intra-day market. The optimisation determines the capacity of plants (and other resources if eligible) that are contracted to be ready to adjust upwards or downwards as a supply of reserves for ancillary services The plants submit price-quantity bids based on the bidding functions and , which reflect opportunity costs plus a mark-up, which depends on scarcity conditions in the market for reserves. The opportunity cost expresses foregone revenues in the wholesale markets due to reserving the capacity for the ancillary services. Optionally, the interconnectors can contribute to certain types of ancillary services up to a certain limit . The dispatching schedule resulting from the intra-day market is represented by for plant power level, for the flows over interconnectors and for the inflows minus outflows in a node.
2.3.7. The Final Stage of Simulation to Represent System Operation
The final stage of the modelling is to run a unit commitment program, to simulate the real-time operation and ensure that the revised dispatching schedule, as resulted from the intra-day market, can be met consistently with the supply of ancillary services. The mathematical formulation of the program is described by Equations (3), (5)–(10) and (12)–(20) and the objective function incorporates penalty factors for deviations from the intra-day schedule and the commitments for reserve. The final reporting of generation mixes and interconnection flows derive from this final modelling stage. Based on this, the model calculates the costs for the consumers and revenues of plants and other resources (demand response, interconnection flows), based on the results of each stage of the markets as described above.
2.4. Modelling Market Distortions and Policy Remedies
As mentioned above, the considerable challenge of decarbonising the electricity market in the EU requires the cost-effective integration of large amounts of variable RES in the system efficient, which calls upon magnifying the flexibility and reserve providing resources of the system. Sharing these resources within the EU interconnected system is, obviously, of primordial importance. Increasing the cross-border flows implies removing barriers and increasing the liquidity of wholesale markets from which allocation of interconnection capacities should derive. At the same time, it is reasonable to increase the range of flexibility and balancing resources and include demand response, storage and the RES, which in this way have incentives to forecast the weather accurately and thus reduce balancing requirements for the system. The liquidity of a wholesale market is higher if the maximum possible of load and generation gets into the markets, discouraging the practices of by-passing the markets as current regulations permit. Also, maximising the sharing of flexibility, balancing, and reserve resources imply coupling the country markets for intra-day adjustments and the procurement of ancillary services. Coupling the markets in all stages up to the real-time operation, thus beyond the currently applied day-ahead market coupling, should provide economies of scale and high performance in integrating large amounts of renewables into the system.
The ideas briefly mentioned in the previous paragraph motivated the EU electricity market initiative in 2016 ([12,13]) and its implementation in the legislation in 2019 [34]. Assessing the policy options to design and propose the electricity market reforms is complex because the assessment needs to represent distortions and their removal to calculate the differential impact on costs and the functioning of the internal market. Also, as the aim is to remove distortions and integrate all the stages of the markets, the model should cover the markets individually with sufficient detail. The PRIMES-IEM model has been designed for this purpose and has included all the types of market distortions prior identified in a special study [11]. The following points summarise the modelling of distortions and policy options.
- Nominations: Nomination is a practice of declaring a block of generation and load to the TSO for respecting in the dispatching schedule. The declaration in an out-of-the-market action and may concern one or more than one control areas, and in this case, may also declare the use of interconnection capacities. The model represents nominations via user-defined parameters. The nominated plant resources operate as must-take in the modelling of the DAM and the nominated load as must-serve. Generation nominated cross-border implies a reduction in the available transfer capacity of interconnectors.
- Priority dispatch: The model represents priority dispatch of power plants via user-defined parameters. They operate in the modelling of DAM as must-take. The model includes the possibility of generation curtailment for technical reasons, albeit by applying a high penalty when the resource is in priority dispatch.
- Consideration of balancing and ancillary services: The model allows optionally for optimising the offering of both energy and reserves in the day-ahead market simulation simultaneously. This option can be used to reflect that energy markets have reached a high level of maturity and generators anticipate and minimise their exposure to the balancing markets.
- Demand response: The model represents demand response as an endogenous shifting of demand quantities from peak hours to off-peak hours. User-defined parameters control whether demand-response is eligible in the various markets. Consumers offer pairs of quantities and prices as bids for demand response, and total amounts are subject to limitation by potential.
- RES in intra-day and balancing: User-defined parameters may control whether variable RES can participate in the intra-day market, in which case they can bid for a downward adjustment. The eventual exposure of RES to balancing costs incentivises them to improve the weather forecasting error, which is part of the random event generation modelled between the DAM and the Intra-Day markets. When RES plants participate in the intra-day market, they cannot be under priority dispatch.
- Price caps: Price caps for the bids in the various markets are exogenous parameters of the model. Low levels of price caps may limit the revenues of generation resources. However, the model does not capture the eventual adverse effects on generation investment, as capacity expansion is outside the scope of the model.
- Net transfer capacity (NTC) restrictions: The NTC values are exogenous parameters and can apply on all stages of the markets. Increasing the NTC values up to making physical capacities as the binding constraints is a way of modelling full integration of the grid and system operation. In this case, the Kirchhoff laws restrictions do apply.
- Market liquidity: The model allows for the consideration of illiquid or regulated markets, in particular for the intra-day and balancing markets, by applying administratively (exogenously) defined prices for the settlement of deviations and ancillary services, instead of a market-clearing price derivation.
- Participation of cross-border flows: User-defined parameter can represent whether or not cross border flows are allowed to participate in the intra-day market for covering deviations and in balancing for covering the ancillary services. Re-dispatching and market split prices are endogenous in the model for the DAM and the intra-day market.
- Reserve requirements: Reserve requirements are exogenous parameters and are specified in detail for each type of ancillary service and separately for each control area. Representing the eventual strong coordination of the system operators or the establishment of regional system operator bodies is included in the model via a reduction of reserve requirements when coordination applies. However, the reduction is also exogenous.
3. Model Application for the Electricity Market Reform to the Horizon of 2030
3.1. Context of the Model Application
In this section, we present an application of the PRIMES-IEM model for a study aiming at assessing several policy options that were part of the proposal for electricity market design of the European Commission at the end of 2016 [14]. As the goal of the reform was to improve the internal market in integrating variable RES at a large scale, the study considered the EU policy scenario EUCO27 [3] as a basis for the assessment and has applied the modelling mainly for the year 2030. The EUCO27 scenario is the basic scenario used in the preparation of the “Clean Energy for all Europeans Package” [1], which focuses on 2030 as the year for which the policy package defines mandatory targets for renewables, efficiency and emissions reduction targets. The targets for 2030 include the commitments agreed by the European Council in 2014 [35], i.e., GHG emissions reduction of 40% by 2030, compared to 1990, 27% RES in total gross energy demand and 27% reduction of total primary energy, compared to the baseline PRIMES projection in 2007. Using the EUCO27 energy system projection as the basis for the modelling of the assessment of electricity market reform options means that the projection of load, power plant capacities, interconnection capacities, fuel prices, and carbon prices come from the PRIMES model [4]. The study described in this section concerns the application of PRIMES-IEM to the modelling of several market reform options specifically for the year 2030. The context of the system is prior development of RES at a significant scale, decreased use of coal-based generation (due to rising carbon prices) and extension of interconnection capacities according to the 10-year plan of ENTSO-E [21].
On this basis, the modelling study considers the following contrasted groups of policy options:
The “Current Practices” case includes the market distortions identified in [11], assuming that they continue to prevail until 2030. The distortions are in brief as follows. The market coupling of the DAMs is partial as nominations concern a significant part of load and generation. The market coupling is imperfect because the restrictive NTC values limit the use of interconnection capacities by the markets. The coupling of intra-day and balancing markets is not permitted, and the reserves are defined from a national perspective and thus are oversized. The renewables enjoy priority dispatch and are immune from balancing costs. Also, demand response has a limited contribution to magnitude and only in the DAM.
The “Optimal Case” includes and implements several market reform measures assumed to be able to remove the market distortions. The policy measures discourage nominations, increase the NTC values considerably, makes market coupling mandatory for all market stages, including for intra-day and balancing. The measures promote the maximum possible availability of interconnection capacities for these markets, the removal of all barriers to the participation of demand response in all stages of the market. The measures expose the RES to balancing costs, abolish priority dispatch privileges and increase price caps to the level of the value of loss of load (which is a few thousand of EUR per MWh not-served).
In addition to the two contrasted groups of market reform measures, we performed a sensitivity analysis, running cases that apply parts of the measures to assess the measures individually regarding the impacts on costs and revenues.
The projection, used as a basis for the model application, assumes that the EU achieves the targets for carbon emissions reduction and renewables, as defined by the policy for 2030. The targets foresee a share of renewables in power generation 50–55% in 2030 (30–35% for solar and wind), which is significantly up from the share 30% in 2015 (12% for solar and wind). The shares are not excessively high to imply major restructuring of the way the power system performs balancing and reserves. The incremental contribution of renewables comes from variable RES, mainly solar and wind. Thus, the system will have to cope with a significant part of the power resources being non-dispatchable and stochastic. The projection also foresees that electricity storage (other than hydro pumping) develops modestly until 2030 and, thus, are not enough to address variability effectively. The costs of batteries assumed to follow a slow learning pace, and the non-maturity of chemical storage until 2030, are the main obstacles. We postulate that a 50%–55% RES share is not yet a sufficient signal to launch storage systems at a large scale based on the on the results of the PRIMES energy system model applied for several decarbonisation scenarios of the EU for the period until 2050.
Consequently, the fast ramping power plants, hydro-power, and pumping, as well as demand response and enhanced cross-border flows are considered as the main resources of flexibility and reserves until 2030. The assumption of the successful implementation of the 10-year investment plan, which includes considerable extensions and reinforcements of the interconnected system of the EU, both cross-border and nationally, plays an important role. However, as both policy cases assume the implementation of the grid investment, the differences in their performance stem from the market reform measures solely. The restrictive rules in the context of the current practices impede the full exploitation of cross border capacities by the markets in all stages.
3.2. Results of the Model Application
Table 3 presents the results of the simulations regarding the total costs and their decomposition by market stage. The total costs (or turnover) shown below, correspond to payments (electricity bills) paid by the load representatives for the consumption of energy, excluding any payment for the transmission and distribution grids and other public service obligations.
Moving from current practices to the optimal case, the cost savings, thus the gains for consumers, are significant. Reducing total costs by 7% per year as a sole result of the market reform implies worth implementing the measures. The cost savings in the day-ahead market are much lower than in the other market stages, when expressed as percentage differences from the turnover under the current practices conditions. The majority of day-ahead markets in the EU are already well coupled under the conditions of the current practices case. The assumed implementation of the grid extension until 2030 also in the current practices cases implies that the DAMs enjoy much less congestion in 2030 than currently. So, regarding the DAM, the main difference between the two cases shown in the table above is the increase in the liquidity of the market due to the discouragement of nominations in the optimal case. As the benefits due to the grid, which are very significant, are common in the two cases, the remaining cost difference is reasonably small. However, as the turnover in DAM is above 90% of total market turnover, even a small cost saving percentage represents a substantial amount of money, which was found to be 34.3% of total cost savings.
The benefits due to the market reform are very significant in the other two stages of the markets, according to the simulation results. Today, the integration of intra-day and balancing markets is very poor (ACER [10]) and the reserves are determined mainly from a national perspective. By assumption, the current practices case does not improve the integration of these markets. The poor market coupling, the limited use of cross-border possibilities and the non-participation of demand responses, RES and others are found to be important causes of inefficiency in intra-day and ancillary services markets. The full opening of these possibilities in the optimal case allows for 47% cost savings in the intra-day markets and 76% in the procurement of ancillary services. For the cost savings of the latter, the assumption of a full coordinated determination of demand for reserves is greatly beneficial, thus justifying an approach towards multi-area system controlling.
The cost savings expressed per MWh consumed by final customers are very indicative of the importance of implementing the market reform. In total, the cost savings represent an average reduction of electricity bill of consumers in 2030 of 7.8 €/MWh, of which 2.98 €/MWh is due to the day-ahead market, 3.3 €/MWh is in the intra-day market, and 1.9 €/MWh is due to the cost savings in the procurement of ancillary services.
The cost savings are unequally distributed among the EU Member-States, which is logical given that the degree of market coupling differs among countries.
According to the model results (Table 4), the regions in the periphery of the EU achieve higher cost savings (in percentage difference) than the central regions. The current practices are closer to optimal for the central regions, compared to the periphery, mainly because the central regions currently have more integrated markets. Among the peripheral regions, the North region gets fewer cost savings than the rest of the regions of the periphery because, currently, the market is better integrated. The Central Western European region achieves the lowest cost savings because market coupling operates effectively and thus the distance towards optimality is lower than for other regions. The current differences in the degree of market coupling explain the large differences among regions of cost savings in the day-ahead market. The central regions may see negative effects on cost savings in the day-ahead market, albeit small in magnitude, as the increased market coupling implies higher sharing of generation resources between the regions in the optimal case compared to Current Practices. The cost savings in intra-day and ancillary service markets are impressive in all regions when seen in terms of percentage difference. Currently, balancing and reserves mainly use national resources with poor cross-border contributions. The market integration improvements enabled by the reform implies cost savings in the entire EU without exception; this is a strong finding of the modelling application also confirmed in the numerous sensitivity analyses.
It is difficult to decompose the cost savings by type of reform measure, as the impacts stem from the group of measures and the synergy between them. However, using results from various sensitivity analyses and mixed policy options evaluated using the model, we propose an approximate decomposition of cost savings by type of measure, shown in Table 5.
All groups of reform measures, as shown above, contribute more or less equally to total cost savings. Making the interconnection capacities available to the markets is mostly beneficial for the day-ahead market, but there is also a non-negligible gain in the Intra-Day market. The latter get most cost benefits from the coupling of national intra-day markets and the expansion of market participation, both from eligibility of demand response and RES for this market and the inclusion of those that have exemption privileges in the current practices. A liquid and transparent day-ahead market, as well as an intra-day market, that provide clear cost signals to those that remain unbalanced, are preconditions to encourage the day-ahead market participants to pre-empt technical operation constraints of their fleet and ancillary services in order to minimise exposure to imbalances costs in intra-day. In this way, the day-ahead market co-optimizes the provision of energy and ancillary services, which costs more than the provision of energy in a pure-energy market bidding context but pays in the intra-day market excessively. The broadening of participation (removal of nominations, among others) lowers the costs in the day-ahead market and offsets the increase in costs due to the co-optimization, which induces a substantial cost-benefit in the intra-day market. Finally, the coordinated management, for the determination of both demand and procurement, is in the origin of the significant cost savings in ancillary services.
The market reform enables a considerable increase in the contribution of cross-border flows in the markets. The removal of NTC restrictions in all market stages allows for an increase of trade, as shown in Table 6.
Table 7 provides details regarding the generation by plant type in the day-ahead market. The changes in the generation mix have as a sole driver the market reforms, like the rest of the elements (e.g., capacity mix, fuel prices, hydro availability etc.) remain the same across the two cases. The vast use of interconnections, as shown in Table 6, and the removal of priority dispatch and nominations enable a more optimal allocation of resources over interconnections. The differences are moderate, affecting mostly the generation of solids-fired plants, which are the least competitive due to the ETS prices.
As shown in Table 8, the reforms in the day-ahead and intra-day markets succeed in achieving a decrease in the needs for re-dispatching. The improvement, measured in energy terms, amounts to 13% in the optimal case, compared to the current practices. The day-ahead schedule in the optimal case, which pre-empts the technical constraints for both system and plant fleet, along with the elimination of priority dispatch rules and the significant contribution of cross-border flows (Table 6) enables the minimisation of re-dispatching needs. Table 8 shows a sizeable extension of market participation by including most of the RES plants in the intra-day market. The amount of RES energy participating in the intra-day market doubles in the optimal case, compared to current practices. The RES plants being active in the market can cover up to 40% of total needs for re-dispatching.
Improving market efficiency enables the minimisation of RES curtailment, indicating that the achievement of market reforms will enable the increasing penetration of RES. Table 9 illustrates the curtailment of RES generation across the two cases. The elimination of priority dispatch rules and the wider use of interconnections, as shown above, lead to a reduction in RES curtailment of 60%. Even though the level of RES curtailment represents a small part of the total RES generation, reducing the curtailment is an important signal for investment in the RES market. To this end, market reforms are essential.
4. Conclusions and Discussion
The newly built PRIMES-IEM model has produced reasonable results regarding the simulation of the sequence of the power markets in the EU and the evaluation of cost impacts of market reform policies. The level of detail in the assessment of concrete policy measures, the specificity of results by country, market, and plant type, as well as the robustness acquired through several sensitivity analyses have been appreciated by policymakers in the preparation of the study that supported the electricity market initiative proposal of the European Commission submitted end 2016.
From a research perspective, the model is the first of its kind regarding the full simulation of the sequence of the wholesale markets, from the day ahead up to real-time operation, and due to its large-scale application for the entire EU. Apart from computer time, which has been a burden, model running has been robust. Although the model used a cluster of many powerful computers, a lot has to be done to run it in parallel processing more productively. The computer burden increases a lot if we increase the stochastic scenarios to simulate. For this reason, the capturing of stochasticity for the random events between the day-ahead and the intra-day markets is rather limited.
The modelling of market reform impacts relies on several assumptions regarding the reactions and behaviours of agents participating in the markets. The view taken in the present modelling was to represent perfectly reasonable behaviours based on perfect information, foresight, and anticipation of competitors’ reaction and market outcomes. This is usual in policy assessments, aiming at comparing policy options in a normative manner, and thus abstracting from behaviour-driven imperfections.
To this respect, the most uncertain assumptions regard the demand response behaviours. The literature is not conclusive in this domain and predicts a large range of potentials of demand response. The current modelling adopted a rather conservative approach regarding the demand response potential. A sensitivity analysis that has assumed a larger potential has found significantly higher cost savings than the optimal case shown in this paper.
The broadening of participation in the markets, which is an inherent feature of the market reform, points to the direction of increased competition, which would avoid excessive cost mark-ups in the markets. The modelling has assumed scarcity-based bidding in the markets irrespective of the increase in competition. In this way, the estimation of cost-savings is safe but may slightly under-estimate the cost savings.
A fully coordinated management of the control areas regarding the ancillary services and flow-based allocation of interconnection capacities up to the maximum of the technical capacities is an assumption of the modelling that is in mismatches with ongoing implementations. To this respect, it is probably likely that the model-based assessment over-estimates the technical possibilities, hence the cost savings.
Regarding the case study presented in this paper, the model-based results confirm that the planned market reforms can induce very significant cost savings to the benefit of final consumers of electricity. The reforms facilitate increased competition as a result of market integration, broaden the participation of new resources (demand response and RES), remove exemption privileges, and encourage bidding in the wholesale market to pre-empt technical restrictions and ancillary services. The coordinated management of reserves and optimal allocation of capacities over interconnectors based on market outcomes increase cross-border flows in all market stages considerably and implement the targeted sharing of balancing resources. The reformed system can manage the increased variable RES (consistently with targets for 2030) in a very cost-effective manner, despite the high degree of variability, mainly thanks to the cross-border sharing of balancing resources. The results clearly show that the largest beneficiaries are the intra-day balancing and reserve markets, which at present operate segmented, and after the reform are essential in the context of the increased RES.
A further insight, not reported in this paper due to a lack of space, is the evaluation of the degree of fixed costs recovery from market-based earnings by the type of generation plant. It is important information to evaluate eventual missing money issues, in particular for the flexible generation resources which are necessary to balance the variable RES. This assessment is useful to support the analysis regarding capacity remuneration mechanisms.
Author Contributions
Formal analysis, M.K., M.Z. and P.C.; Investigation M.K. and M.Z.; Methodology, M.K., M.Z. and P.C.; Project administration, P.C.; Software, M.K. and M.Z.; Supervision, P.C.; Validation, P.C.; Writing—original draft, M.K. and M.Z.; Writing—review & editing, P.C.
Funding
The European Commission partially funded this research within a Long-Range Energy Modelling Framework contract.
Acknowledgments
The authors acknowledge the contribution of M. Aslanoglou, C. Delkis, E. Kalaitzakis and C. Nakos, as members of the project group.
Conflicts of Interest
The authors declare no conflict of interest. The opinions expressed in this article are those of the authors and do not necessarily reflect the views of the European Commission.
References
- European Commission. Clean Energy for All Europeans; Publications Office of the European Union: Luxembourg, 2019; ISBN 978-92-79-99843-0. [Google Scholar]
- European Commission. Communication for the Commission to the European Parliament: A Clean Planet for All. A European Strategic Long-Term Vision for a Prosperous, Modern, Competitive and Climate Neutral Economy. COM(2018) 773 Final. Available online: https://ec.europa.eu/clima/sites/clima/files/docs/pages/com_2018_733_en.pdf (accessed on 30 November 2018).
- Capros, P.; Kannavou, M.; Evangelopoulou, S.; Petropoulos, A.; Siskos, P.; Tasios, N.; Zazias, G.; DeVita, A. Outlook of the EU energy system up to 2050: The case of scenarios prepared for European Commission’s “clean energy for all Europeans” package using the PRIMES model. Energy Strategy Rev. 2018, 22, 255–263. [Google Scholar] [CrossRef]
- E3MLab. Primes Model Version 2018, Detailed Model Description. Available online: http://www.e3mlab.eu/e3mlab/PRIMES%20Manual/The%20PRIMES%20MODEL%202018.pdf (accessed on 4 June 2019).
- Lannoye, E.; Flynn, D.; O’Malley, M. Evaluation of Power System Flexibility. IEEE Trans. Power Syst. 2012, 27, 922–931. [Google Scholar] [CrossRef] [Green Version]
- Nosair, H.; Bouffard, F. Reconstructing Operating Reserve: Flexibility for sustainable power systems. IEEE Trans. Sustain. Energy 2015, 6, 1624–1637. [Google Scholar] [CrossRef]
- Papavasiliou, A.; Smeers, Y. Remuneration of Flexibility using Operating Reserve Demand Curves: A Case Study of Belgium. Energy J. 2017, 38, 105–135. [Google Scholar] [CrossRef]
- Neuhoff, K.; Barquin, J.; Bialek, J.W.; Boyd, R.; Dent, C.J.; Echavarren, F.; Grau, T.; Von Hirschhausen, C.; Hobbs, B.F.; Kunz, F.; et al. Renewable electric energy integration: Quantifying the value of design of markets for international transmission capacity. Energy Econ. 2013, 40, 760–772. [Google Scholar] [CrossRef] [Green Version]
- Newbery, D.; Strbac, G.; Viehoff, I. The benefits of integrating European electricity markets. Energy Policy 2016, 94, 253–263. [Google Scholar] [CrossRef] [Green Version]
- ACER/CEER ACER/CEER—Annual Report on the Results of Monitoring the Internal Electricity and Natural Gas Markets in 2017—Electricity Wholesale Markets Volume. Available online: https://www.acer.europa.eu/Official_documents/Acts_of_the_Agency/Publication/MMR%202017%20-%20ELECTRICITY.pdf (accessed on 4 June 2019).
- Tennbakk, B.; Von Schemde, A.; Daan, S.; Capros, P. Electricity Market Functioning: Current Distortions, and How to Model Their Removal; Brussels, Belgium. 2016. Available online: https://ec.europa.eu/energy/sites/ener/files/documents/electricity_market_functioning_-_current_distortions_and_how_to_model_t.pdf (accessed on 9 June 2019).
- European Commission. Proposal for a Directive of the European Parliament and of the Council on Common Rules for the Internal Market in Electricity (Recast). COM/2016/0864 final/2—2016/0380 (COD). Available online: https://eur-lex.europa.eu/legal-content/EN/TXT/?uri=CELEX%3A52016PC0864R%2801%29 (accessed on 4 June 2019).
- European Commission. Proposal for a Regulation of the European Parliament and of the Council on the Internal Market for Electricity (Recast) COM/2016/0861 Final—2016/0379 (COD). Available online: https://eur-lex.europa.eu/resource.html?uri=cellar:d7108c4c-b7b8-11e6-9e3c-01aa75ed71a1.0001.02/DOC_1&format=PDF (accessed on 4 June 2019).
- European Commission. Commission Staff Working Document: Impact Assessment of the Market Design Initiative SWD(2016) 410 Final. Available online: https://ec.europa.eu/energy/sites/ener/files/documents/mdi_impact_assessment_main_report_for_publication.pdf (accessed on 4 June 2019).
- Ventosa, M.; Baíllo, Á.; Ramos, A.; Rivier, M. Electricity market modeling trends. Energy Policy 2005, 33, 897–913. [Google Scholar] [CrossRef]
- Garcia, A. Modeling electricity markets: A brief introduction. In Economic Market Design and Planning for Electric Power Systems; John Wiley & Sons: Hoboken, NJ, USA, 2009; pp. 21–44. ISBN 978-0-470-52916-4. [Google Scholar]
- González, P.; Villar, J.; Díaz, C.A.; Campos, F.A. Joint energy and reserve markets: Current implementations and modeling trends. Electr. Power Syst. Res. 2014, 109, 101–111. [Google Scholar] [CrossRef] [Green Version]
- Vijay, A.; Fouquet, N.; Staffell, I.; Hawkes, A. The value of electricity and reserve services in low carbon electricity systems. Appl. Energy 2017, 201, 111–123. [Google Scholar] [CrossRef]
- Oggioni, G.; Murphy, F.H.; Smeers, Y. Evaluating the impacts of priority dispatch in the European electricity market. Energy Econ. 2014, 42, 183–200. [Google Scholar] [CrossRef]
- Supponen, M. Factors that Influence the Targets and Criteria for Electricity Interconnector Investments. Available online: http://fsr.eui.eu/publications/factors-that-influence-the-targets-and-criteria-for-electricity-interconnector-investments/ (accessed on 4 June 2019).
- ENTSO-E. Ten-Year Network Development Plan 2014. Available online: https://www.entsoe.eu/publications/tyndp/tyndp-2014/ (accessed on 4 June 2019).
- Van den, B.K.; Delarue, E.; D’haeseller, W. DC Power Flow in Unit Commitment Models; KU Leuven Energy Institute: Leuven, Belgium, 2014. [Google Scholar]
- Christopher, A.; Maxime, C.; Laurent, F.; Von Schemde, A. METIS Technical Note T3—Market Module Configuration for Study S12: Focus on Day-Ahead, Intra-Day and Balancing Markets; Brussels, Belgium. 2016. Available online: https://ec.europa.eu/energy/sites/ener/files/documents/metis_t3_-_market_model_configuration_for_s12.pdf (accessed on 9 June 2019).
- COWI; AF Mercados EMI; ECOFYS; THEMA; VITO. Impact Assessment Study on down Stream Flexibility, Price Flexibility, Demand Response & Smart Metering; Brussels, Belgium. 2016. Available online: https://ec.europa.eu/energy/sites/ener/files/documents/demand_response_ia_study_final_report_12-08-2016.pdf (accessed on 9 June 2019).
- Klemperer, P.D.; Meyer, M.A. Supply function equilibria in oligopoly under uncertainty. Econometrica 1989, 57, 1243–1277. [Google Scholar] [CrossRef]
- Rudkevich, A. On the Supply Function Equilibrium and Its Applications in Electricity Markets. Decis. Support. Syst. 2005, 40, 409–425. [Google Scholar] [CrossRef]
- Sioshansi, R.; Oren, S. How good are supply function equilibrium models: An empirical analysis of the ERCOT balancing market. J. Regul. Econ. 2007, 31, 1–35. [Google Scholar] [CrossRef]
- Day, C.J.; Hobbs, B.F.; Jong-Shi, P. Oligopolistic competition in power networks: A conjectured supply function approach. IEEE Trans. Power Syst. 2002, 17, 597–607. [Google Scholar] [CrossRef]
- Willems, B.; Rumiantseva, I.; Weigt, H. Cournot versus Supply Functions: What does the data tell us? Energy Econ. 2009, 31, 38–47. [Google Scholar] [CrossRef] [Green Version]
- Eager, D.; Bialek, J.; Johnson, T. Validation of a dynamic control model to simulate investment cycles in electricity generating capacity. In Proceedings of the IEEE PES General Meeting, Minneapolis, MN, USA, 25–29 July 2010; pp. 1–8. [Google Scholar]
- Eager, D.; Hobbs, B.F.; Bialek, J.W. Dynamic modeling of thermal generation capacity investment: application to markets with high wind penetration. IEEE Trans. Power Syst. 2012, 27, 2127–2137. [Google Scholar] [CrossRef]
- NEMO COMMITTEE. Euphemia Public Description. Available online: https://www.epexspot.com/document/40503/Euphemia%20Public%20Description (accessed on 4 June 2019).
- Growe-Kuska, N.; Heitsch, H.; Romisch, W. Scenario reduction and scenario tree construction for power management problems. In Proceedings of the 2003 IEEE Bologna Power Tech Conference Proceedings, Bologna, Italy, 23–26 June 2003; Volume 3. [Google Scholar]
- European Parliament. Legislative Resolution of 26 March 2019 on the Proposal for a Regulation of the European Parliament and of the Council on the Internal Market for Electricity (Recast). Available online: http://www.europarl.europa.eu/doceo/document/TA-8-2019-0227_EN.html (accessed on 4 June 2019).
- European Council. European Council (23 and 24 October 2014)—Conclusions. Available online: https://www.consilium.europa.eu/media/24561/145397.pdf (accessed on 4 June 2019).
Figure 1.
Schematic representation of the PRIMES-IEM modelling approach.

Figure 2.
Example of endogenous scarcity bidding depending on systems’ capacity margin.

Figure 3.
Example of resources, which are eligible for adjusting their schedule in the intra-day market (Plant B) and those which are not eligible to adjust (Plant A).
Figure 3.
Example of resources, which are eligible for adjusting their schedule in the intra-day market (Plant B) and those which are not eligible to adjust (Plant A).


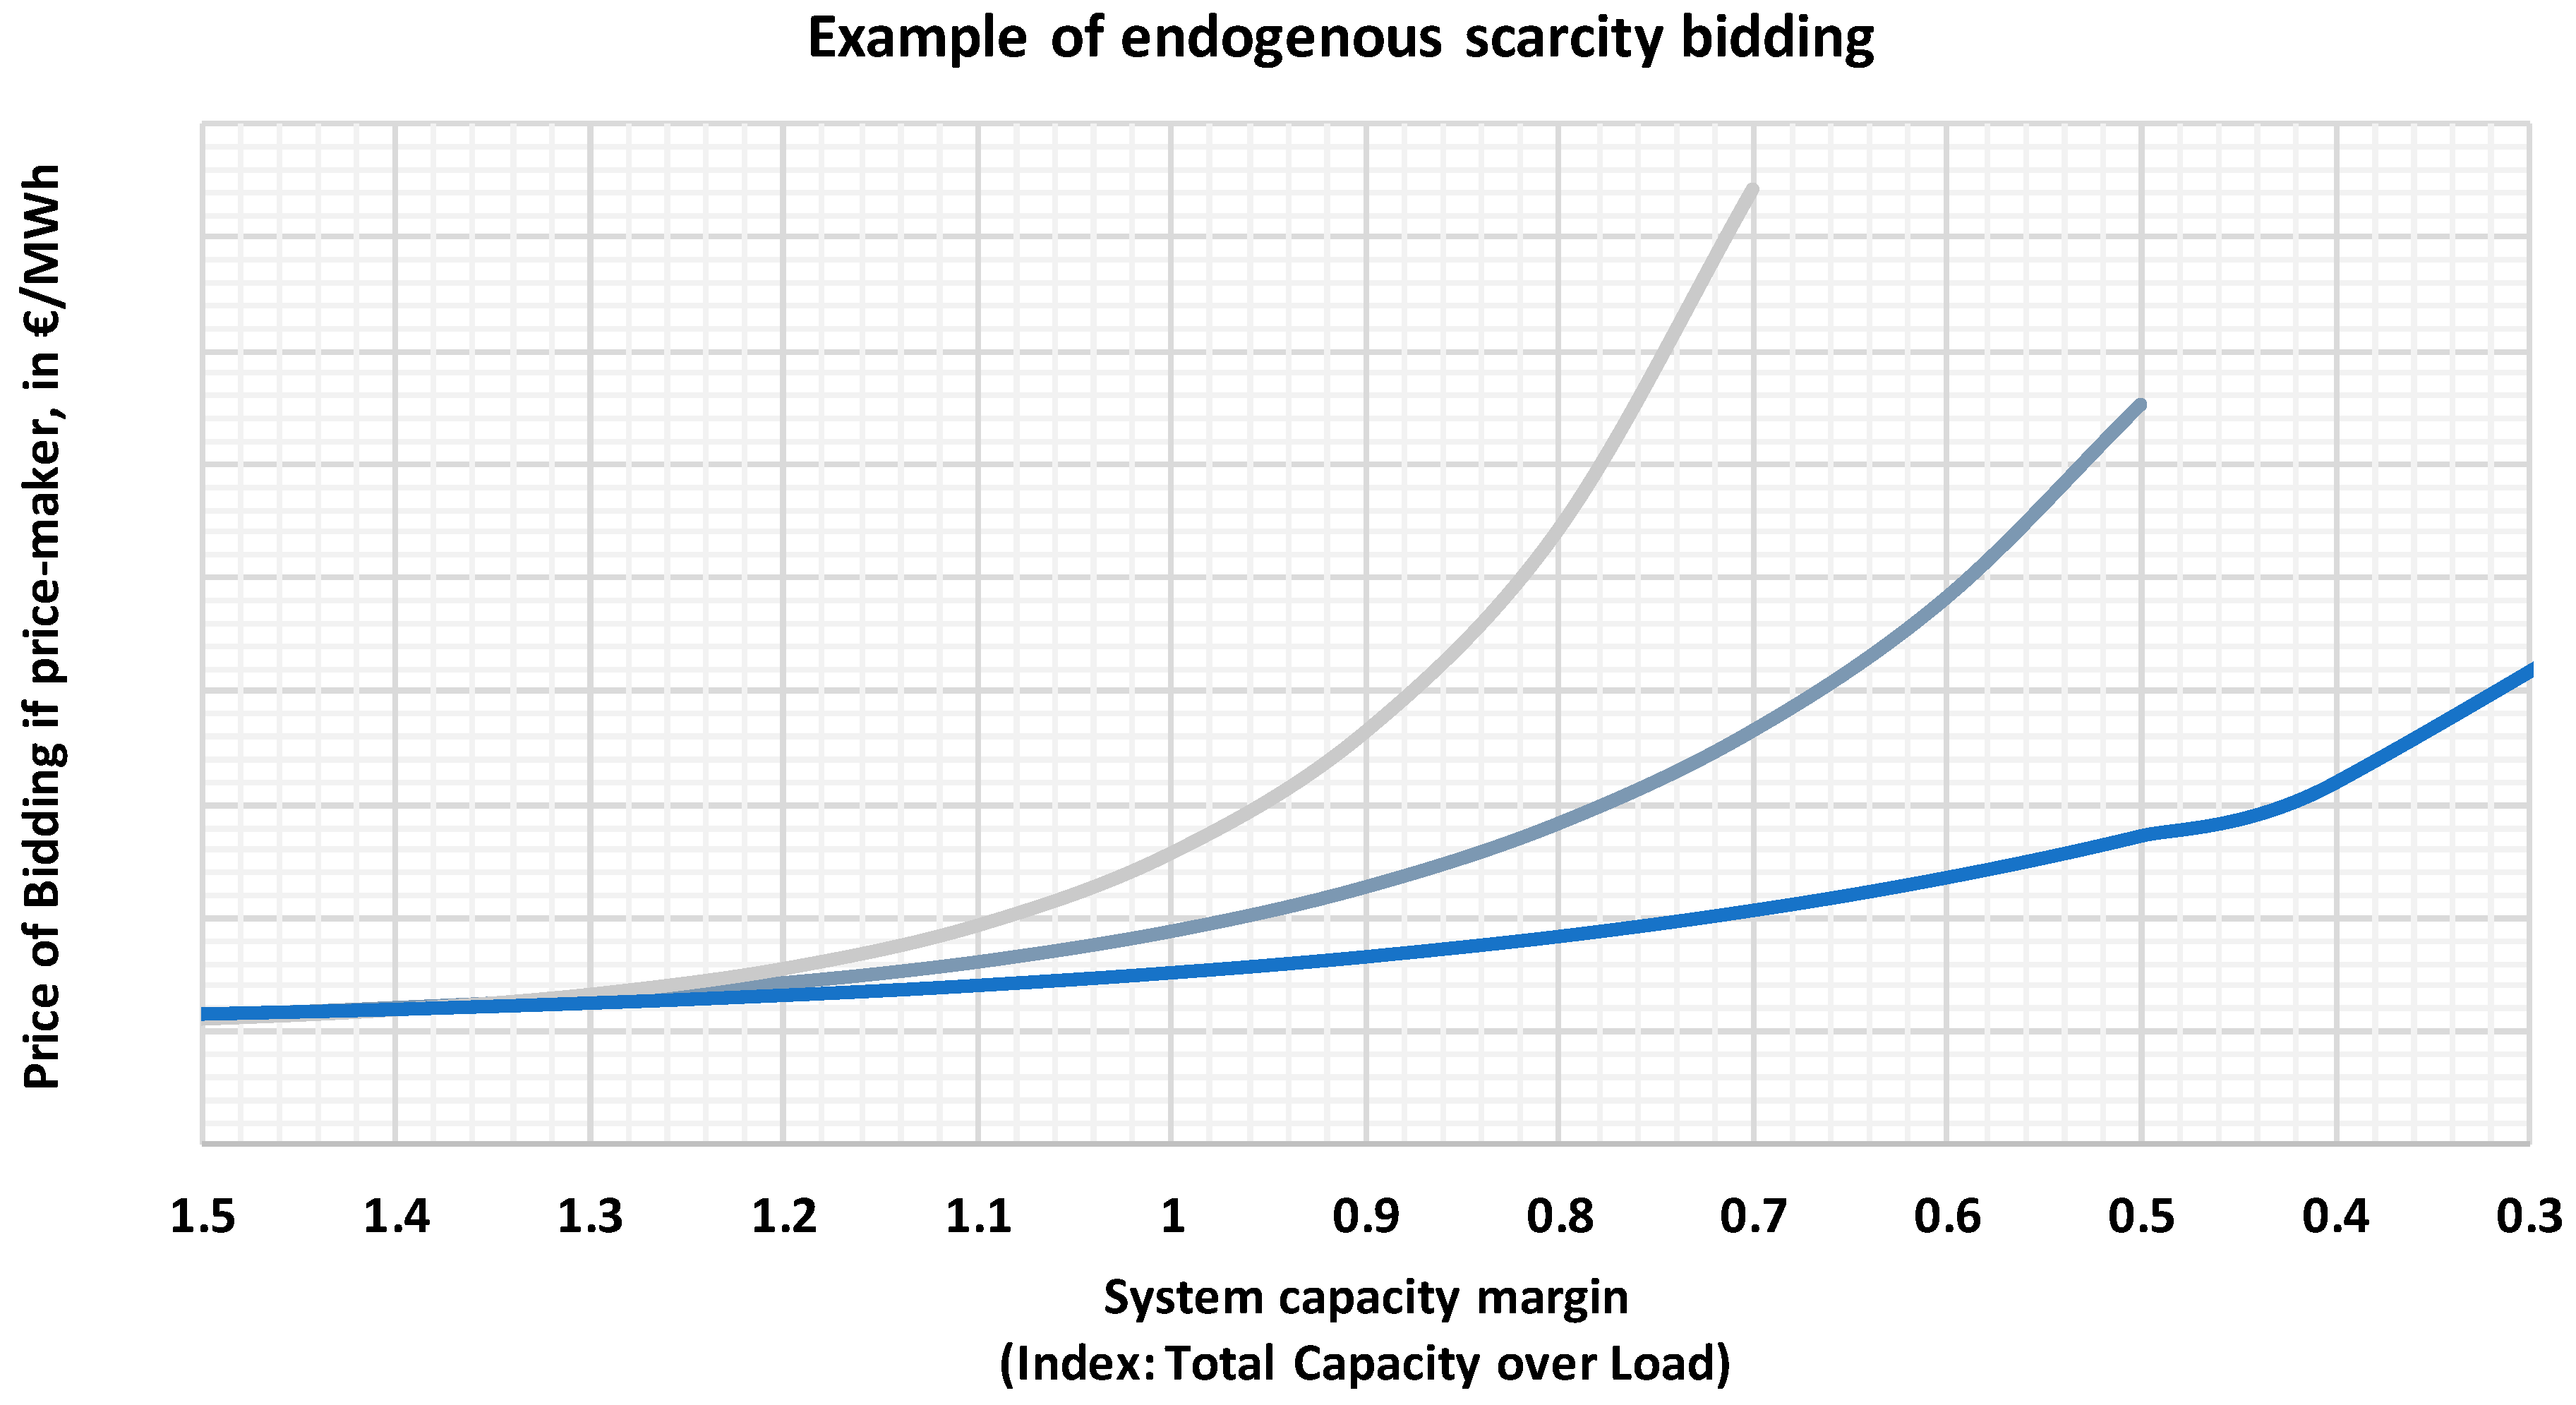
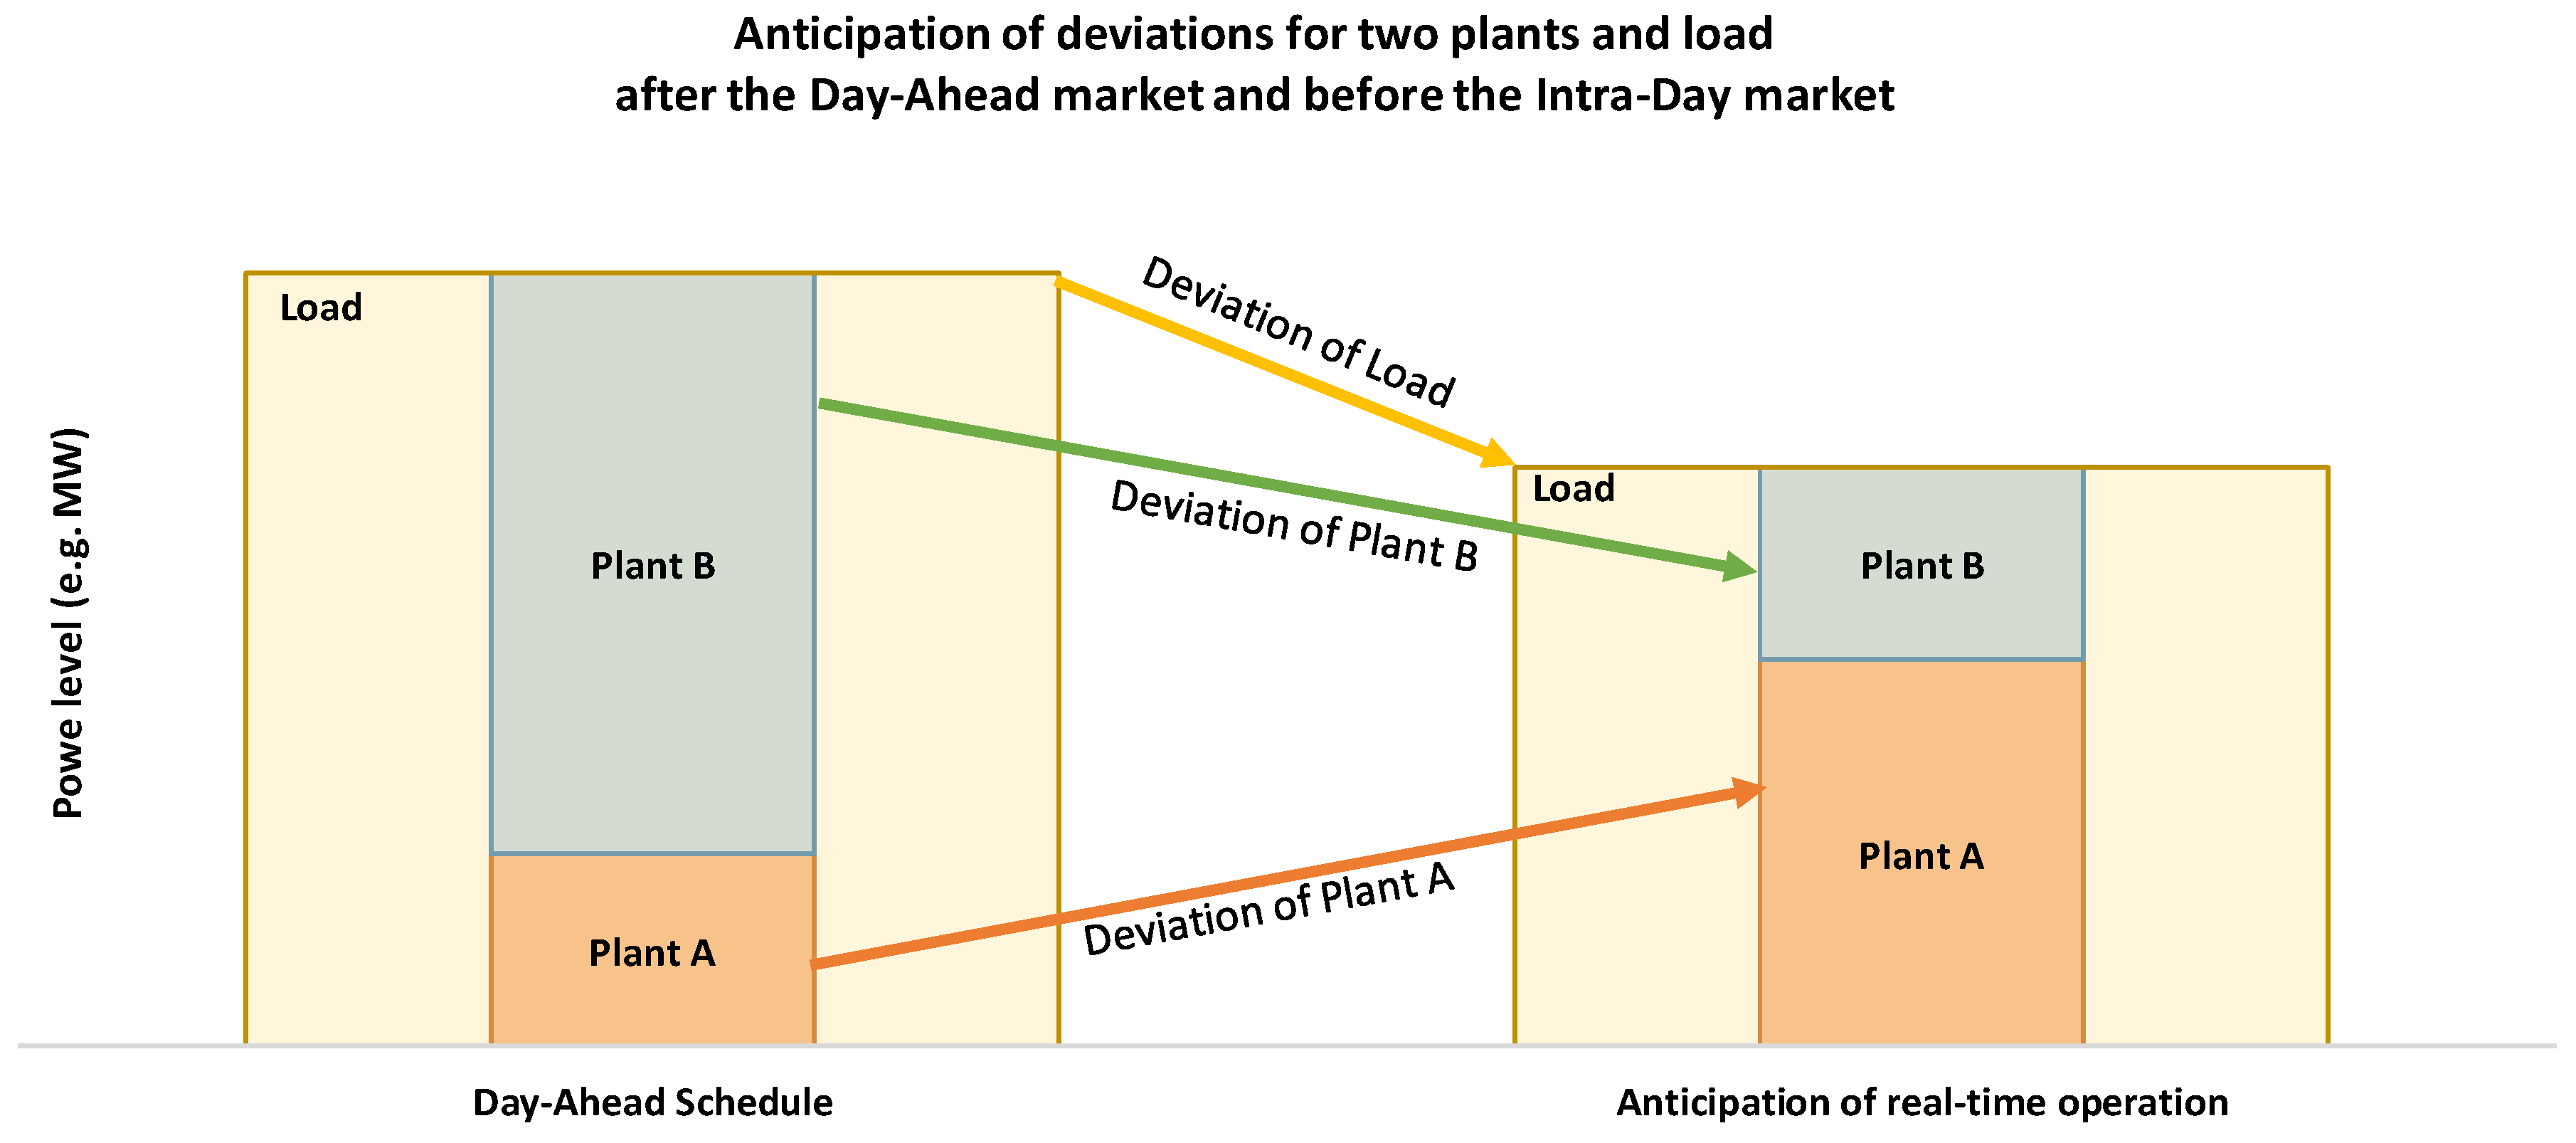
Table 1.
Steps of the PRIMES-IEM modelling approach, performing market simulation for the entire EU interconnected system.
Table 1.
Steps of the PRIMES-IEM modelling approach, performing market simulation for the entire EU interconnected system.
| Starting Point: Basic Projection, Including ETS Prices, Gas Prices, Variable RES Developments, Capacity Expansion, Electricity Demand, Reserve Requirements | |
|---|---|
| 1 | Simulation of the day-ahead market |
| 2 | Generation of random events between day-ahead and intra-day |
| 3 | Simulation of unit commitment to determine deviations from real-time operation |
| 4 | Simulation of the intra-day market for upward and downward deviations |
| 5 | Simulation of the reserves market or procurement |
| 6 | Final simulation of the system operation (real-time) |
| 7 | Calculation of payments by consumers, revenues of power plants, interconnections and demand response, as well as energy consumption and emissions |
Table 2.
Nomenclature of the PRIMES-IEM modelling approach.
| Nomenclature | |
|---|---|
| Sets | |
| or | system nodes |
| or | hourly time slices in a year |
| power plants | |
| or | interconnectors |
| types of ancillary services | |
| reference or swing node | |
| Parameters | |
| non-increasing demand function depending on prices | |
| power plant’s capacity | |
| power plant’s hourly availability factor in the day-ahead schedule | |
| interconnectors’ thermal capacity | |
| incidence matrix, describing the network’s topology | |
| inverse incidence matrix | |
| net transfer capacity limitations, which apply on pairs of nodes | |
| a matrix includes the susceptance of each interconnector in the elements of the main diagonal | |
| power plant’s technical minimum generation level | |
| power plant’s ramping capability | |
| power plant’s minimum up time | |
| power plant’s minimum down time | |
| demand for upward ancillary services | |
| demand for downward ancillary services | |
| unexpected variation of the hourly demand | |
| forecast errors of the availability of variable renewables sources or forced outages of large power plants | |
| unplanned loss of transmission lines | |
| demand for upward deviation in the intra-day market | |
| demand for downward deviation in the intra-day market | |
| start-up cost only for the plants performing start-up specifically in the intra-day | |
| shut-down cost only for the plants performing shut-down specifically in the intra-day | |
| hourly generation by each power plant in the day-ahead schedule (variable of DAM simulation fed as a parameter to the intra-day simulation) | |
| hourly plant’s contribution to upward ancillary services in the day-ahead schedule (variable of DAM simulation fed as a parameter to the intra-day simulation) | |
| hourly plant’s contribution to downward ancillary services in the day-ahead schedule (variable of DAM simulation fed as a parameter to the intra-day simulation) | |
| power plant’s operating status in the day-ahead schedule (variable of DAM simulation fed as a parameter to the intra-day simulation) | |
| flows over interconnections in the day-ahead schedule (variable of DAM simulation fed as a parameter to the intra-day simulation) | |
| hourly net position of a node in the day-ahead schedule (variable of DAM simulation fed as a parameter to the intra-day simulation) | |
| upward limit of cross-border contribution to ancillary services | |
| power plant’s operating level in the intra-day schedule (variable of intra-day simulation fed as a parameter to the reserves simulation) | |
| flows over interconnections in the intra-day schedule (variable of intra-day simulation fed as a parameter to the reserves simulation) | |
| hourly net position of a node in the intra-day schedule (variable of intra-day simulation fed as a parameter to the reserves simulation) | |
| Positive Variables | |
| hourly demand for electricity in the day-ahead schedule | |
| hourly generation by each power plant in the day-ahead schedule | |
| power plant’s bids for electricity expressed as non-decreasing functions | |
| hourly generation by power plants with priority dispatch | |
| hourly plant’s contribution to upward ancillary services | |
| hourly plant’s contribution to downward ancillary services | |
| power plant’s bids for contribution to upward ancillary services | |
| power plant’s bids for contribution to downward ancillary services | |
| upward adjustment of the plant scheduling committed in the DAM-derived schedule | |
| upward adjustment of the plant scheduling committed in the DAM-derived schedule | |
| upward adjustment provided by the possible start-up of an offline, in the DAM schedule, plant | |
| downward adjustment provided by the possible shut-down of a committed, in the DAM schedule, plant | |
| power plants’ bids for an upward adjustment in the intra-day market | |
| power plants’ bids for a downward adjustment in the intra-day market | |
| Free Variables | |
| flows over interconnections | |
| hourly net position (sum of energy inflows and outflows in a node) | |
| phase angles for nodes | |
| marginal electricity price of the system | |
| adjustment of flows over interconnections in the intra-day market | |
| adjustment of the net position of a node in the intra-day market | |
| cross-border contribution to ancillary services | |
| Binary Variables | |
| power plant’s operating status (1 if committed, 0 else) in the day-ahead schedule | |
| start-up of a power plant in the day-ahead schedule | |
| shut-down of a power plant in the day-ahead schedule | |
| power plant’s operating status (1 if committed, 0 else) in the intra-day market | |
| start-up of a power plant in the intra-day market | |
| shut-down of a power plant in the intra-day market | |
| deviation of power plant’s operating status between the day-ahead and intra-day schedule (1 if committed in the intra-day, while offline in the DAM) | |
| deviation of power plant’s operating status between the day-ahead and intra-day schedule (1 if committed in the DAM, while offline in the intra-day) | |
| start-up of a power plant in the intra-day, which was offline in the DAM | |
| shut-down of a power plant in the intra-day, which was committed in the DAM | |
Table 3.
Total costs (and payments) in the EU power markets.
| EU in 2030 | Optimal Case | Current Practices | Cost Savings Due to Market Reform | ||
|---|---|---|---|---|---|
| - | Bn € | Bn € | Bn € | % Difference | Shares by Market Stage |
| Day-ahead market | 317.6 | 326.2 | 8.5 | 2.6% | 34.3% |
| Intra-day market | 11.6 | 22.1 | 10.5 | 47.3% | 42.1% |
| Ancillary services | 1.9 | 7.7 | 5.9 | 75.9% | 23.6% |
| Total | 331.2 | 356.0 | 24.9 | 7.0% | 100.0% |
Table 4.
Total costs (and payments) in the power market by region 1.
| EU in 2030 | Optimal Case | Current Practices | Cost Savings Due to Market Reform | |
|---|---|---|---|---|
| Total all market stages | Bn € | Bn € | Bn € | % difference |
| North Europe | 30.8 | 31.8 | 1.0 | 3.3% |
| British Isles | 41.3 | 47.3 | 6.0 | 12.8% |
| Central Western Europe | 178.6 | 181.7 | 3.0 | 1.7% |
| Central Eastern Europe | 44.4 | 46.6 | 2.2 | 4.7% |
| Iberian Peninsula | 26.9 | 38.3 | 11.4 | 29.8% |
| South Eastern Europe | 9.2 | 10.4 | 1.2 | 11.4% |
| Day-Ahead Markets | Bn € | Bn € | Bn € | % difference |
| North Europe | 29.7 | 29.7 | 0.0 | 0.1% |
| British Isles | 39.3 | 43.7 | 4.4 | 10.0% |
| Central Western Europe | 171.9 | 168.3 | −3.6 | −2.1% |
| Central Eastern Europe | 42.3 | 40.7 | −1.6 | −3.9% |
| Iberian Peninsula | 25.8 | 34.4 | 8.6 | 25.0% |
| South Eastern Europe | 8.6 | 9.4 | 0.8 | 8.1% |
| Intra Day Markets | Bn € | Bn € | Bn € | % difference |
| North Europe | 0.6 | 1.3 | 0.7 | 52.5% |
| British Isles | 1.9 | 2.2 | 0.3 | 15.4% |
| Central Western Europe | 6.1 | 11.0 | 5.0 | 45.1% |
| Central Eastern Europe | 1.7 | 4.0 | 2.3 | 58.1% |
| Iberian Peninsula | 0.9 | 2.6 | 1.7 | 65.2% |
| South Eastern Europe | 0.5 | 0.9 | 0.4 | 45.9% |
| Ancillary Services | Bn € | Bn € | Bn € | % difference |
| North Europe | 0.5 | 0.8 | 0.3 | 40.3% |
| British Isles | 0.1 | 1.4 | 1.3 | 95.3% |
| Central Western Europe | 0.7 | 2.4 | 1.7 | 70.7% |
| Central Eastern Europe | 0.4 | 1.8 | 1.4 | 79.2% |
| Iberian Peninsula | 0.1 | 1.2 | 1.1 | 88.4% |
| South Eastern Europe | 0.1 | 0.1 | 0.0 | 6.7% |
1 Regions: North Europe: Denmark, Sweden, Finland, Latvia, Estonia, Lithuania; British Isles: Ireland, UK; Central Western Europe: Austria, Belgium, Luxembourg, Netherlands, Germany, France, Italy; Central Eastern Europe: Slovenia, Czechia, Slovakia, Poland, Hungary, Croatia, Romania; Iberian Peninsula: Spain, Portugal; South-Eastern Europe: Bulgaria, Greece, Cyprus, Malta.
Table 5.
Decomposition of cost savings by type of reform measure.
| EU in 2030 [Bn €] | Total | Day-Ahead Markets | Intra-Day Markets | Ancillary Services |
|---|---|---|---|---|
| Coordinated management of reserves and broad market participation | 5.0 | - | - | 5.0 |
| Coupled Intra-Day markets and broad participation of resources | 4.7 | - | 4.7 | - |
| Liquid and coupled Day-Ahead Markets co-optimizing energy and reserves | 4.8 | 2.2 | 2.6 | - |
| Removal of priority dispatch and nominations in all market stages | 4.6 | 1.3 | 2.4 | 0.9 |
| Removal of NTCs in all market stages and flow-based allocation of interconnection capacities | 5.8 | 5.0 | 0.8 | - |
| Total cost savings | 24.9 | 8.5 | 10.5 | 5.9 |
Table 6.
Role of cross-border flows.
| EU in 2030 | Optimal Case | Current Practices | Difference | % Difference |
|---|---|---|---|---|
| Cross-border flows in the Day-Ahead market (TWh) | 312 | 213 | 100 | 46.8% |
| Cross-border flows in the intra-day market (TWh) | 182 | 76 | 106 | 140.7% |
| Annual contribution of cross-border to reserves market in GW | 3433 | 313 | 3120 | 996.8% |
Table 7.
Generation by plant type in the day-ahead market.
| EU in 2030 | Optimal Case | Current Practices | Difference | % Difference |
|---|---|---|---|---|
| - | TWh | TWh | TWh | % |
| Electricity demand | 3339 | 3339 | 0 | 0.0% |
| Demand Response | 0 | 3 | −3 | −100.0% |
| Net Imports | −1 | −1 | 0 | 0.0% |
| Total electricity generation | 3340 | 3340 | 0 | 0.0% |
| By plant type: | - | - | - | - |
| Nuclear | 698 | 682 | 15 | 2.3% |
| Solids | 342 | 424 | −81 | −19.2% |
| Gas | 607 | 640 | −33 | −5.2% |
| RES | 1556 | 1458 | 99 | 6.8% |
| small CHP | 137 | 136 | 0 | 0.4% |
Table 8.
Participation by plant type in the intra-day market.
| EU in 2030 | Optimal Case | Current Practices | Difference | % Difference |
|---|---|---|---|---|
| - | TWh | TWh | TWh | % |
| Upward and downward re-dispatching needs | 473 | 543 | −70 | −13.0% |
| Participation by plant type: | - | - | - | - |
| Nuclear | 22 | 40 | −18 | −44.9% |
| Solids | 82 | 145 | −62 | −43.1% |
| Gas | 180 | 235 | −55 | −23.4% |
| RES | 189 | 125 | 65 | 52.0% |
Table 9.
Res generation and curtailment in real-time schedule.
| EU in 2030 | Optimal Case | Current Practices | Difference | % Difference |
|---|---|---|---|---|
| DAM scheduled quantities for RES generation (TWh) | 1160 | 1160 | 0 | 0.0% |
| Curtailment of RES generation in real-time schedule (TWh) | 7.5 | 19.0 | −11.5 | −60.6% |
| Curtailment of RES generation, as percentage of the DAM scheduled quantities (%) | 0.6% | 1.6% | −1.0% | −60.6% |
© 2019 by the authors. Licensee MDPI, Basel, Switzerland. This article is an open access article distributed under the terms and conditions of the Creative Commons Attribution (CC BY) license (http://creativecommons.org/licenses/by/4.0/).
Share and Cite
MDPI and ACS Style
Kannavou, M.; Zampara, M.; Capros, P. Modelling the EU Internal Electricity Market: The PRIMES-IEM Model. Energies 2019, 12, 2887. https://doi.org/10.3390/en12152887
AMA Style
Kannavou M, Zampara M, Capros P. Modelling the EU Internal Electricity Market: The PRIMES-IEM Model. Energies. 2019; 12(15):2887. https://doi.org/10.3390/en12152887
Chicago/Turabian StyleKannavou, Maria, Marilena Zampara, and Pantelis Capros. 2019. "Modelling the EU Internal Electricity Market: The PRIMES-IEM Model" Energies 12, no. 15: 2887. https://doi.org/10.3390/en12152887
Note that from the first issue of 2016, this journal uses article numbers instead of page numbers. See further details here.