Carbon Dioxide Capture from Flue Gas Using Tri-Sodium Phosphate as an Effective Sorbent


1
Catalytic Processes and Materials, Faculty of Science and Technology, MESA+ Institute for Nanotechnology, University of Twente, Drienerlolaan 5, 7522 NB Enschede, The Netherlands
2
Department of Chemical Engineering, University of Western Australia, 35 Stirling Highway, Crawley, Western Australia 6009, Australia
3
Department of Chemical Engineering, Indian Institute of Technology, Madras, Chennai 600036, India
*
Author to whom correspondence should be addressed.
†
Authors contributed equally.
Energies 2019, 12(15), 2889; https://doi.org/10.3390/en12152889
Submission received: 18 June 2019
/
Revised: 18 July 2019
/
Accepted: 24 July 2019
/
Published: 26 July 2019
(This article belongs to the Special Issue Carbon Capture, Storage and Utilization)
Abstract
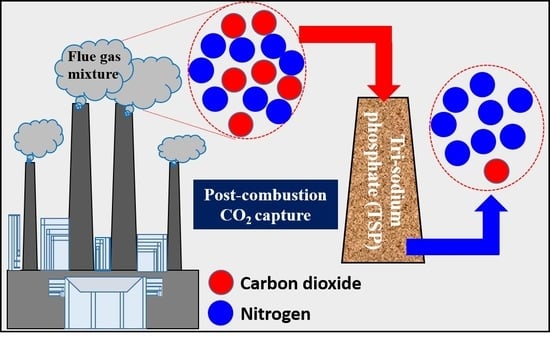
:Fossil fuels are dominant as an energy source, typically producing carbon dioxide (CO2) and enhancing global climate change. The present work reports the application of low-cost tri-sodium phosphate (TSP) to capture CO2 from model flue gas (CO2 + N2) mixture, in a batch mode and fixed-bed setup. It is observed that TSP has a high CO2 capture capacity as well as high CO2 selectivity. At ambient temperature, TSP shows a maximum CO2 capture capacity of 198 mg CO2/g of TSP. Furthermore, the CO2 capture efficiency of TSP over a flue gas mixture was found to be more than 90%. Fresh and spent materials were characterized using powder X-ray diffraction (PXRD), scanning electron microscopy (SEM), and Fourier transformed infrared spectroscopy (FTIR). Preliminary experiments were also conducted to evaluate the performance of regenerated TSP. The spent TSP was regenerated using sodium hydroxide (NaOH) and its recyclability was tested for three consecutive cycles. A conceptual prototype for post-combustion CO2 capture based on TSP material has also been discussed.
1. Introduction
Coal-fired thermal power stations contribute immensely to the anthropogenic release of carbon dioxide (CO2) in the atmosphere. CO2 is considered to be the major greenhouse gas, potentially contributing to global climate change [1,2,3,4]. According to a report of the Intergovernmental Panel on Climate Change, the projected carbon emissions from the energy sector will be twice as high by 2050 [5]. In the year 2013, the recorded global carbon dioxide emission from burning fossil fuels was 36 billion metric tons (39.7 billion tons) [6]. Carbon dioxide capture, storage, and utilization (CCSU) is an emerging potential technology to address this issue [7]. Therefore, post-combustion CO2 capture from the flue gas (mainly CO2 + N2) is a key process as it can be retrofitted to the existing fleet of coal-fired power stations [8,9]. Post-combustion capture of CO2 from conventional power plants are quite expensive due to the low partial pressure of CO2 (typically 10–20%) in the flue gas mixture. It is well established that in amine-based CO2 capture processes, corrosion of process pipelines remains a genuine concern [10]. Adsorption of CO2 using solid sorbents has proved to be efficient at lab-scale operation since they can produce high-purity CO2 streams with low energy consumption and minimum concerns on corrosion of process pipelines [11]. As a result, a wide variety of solid adsorbents have been studied in recent past such as zeolites [12], activated carbons [13], hydrotalcite-like compounds [10], metal oxides [14], metal-organic frameworks (MOFs) [15], silica gel [16], amine-based adsorbents [17,18], and amine-functionalized silica gel [19]. However, many of the solid adsorbents developed so far suffer from problems such as low scalability, poor moisture tolerance, and high material cost. Some of these adsorbents are also used to capture CO2 directly from the air where the concentration of CO2 is comparatively low [20,21].
Trisodium phosphate (TSP) is an inorganic material that has the potential to capture CO2 from the flue gas in a cost-effective way. TSP is a highly alkaline (pH of a 1% aqueous solution is 12.5, measured on pH meter from Mettler Toledo) and non-volatile compound with negligible thermal degradation (melting point of anhydrous and dodecahydrate TSP is 1856 and 346.5 K, respectively). It is frequently used as a food additive, cleaning agent, and in boilers, because phosphate in TSP buffers the water to minimize pH fluctuation, and precipitates like calcium or magnesium salts gets deposited as a soft layer rather than a hard scale [22].
Previously, Balsora and Mondal [23] have reported the solubility of CO2 in aqueous TSP and blends of diethanolamine (DEA) with TSP. Authors studied the absorption of CO2 at different TSP concentrations (1.0–2.0 kmol/m3), temperatures (303.14–333.14 K), and inlet CO2 partial pressures (10.13–20.26 kPa). It was reported [23] that CO2 solubility increases with increasing TSP concentration as well as temperature. It was also reported that the CO2 solubility increases with the increasing mole fraction of TSP at a fixed temperature and partial pressure of CO2. Maximum CO2 solubility in DEA and TSP blends was found to be lower than that of TSP alone [24].
For the first time, to the best of our knowledge, we are using TSP as a solid sorbent for the removal of CO2 from flue gas mixture. The objective of the present work is to study the kinetics of CO2 capture and separation efficiency of carbon dioxide from flue gas mixture using solid TSP as a sorbent. A model flue gas mixture with 16.1 mol% CO2 and 83.9 mol% N2 is used during experiments [25]. A gas mixture of 85 mol% CO2 and 15 mol% N2 is also used to elucidate the effect of CO2 composition. Fresh and spent materials were characterized using SEM, PXRD, and FTIR spectroscopy to gain mechanistic insights. Finally, regeneration and reusability of spent TSP are also studied.
2. Materials and Methods
2.1. Materials
Pure carbon dioxide gas, flue gas mixtures (16.1 mol% CO2/83.9 mol% N2), and a gas mixture of 85 mol% CO2/15 mol% N2 with a certified purity of more than 99.9% were supplied by Deluxe Industrial Gases, Pune, India. Dodecahydrate tri-sodium phosphate, Na3PO4·12H2O, with ≥98% purity (AR grade) was purchased from Rankem Ltd, Pune, India. Sodium hydroxide with >98% purity was purchased from Qualigens Fine Chemicals, Mumbai, India. All the materials were used without any further purification.
2.2. Characterization of Materials
FTIR spectra were recorded using GX Perking Elmer spectrometer with 4 cm−1 resolutions, while the number of scans was 10. Prior to measurement, the sample was diluted with KBr and pressed into thin wafers. The SEM images (morphological studies) were obtained on an FEI Quanta 200 3D dual beam ESEM, operating at 20 kV. Powder X-ray diffraction spectra for fresh and spent TSP were recorded on Philips powder XRD between the 2θ of 5°–60° at room temperature.
2.3. Apparatus and Procedure
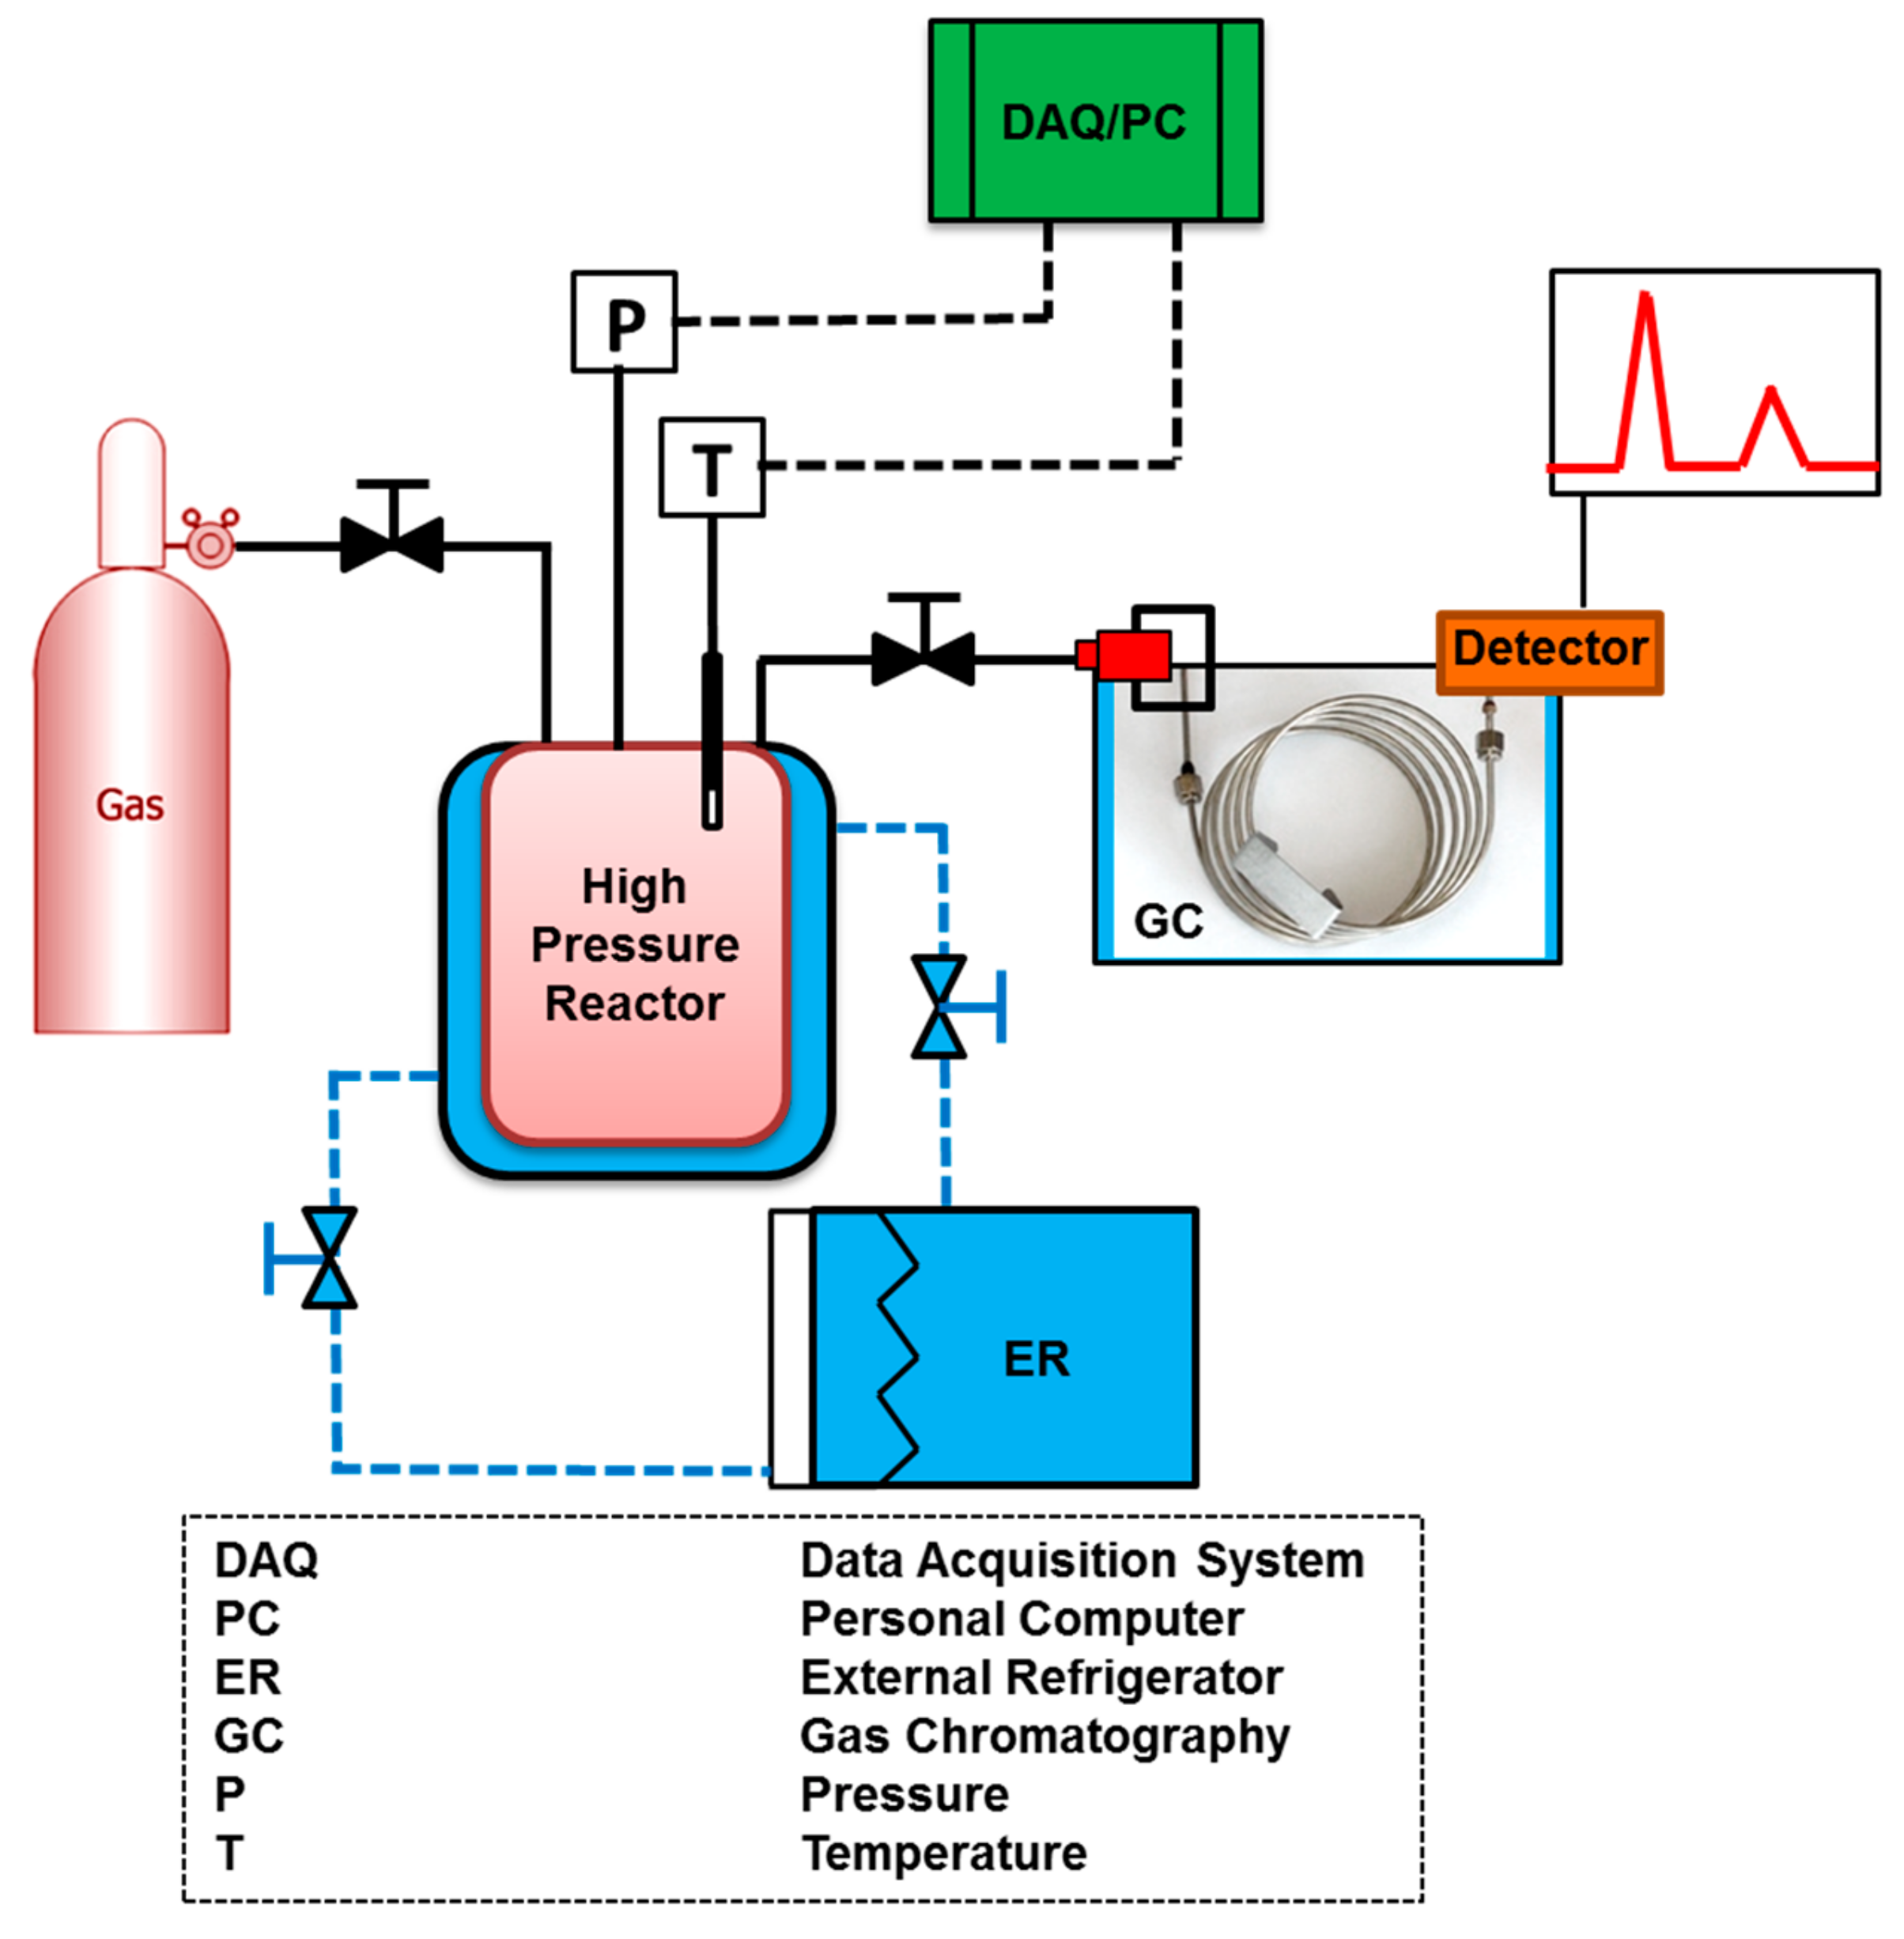
Two high-pressure stainless-steel (SS-316) reactors with different volumes were used in this study. The experiments with 4 g TSP were done in a 25 cc reactor (Figure 1), while a 250 cc reactor was used for 40 and 100 g TSP samples. The ports with Swagelok connection, on top of the cover plate of the reactor, were used for a thermocouple, gas inlet, gas outlet, and pressure transducer. The pressure of the reactor during experiments was recorded using a pressure transducer (Wika, Klingenberg, Germany), with a range of 0–16 MPa and accuracy of 0.075% of the span. Analog signals from pressure transducer and thermocouple were processed with the help of a data acquisition system and a dedicated computer, connected to the experimental setup. The required experimental temperature was acquired by an external temperature-controlled unit (ER, Julabo GmbH, Germany) The setup was equipped with a gas chromatograph GC-2014AT (Shimadzu corporation, Kyoto, Japan) to measure the composition of the gas phase in the reactor.
The reactor along with the fittings was evacuated at 0.001 MPa for 10 minutes using an external vacuum pump (KNF lab, Trenton, NJ, USA). The evacuated reactor was pressurized by supplying CO2 and N2 mixture to the experimental pressure at experimental temperature. Time zero of the reaction was the time at which the sorbent was exposed to the flue gas mixture and the drop in pressure inside the reactor was recorded every 5 s using a data acquisition system (DAQ). The drop in pressure and temperature with respect to time was used to get the kinetics of the reaction. The total number of moles of gas consumed was calculated by using Equation (1). The gas composition at the end of the experiment was analyzed by injecting a small quantity of gas, taken from the reactor, into gas chromatography. The GC is equipped with a thermal conductivity detector and Shin Carbon ST column. Experimental procedure for 40 g and 100 g TSP was similar to the one followed for 4 g measurements.
2.4. Regeneration Process
Some of the preliminary experiments were conducted to regenerate the spent TSP. More precisely, the spent TSP was regenerated using sodium hydroxide (NaOH), in which sodium hydroxide (NaOH) pellets were inserted inside the reactor (containing CO2-loaded TSP in slurry form) and mixed at room temperature and atmospheric pressure condition for ~15 min. Reaction mechanism of spent TSP with NaOH has been discussed in Section 3.2. (Refer to results and discussion section).
2.5. The Calculation for the Amount of Gas Consumed
The reaction between TSP and CO2 starts as soon as they are brought in contact with each other, and this results in a continuous drop of the reactor pressure. At a given time, the total number of moles of the gas consumed can be calculated by the following equation [25].
where P is pressure (kPa), R is the gas constant (J·K−1·mol−1), T is temperature (K), V is the volume of the reactor (cm3), and n is the number of moles of gas present in the system. z is the compressibility factor calculated by the following equation [26].
where , , , , and ω = Acentric factor.
2.6. Calculation of Rate of Gas Consumption
The rate of gas consumption is calculated using the forward difference method given below [25].
The average of these rates over 10 min was computed and reported as the average rate of CO2 capture. Here, is the number of moles of gas consumed at the end of the experiment.
2.7. The Calculation for CO2 Capture Efficiency (η)
CO2 capture efficiency of the material over a gas mixture (flue gas mixture) was calculated by using Equation (4), which was adopted from our previous work [25] and modified.
where is the mole fraction of CO2 in the feed gas mixture and the mole fraction of CO2 at the end of the experiment determined by gas chromatography.
3. Results and Discussion
3.1. Material Characterization Analysis
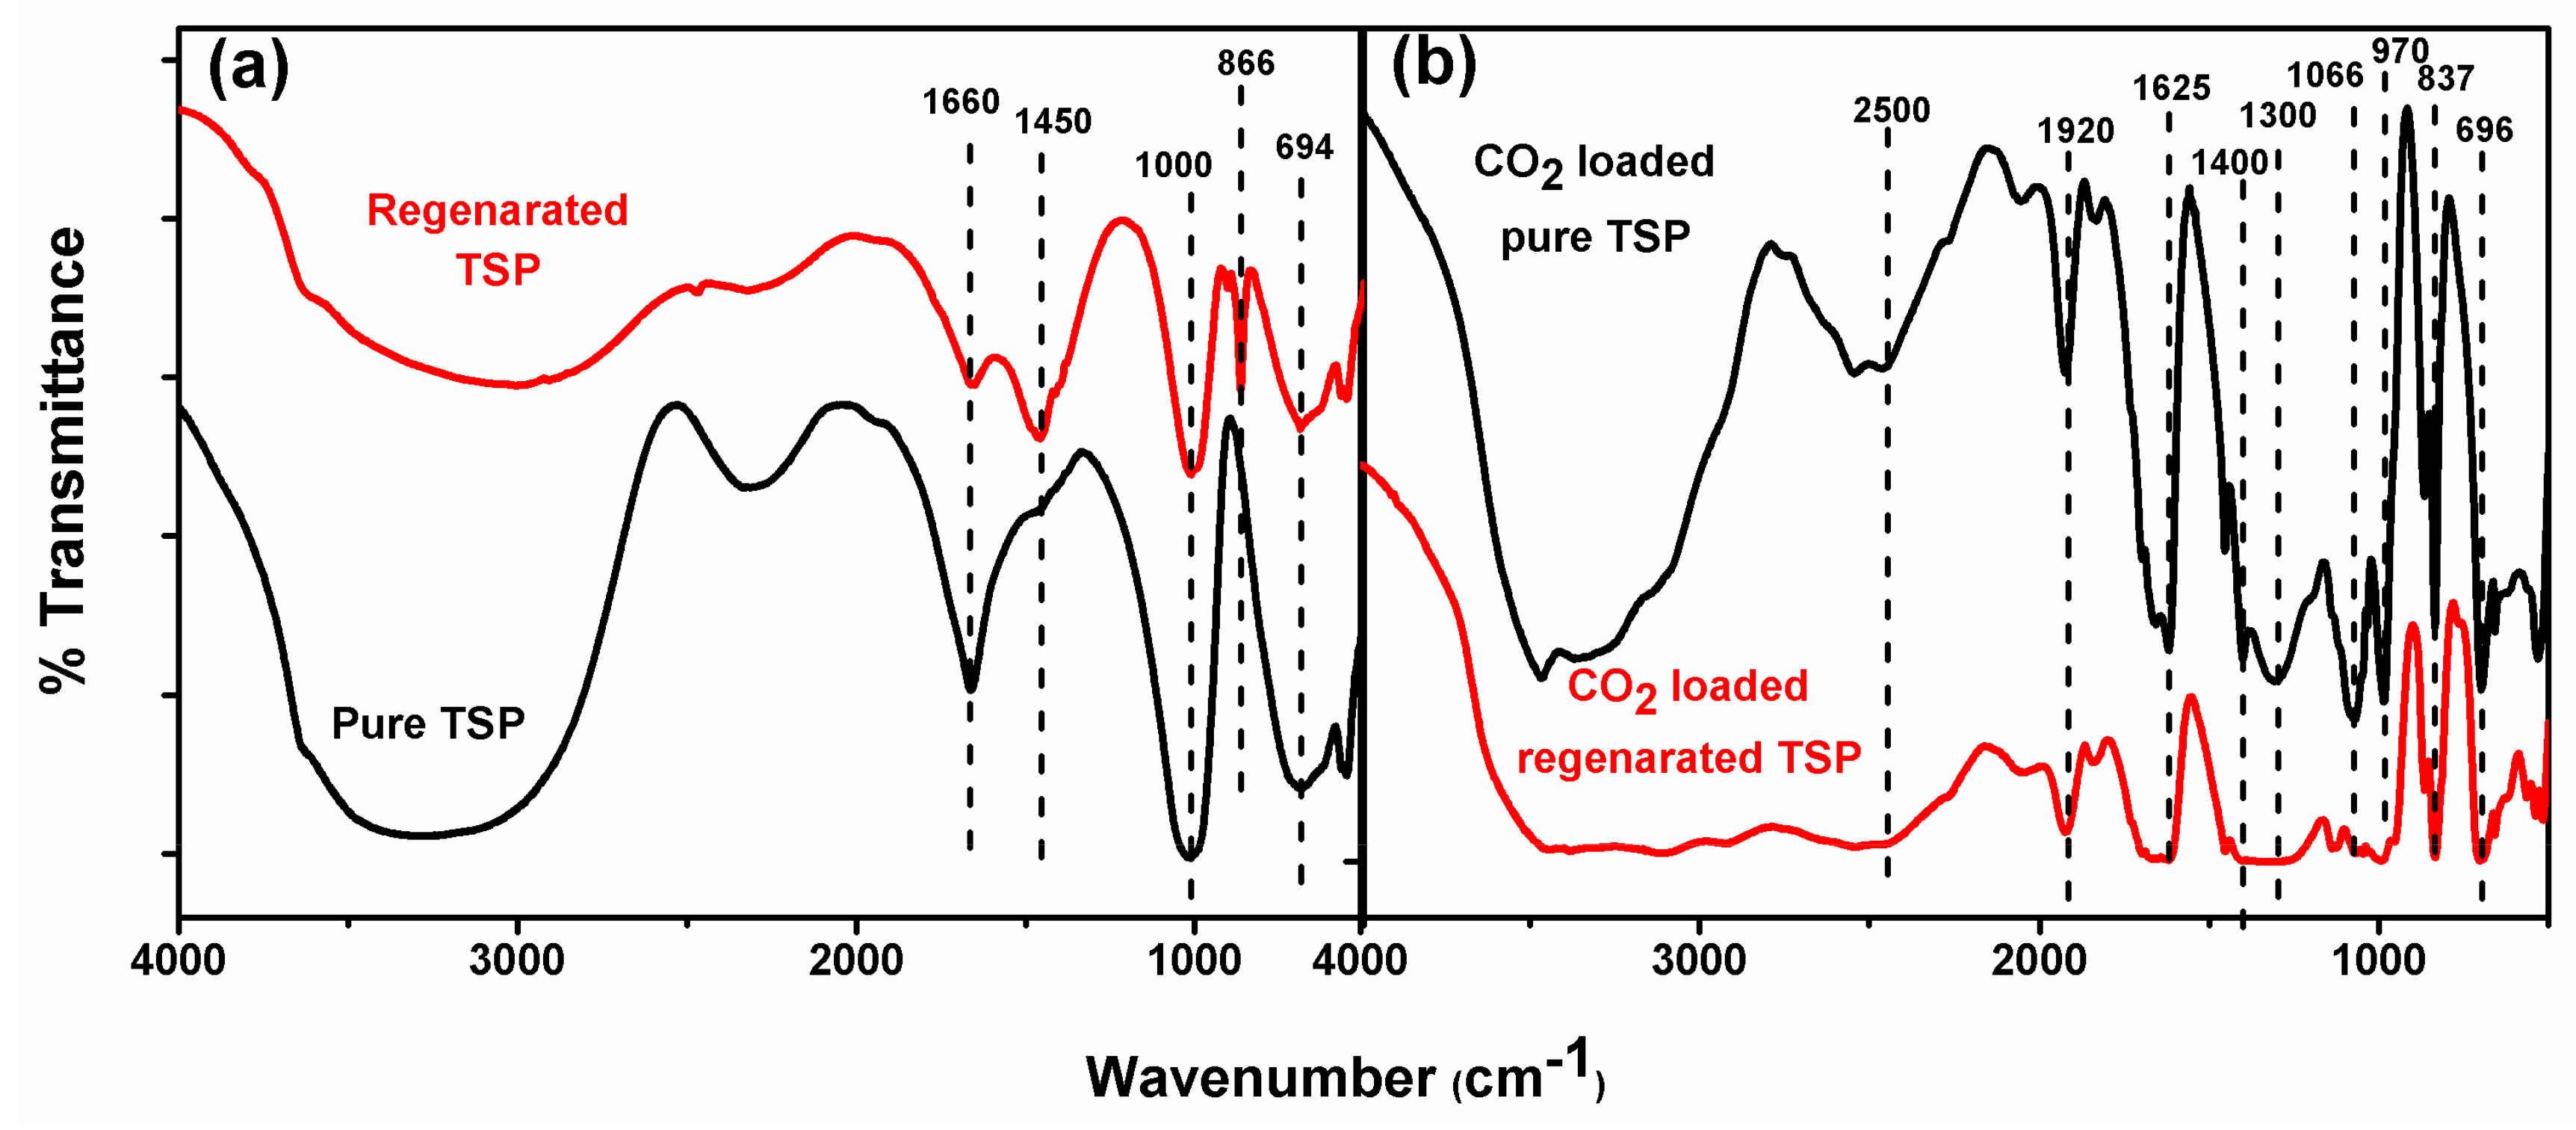
TSP, before and after the gas uptake measurements, were analyzed using FTIR spectroscopy for identification of the functional groups. Figure 2a shows the FTIR spectra of pure TSP and regenerated TSP while Figure 2b shows the CO2-loaded pure TSP and CO2-loaded regenerated TSP. Several distinct peaks can be seen for fresh TSP at 3200, 1660, 1450, 1000, and 694 cm−1. The strong downward peak at 1000 cm−1 corresponds to the O–P–O asymmetric stretching present in PO3 group of TSP [27]. Regenerated-TSP also shows a similar spectrum as fresh TSP, with one additional peak at 866 cm−1, which is a characteristic band for C–O stretching in the carbonate ions (CO32−). This implies the formation of sodium carbonate as a side product during regeneration by NaOH [27]. Figure 2b shows the characteristic peaks resulting from the reaction of CO2 with TSP. Peaks at 970, 1066, and 1470 cm−1 show the presence of disodium hydrogen phosphate and peaks at 696, 837, 1300, 1401, 1625, 1910, and 2500 cm−1 represents sodium bicarbonate, the two major products formed by the reaction of CO2 with TSP [27,28]. A broad peak at 3500–3200 cm−1, which can be attributed to –OH stretch, confirms the presence of water.
Further, to confirm the products formed by the reaction of TSP and CO2, samples were analyzed using powder X-ray diffraction. Figure 3a shows the XRD patterns of pure TSP and regenerated TSP. Peaks at 9, 15, 21, 24, 29, 31, 33, and 46 were obtained in both TSP and regenerated-TSP (JCPDS PDF No: 01-0957). The qualitative comparison of intensities shows that the regenerated TSP is less intense compared to fresh TSP, implying the partial regeneration of TSP and the possible formation of sodium carbonate in the presence of NaOH. Moreover, the XRD patterns for CO2-loaded TSP and CO2-loaded regenerated TSP (Figure 3b) confirms the presence of NaHCO3 (JCPDS PDF No: 01-0909) and Na2HPO4 (JCPDS PDF No: 01-0997).
3.2. Sorption Reaction Mechanism
Material characterization supports the formation of sodium bicarbonate and disodium hydrogen phosphate during CO2 capture cycle (Equation (5)) and partial regeneration of TSP by the treatment of NaOH (Equation (6)) (discussed in Section 3.3). During regeneration of TSP, NaOH also reacts with the sodium bicarbonate which has formed earlier in the reactor (Equation (5)) resulting in the formation of sodium carbonate (Equation (7)) (confirmed by IR). Residual sodium carbonate thus reacts with CO2 in the next CO2 capture cycle to give sodium bicarbonate (Equation (8)).
The sorption mechanism of acidic carbon dioxide gas in basic tri-sodium phosphate is quite complicated, which start at a solid-gas interface. However, as reaction proceeds, liquid phase (water) appears, which negatively affects the reaction kinetics (Equation (5)). Thus, it is important to understand the CO2 capture kinetics using TSP as a sorbent. Keeping it in mind, the effect of various experimental parameters on the kinetics were studied and is discussed below.
3.3. Gas Uptake Kinetics
3.3.1. Effect of Temperature on the Gas Uptake Kinetics
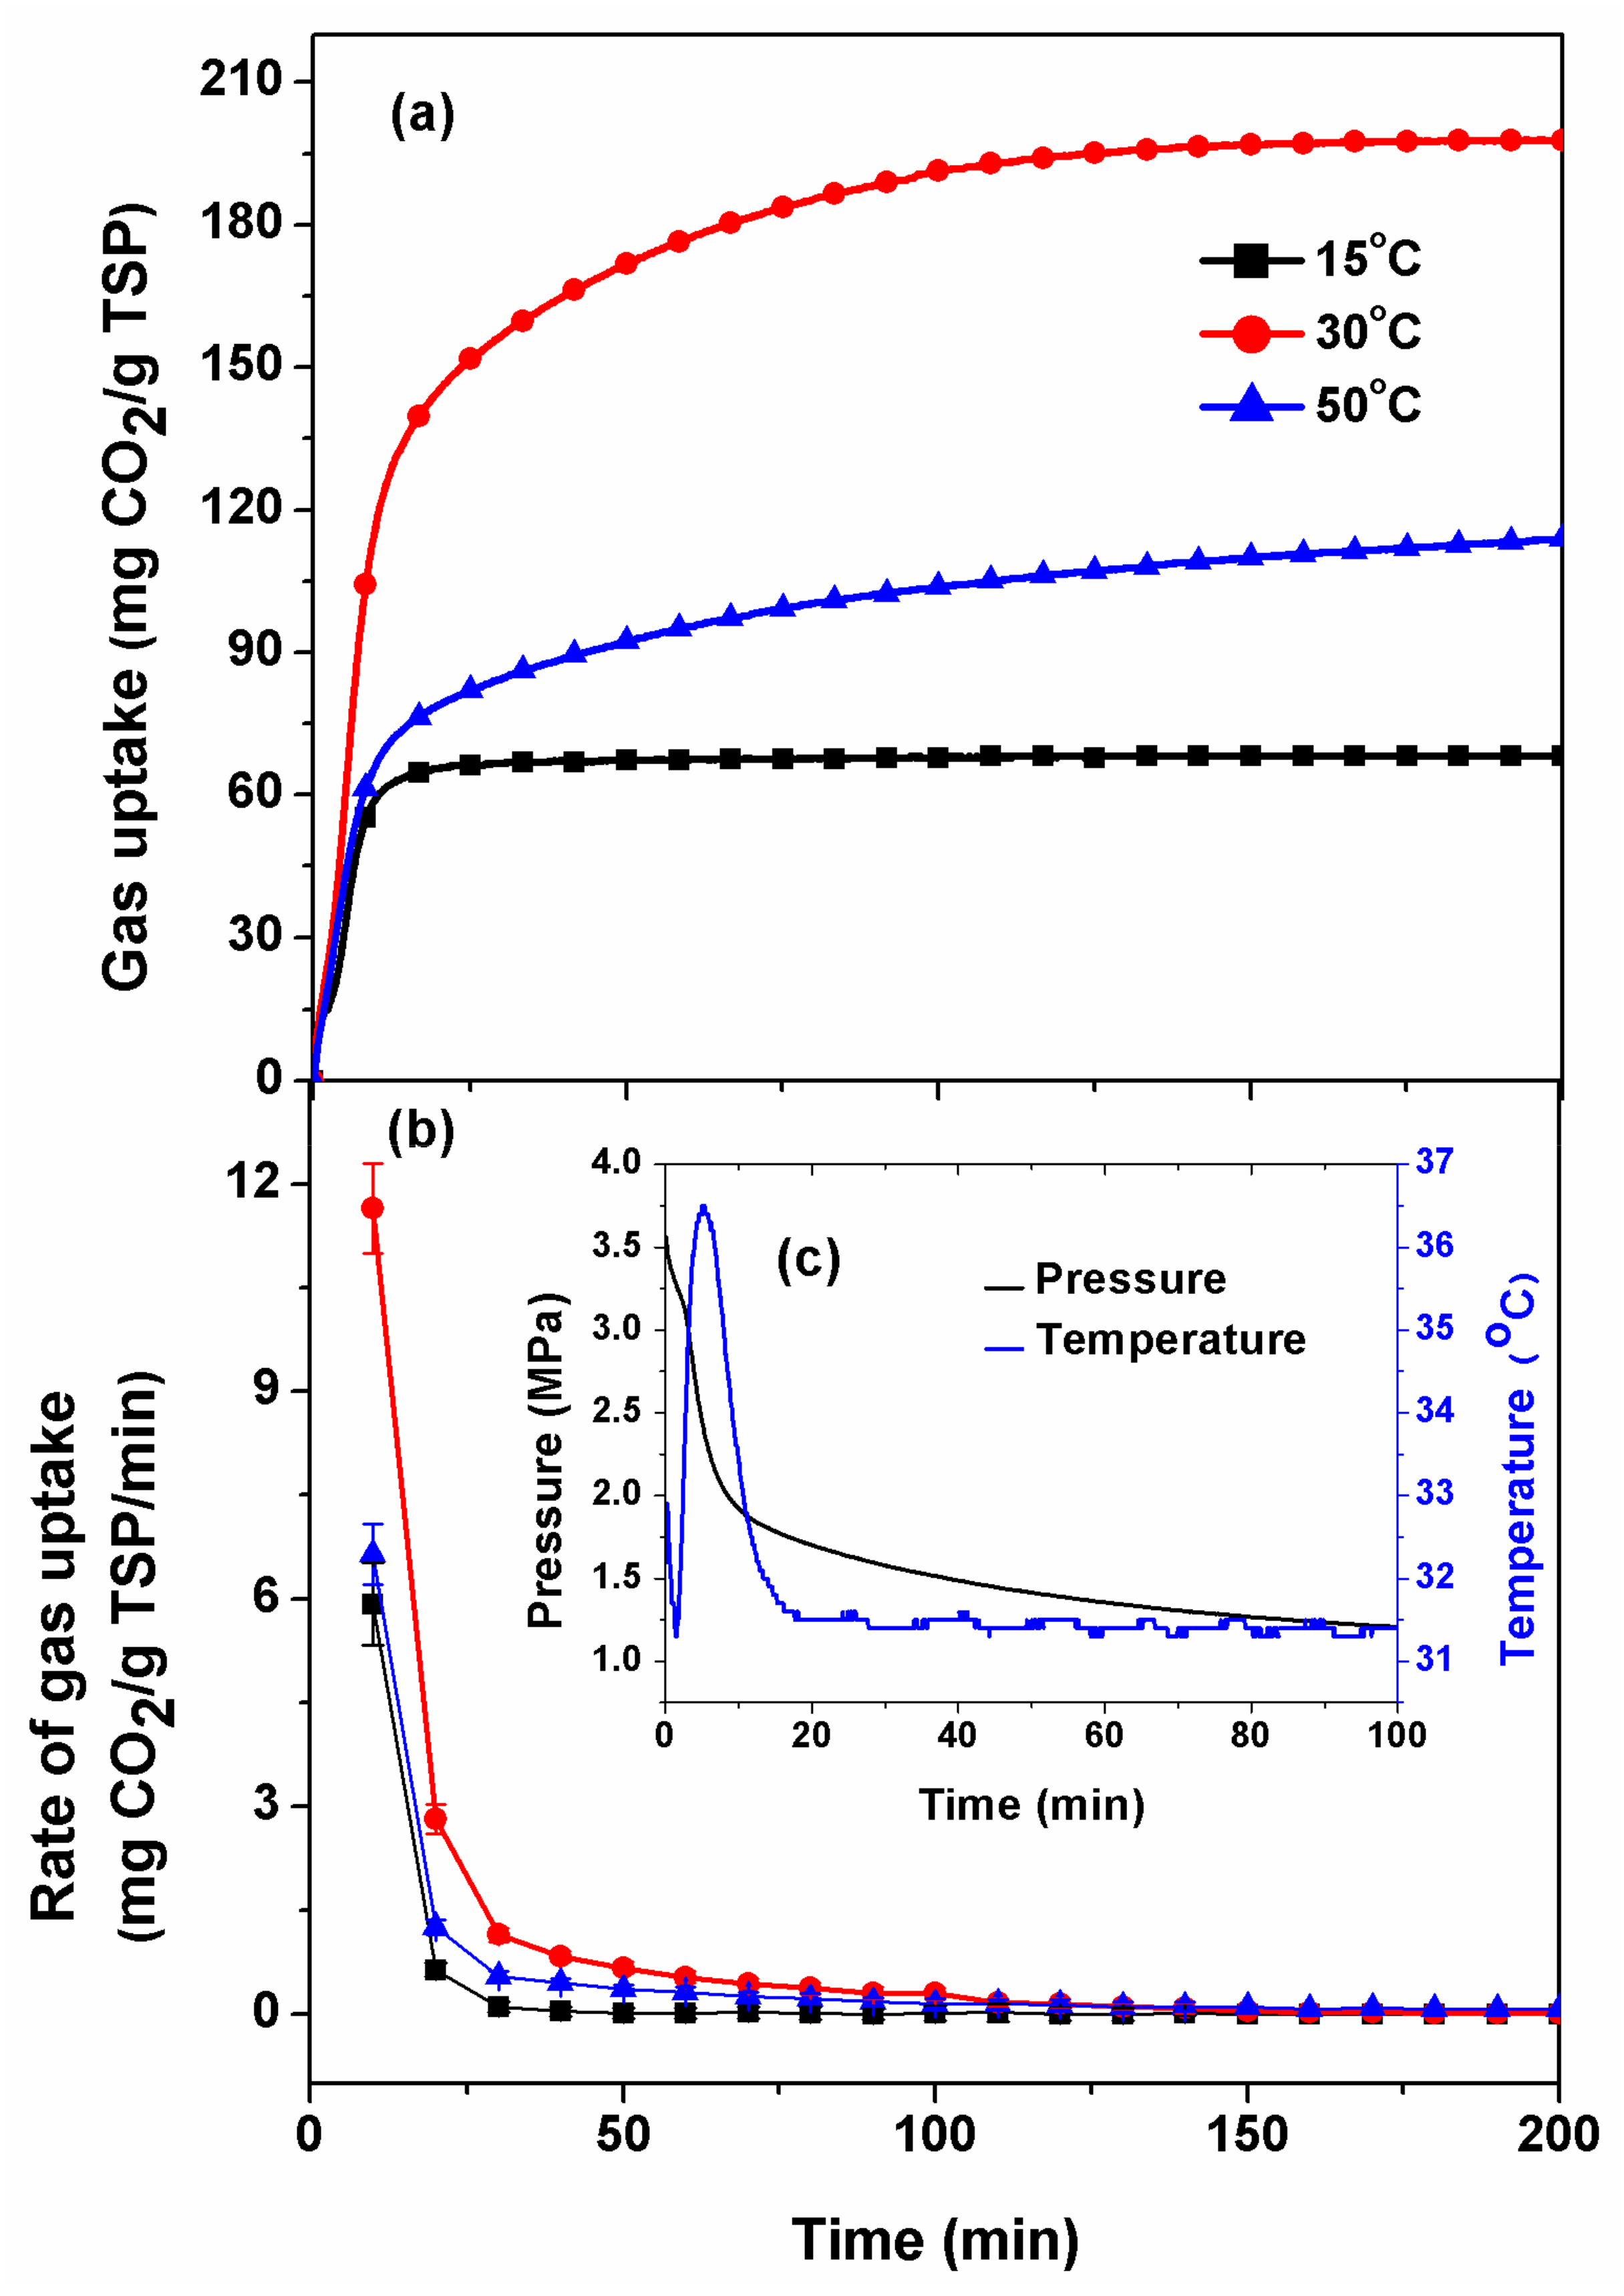
The performance of TSP for maximum CO2 uptake was studied at the temperature ranges from 15 to 50 °C and pressure 3.5 MPa of pure CO2. The gas uptake profile along with the rate of gas consumption calculated using forward difference method is represented in Figure 4. CO2 consumption during a gas uptake measurement was calculated by using Equation (1). Table 1 summarizes the CO2 uptake data, operating temperature and pressure, CO2 composition, and amount of solid adsorbent used in each case. All the experiments were repeated three times (except for some measurements, which were repeated twice) and data are shown with its standard deviation. Among all, 4 g TSP shows the best result of 198 mg/g (standard deviation: 4.72) at 30 °C with 3.5 MPa pressure and 100% CO2 concentration. Using these optimized conditions, the process was studied with a larger sample size of 40 g and 100 g of TSP.
As shown in Figure 4a, the effect of temperature on the gas uptake kinetics of TSP was studied at 15, 30, and 50 °C. It was found that 30 °C is an optimum temperature at which maximum CO2 was consumed. Figure 4b shows the rate of gas uptake (mg CO2/g adsorbent/min) calculated by the forward difference method for the above three experiments. The magnitude of gas uptake was found to be approximately three times higher at 30 °C compared to 15 °C, the initial rate of gas uptake was approximately two times higher at 30 °C compared to 15 and 50 °C. At low temperature (15 °C), there is insufficient energy to drive the reaction forward, which results in low CO2 capture capacity. On the other hand, at a higher temperature (50 °C), the TSP shows poor stability due to the fact that it has a low melting point of 73.5 °C. However, at 30 °C, the activation energy is sufficient enough to achieve maximum CO2 conversion without losing its structure.
The reaction of TSP with CO2 is exothermic in nature, and in the fixed-bed setup, heat dissipation is limited, thus resulting in a localized temperature rise at the reaction site. Figure 4c represents the temperature profile along with the pressure drop data at 30 °C. From Figure 4c, it can be seen that a sudden rise in temperature occurs during the reaction of TSP with CO2. It proves the exothermic nature of the reaction. As the reactor was kept in a temperature-controlled water bath, the temperature is brought back to the experimental temperature (30 °C). We believe lower CO2 capture at 50 °C is the result of this exothermic nature of the reaction [29,30,31]. TSP starts melting at 73.5 °C and an exothermic reaction leads to the formation of liquid TSP. In a fixed-bed configuration, liquid TSP would create a mass transfer resistance for CO2 to come in contact with fresh TSP molecule, thus reducing the reaction kinetics. In a similar chemical sorption process, Kamarudin [29] showed maximum CO2 capture at an optimum temperature of 25 °C for CO2 capture in monoethanolamine (MEA)-loaded MCM-41.
3.3.2. Effect of Gas Pressure on the CO2 Uptake Kinetics
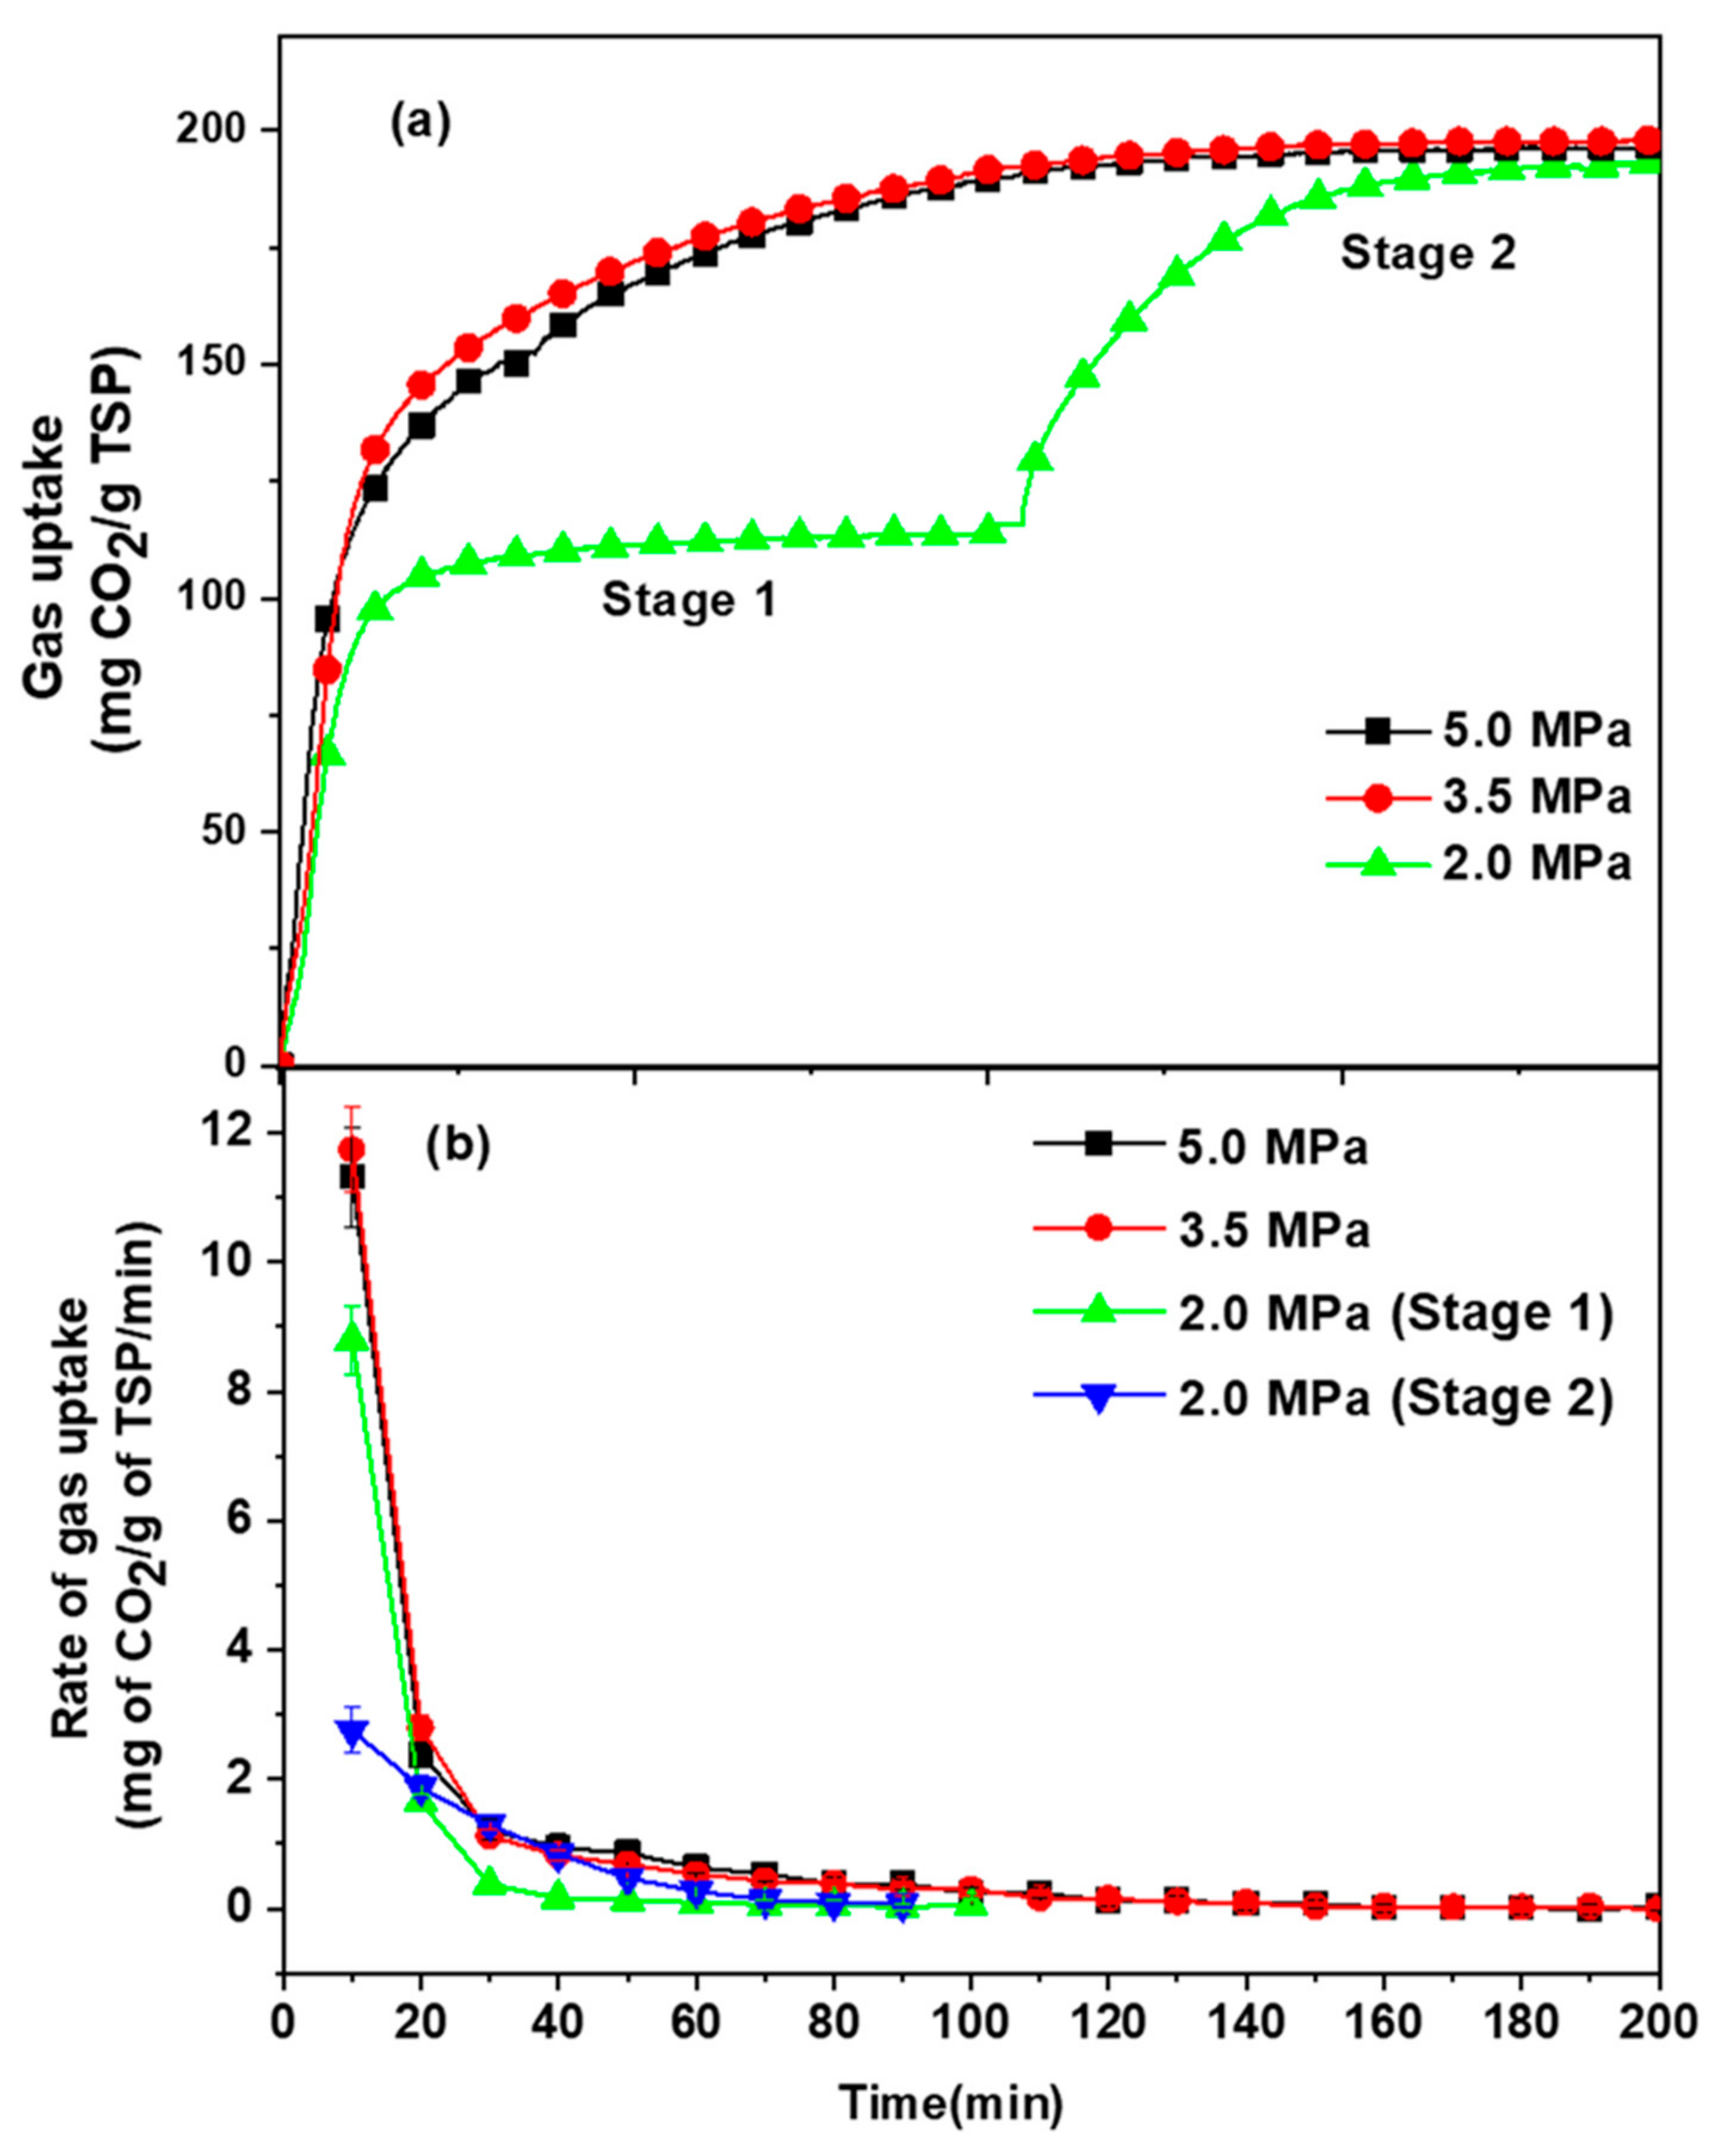
The total CO2 uptake (Figure 5a) and rate of CO2 uptake (Figure 5b) at 2, 3.5, and 5 MPa CO2 pressure indicate that the initial rate of gas uptake was higher at higher pressure. The experiment conducted at 2 MPa pressure was re-pressurized to initial pressure once most of the CO2 in the gas phase reacted with TSP. In this experiment, about 62% of TSP saturation was achieved during the first stage and the remaining TSP gets saturated in the second stage after re-pressurization. As shown in Figure 5b, the rate of CO2 uptake is independent of the experimental pressure making it suitable for continuous operation.
3.4. Gas Phase Analysis
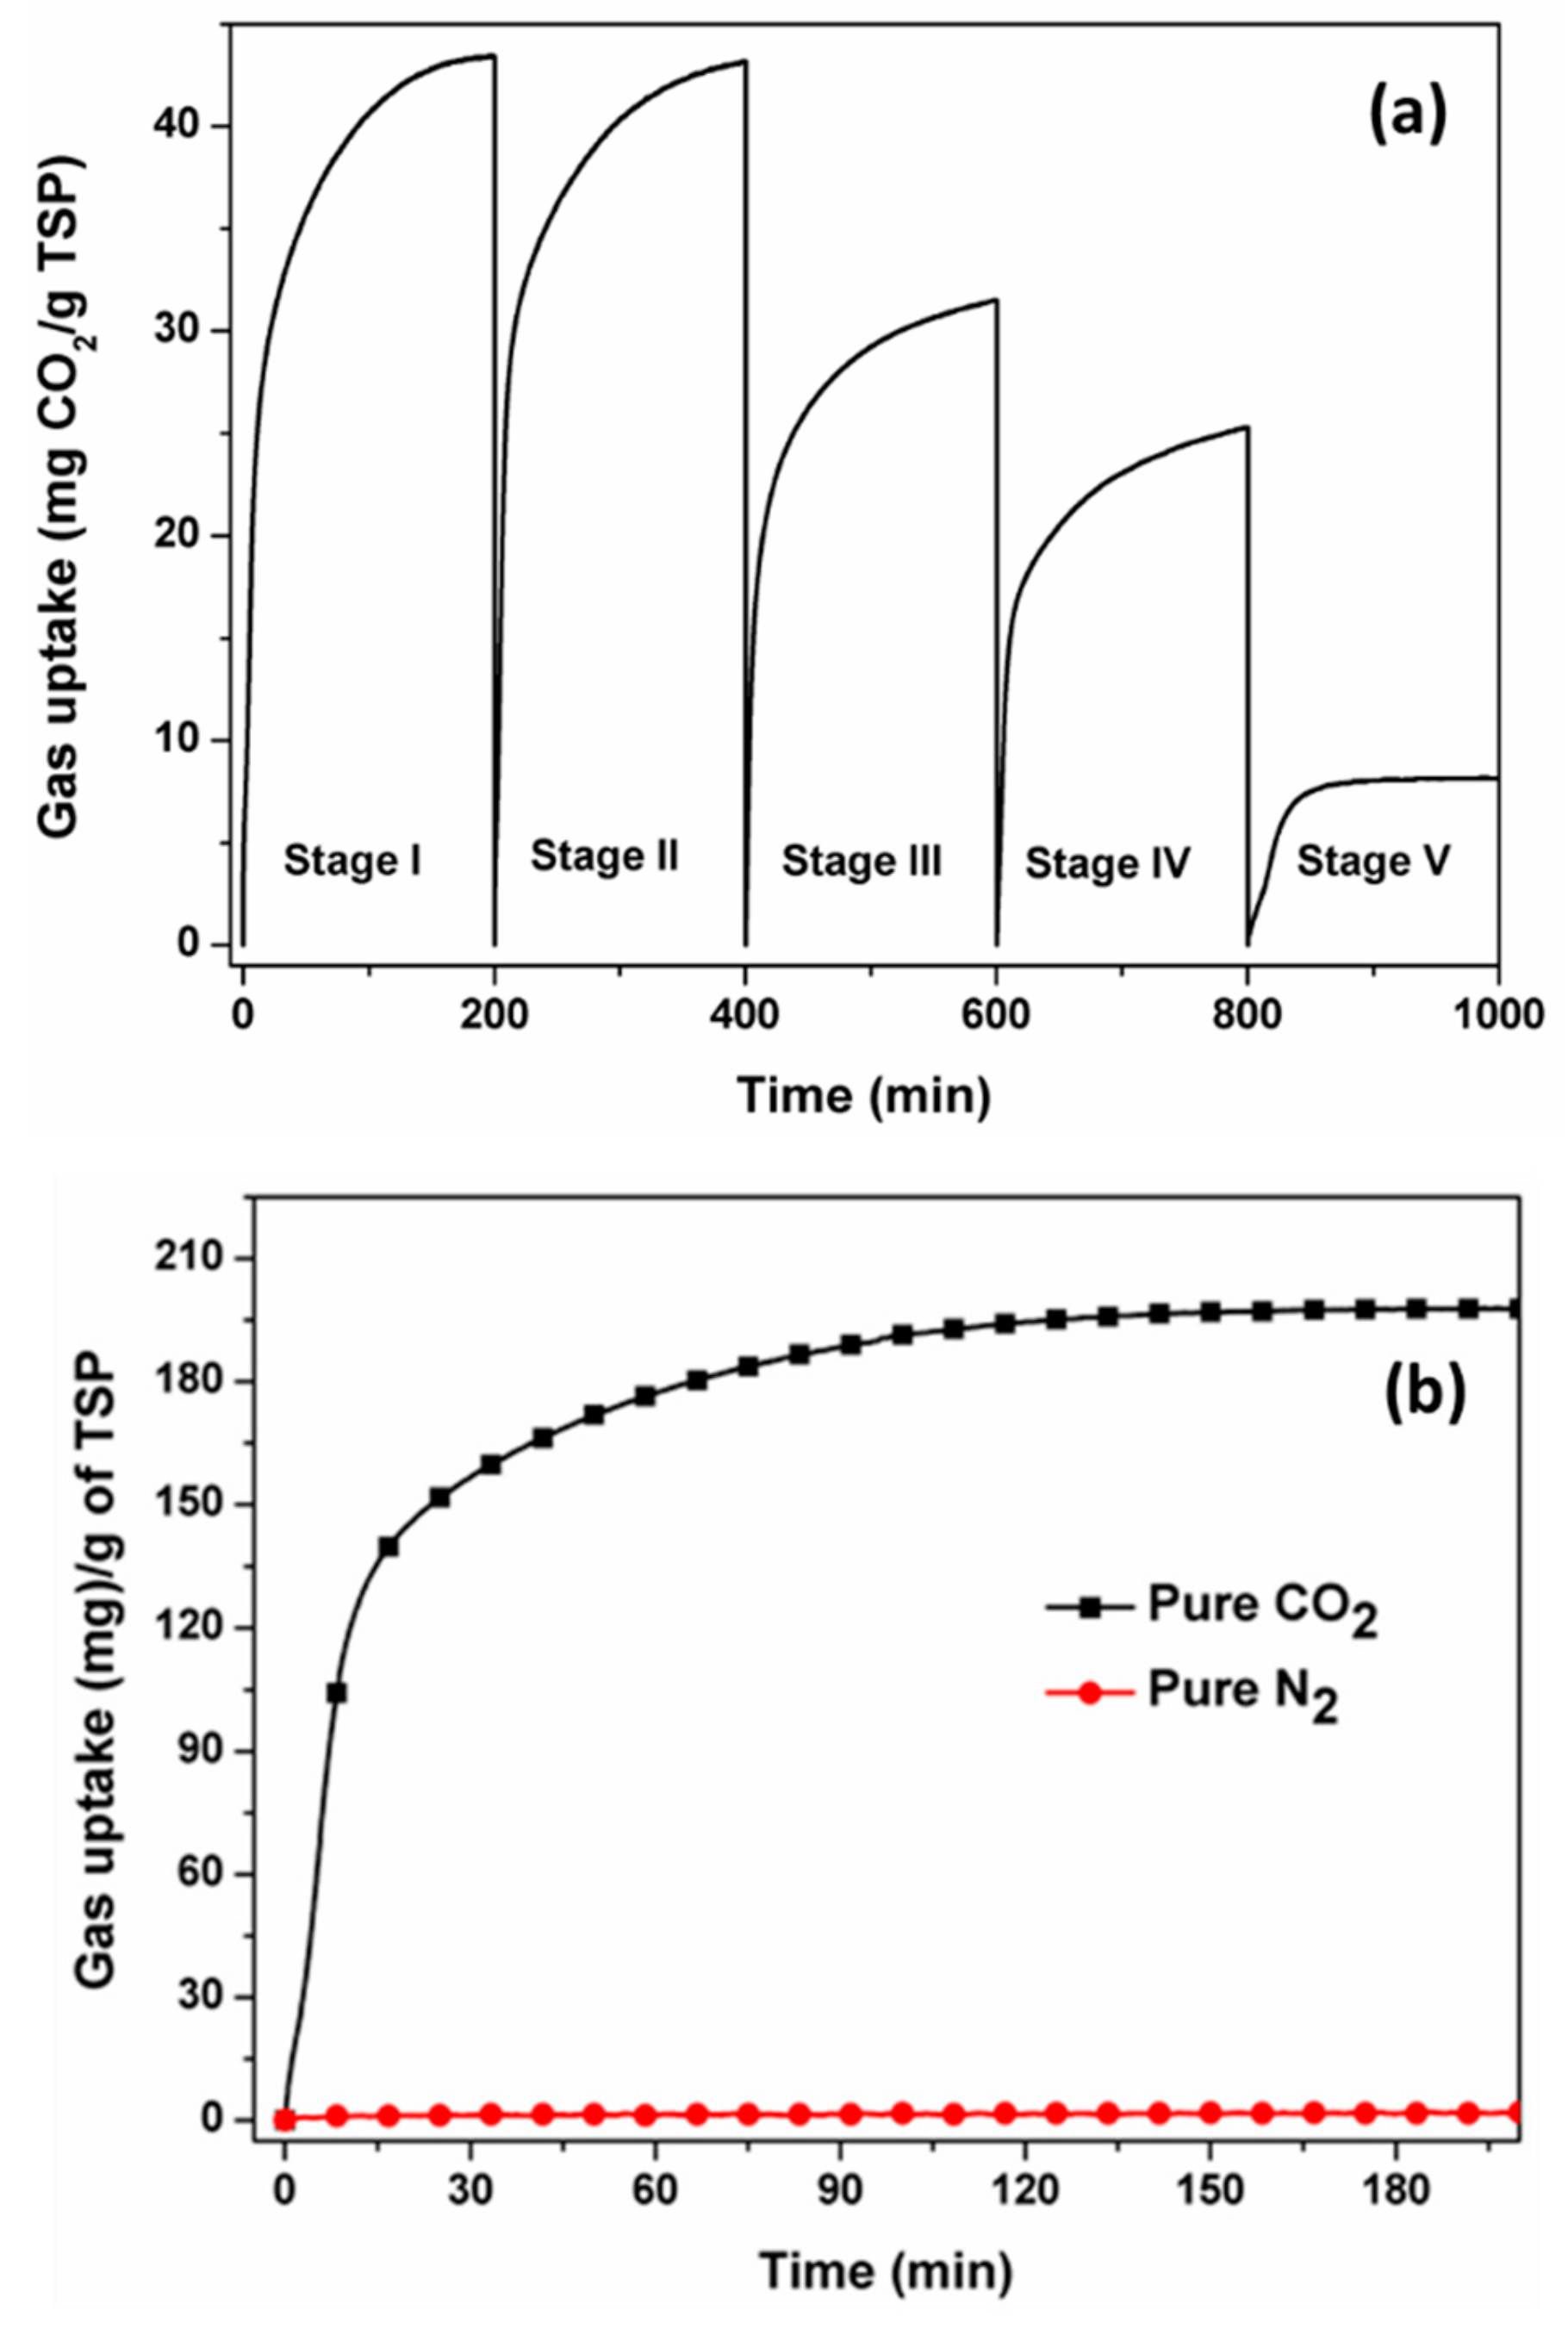
CO2 capture efficiency (η) of the material in the flue gas mixture was calculated by using Equation (4). Mole fraction of gaseous components at the start and end of the gas uptake measurement were the major parameters for this calculation. To probe the mole fraction of gaseous components at the end of the experiment, a small sample of the gaseous phase is analyzed using gas chromatography (Table 2). For CO2 capture efficiency measurement of TSP, experiments were conducted at the optimum temperature of 30 °C using a mixture of CO2 and N2 gas with initial mol% of 16.1 and 83.9, respectively. The system was pressurized (at 3.5 MPa) repeatedly with CO2/N2 mixture until no gas uptake was observed (4 g TSP was used in the 25 cm−3 reactor) (Figure 6a). Since flue gas used in this study contains only 15% of CO2 (rest N2), TSP was not saturated in the first stage of pressurization. Every stage of pressurization contained only 0.56 MPa of CO2 (16.1% of 3.5 MPa). Therefore the system has to pressurize repeatedly so as to ensure the complete saturation of TSP taken in the reactor. Five pressurization stages were required to attain the level of saturation (Figure 6a). A flat gas uptake curve signifies that all the TSP in the reactor has been saturated and thus no further drop in reactor pressure is observed. Figure 6a represents the gas uptake for all the five stages. As seen in Figure 6a, in the first two stages, CO2 sorption comes out to be the same and equal to ~43 mg/g. However, it was found that in all the subsequent stages (III, IV, and V), the gas uptake starts to decrease. In the fifth stage, the CO2 capture capacity of the material was found to have significantly decreased, confirming complete saturation of TSP in the reactor. At each stage, CO2 capture efficiency was calculated and reported in Table 2. As shown in the table, separation efficiency drops as TSP is getting saturated with CO2 gas and in this work, only five recycles were done. During the first three stages, the CO2 molecule found a number of active sites for reaction and hence ~92% of CO2 capture efficiency over a gas mixture of CO2/N2 was achieved. In the last two stages, active sites for the reaction were reduced rapidly as TSP was saturated and η value dropped to the value of ~52% and 3% at the end of fourth and fifth stages, respectively.
The separation efficiency of TSP for CO2 in the flue gas was found to be over 90%. The selectivity of CO2 over N2 (Figure 6b) shows that the N2 (being an inert gas) did not take part in the reaction with TSP and the gas uptake we got was purely due to reaction of CO2.
3.5. Effect of CO2 Concentration on Gas Uptake
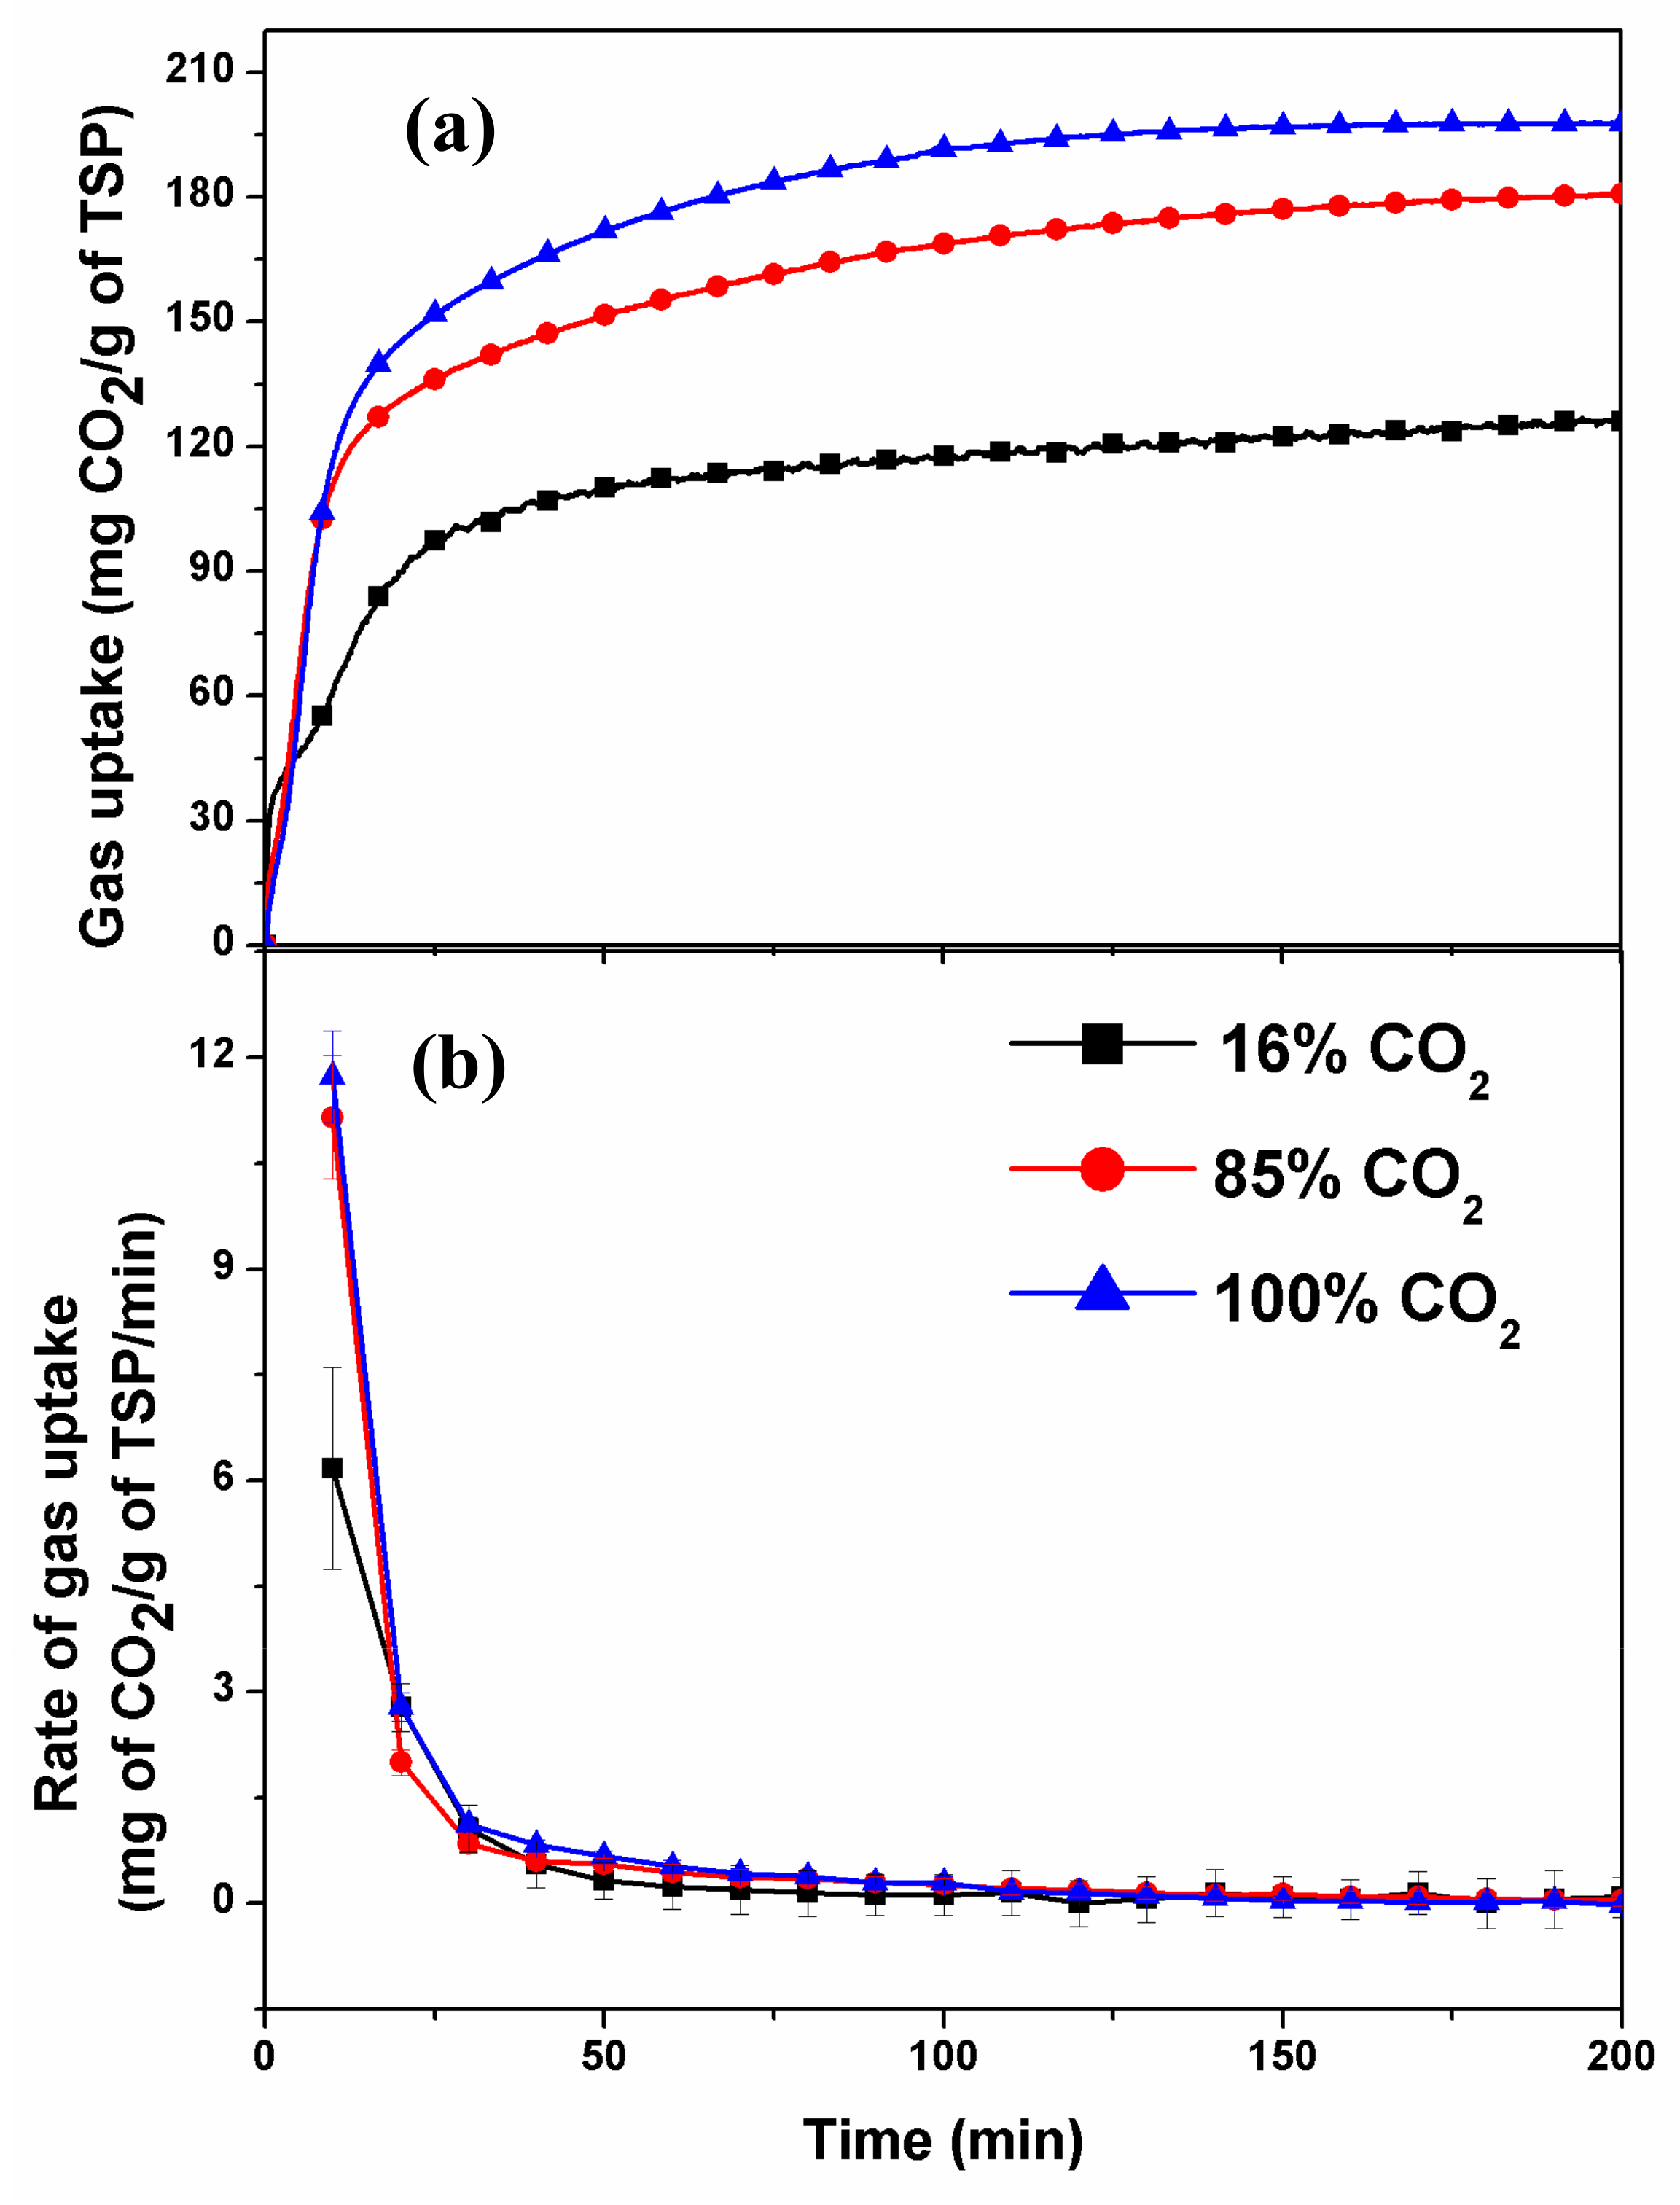
To evaluate the influence of CO2 concentration on the CO2 capture efficiency of TSP, gas mixtures with different composition of CO2 (16%, 85%, and 100% CO2 balance with N2) were used in the present work. Figure 7 represents the gas consumption along with the rate of gas uptake for the experiments carried out at three different CO2 compositions. As we have seen from gas phase analysis and reaction mechanism; since nitrogen did not react with TSP, the gas consumption measured for the CO2/N2 mixture can be considered as the CO2 capture capacity only. As seen in Figure 7a, CO2 concentration significantly influences the gas uptake capacity of the material. It was found that with an increase in CO2 concentration, gas consumption increases. The gas consumption capacity for 100% of CO2 was found to be almost 1.5 times greater compared to gas consumption for 16% of CO2. All three experiments with their gas capture capacity are listed in Table 1. Figure 7b represents the rate of gas uptake for the experiments conducted with different gas composition. As seen in the figure, the rate of gas uptake also follows the same trend as discussed with Figure 7a. The initial rate of gas uptake was found almost similar for 100% and 85% CO2 while the rate for 16% CO2 mixture reduced to half compared to higher concentrations of CO2. Xu et al. have also reported similar results for MCM-41-PEI-75 sorbent at different CO2 concentrations [32], where the capture capacity of the material decreases with the lowering in the concentration of CO2. CO2 capture in aqueous amines has been evaluated at different CO2 concentrations; Masih Hosseini Jenab et al. [33] have found that CO2 absorption increases with the concentration of CO2 in the gas mixture were; this work was performed at 30 to 5000 kPa. Singh et al. [34] and Tontlwachwuthlkul et al. [35] have also observed similar results for the absorption of CO2 in aqueous amines.
3.6. Comparison of CO2 Uptake with the Solid Adsorbent Available in the Literature
Table 3 compares the CO2 uptake results obtain in this work with the available literature [36,37,38,39,40,41,42,43,44,45,46,47] along with experimental conditions. As seen in Table 3, MBS-2 (molecular basket sorbents loaded with PEI) and PEI–CNT present a maximum gas uptake of 140 and 170 mg of CO2/g of sorbent at an optimum temperature of 75 and 50 °C, respectively [39,44].
In the current work, we also have achieved a similar gas uptake at ambient temperature (30 °C) for 16.1 and 85 mol% CO2. Moreover, Sanza et al. [38] have also reported a loading of 80 mg of CO2/g of adsorbent at 45 °C in SBA-15, which is less compared to the result reported in our work. The maximum absorption capacity of 198 and 140 mg CO2/g of TSP obtained in the current work is quite high compared to the results reported in the literature for pure CO2 and fuel gas mixture, respectively. MOFs have relatively high CO2 uptake capacity (238 mg/g) [46]; nevertheless, rigorous synthesis pathway, cost, and safety aspects have to be considered to establish an effective CO2 capture process.
3.7. Gas Uptake Kinetics in The Regenerated TSP
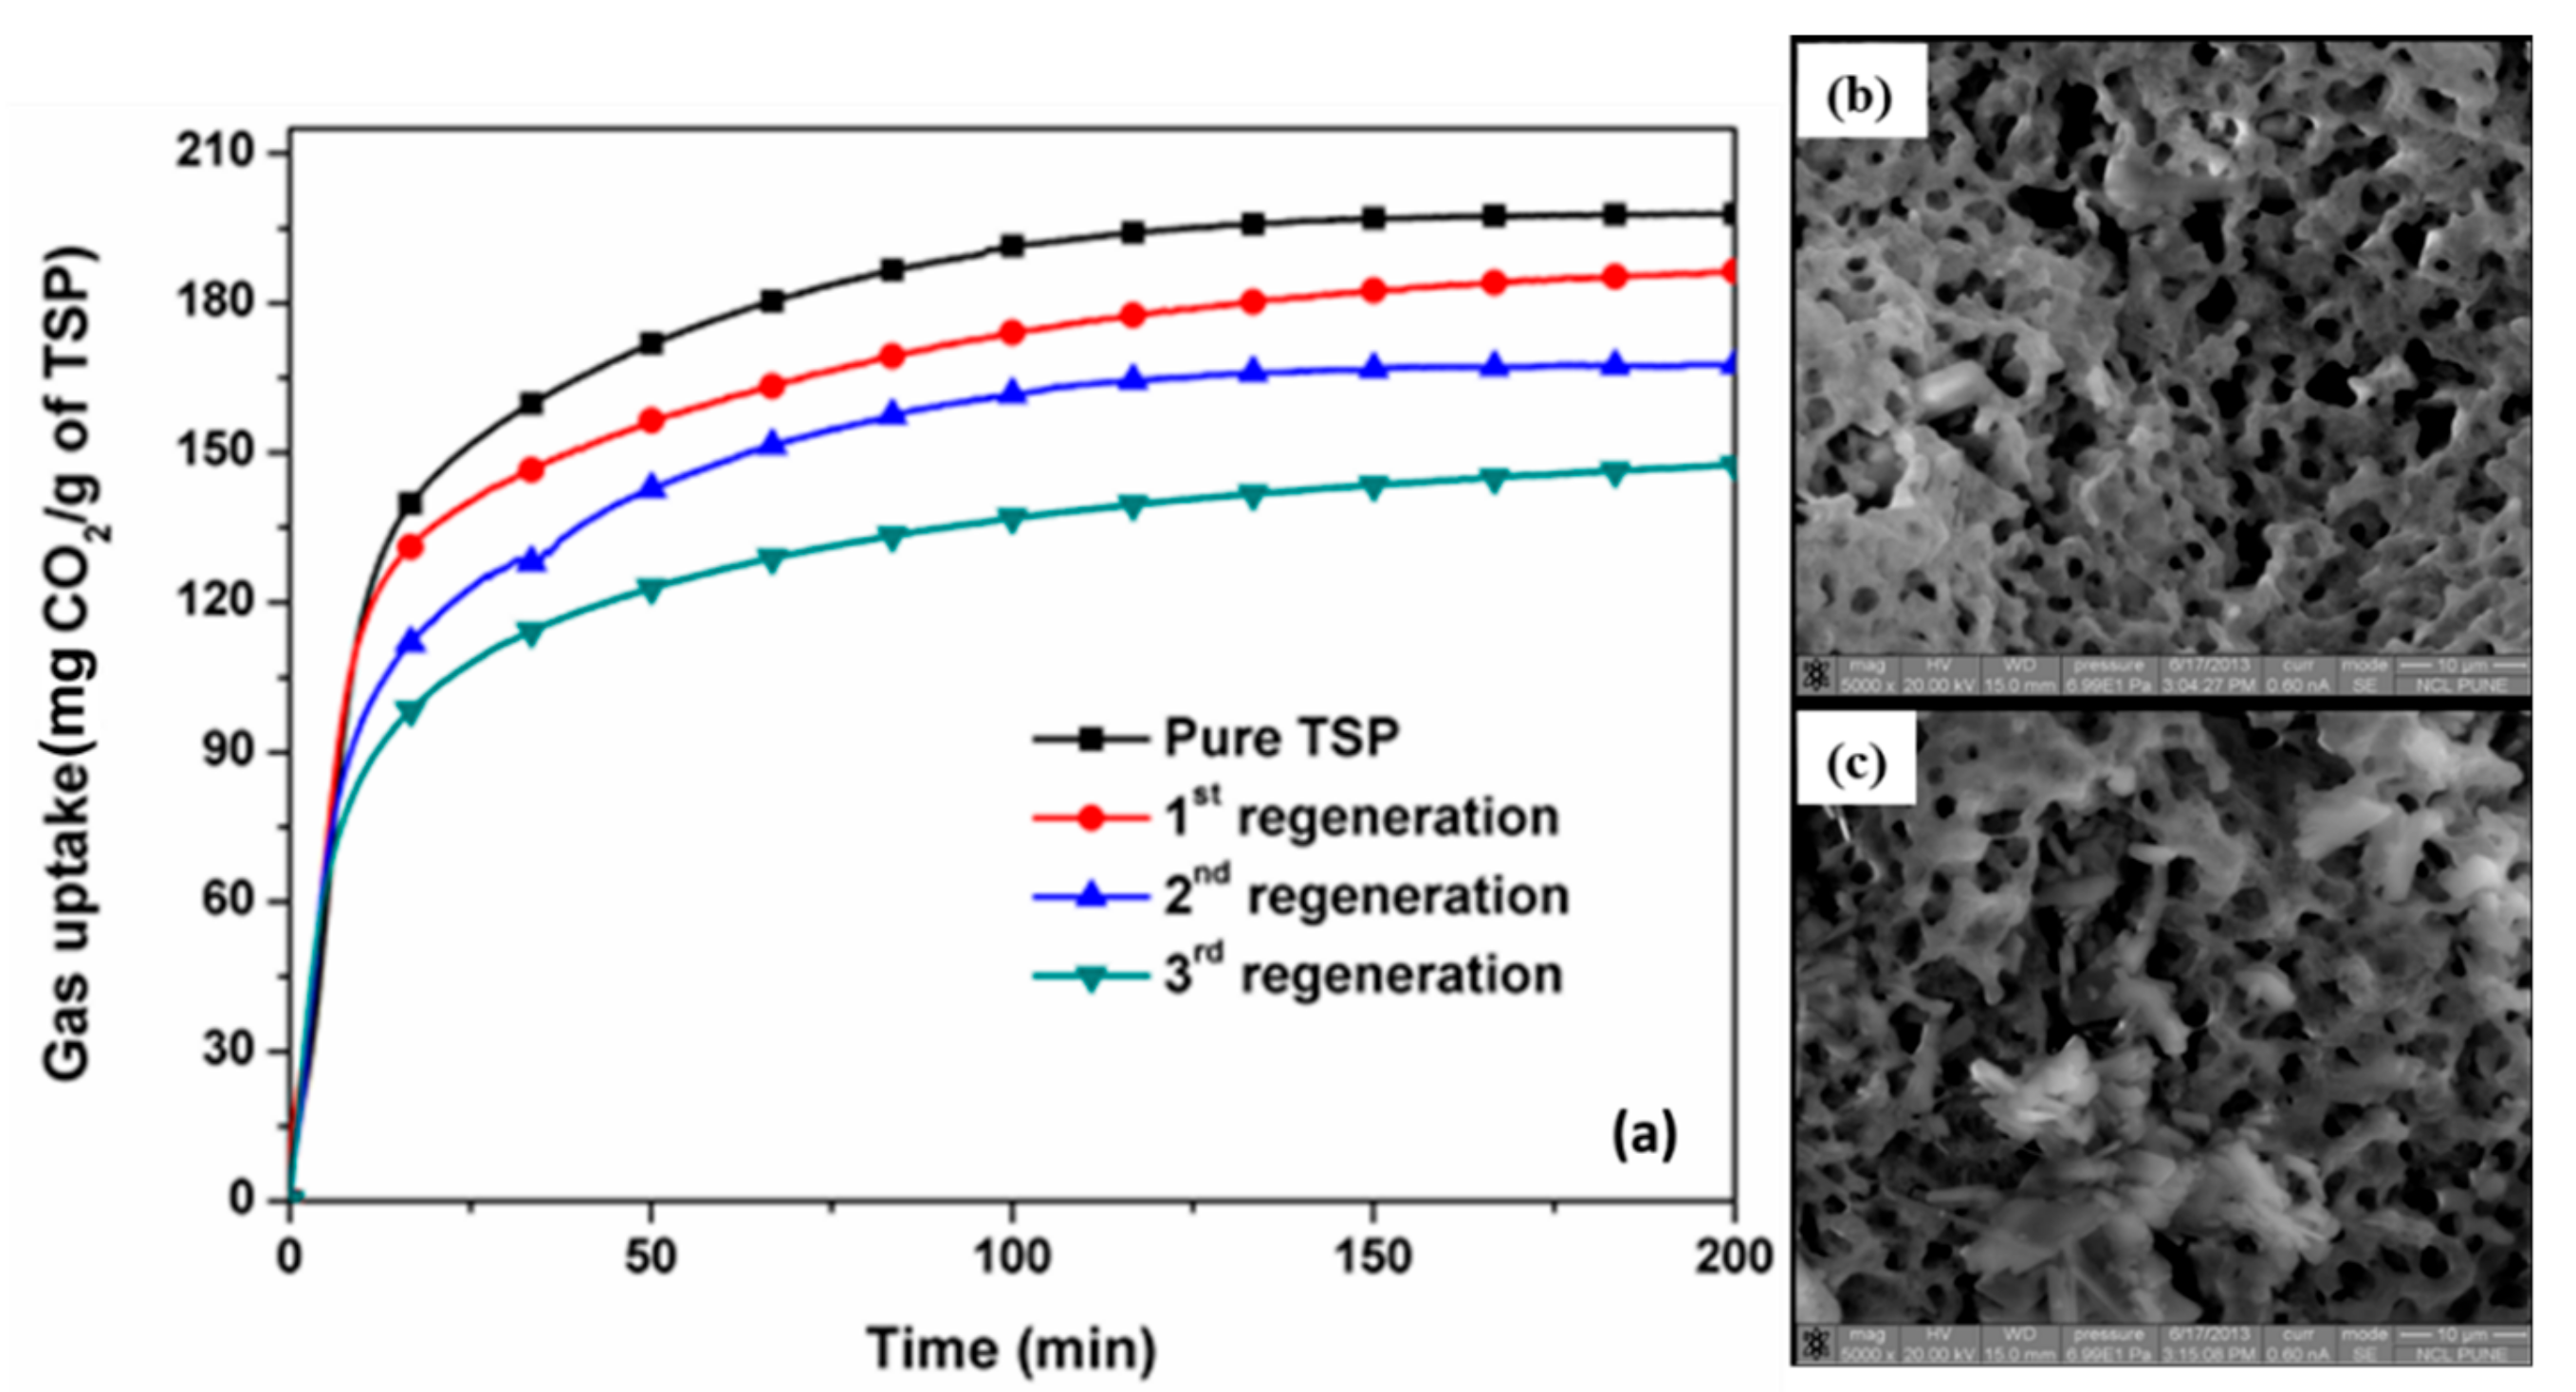
In this work, regeneration of TSP was carried out by sodium hydroxide (NaOH) pellets, and the reaction took place at room temperature and atmospheric pressure condition for 15 min where regenerated TSP and sodium carbonate as a by-product was obtained (Equations (6) and (7)). The presence of sodium carbonate was also confirmed by FTIR studies (Section 3.1.). Figure 8a represents the CO2 uptake for pure and regenerated TSP (three regeneration cycles). The CO2 capture capacity in pure TSP was found to be 198 mg/g while after first regeneration of TSP, it was ~180 mg/g (Figure 8a). This decreasing trend of CO2 capture capacity continued after the second and third regenerations of the material. Kinetics of CO2 capture after regeneration cycles remained more or less same. This suggests that the regeneration of TSP does not affect the kinetics of the reaction. Reduction in CO2 uptake for each regeneration cycle is mainly due to the inefficient reaction of NaOH with CO2-loaded TSP. It was observed that upon reaction with NaOH, the CO2-loaded TSP slurry solidifies due to the formation of hydrated TSP and sodium carbonate. However, advanced reactor design and complete downstream processing of the degenerated TSP is expected to improve the regeneration efficiency.
Furthermore, topographical (morphological) information of CO2-loaded pure TSP and CO2-loaded regenerated TSP was obtained by SEM images and presented in Figure 8b,c, respectively. No significant change in the morphology of TSP was observed after CO2 uptake as well as after regeneration (Figure 8b,c).
3.8. Scalability and Conceptual Prototype
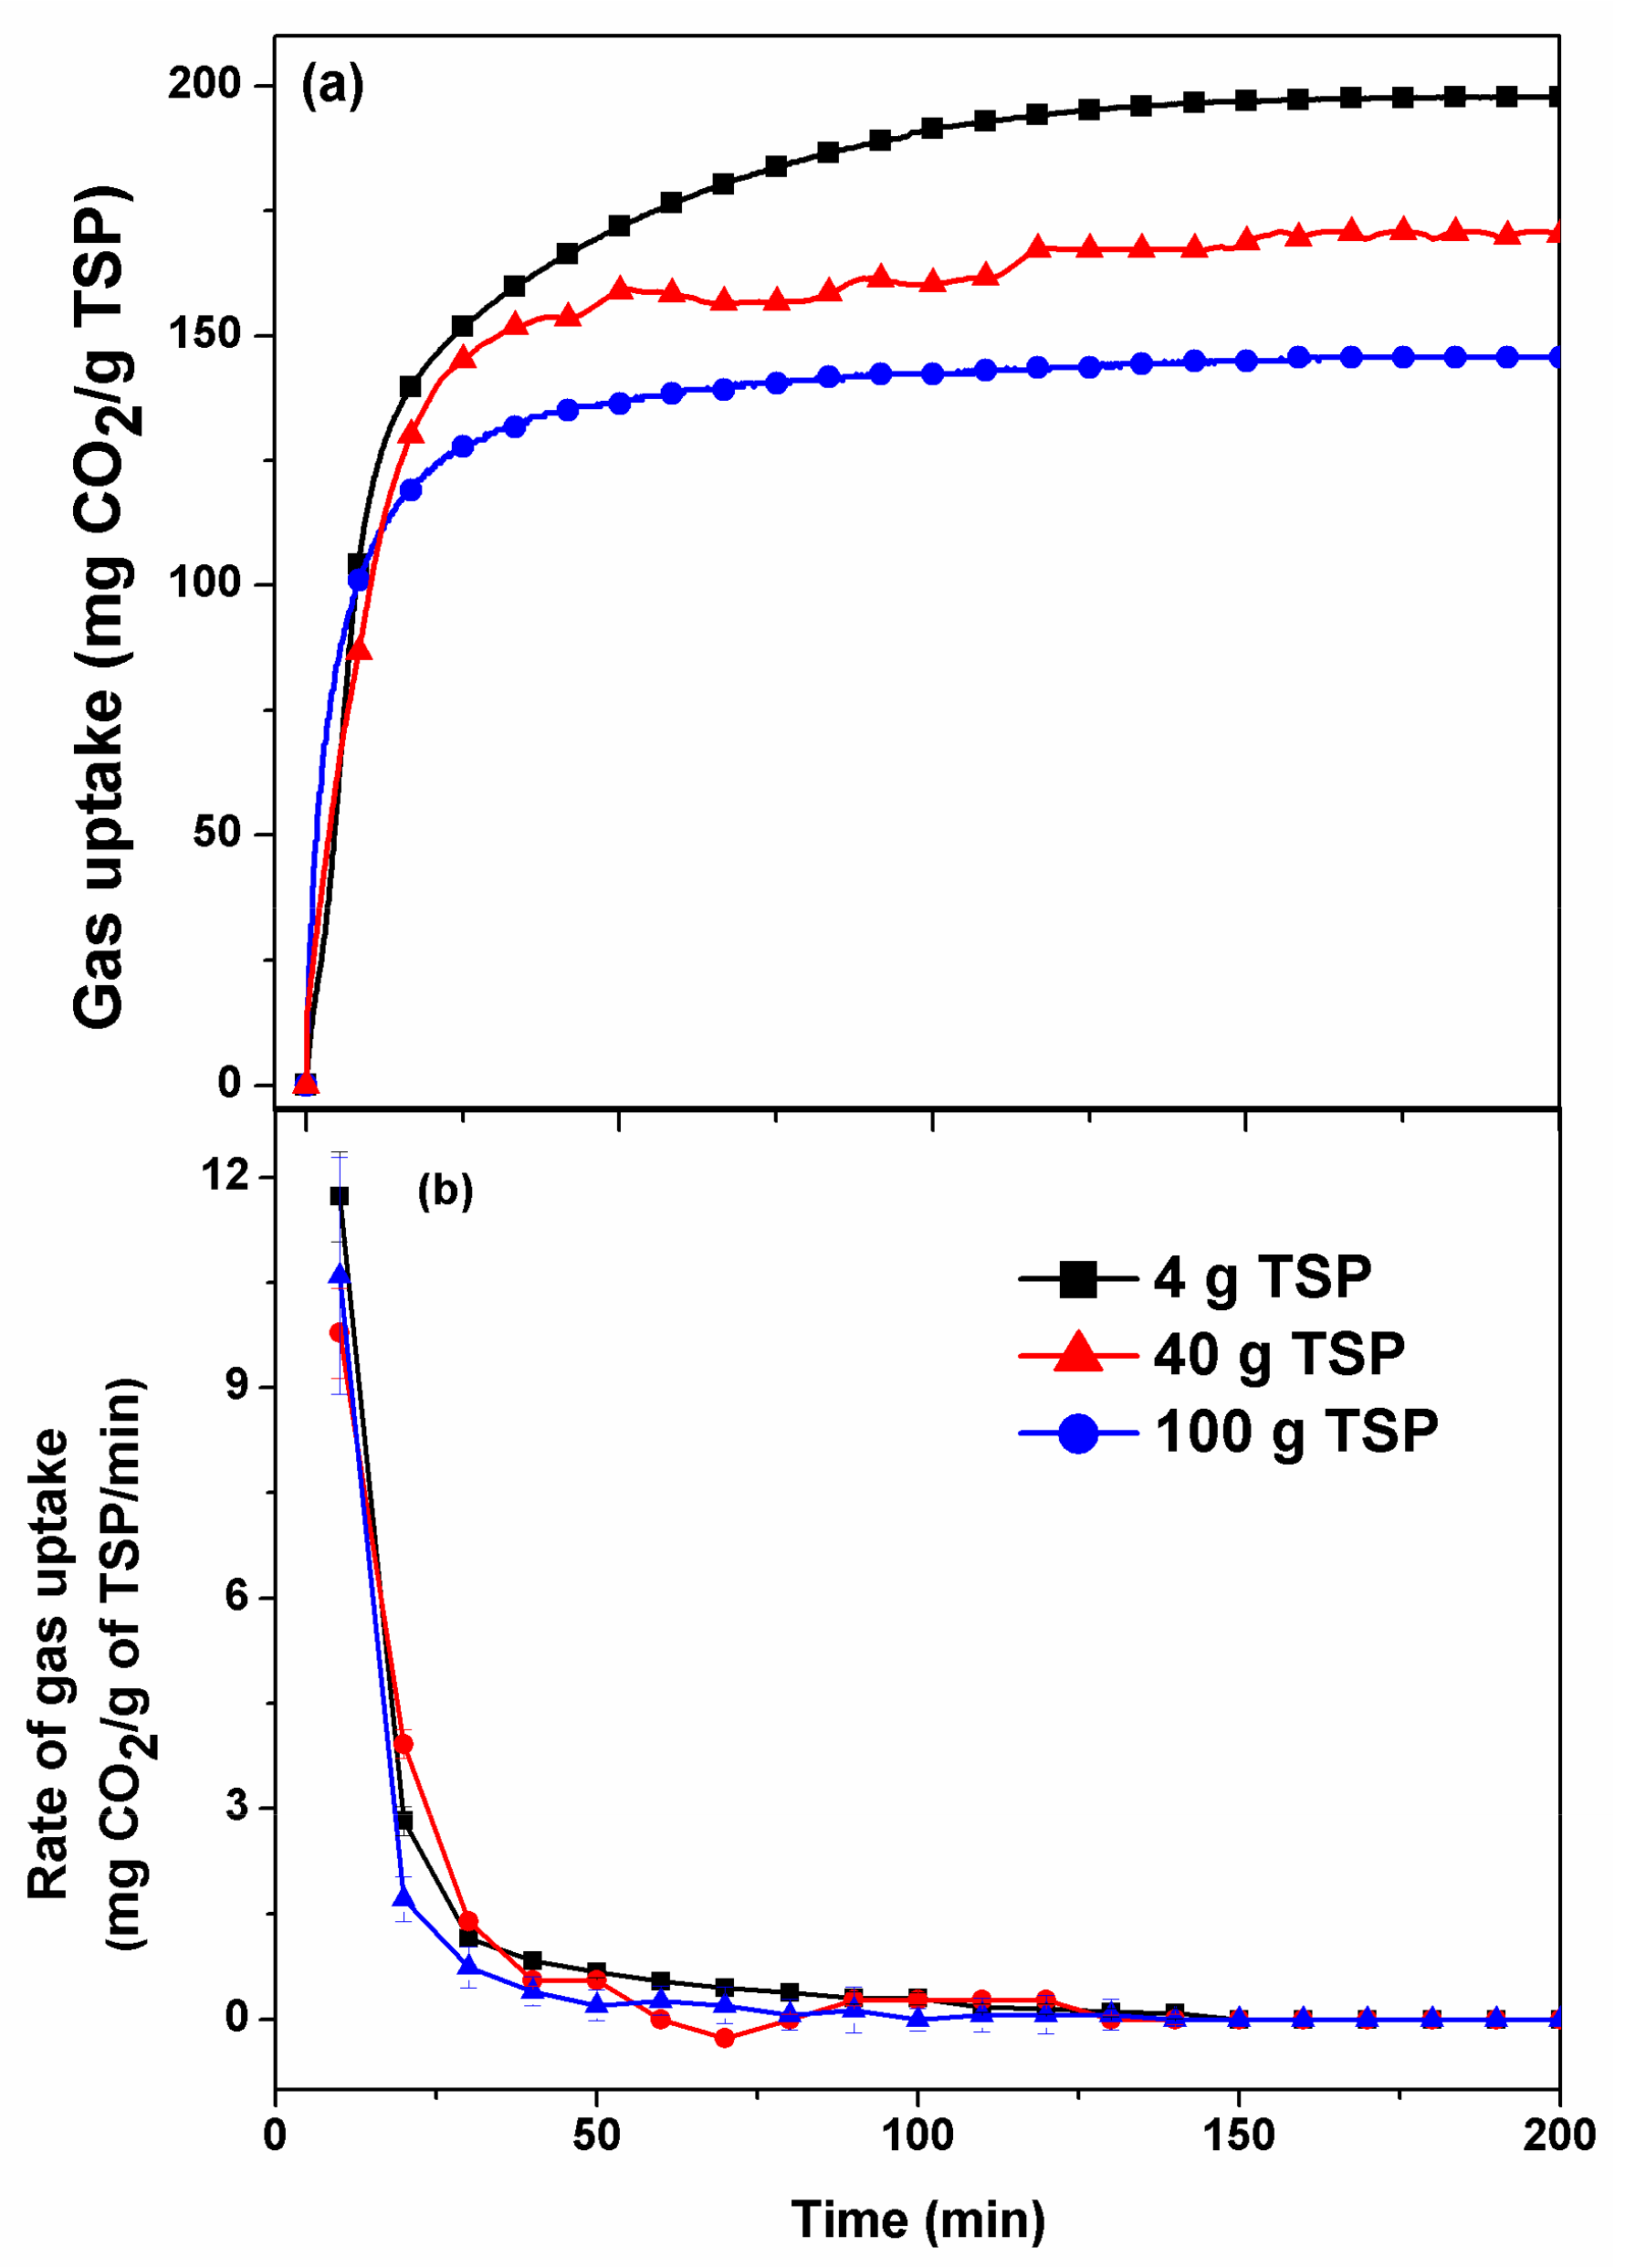
In order to evaluate the scalability of the sorption process, the CO2 capture capacity was also measured using 40 and 100 g of TSP. These experiments were carried out in a 250 cm3 reactor at optimum experimental conditions (3.5 MPa pressure and 30 °C temperature) as obtained from a small-scale experiment. Figure 9a represents a comparison of the gas uptake capacity at three different scales of 4, 40, and 100 g TSP. It can be seen that the initial rate of gas capture is similar for all three experiments; however, the final CO2 loading decreased with an increasing amount of TSP. An efficient design of a large-scale reactor should enhance the mass transfer and better CO2 loading.
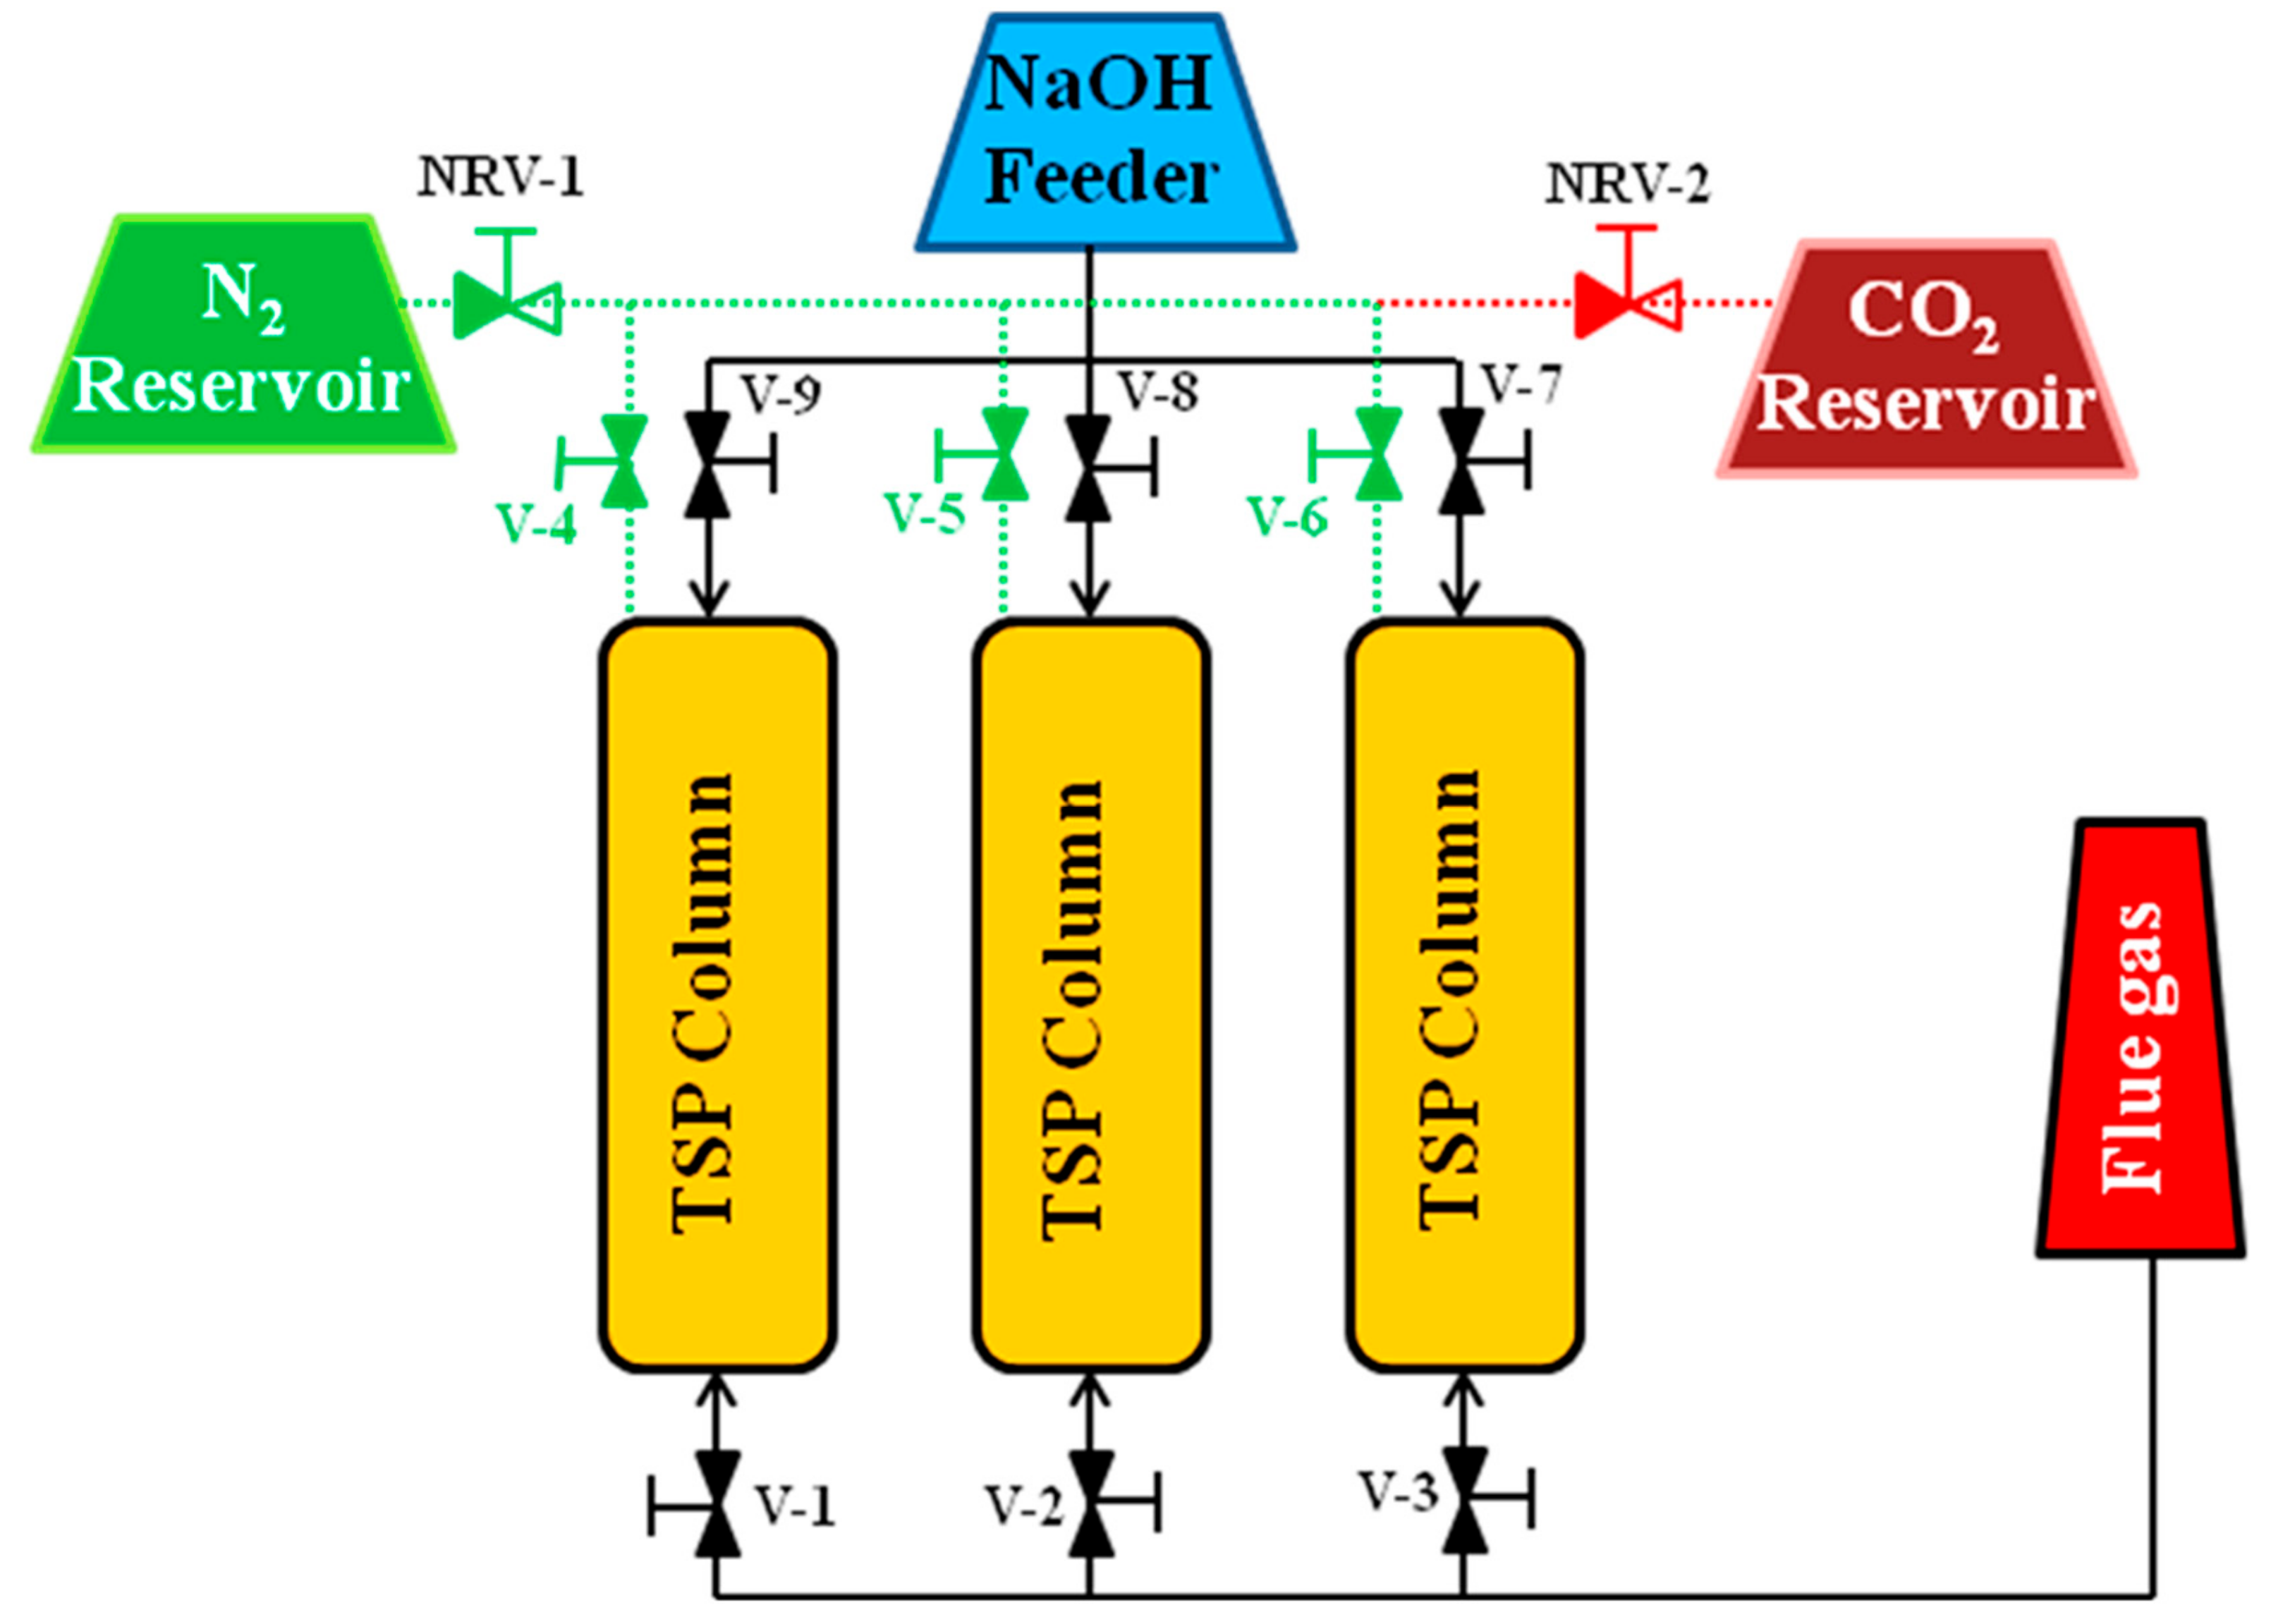
A conceptual flow diagram for post-combustion CO2 capture at an industrial level using TSP as a solid sorbent has been shown in Figure 10. The system is composed of three fix bed columns charged with TSP as a packing material. Flue gas coming from power plants are passed through the first column (using valve V-1) such that CO2 preferentially gets captured by the packing material (online confirmation by gas chromatography). Nitrogen from the flue gas coming out from the first column is collected in a separate reservoir by opening valve 4 (V-4). After certain residence time in the first TSP column, the flue gas is allowed to go through the second column of TSP (using valve V-2). Simultaneously, NaOH solution is fed from the feeder to regenerate CO2-loaded TSP in column 1 (using valve V-9). CO2 emitted during the regeneration step is stored in a separate reservoir. Likewise, all three columns are used in a cyclic manner to capture CO2 from the flue gas stream.
4. Conclusions
The kinetics of CO2 capture using an inorganic sorbent (TSP) was studied in a fixed-bed configuration. Employing a flue gas mixture, it was observed that CO2 capture capacity of TSP reached a local maximum at room temperature (~30 °C) across the range of temperatures studied. However, total pressure of a flue gas showed a negligible effect for gas uptake. TSP was found to be highly selective for CO2 in a mixture of CO2 and N2. The selective capture of CO2 over N2 was found to be ~93%. Unlike other chemical sorbents, TSP is an inexpensive solid material. Some of the preliminary work reported in this study demonstrates that TSP can be regenerated, making it an ideal solid sorbent for CO2 capture from a flue gas mixture.
Author Contributions
R.K. and A.K. designed the experimental work plan. T.S. performed all the experiments and helped in writing the manuscript. R.K. is an expert in carbon capture and gas separation research and reviewed the discussion. R.K. and Z.M.A. reviewed and revised the manuscript. All authors read and approved the manuscript before submission.
Funding
This research was funded by Science and Engineering Research Board, Department of Science and Technology, Government of India, grant number “EMR/2017/000810” and the Council of Scientific and Industrial Research (CSIR), India, grant number “CSC 0123”.
Acknowledgments
The authors gratefully acknowledge CSIR-National Chemical Laboratory (NCL), Pune, India (a part of this work was performed here). A. Kumar and T. Sakpal would like to acknowledge the financial support for this work from the Council of Scientific and Industrial Research (CSIR), India (CSC 0123). R. Kumar appreciates the financial support from the Science and Engineering Research Board, Department of Science and Technology, Government of India (EMR/2017/000810). Z.M. Aman acknowledges Chevron and Woodside for their support of the Professorial Chair in Long Subsea Tiebacks.
Conflicts of Interest
The authors declare no conflict of interest.
References
- Jorgenson, A.; Longhofer, W.; Grant, D. Disproportionality in Power Plants’ Carbon Emissions: A Cross-National Study. Sci. Rep. 2016, 6, 28661. [Google Scholar] [CrossRef] [PubMed]
- Mikkelsen, M.; Jørgensen, M.; Krebs, F.C. The teraton challenge. A review of fixation and transformation of carbon dioxide. Energy Environ. Sci. 2010, 3, 43–81. [Google Scholar] [CrossRef]
- Albo, J.; Luis, P.; Irabien, A. Carbon Dioxide Capture from Flue Gases Using a Cross-Flow Membrane Contactor and the Ionic Liquid 1-Ethyl-3-methylimidazolium Ethylsulfate. Ind. Eng. Chem. Res. 2010, 49, 11045–11051. [Google Scholar] [CrossRef]
- Drage, T.C.; Blackman, J.M.; Pevida, C.; Snape, C.E. Evaluation of Activated Carbon Adsorbents for CO2 Capture in Gasification. Energy Fuels 2009, 23, 2790–2796. [Google Scholar] [CrossRef]
- Pachauri, R.K.; Meyer, L.A. AR5 Synthesis Report: Climate Change 2014; IPCC: Geneva, Switzerland, 2014. [Google Scholar]
- Le Quéré, C.; Peters, G.P.; Andres, R.J.; Andrew, R.M.; Boden, T.A.; Ciais, P.; Friedlingstein, P.; Houghton, R.A.; Marland, G.; Moriarty, R.; et al. Global carbon budget 2013. Earth Syst. Sci. Data 2014, 6, 235–263. [Google Scholar] [CrossRef] [Green Version]
- Yu, K.M.K.; Curcic, I.; Gabriel, J.; Tsang, S.C.E. Recent Advances in CO2 Capture and Utilization. ChemSusChem 2008, 1, 893–899. [Google Scholar] [CrossRef]
- Samanta, A.; Zhao, A.; Shimizu, G.K.H.; Sarkar, P.; Gupta, R. Post-Combustion CO2 Capture Using Solid Sorbents: A Review. Ind. Eng. Chem. Res. 2012, 51, 1438–1463. [Google Scholar] [CrossRef]
- Singh, D.; Croiset, E.; Douglas, P.L.; Douglas, M.A. Techno-economic study of CO2 capture from an existing coal-fired power plant: MEA scrubbing vs. O2/CO2 recycle combustion. Energy Convers. Manag. 2003, 44, 3073–3091. [Google Scholar] [CrossRef]
- Gouedard, C.; Picq, D.; Launay, F.; Carrette, P.L. Amine degradation in CO2 capture. I. A review. Int. J. Greenh. Gas. Con. 2012, 10, 244–270. [Google Scholar] [CrossRef]
- Ding, Y.; Alpay, E. Equilibria and kinetics of CO2 adsorption on hydrotalcite adsorbent. Chem. Eng. Sci. 2000, 55, 3461–3474. [Google Scholar] [CrossRef]
- Mérel, J.; Clausse, M.; Meunier, F. Carbon dioxide capture by indirect thermal swing adsorption using 13X zeolite. Environ. Prog. Sustain. 2006, 25, 327–333. [Google Scholar] [CrossRef]
- Na, B.K.; Koo, K.K.; Eum, H.M.; Lee, H.; Song, H.K. CO2 recovery from flue gas by PSA process using activated carbon. Korean J. Chem. Eng. 2001, 18, 220–227. [Google Scholar] [CrossRef]
- MacDowell, N.; Florin, N.; Buchard, A.; Hallett, J.; Galindo, A.; Jackson, G.; Adjiman, C.S.; Williams, C.K.; Shah, N.; Fennell, P. An overview of CO2 capture technologies. Energy Environ. Sci. 2010, 3, 1645–1669. [Google Scholar] [CrossRef]
- Mason, J.A.; Sumida, K.; Herm, Z.R.; Krishna, R.; Long, J.R. Evaluating metal–organic frameworks for post-combustion carbon dioxide capture via temperature swing adsorption. Energy Environ. Sci. 2011, 4, 3030–3040. [Google Scholar] [CrossRef]
- Olivier, M.G.; Jadot, R. Adsorption of Light Hydrocarbons and Carbon Dioxide on Silica Gel. J. Chem. Eng. Data 1997, 42, 230–233. [Google Scholar] [CrossRef]
- Wang, M.; Yao, L.; Wang, J.; Zhang, Z.; Qiao, W.; Long, D.; Ling, L. Adsorption and regeneration study of polyethylenimine-impregnated millimeter-sized mesoporous carbon spheres for post-combustion CO2 capture. Appl. Energy 2016, 168, 282–290. [Google Scholar] [CrossRef]
- Zhou, C.; He, K.; Lv, W.; Chen, Y.; Tang, S.; Liu, C.; Yue, H.; Liang, B. Energy and Economic Analysis for Post-combustion CO2 Capture using Amine-Functionalized Adsorbents in a Temperature Vacuum Swing Process. Energy Fuels 2019, 33, 1774–1784. [Google Scholar] [CrossRef]
- Sakpal, A.K.T.; Kamble, S.; Kumar, R. Carbon dioxide capture using amine functionalized silica gel. Indian J. Chem. A 2012, 51, 1214–1222. [Google Scholar]
- Zeman, F.S.; Lackner, K.S. Capturing carbon dioxide directly from the atmosphere. World Resour. Rev. 2004, 16, 157–172. [Google Scholar]
- Wright, A.B.; Lackner, K.S. Removal of Carbon Dioxide from Air. U.S. Patent 20060051274A1, 9 March 2006. [Google Scholar]
- Snell, F.D. Trisodium Phosphate—Its Manufacture and Use. Ind. Eng. Chem. 1931, 23, 470–474. [Google Scholar] [CrossRef]
- Balsora, H.K.; Mondal, M.K. Solubility of CO2 in aqueous TSP. Fluid Phase Equilibria 2012, 328, 21–24. [Google Scholar] [CrossRef]
- Balsora, H.K.; Mondal, M.K. Solubility of CO2 in an Aqueous Blend of Diethanolamine and Trisodium Phosphate. J. Chem. Eng. Data 2011, 56, 4691–4695. [Google Scholar] [CrossRef]
- Kumar, A.; Sakpal, T.; Linga, P.; Kumar, R. Impact of Fly Ash Impurity on the Hydrate-Based Gas Separation Process for Carbon Dioxide Capture from a Flue Gas Mixture. Ind. Eng. Chem. Res. 2014, 53, 9849–9859. [Google Scholar] [CrossRef]
- Smith, J.M. Introduction to Chemical Engineering Thermodynamics; McGraw-Hill: New York, NY, USA, 2001. [Google Scholar]
- Miller, F.A.; Wilkins, C.H. Infrared Spectra and Characteristic Frequencies of Inorganic Ions. Anal. Chem. 1952, 24, 1253–1294. [Google Scholar] [CrossRef]
- Belton, P.S.; Clarke, T.A.; Meyrick, D. A novel reaction between carbon dioxide and trisodium orthophosphate dodecahydrate shown by photoelectron spectroscopy and X-ray diffraction. J. Inorg. Nucl. Chem. 1981, 43, 614–615. [Google Scholar] [CrossRef]
- Kamarudin, K.S.N. Structural and gas adsorption characteristics of zeolite adsorbents. Ph.D Thesis, University Technology Malaysia, Johor, Malaysia, 2006. [Google Scholar]
- Song, H.-J.; Lee, S.; Maken, S.; Park, J.-J.; Park, J.-W. Solubilities of carbon dioxide in aqueous solutions of sodium glycinate. Fluid Phase Equilibria 2006, 246, 1–5. [Google Scholar] [CrossRef]
- Lee, S.; Filburn, T.P.; Gray, M.; Park, J.-W.; Song, H.-J. Screening Test of Solid Amine Sorbents for CO2 Capture. Ind. Eng. Chem. Res. 2008, 47, 7419–7423. [Google Scholar] [CrossRef]
- Xu, X.; Song, C.; Andresen, J.M.; Miller, B.G.; Scaroni, A.W. Novel Polyethylenimine-Modified Mesoporous Molecular Sieve of MCM-41 Type as High-Capacity Adsorbent for CO2 Capture. Energy Fuels 2002, 16, 1463–1469. [Google Scholar] [CrossRef]
- Jenab, M.H.; Vahidi, M.; Mehrabi, M. Solubility of Carbon Dioxide in Aqueous Mixtures of DIPA+MDEA and DIPA+PZ Solutions. J. Chin. Chem. Soc. 2006, 53, 283–286. [Google Scholar] [CrossRef]
- Singh, P.; Brilman, D.W.F.; Groeneveld, M.J. Evaluation of CO2 solubility in potential aqueous amine-based solvents at low CO2 partial pressure. Int. J. Greenh. Gas Control 2011, 5, 61–68. [Google Scholar] [CrossRef]
- Tontiwachwuthikul, P.; Meisen, A.; Lim, C.J. Solubility of carbon dioxide in 2-amino-2-methyl-1-propanol solutions. J. Chem. Eng. Data 1991, 36, 130–133. [Google Scholar] [CrossRef]
- Huang, H.Y.; Yang, R.T.; Chinn, D.; Munson, C.L. Amine-Grafted MCM-48 and Silica Xerogel as Superior Sorbents for Acidic Gas Removal from Natural Gas. Ind. Eng. Chem. Res. 2003, 42, 2427–2433. [Google Scholar] [CrossRef]
- Arenillas, A.; Smith, K.M.; Drage, T.C.; Snape, C.E. CO2 capture using some fly ash-derived carbon materials. Fuel 2005, 84, 2204–2210. [Google Scholar] [CrossRef]
- Harlick, P.J.E.; Sayari, A. Applications of Pore-Expanded Mesoporous Silica 5. Triamine Grafted Material with Exceptional CO2 Dynamic and Equilibrium Adsorption Performance. Ind. Eng. Chem. Res. 2007, 46, 446–458. [Google Scholar] [CrossRef]
- Ma, X.; Wang, X.; Song, C. “Molecular Basket” Sorbents for Separation of CO2 and H2S from Various Gas Streams. J. Am. Chem. Soc. 2009, 131, 5777–5783. [Google Scholar] [CrossRef] [PubMed]
- Kim, S.; Marand, E.; Ida, J.; Guliants, V.V. Polysulfone and Mesoporous Molecular Sieve MCM-48 Mixed Matrix Membranes for Gas Separation. Chem. Mater. 2006, 18, 1149–1155. [Google Scholar] [CrossRef]
- Zhang, Z.; Ma, X.; Wang, D.; Song, C.; Wang, Y. Development of silica-gel-supported polyethylenimine sorbents for CO2 capture from flue gas. AIChE J. 2012, 58, 2495–2502. [Google Scholar] [CrossRef]
- Sanz, R.; Calleja, G.; Arencibia, A.; Sanz-Pérez, E.S. Amino functionalized mesostructured SBA-15 silica for CO2 capture: Exploring the relation between the adsorption capacity and the distribution of amino groups by TEM. Microporous Mesoporous Mater. 2012, 158, 309–317. [Google Scholar] [CrossRef]
- McDonald, T.M.; Lee, W.R.; Mason, J.A.; Wiers, B.M.; Hong, C.S.; Long, J.R. Capture of Carbon Dioxide from Air and Flue Gas in the Alkylamine-Appended Metal–Organic Framework mmen-Mg2(dobpdc). J. Am. Chem. Soc. 2012, 134, 167056–167065. [Google Scholar] [CrossRef]
- Creamer, A.E.; Gao, B. Carbon-Based Adsorbents for Post-combustion CO2 Capture: A Critical Review. Environ. Sci. Technol. 2016, 501, 47276–47289. [Google Scholar]
- Patel, H.A.; Byun, J.; Yavuz, C.T. Carbon Dioxide Capture Adsorbents: Chemistry and Methods. ChemSusChem 2017, 10, 1303–1317. [Google Scholar] [CrossRef] [PubMed]
- Oschatz, M.; Antonietti, M. A search for selectivity to enable CO2 capture with porous adsorbents. Energy Environ. Sci. 2018, 11, 57–70. [Google Scholar] [CrossRef]
- Deng, M.; Park, H.G. Spacer-Assisted Amine-Coiled Carbon Nanotubes for CO2 Capture. Langmuir 2019, 35, 4453–4459. [Google Scholar] [CrossRef] [PubMed]
Figure 1.
Schematic diagram of the experimental setup.

Figure 2.
(a) FTIR spectra of pure TSP and regenerated trisodium phosphate (TSP); (b) FTIR spectra of CO2-loaded pure TSP and CO2-loaded regenerated TSP.
Figure 2.
(a) FTIR spectra of pure TSP and regenerated trisodium phosphate (TSP); (b) FTIR spectra of CO2-loaded pure TSP and CO2-loaded regenerated TSP.

Figure 3.
XRD spectrum of (a) pure TSP and regenerated TSP; (b) CO2-loaded pure TSP and CO2-loaded regenerated TSP.
Figure 3.
XRD spectrum of (a) pure TSP and regenerated TSP; (b) CO2-loaded pure TSP and CO2-loaded regenerated TSP.

Figure 4.
(a) Comparison of CO2 uptake capacity (mg of CO2/g of sorbent) at 3.5 MPa pressure and three different temperatures (15, 30, and 50 °C); (b) Rate of gas uptake (mg of CO2/g of sorbent/min) for the same system; (c) pressure and temperature data with respect to time at 30 °C (Curves provided to guide the eye).

Figure 5.
(a) Comparison of CO2 uptake capacity (mg of CO2/g of sorbent) at different pressure (2.0, 3.0, and 5.0 MPa) and 30 °C temperature; (b) rate of gas uptake (mg of CO2/g of sorbent/min) for the same system (Curves provided to guide the eye).
Figure 5.
(a) Comparison of CO2 uptake capacity (mg of CO2/g of sorbent) at different pressure (2.0, 3.0, and 5.0 MPa) and 30 °C temperature; (b) rate of gas uptake (mg of CO2/g of sorbent/min) for the same system (Curves provided to guide the eye).

Figure 6.
(a) CO2 uptake capacity for flue gas mixture contains16.1% CO2 at 30 °C temperature and 3.5 MPa pressure in five different stages; (b) the selectivity of pure CO2 over pure N2 gas at 30 °C temperature and 3.5 MPa pressure (Curves provided to guide the eye).
Figure 6.
(a) CO2 uptake capacity for flue gas mixture contains16.1% CO2 at 30 °C temperature and 3.5 MPa pressure in five different stages; (b) the selectivity of pure CO2 over pure N2 gas at 30 °C temperature and 3.5 MPa pressure (Curves provided to guide the eye).

Figure 7.
(a) Comparison of CO2 uptake capacity (mg of CO2/g of sorbent) at different CO2 composition (16%, 85%, and 100% CO2) at 3.5 MPa pressure and 30 °C temperature; (b) rate of gas uptake (mg of CO2/g of sorbent/min) for the same system (Curves provided to guide the eye).
Figure 7.
(a) Comparison of CO2 uptake capacity (mg of CO2/g of sorbent) at different CO2 composition (16%, 85%, and 100% CO2) at 3.5 MPa pressure and 30 °C temperature; (b) rate of gas uptake (mg of CO2/g of sorbent/min) for the same system (Curves provided to guide the eye).

Figure 8.
(a) CO2 capture capacity of TSP at different regeneration levels at 30 °C and 3.5 MPa pressure (Curves provided to guide the eye) SEM images of (b) CO2-loaded pure TSP and (c) CO2-loaded regenerated TSP.
Figure 8.
(a) CO2 capture capacity of TSP at different regeneration levels at 30 °C and 3.5 MPa pressure (Curves provided to guide the eye) SEM images of (b) CO2-loaded pure TSP and (c) CO2-loaded regenerated TSP.

Figure 9.
(a) Comparison of CO2 capture capacity measured at small and larger scales in which 40 g and 100 g of TSP was used for large scale and 4 g for a small scale; (b) rate of gas uptake (mg of CO2/g of sorbent/min) for the same system (Curves provided to guide the eye).
Figure 9.
(a) Comparison of CO2 capture capacity measured at small and larger scales in which 40 g and 100 g of TSP was used for large scale and 4 g for a small scale; (b) rate of gas uptake (mg of CO2/g of sorbent/min) for the same system (Curves provided to guide the eye).

Figure 10.
A conceptual prototype for TSP-based post-combustion CO2 capture at ambient conditions.


Table 1.
Summary of the experimental conditions, gas composition, and CO2 uptake data along with standard deviation for all the kinetic experiments carried out at small (4 g), medium (40 g), and large scale (100 g).
Table 1.
Summary of the experimental conditions, gas composition, and CO2 uptake data along with standard deviation for all the kinetic experiments carried out at small (4 g), medium (40 g), and large scale (100 g).
| Exp. No. | Experimental Pressure, Pexp (MPa) | Composition (%) | Experimental Temperature (Texp) | Gas Uptake (mg of CO2/g of Sorbent) | Std. Dev. | |
|---|---|---|---|---|---|---|
| CO2 | N2 | |||||
| 1a | 3.5 | 100 | 0 | 15 | 68 | 2.64 |
| 1b | 3.5 | 100 | 0 | 15 | 64 | |
| 1c | 3.5 | 100 | 0 | 15 | 63 | |
| 2a | 3.5 | 100 | 0 | 30 | 198 | 4.72 |
| 2b | 3.5 | 100 | 0 | 30 | 189 | |
| 2c | 3.5 | 100 | 0 | 30 | 191 | |
| 3a | 3.5 | 100 | 0 | 50 | 120 | 2.08 |
| 3b | 3.5 | 100 | 0 | 50 | 117 | |
| 3c | 3.5 | 100 | 0 | 50 | 116 | |
| 4a | 2.0 | 100 | 0 | 30 | 189 | 1.52 |
| 4b | 2.0 | 100 | 0 | 30 | 192 | |
| 4c | 2.0 | 100 | 0 | 30 | 191 | |
| 5a | 5.0 | 100 | 0 | 30 | 196 | 4.04 |
| 5b | 5.0 | 100 | 0 | 30 | 193 | |
| 5c | 5.0 | 100 | 0 | 30 | 188 | |
| 6a | 3.5 | 85 | 15 | 30 | 181 | 2.0 |
| 6b | 3.5 | 85 | 15 | 30 | 177 | |
| 6c | 3.5 | 85 | 15 | 30 | 179 | |
| 7a | 3.5 | 16.1 | 83.9 | 30 | 140 | 2.88 |
| 7b | 3.5 | 16.1 | 83.9 | 30 | 140 | |
| 7c | 3.5 | 16.1 | 83.9 | 30 | 135 | |
| * 8a | 3.5 | 100 | 0 | 30 | 169 | - |
| * 8b | 3.5 | 100 | 0 | 30 | 162 | |
| # 9a | 3.5 | 100 | 0 | 30 | 145 | - |
| # 9b | 3.5 | 100 | 0 | 30 | 139 | |
* 40 g of TSP was used. # 100 g of TSP was used (In rest of the experiments 4 g TSP was used).
Table 2.
CO2 composition at the start of the experiment (feed gas) and at the end of the experiment analyzed by gas chromatography from a gas mixture of 16% CO2 and rest N2 along with calculated CO2 capture efficiency (η)%.
Table 2.
CO2 composition at the start of the experiment (feed gas) and at the end of the experiment analyzed by gas chromatography from a gas mixture of 16% CO2 and rest N2 along with calculated CO2 capture efficiency (η)%.
| Parameter | 1st Stage | 2nd Stage | 3rd Stage | 4th Stage | 5th Stage |
|---|---|---|---|---|---|
| Feed gas (CO2) composition mol fraction | 0.161 | 0.161 | 0.161 | 0.161 | 0.161 |
| Gas phase composition (CO2) at the end of the experiment mol fraction | 0.0116 | 0.0116 | 0.0117 | 0.077 | 0.156 |
| CO2 capture efficiency (η)% | 92.79 | 92.79 | 92.73 | 52.17 | 3.10 |
Table 3.
Comparison of results obtained in this study and those reported earlier in the literature, along with experimental conditions.
Table 3.
Comparison of results obtained in this study and those reported earlier in the literature, along with experimental conditions.
| Materials | Experimental Conditions | Gas Uptake (mg of CO2/g of Sorbent) | Reference | |
|---|---|---|---|---|
| CO2 (mol%) | Temperature (°C) | |||
| Xerogel | 100 | 25 | 49.3 | Huang et al., 2003 [36] |
| MCM-48 | 5 | 25 | 50.2 | Huang et al., 2003 [36] |
| Fly ash-derived carbon materials | 15 | 75 | 45 | Arenillas et al., 2005 [37] |
| MCM-41 | 5 | 25 | 42.7 | Harlick et al., 2006 [38] |
| MCM-41x | 5 | 25 | 47.5 | Harlick et al., 2006 [38] |
| PE-MCM-41 d | 5 | 25 | 68.2 | Harlick et al., 2006 [38] |
| MBS-1 a | 14.9 | 75 | 89.2 | Ma et al., 2009 [39] |
| MBS-2 | 14.9 | 75 | 140.0 | Ma et al., 2009 [39] |
| MCM-41 c | 100 | 25 | 82.3 | Kamarudin, 2009 [29] |
| MCM-41 | 100 | 50 | 22.5 | Kamarudin, 2009 [29] |
| SBA-15 | 100 | 50 | 33.8 | Kamarudin, 2009 [29] |
| MCM-48 | 100 | 25 | 35.2 | Kim et al., 2009 [40] |
| MCM-48 | 100 | 25 | 17.6 | Kim et al., 2009 [40] |
| Silica Gel | 15.1 | 75 | 138.0 | Zhang et al., 2012 [41] |
| SBA-15 b | 23 | 45 | 78.5 | Sanz et al., 2012 [42] |
| SBA-15 | 18 | 45 | 80.3 | Sanz et al., 2012 [42] |
| M2(dobpdc)-Modified MOF-74 | 15 | 40 | 138.2 | McDonald et al., 2012 [43] |
| Activated carbon | 17 | 15–25 | 107–142 | Samanta et al., 2012 [8] |
| Purified SWNT | 17 | 35 | 190 | Samanta et al., 2012 [8] |
| Zeolite 13X | 17 | 20–25 | 115.7–205 | Samanta et al., 2012 [8] |
| molecular sieve 13X | 17 | 20–25 | 95–158 | Samanta et al., 2012 [8] |
| K2CO3 e | 15 | 100 | 92.4 | Samanta et al., 2012 [8] |
| Na2CO3 f | 10 | 50–70 | 114 | Samanta et al., 2012 [8] |
| MOC Composites g | 100 | 25 | 58–71 | Creamer and Gao, 2016 [44] |
| CTS-GO-15 h | 100 | 25 | 174 | Creamer and Gao, 2016 [44] |
| Hollow fibres i | 10 | 35 | 25 | Patel et al., 2017 [45] |
| SIFSIX-2-Cu-I j | 90 | 25 | 238 | Oschatz and Antonietti, 2018 [46] |
| PEI-purine-CNT | 100 | 50 | 170.0 | Deng et al., 2019 [47] |
| PEI–CNT | 100 | 50 | 170.0 | Deng et al., 2019 [47] |
| TSP | 16.1 | 30 | 140.0 | Present study |
| TSP | 85 | 30 | 181.0 | Present study |
| TSP | 100 | 30 | 198.0 | Present study |
a MBS = Molecular Basket Sorbent. b SBA = Santa Barbara Amorphous. c MCM-41 = Mobil Composition of Matter No. 41. d PE-MCM-41 = Pore-Expanded Mesoporous Silica. e Active phase of K2CO3 (35 wt %) supported by AC, activated coke, and silica (fixed bed). f Ceramic supported sorbents (35 wt% Na2CO3). g Metal oxyhydroxide Carbon (biochar). h chitosan graphene oxide composite. I Amine impregnated porous material. j metal–organic materials with coordinative saturated metal centers and periodically arrayed hexafluorosilicate (SiF62−) anions.
© 2019 by the authors. Licensee MDPI, Basel, Switzerland. This article is an open access article distributed under the terms and conditions of the Creative Commons Attribution (CC BY) license (http://creativecommons.org/licenses/by/4.0/).
Share and Cite
MDPI and ACS Style
Sakpal, T.; Kumar, A.; Aman, Z.M.; Kumar, R. Carbon Dioxide Capture from Flue Gas Using Tri-Sodium Phosphate as an Effective Sorbent. Energies 2019, 12, 2889. https://doi.org/10.3390/en12152889
AMA Style
Sakpal T, Kumar A, Aman ZM, Kumar R. Carbon Dioxide Capture from Flue Gas Using Tri-Sodium Phosphate as an Effective Sorbent. Energies. 2019; 12(15):2889. https://doi.org/10.3390/en12152889
Chicago/Turabian StyleSakpal, Tushar, Asheesh Kumar, Zachary M. Aman, and Rajnish Kumar. 2019. "Carbon Dioxide Capture from Flue Gas Using Tri-Sodium Phosphate as an Effective Sorbent" Energies 12, no. 15: 2889. https://doi.org/10.3390/en12152889
Note that from the first issue of 2016, this journal uses article numbers instead of page numbers. See further details here.