Gen-Set Control in Stand-Alone/RES Integrated Power Systems


1
Department of Mechanical and Aerospace Engineering, Sapienza University of Roma, via Eudossiana 18, 00184 Roma, Italy
2
Faculty of Civil and Industrial Engineering, Sapienza University of Rome, via Andrea Doria 3, 04100 Latina, Italy
*
Author to whom correspondence should be addressed.
Energies 2019, 12(17), 3353; https://doi.org/10.3390/en12173353
Submission received: 26 June 2019
/
Revised: 3 August 2019
/
Accepted: 28 August 2019
/
Published: 30 August 2019
(This article belongs to the Special Issue Hybrid Renewable Energy Systems in Remote Sites 2019)
Abstract
:Power supply in stand-alone power systems, such those in non-grid connected islands, represents an important area of study in investigating smart energy concepts. In particular, the discontinuity in renewable energy availability and the mismatch with power demand are likely to hinder grid stability and overall system efficiency. Typically, the load-levelling relies on diesel engine gen-sets which suffer the modulation of power output resulting in increased operation costs and life time reduction. Although energy storage can complement power fluxes balance, a proper dispatch strategy is needed in order to improve diesel engine operations in Renewable Energy Source (RES) integrated systems. The present study investigates the merit of a dispatch strategy aiming at improving gen-set performance in a hybrid RES/storage/Diesel Engine Generator set (DEGS) power configuration. The proposed dispatch strategy is modelled in a transient simulation software, with hourly based analysis over a year period and is applied to a small island case study.
1. Introduction
Energy generation in islands still represents an active field of study [1,2]. This is a consequence of the figure of merits of this specific ambit. There are more than 50,000 islands on Earth [3] inhabited by about 740 million people [4], most with stand-alone power systems [5], possibly a test-bed for the implementation of smart energy policies. Diesel Engine Generator set (DEGS) are customarily used to supply power and are over-sized with a generation margin around 30%–40%, twice as much as the standard for mainland interconnected grid systems [1], to guarantee power supply continuity and unexpected demand peaks. From an operation view point, DEGS often work part-load, ramping the output up and down to match the energy demand, resulting in negative effects on fuel consumption, efficiency, and greenhouse gas emissions.
In European islands there is a 24% expected average growth in electricity demand in the period 2009 to 2020 (notably higher than the EU27 expected one by about 14%) [5]. Moreover, in view of the Industrial Emission Directive, in islands the use of renewable energy power systems appears as an opportunity to effectively act on the energy transition [5]. Such a crucial role in the energy transition is also highlighted by several international programs [6,7] as well as by the increasing number of decarbonized islands [8].
In addition to the economic issues, RES penetration in minor islands is hindered by a number of peculiar factors, among them (a) land use competition, (b) further environmental restrictions due the presence of protected areas, and (c) a significant energy demand seasonality. In this view, secure and reliable energy supply must rely on gen-sets coupling with renewable and storage technologies, opening the field to novel control strategies.
Besides a series of studies on green fuel-blends [9], the efforts to reduce economic and environmental costs of DEGS bring the evaluation of hybridization through renewable power technologies [10,11,12,13,14]. Corsini et al. [10] analyzed the use of hydrogen or water desalination alternatives to use RES surplus energy in an Italian small off-grid island. Phuangpornpitak and Kumar [13] studied the substitution of individual diesel generators with centralized hybrid PV/diesel system in a small island in Thailand (1.1 km2, 502 inhabitants, 116 kWh/day) to find the optimal size for the system according to island community satisfaction. Kusakana [11] and Ibrahim et al. [12] dealt with diesel engines hybridization in isolated mainland communities. In [11] a hydrokinetic-diesel generator system with pumped hydro storage was analyzed, finding advantages from the fuel consumption and economic points of view. In [12] the possibility to hybridize a wind-diesel generation system with a Compressed Air Energy Storage (CAES) used both for storage and diesel engine supercharging purposes. The results demonstrated fuel savings up to 50% and engine efficiency increases.
As a common thread, the available open literature found that the addition of non-programmable renewable energy inputs worsens engine performance, are unstable, and off-design. To this end, storage systems become essential to manage matching RES and end users, lowering RES curtailments and protecting the engines [10,15,16,17,18,19,20].
Furthermore, in the aforementioned studies land availability and size constraints for new installations is mostly omitted, despite its crucial role. Therefore, it appears interesting and useful to look for solutions intended to improve local energy systems, also with reduced RES penetration. To this end a number of scholars have carried out studies on the use of innovative computational approaches [19,21,22,23] making use of dynamic dispatch strategies based on evolutionary optimization methods. Notably, significant attention has been given to wind-diesel hybrid power systems [24,25].
In this vein the present study proposes a control logic intended to manage a RES/storage/DEGS integrated system with the goal to track diesel engine best-efficiency operations. The adopted control logic was developed, on the basis of a previous work in which the load levelling was obtained by means of a programmable electric load i.e., desalt water plant [26]. Here specifically, the developed control strategies are used on two advanced RES/storage/DEGS integrated system configurations which differ from the engine load strategies.
2. Case Study: Ponza Island
Ponza is the main island of the Pontinian Archipelago in the Tyrrhenian Sea. It has an area of about 7.5 km2, the territory has mountainous orography with a maximum altitude of 280 m above the sea level, and presents mainly rocky and jagged shores. The climate is that typical of Mediterranean areas, with mild winters and hot summers, high values of relative humidity, and consistent wind speed (Table 1) [27,28]. Figure 1 shows a Ponza island map [29].
The population, around 3200 inhabitants, doubles in summer-time. This circumstance puts all the utilities under pressure, especially from energy and water supply viewpoints [30]. The energy generation is supplied by two diesel engine generation sets (Table 2), respectively the main power station of 6.2 MW and 2.6 MW with intermittent use (mostly summer time). The yearly energy request is approximately 12 GWh/y, with a maximum power of about 5 MW in the summer period. In winter time the average power demand is in the range 1–2.5 MW [31].
From the renewable energy perspective, Ponza island is an area of enforcement of the Directive 79/409/CEE on the conservation of wild birds, which bans the installation of wind generators. Besides energy efficiency and photovoltaic technology, previous studies assessed the wave-energy potential, both for onshore and near shore devices [30].
3. Methodology
The first step was the development of transient simulation models [32], working on a year time horizon with hourly resolution. The models are representative of four scenarios, with a peculiar dispatch strategy and control logic to drive the DEGS operations. In order to analyze the energy system of the minor island a transient simulation model was developed in the TRNSYS framework, integrated with the HYDROGEMS library, and wave energy converters in an in-house made library. The energy system was divided into four main subsets of components, namely the generating system, the final uses, the control system, and the energy storage system. The meteorological data influences the renewable energy source (RES) technologies, leading to renewable energy surplus. The power system and the demand side system are connected by the control logic, which analyzes the amount of available renewable energy, and activates a pre-defined start-up sequence.
3.1. Base Energy System Scenarios
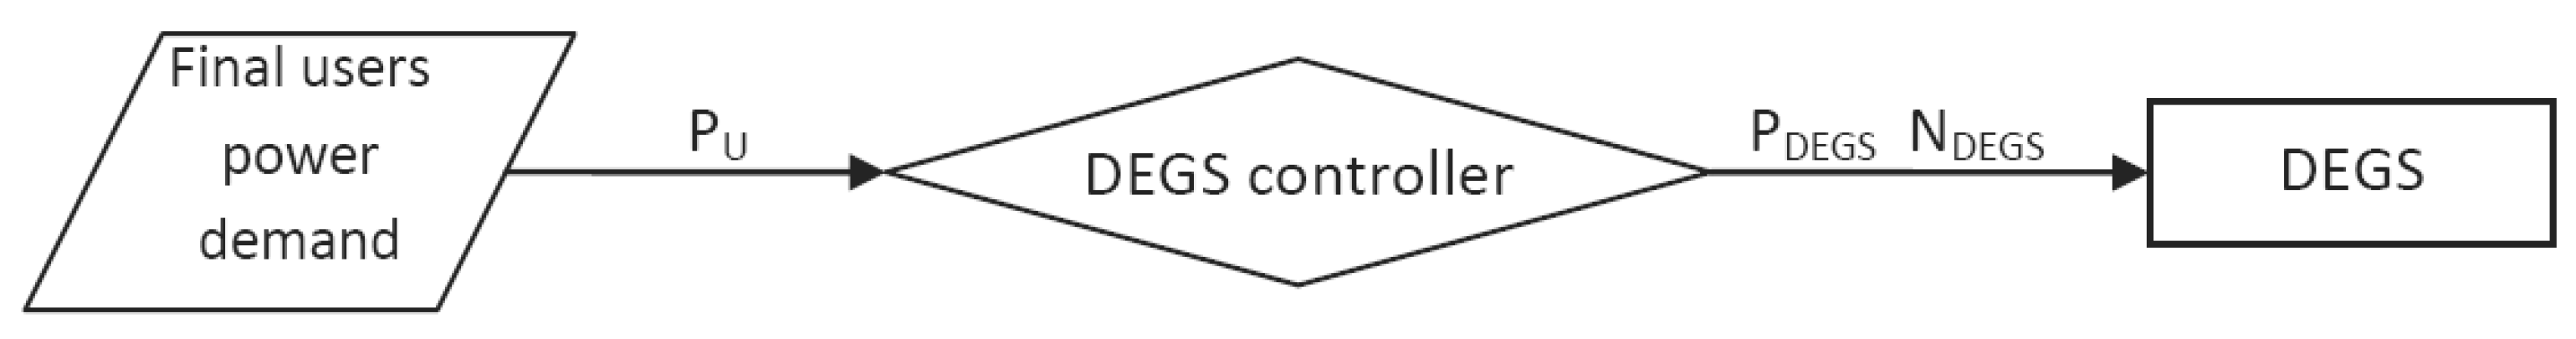
The base scenario represents present island energy system. Figure 2 shows the power system flow chart. Here the control logic is driven by the actual demand resulting in the number of engines and their duty point.
The second reference scenario, so called base-RES, includes the addition of a renewable energy source mix to the base scenario. Here the control logic relies on RES dispatch priority rule and DEGS are operated to compensate any energy deficit. In addition, it is worth noting that base-RES is not equipped with any storage system.
3.2. Advanced Energy System Scenarios and Control Logics
In addition, two advanced scenarios are defined to develop dispatch strategies based on energy storage. Scenarios 1 and 2 share the same flow chart, described by Figure 3. Here, RES and end-user demand are analyzed by a new controller loop implemented with a regulator/inverter to manage battery charge/discharge cycles and DEGS set points. In scenario 1, battery storage is allowed from RES and DEGS. In this scenario, one engine must be always on-duty. In scenario 2, in addition to scenario 1 features, DEGS are also allowed to shut-down. Notably, in real operations, a scenario which allows the complete shut-down of the DEGS should be coupled with a capability to forecast (or now-cast) load and renewable energy capacity to inform the control strategies.
The objective of the control logic is to track gen-set efficiency optima or sub-optima, typically affected by significant power output fluctuations in RES integrated energy systems. The control logic, then, is set to define the gen-set duty point (PDEGS) basically comparing RES availability (PRES), end-user power demand (PD), storage fractional state of charge (FSOC), and reference engine’s power (PREF). In view of the correlation between load factor and efficiency, the goal is to minimize the number of running engines, increasing the power set-point, by managing the energy storage. The possibility to use the DEGS to charge batteries is a controversial theme as it may improve DEGS performance but negatively impact on battery life-cycling and on the RES storing option [33,34]. Nevertheless, since the energy system stability of the island relies on DEGS, the direct DEGS-to-battery charging can result in an overall enhancement of energy system performance. As such, in the present study, battery charge from DEGS is allowed.
Figure 4 shows a simplified flow-chart of the control logic, while Figure 5, Figure 6, Figure 7 and Figure 8 show the details of each subsection. In the Figure 4 flow-chart, evaluation blocks are labeled EB1–4, decision points are indicated by circled letters, and end-points by squared numbers.
Evaluation block EB1, Figure 5, is the first step of the control logic (A) and activates when available RES power is higher than user demand. When in EB1, the following actions are undertaken: check the minimum number of diesel units on, compute the power to the battery stack (PEXRD) in case of storage remaining capacity (PC < PC,M), or evaluate the energy dump (PDUMP).
Evaluation block EB2, Figure 6, is activated when load demand exceeds RES power input. Here the residual load (PLOAD), with respect to the RES availability, is computed and used to first evaluate the number and duty requirements for gen-set to meet the given load goal. In particular, the engines are controlled in a master-slave setup: the ith engine can only be switched on if the (i − 1)th engine is on [32]. A “call up” and “call down” power level can be defined (the load power at which the corresponding engine is respectively switched on (85%) or off (40%)). The dispatch controller simply loops through the engines and compares the power required by the load to the switch-on and -off powers. If the indicated power (PDEGS) meets efficiency target, defined by the reference power level, no storage intervention is needed. On the contrary, the control monitors the number of engines to be operated in the hypothesis of charging the storage (nodes F and H) up to FSOC equal to 1.
Evaluation block EB3, Figure 7, initiates when stored power is higher than the load request. Hence, if all engines are allowed to be off-duty (D01 = 0), the load demand can be entirely matched by storage. Otherwise, in case a minimum number of engines is on-duty (D01 = 1), an iterative procedure is undertaken to determine the best DEGS cumulative power with the aim to satisfy the load while minimizing energy dump using battery buffer.
Evaluation block EB4, Figure 8, starts at the decision point (I) if the load request is higher than the storage capability. In this circumstance, the procedure computes the minimum power share to the engines (given by the difference between the load and the maximum discharge power). The goal is to find the optimum engine load factor with the maximum possible storage discharge contribution and the minimum number of running engines.
3.3. Technologies and Working Parameters
Table 3 summarizes the main specifications of the power technologies considered either in base or advanced energy system models.
The gen-set model was simplified with the hypothesis of equal engine rating. Accordingly, it includes six 1380 kW units, with an installed power of 8.3 MW. Figure 9 shows the engine management logic based on efficiency-power output curve. Notably, the engine could not operate in Zone 1, i.e., with load factor below 20%. Zone 2 identifies the duty range (20%–45% of the rated power) where the developed dispatch strategies play by driving the batteries, i.e., shutting-down the engine and discharging the batteries or powering-up the gen-set and charging the surplus energy. Zone 3 identifies the range of efficient engine operations.
The photovoltaic array has a nominal power of 2 MW. Such peak power availability was based on the energy action plan of the municipality [35]. The wave energy array, based on ISWEC power take-off [36], includes 35 units with 60 kWp and an overall nominal power of 2.1 MW. It is worth noting that the use of such wave energy converter was already assessed in [30]. To this end, wave data refer to the period 2001–2010, featuring specifically an average height of 0.88 m and significant period of 4.4 s [32].
The battery stack has an installed power of 0.56 MW, with 90 modules of 6.25 kW Sodium Nickel batteries. Notably, the batteries are allowed to discharge to a minimum FSOC equal to FD = 0.1, and the efficiency is set to its nominal value. No charging prioritization is implemented for the battery stack.
4. Results
4.1. RES Generation
Table 4 compares, on a monthly basis, the RES power mix inputs (PV and wave) against the end-user demand. The simulation of the RES power mix (in base-RES, scenarios 1 and 2) resulted in a gross energy conversion about 2560 MWh/year, giving a 24% share of the annual energy demand (Table 4). To this end, Figure 10 shows the hourly distributions of PV and wave energy converter inputs. As evident, solar power (PPV) is converted quite constantly during the year with higher values during summer, while the wave power (PW) has a random behavior with peaks distributed all over the year. It is also confirmed that RES input is typically acting as a base-load on user demand with few exceptional peaks of surplus (mostly located in winter season).
4.2. Analysis of Dispatch Strategies
Focusing on the control logic designed to drive power mix-storage coupling in scenarios 1 and 2, Table 5 shows the occurrence of the end-blocks of the control flow chart to overview the behavior of the energy management system. The predominance of end-point 5 for both scenarios (6484 h of occurrence) indicates that 74% of the hours the power demand (PD) exceeds the renewable power availability (PRES). During those conditions, the gen-set power is above or equal to the reference one, and DEGS efficiency is on target level with no energy flux to/from storage.
For the remaining quarter of the year, the scenario 1 energy system mostly works at end-point 82 (873 h). This entails that, notwithstanding storage availability compared to demand, the condition on one engine on-duty leads always to an energy surplus.
When analyzing scenario 2, renewable power availability globally exceeds the load in 525 h, as per 503 h in end-point 1 and 22 h in end-point 4. This causes (a) RES-based battery charging and, also, (b) RES power surplus dump due to storage limit. In addition, the system runs 561 h with no DEGS on-duty due to the complementary contribution of RES and storage discharge (end-point 80) which accounts for 12% share of the duty time with no diesel engine contribution. Battery charge from DEGS occur in 705 h, respectively when battery level of charge is below the load or batteries are empty (end-points 9 and 12 conditions).
4.3. Energy System Performance
A comparison of the overall performance of the system for the proposed scenarios is illustrated in Table 6. As expected, the results show DEGS energy output reduction in the base-RES scenario, as the RES contribution acts as load reducer, with 20.17% emission savings with respect to the base scenario. Notably, the simplicity of the architecture leads the base-RES scenario to be the worse in terms of DEGS performance. In fact, with respect to scenarios 1 and 2, it features higher overall engine duty time, and specific fuel consumption. These findings favor the demonstration that the integration of renewable energies can adversely affect stand-alone power systems.
The chance to divert energy from DEGS to batteries, in scenarios 1 and 2, results in higher engine energy output with respect to the base-RES scenario. However, gen-set yearly performance improves with a mean electric efficiency increase respectively of 1.15% and 2%.
In absolute terms with respect to the base scenario, scenario 2 presents a 19.25% decrease of the overall duty time and, consequently, this condition reflects in equivalent reduction of fuel consumption and equivalent emission. It is anticipated that the best performance of scenario 2 on scenario 1 can be attributed to the possibility of DEGS units shut-down. When comparing scenario 2 to the Base-RES one, the latter is outperforming in terms of overall fuel consumption (and emissions) but the counter-part is the larger diesel engine modulation (as given by the annual mean power and the gen-set efficiency). As such, it is possible to infer that the pay-off introduced by the storage capacity in combination with the control logic mainly resides in the optimization of diesel engine set operations as also indicated by the distribution of duty hours per engine, which is far more balanced in scenario 2.
Figure 11 compares the number of duty hours per engine. In the base scenario, one engine is operated, featuring an overall duty time of 12,877 h/y, 62% of which is running one engine. During 2637 h/y the load is matched by two engines. The remaining time, the DEGS mostly works with three engines. The other scenarios (except scenario 2) show an increase of time with only one active engine counterbalanced by a decrease of time in which the load is matched contemporarily by two or three engines. The time with four or five engines contemporarily active remains almost unchanged as it corresponds to the summer period, when renewable and storage contributions are not sufficient to meet load demand. In Scenario 2 the time with only one active engine drops to 5511 h, and, with respect to the Base RES scenario and scenario 1, it is counterbalanced by 1086 h/y of DEGS total shutdown.
In order to provide additional information, Table 7 compares the average power per active engine to reflect the load-levelling quality and indirectly the generation efficiency, i.e., higher average power means a better gen-set modulation as a result of off-design operation shrinking. First, when looking at the one-engine condition, the higher average power drop is with base RES due to the richer contribution of RES in period (i.e., winter time) of low power demand. In scenarios 1 and 2, the presence of the battery storage results in a general increase of average power clearly evident from three engines. Moreover, the highest average power values are obtained in scenario 2 and can be attributed to the possibility to shut-down the engines, entailing the saving of energy related to engines active at minimum power occurring in the other scenarios, also when not effectively needed to meet the load.
Figure 12 compares gen-set efficiency. In the base scenario the engine efficiency (Figure 12a) oscillates in a narrow range of 0.3585–0.4045 all over the year, with a mean value of 0.3860. With the RES introduction, the base-RES scenario features a large spread (Figure 12b) with values ranging 0.2018 to 0.4045, and an average efficiency of 0.3638. It is worth noting the range broadening does not affect the summer period (i.e., hours interval between 4000 and 6000). This behavior is due to the high energy request of that period, with gen-set operating at the highest load factor. In scenario 1 the efficiency values range between 0.2018 and 0.4116 (Figure 12c) with a 0.3753 mean value. The efficiency points at 0.2018 in scenario 1 (approx. 6% of the duty time) are attributable to the cases in which the control logic leads the DEGS to work with only one active engine at minimum power mainly due to the impossibility to use the storage buffer. In scenario 2 the values range between 0.3646 and 0.4116 (Figure 12d), turning to a behavior similar to the one of the base scenario, but with a higher average efficiency of 0.3842, confirming the validity of the proposed energy management in implementing a high efficiency load-levelling strategy.
To give additional information on power system dynamics, Figure 13 illustrates the hourly behavior during day-time (e.g., 20th September). It is worth noting that the initial storage conditions, in the selected day, are equal for scenarios 1 and 2. Figure 13a shows renewable and gen-set inputs. As can be seen, at the beginning and at the end of the day, the curves are perfectly overlapped because RES and storage contributions zeroed. When RES is present (base-RES) the DEGS supply curve is mirrored to the RES curve, as the renewable contribution is entirely used to meet the load. Scenario 1 curve shows a DEGS supply behavior disconnected from the RES availability. In fact, the peak that occurred at hour 6298 is related to an increase of the DEGS power intended to charge the battery storage (Figure 13b) while the hollow at hour 6302 corresponds to a storage discharge. The DEGS supply curve in scenario 2 follows scenario 1 with exception of the period between hours 6301 and 6305 in which the generator set is allowed to be shut down and the storage works complementary with RES to meet the load (Figure 13c).
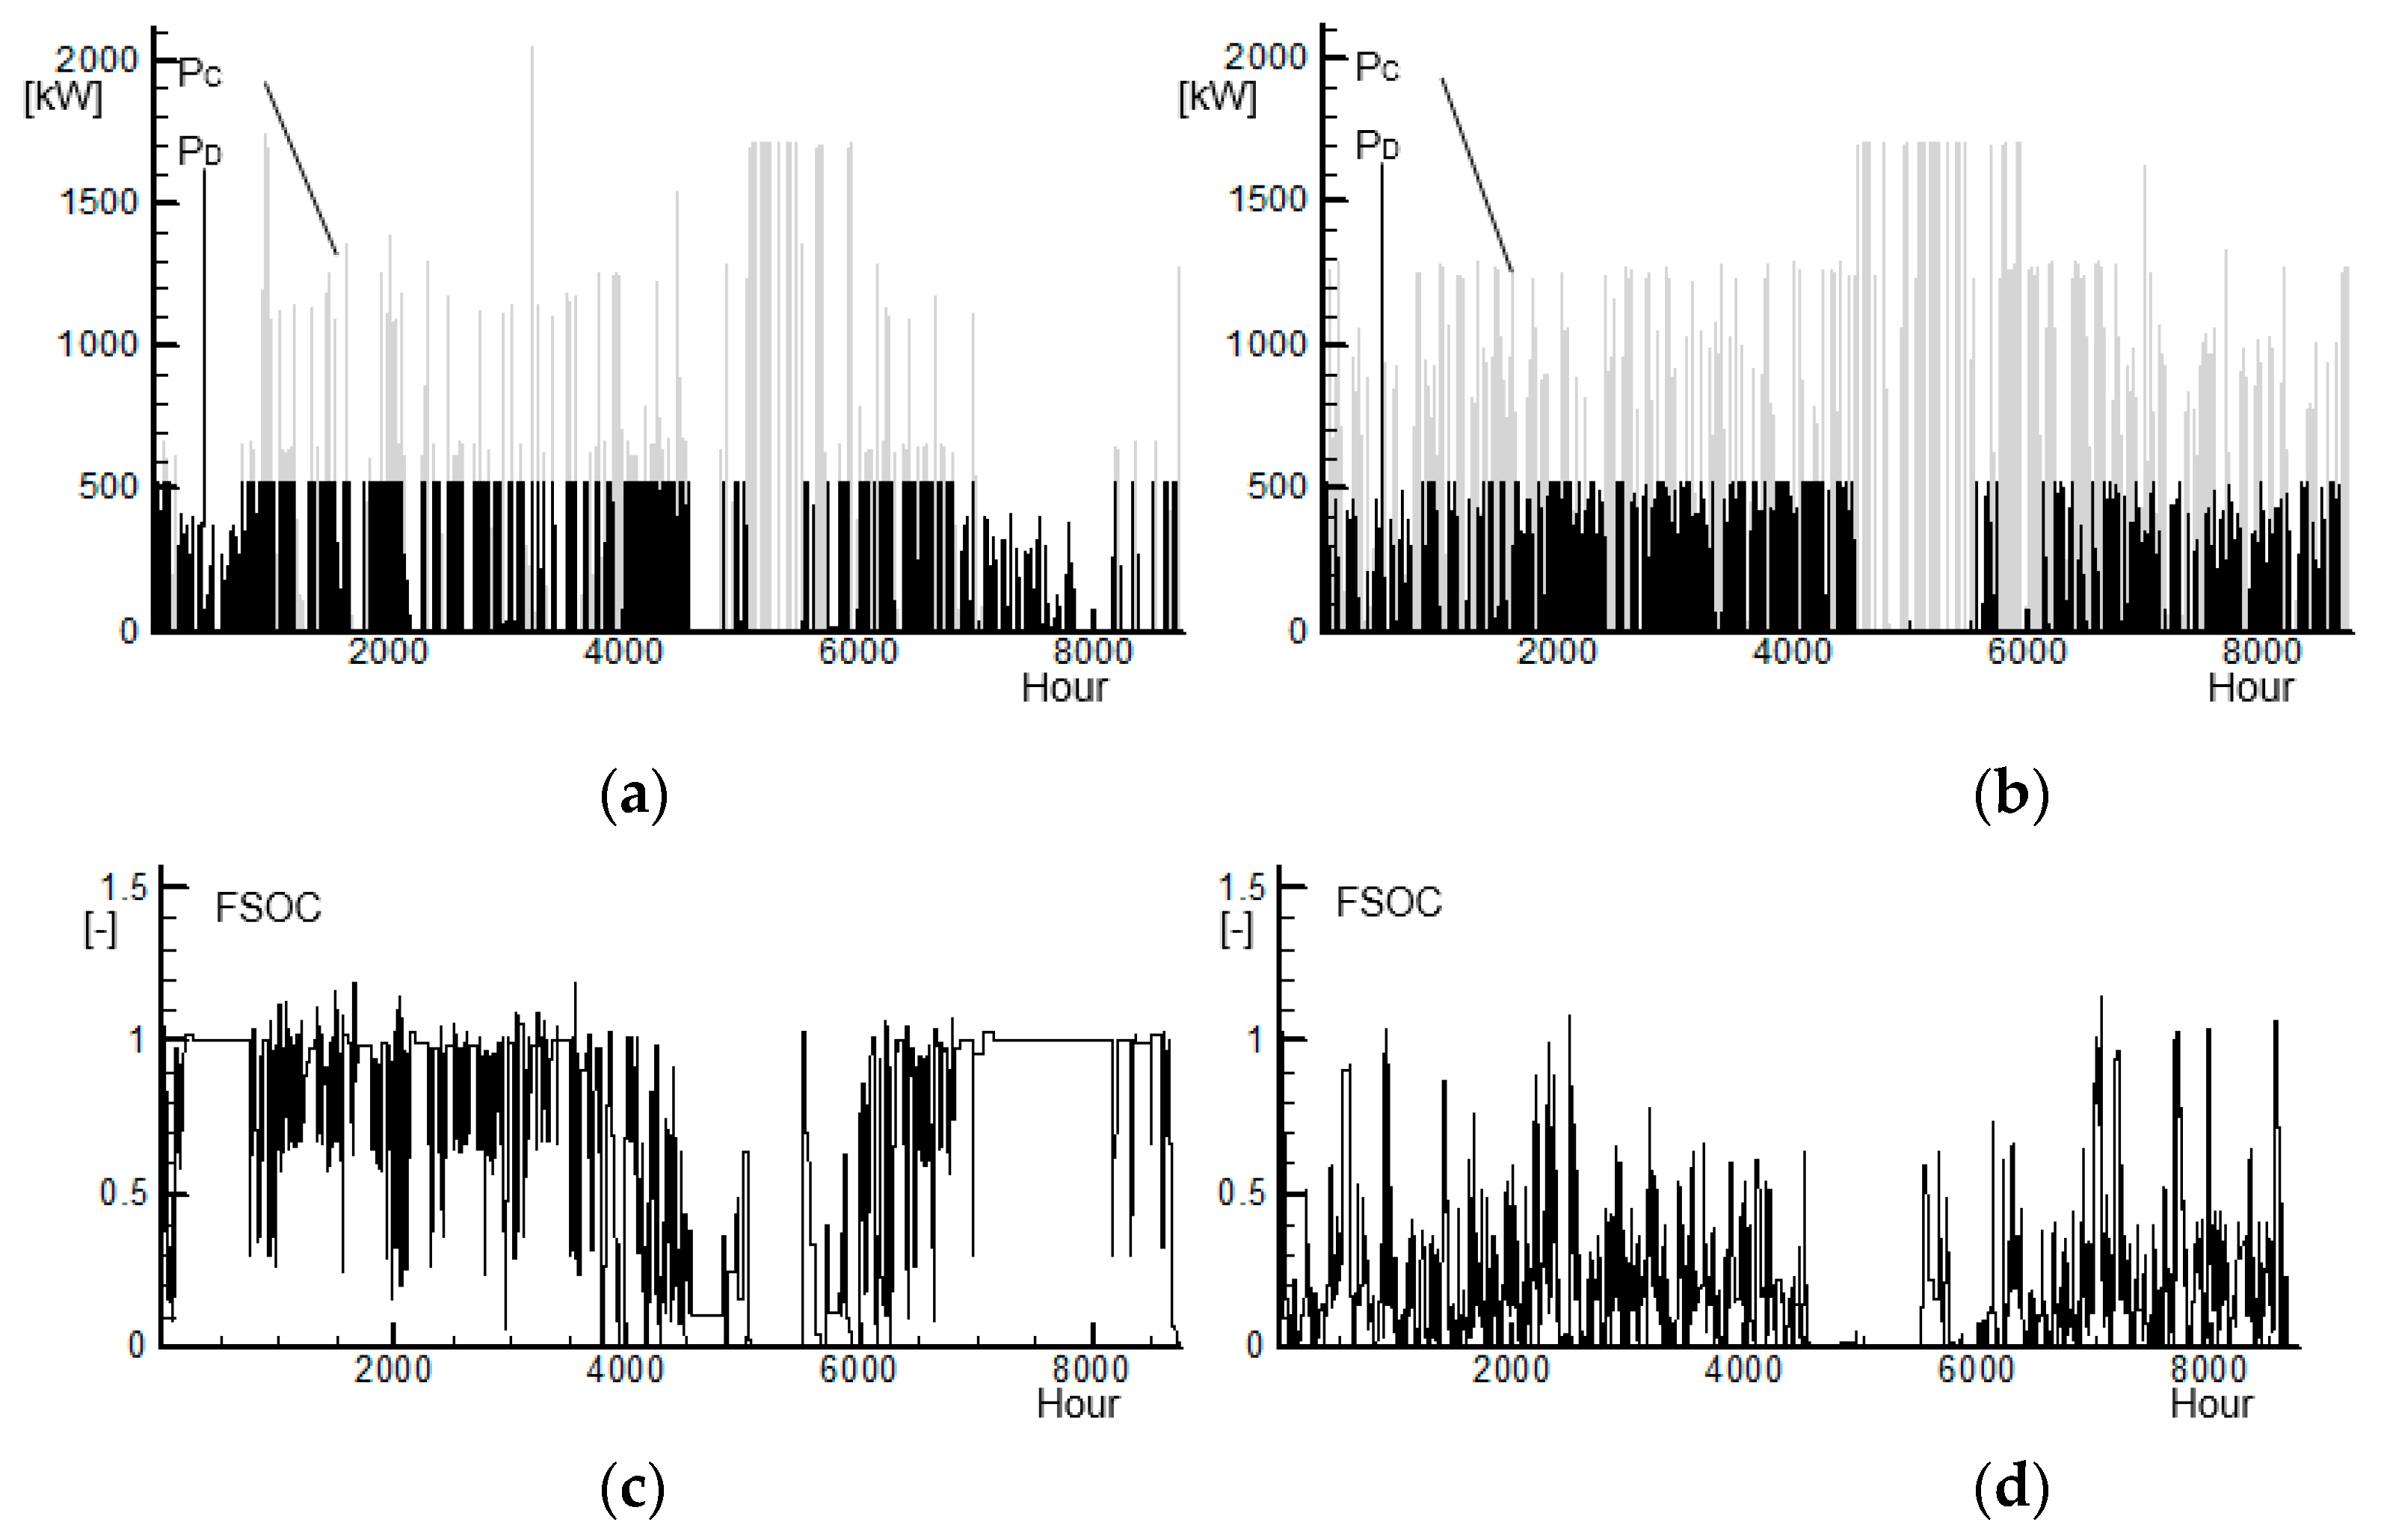
Focusing on scenarios 1 and 2, Figure 14 shows the behavior of the storage while Table 8 summarizes storage monthly performance data. Scenario 2 presents more frequent charge/discharge dynamics with respect to scenario 1 (Figure 14a,b). This is mostly attributable to the possibility to completely shut down the gen-set in scenario 2, entailing a heavier use of storage supplying 199 MWh/y in scenario 2 and 158 MWh/y in scenario 1 (Table 8). This circumstance affects also the storage state of charge. In fact, FSOC in scenario 2 (Figure 14d) fluctuates more than in scenario 1 (Figure 14c), as a consequence of a more frequent use of dedicated recharge from the generator set (end-block 12) lasting 485 h. A second finding is that the dedicated storage re-charge from DEGS entails a yearly cumulative energy of 612 MWh/y, about three times the yearly cumulative discharge. This indicates the possibility to down-size the storage in the working conditions of scenario 2.
5. Conclusions
The present work aimed at evaluating a new control strategy for diesel gen set when operating in stand-alone power systems equipped with RES and storage technologies. in transition to sustainable and carbon-free power systems.
Within the case study of Ponza Island. four scenarios were presented: a base scenario representing the current state. a base scenario with RES addition and two new dispatch strategy scenarios. the second one allowing the complete shut-down of the DEGS.
The scenarios results were analyzed trough the control logic behavior. engine performance. fuel consumption. and energy storage behavior. Moreover. a focus was made on the scenario’s behavior of a single day. The proposed load-levelling strategies effectively improve the system performance after the introduction of RES in the system. In particular. it was shown that scenario 2. allowing the complete shutdown of the DEGS. entails the increase of the average engines power. a decrease of the overall duty time. and a higher storage system employment. thus a deeper RES penetration in the island energy system.
Author Contributions
Conceptualization, A.C. and E.T.; Methodology, E.T. and L.C.; Writing—software, F.L. and E.T.; Data Curation and Validation, L.C., F.L. and E.T.; Formal Analysis and Interpretation, L.C., F.L. and E.T.; Writing—Original Draft Preparation, all authors; Writing—Review & Editing, all authors; Supervision, A.C.
Funding
This research received no external funding.
Conflicts of Interest
The authors declare no conflict of interest.
Nomenclature
| D01 | On-off flag for diesel engines e.g. D01 = 1 on; D01 = 0 off |
| DEGS | Diesel engine gen-set |
| E | Energy |
| FB | Charge/discharge limit |
| FC | Upper limit on FSOC. If FSOC > FC charging is not allowed |
| FD | Lower limit on FSOC. If FSOC < FD discharging is not allowed |
| FSOC | Fractional State of Charge |
| ISWEC | Inertial Sea Wave Energy Converter |
| NDEGS | Number of diesel engines |
| P | Power |
| PLIMIT | Inverter maximum power limit |
| PDmaxI | Maximum discharge power allowed |
| PRATED | Engine’s rated power |
| PREF | Engine’s reference power |
| RES | Renewable Energy Sources |
| XLOW | Lower engine power set point |
| XUP | Upper engine power set point |
| ηDEGS | Diesel engine efficiency |
| Subscripts | |
| C | Charge |
| C-DEGS | DEGS power share to contribution to storage |
| D | Discharge |
| DEGS-R | Residual power from DEGS (after RES and storage contributions) |
| DUMP | Energy dump from RES/DEGS |
| EXR | Surplus energy from RES |
| EXRD | Surplus from RES and DEGS |
| IN | Input |
| LOAD | Net load |
| m | Minimum |
| M | Maximum |
| OUT | Output |
| PV | Photovoltaic |
| U | End user demand |
References
- Kuang, Y.; Zhang, Y.; Zhou, B.; Li, C.; Cao, Y.; Li, L.; Zeng, L. A review of renewable energy utilization in islands. Renew. Sustain. Energy Rev. 2016, 59, 504–513. [Google Scholar] [CrossRef]
- Bénard-Sora, F.; Praene, J.P. Territorial analysis of energy consumption of a small remote island: Proposal for classification and highlighting consumption profiles. Renew. Sustain. Energy Rev. 2016, 59, 636–648. [Google Scholar] [Green Version]
- Marín, C.; Alves, L.M.; Zervos, A. 100% RES-A Challenge for Island Sustainable Development; Instituto Superior Tecnico; Mechanical Engineering Department: Lisboa, Portugal, 2005. [Google Scholar]
- Leal Filho, W.; Mannke, F.; Mohee, R.; Schulte, V. Climate-Smart Technologies: Integrating Renewable Energy Efficiency in Mitigation and Adaptation Responses; Springer Science & Business Media: Berlin/Heidelberg, Germany, 2013. [Google Scholar]
- Eurelectric EU. Islands: Towards a Sustainable Energy Future; Report; Eurelectric EU: Brussels, Belgium, June 2012. [Google Scholar]
- IRENA. GREIN-Global Renewable Energy Islands Network. Supporting Island Transitions to a Renewable Energy Future. Available online: http://www.irena.org/ (accessed on 26 August 2019).
- Rocky Mountain Institute and Carbon War Room. The Ten Island Renewable Challenge. Available online: http://carbonwarroom.com/content/islands-energy-program (accessed on 26 August 2019).
- Legambiente. Smart Energy Islands-11 Islands in Transition Toward 100% Renewable; Legambiente: Rome, Italy, 2018. (In Italian) [Google Scholar]
- Mwangi, J.K.; Lee, W.J.; Chang, Y.C.; Chen, C.Y.; Wang, L.C. An overview: Energy saving and pollution reduction by using green fuel blends in diesel engines. Appl. Energy 2015, 159, 214–236. [Google Scholar]
- Corsini, A.; Rispoli, F.; Gamberale, M.; Tortora, E. Assessment of H2- and H2O-based renewable energy buffering systems in minor islands. Renew. Energy 2009, 34, 279–288. [Google Scholar]
- Kusakana, K. Optimization of the daily operation of a hydrokinetic–diesel hybrid system with pumped hydro storage. Energy Convers. Manag. 2015, 106, 901–910. [Google Scholar] [CrossRef]
- Ibrahim, H.; Younès, R.; Basbous, T.; Ilinca, A.; Dimitrova, M. Optimization of diesel engine performances for a hybrid wind-diesel system with compressed air energy storage. Energy 2011, 3079–3091. [Google Scholar] [CrossRef]
- Phuangpornpitak, N.; Kumar, S. User acceptance of diesel/PV hybrid system in an island community. Renew. Energy 2011, 36, 125–131. [Google Scholar] [CrossRef]
- Razak, J.A.; Sopian, K.; Nopiah, Z.M.; Zaharim, A.; Ali, Y. Optimal operational strategy for hybrid renewable energy system using genetic algorithms. In Proceedings of the 12th WSEAS International Conference on Applied Mathematics, Cairo, Egypt, 29–31 December 2007. [Google Scholar]
- Kaldellis, J.K.; Kapsali, M.; Tiligadas, D. Presentation of a stochastic model estimating the wind energy contribution in remote island electrical networks. Appl. Energy 2012, 97, 68–76. [Google Scholar]
- Parisio, A.; Rikos, E.; Tzamalis, G.; Glielmo, L. Use of model predictive control for experimental micro-grid optimization. Appl. Energy 2014, 115, 37–46. [Google Scholar] [CrossRef]
- Rezzouk, H.; Mellit, A. Feasibility study and sensitivity analysis of a stand-alone photovoltaic-diesel-battery hybrid energy system in the north of Algeria. Renew. Sustain. Energy Rev. 2015, 1134–1150. [Google Scholar]
- Dufo-López, R.; Bernal-Agustín, J.L.; Contreras, J. Optimization of control strategies for stand-alone renewable energy systems with hydrogen storage. Renew. Energy 2007, 1102–1126. [Google Scholar]
- Neves, D.; Silva, C.A. Optimal electricity dispatch on isolated mini-grids using a demand response strategy for thermal storage backup with genetic algorithms. Energy 2015, 82, 436–445. [Google Scholar] [CrossRef]
- Garcia, R.S.; Weisser, D. A wind-diesel system with hydrogen storage: Joint optimisation of design and dispatch. Renew Energy 2006, 31, 2296–2320. [Google Scholar] [CrossRef]
- Di Silvestre, M.L.; La Cascia, D.; Riva Sanseverino, E.; Zizzo, G. Improving the energy efficiency of an islanded distribution network using classical and innovative computation methods. Util. Policy 2016, 40, 58–66. [Google Scholar] [CrossRef]
- Alvarez, E.; Campos, A.M.; Arboleya, P.; Gutiérrez, A.J. Microgrid management with a quick response optimization algorithm for active power dispatch. Electr. Power Energy Syst. 2012, 43, 465–473. [Google Scholar] [CrossRef]
- Cozzolino, R.; Tribioli, L.; Bella, G. Power management of a hybrid renewable system for artificial islands: A case study. Energy 2016, 106, 774–789. [Google Scholar]
- Hu, Y.; Morales, J.M.; Pineda, S.; Sánchez, M.J.; Solana, P. Dynamic multi-stage dispatch of isolated wind–diesel power systems. Energy Convers. Manag. 2015, 103, 605–615. [Google Scholar] [CrossRef]
- Drouilhet, S.M.; Shirazi, M. Wales Alaska High-Penetration Wind-Diesel Hybrid Power System: Theory of Operation; National Renewable Energy Laboratory: Golden, CO, USA, 2002. [Google Scholar]
- Corsini, A.; Tortora, E. Sea-Water Desalination for Load Levelling of Gen-Sets in Small Off-Grid Islands. Energies 2018, 11, 2068. [Google Scholar] [CrossRef]
- Italian Military Air Force-Meteorological Service. Italian Climate Atlas for Years 1971–2000; Ministero della Difesa, Aeronautica Militare: Roma, Italy, 2009. [Google Scholar]
- Italian Military Air Force-Experimental Aeronautical Meteorology Department. Global Solar Radiation and Insolation Duration in Italy from Year 1991 to 2010; Ministero della Difesa, Aeronautica Militare: Roma, Italy, 2012. [Google Scholar]
- Latina Province Web-Gis Atlas. 2019. Available online: https://sit.provincia.latina.it/web-gis.html (accessed on 26 August 2019).
- Corsini, A.; Tortora, E.; Cima, E. Preliminary assessment of wave energy use in an off-grid minor island desalination plant. Energy Proced. 2015, 82, 789–796. [Google Scholar]
- Latina Province Energy and Environment Plan. 2007. Available online: www.provincia.latina.it (accessed on 26 August 2019).
- Klein, S.A.; Beckam, W.A.; Mitchell, J.W.; Braun, J.E.; Evans, B.L.; Kummert, J.P. TRNSYS–A Transient System Simulation Program; Version 15.1; Solar Energy Laboratory, University of Wisconsin: Madison, WI, USA, 2000. [Google Scholar]
- Barley, C.D.; Byron Winn, C. Optimal dispatch strategy in remote hybrid power systems. Sol. Energy 1996, 58, 165–179. [Google Scholar] [CrossRef]
- Manchester, S.C.; Swan, L.G.; Groulx, D. Regenerative air energy storage for remote wind-diesel micro-grid communities. Appl. Energy 2015, 137, 490–500. [Google Scholar]
- Municipality of Ponza. Tender Notice for the Launch of a Competitive Dialog Procedure for the Proposal Selection Aimed at the Realization. Management and Operation of the Energy Generation Plant in “Monte Pagliaro”; Attachment N.1—General Technical Prescriptions; Ponza Municipality: Ponza, Italy, November 2014. [Google Scholar]
- Bracco, G.; Cagninei, A.; Giorcelli, E.; Mattiazzo, G.; Poggi, D.; Raffero, M. Experimental validation of the ISWEC wave to PTO model. Ocean Eng. 2016, 120, 40–51. [Google Scholar] [CrossRef]
Figure 1.
Ponza island map
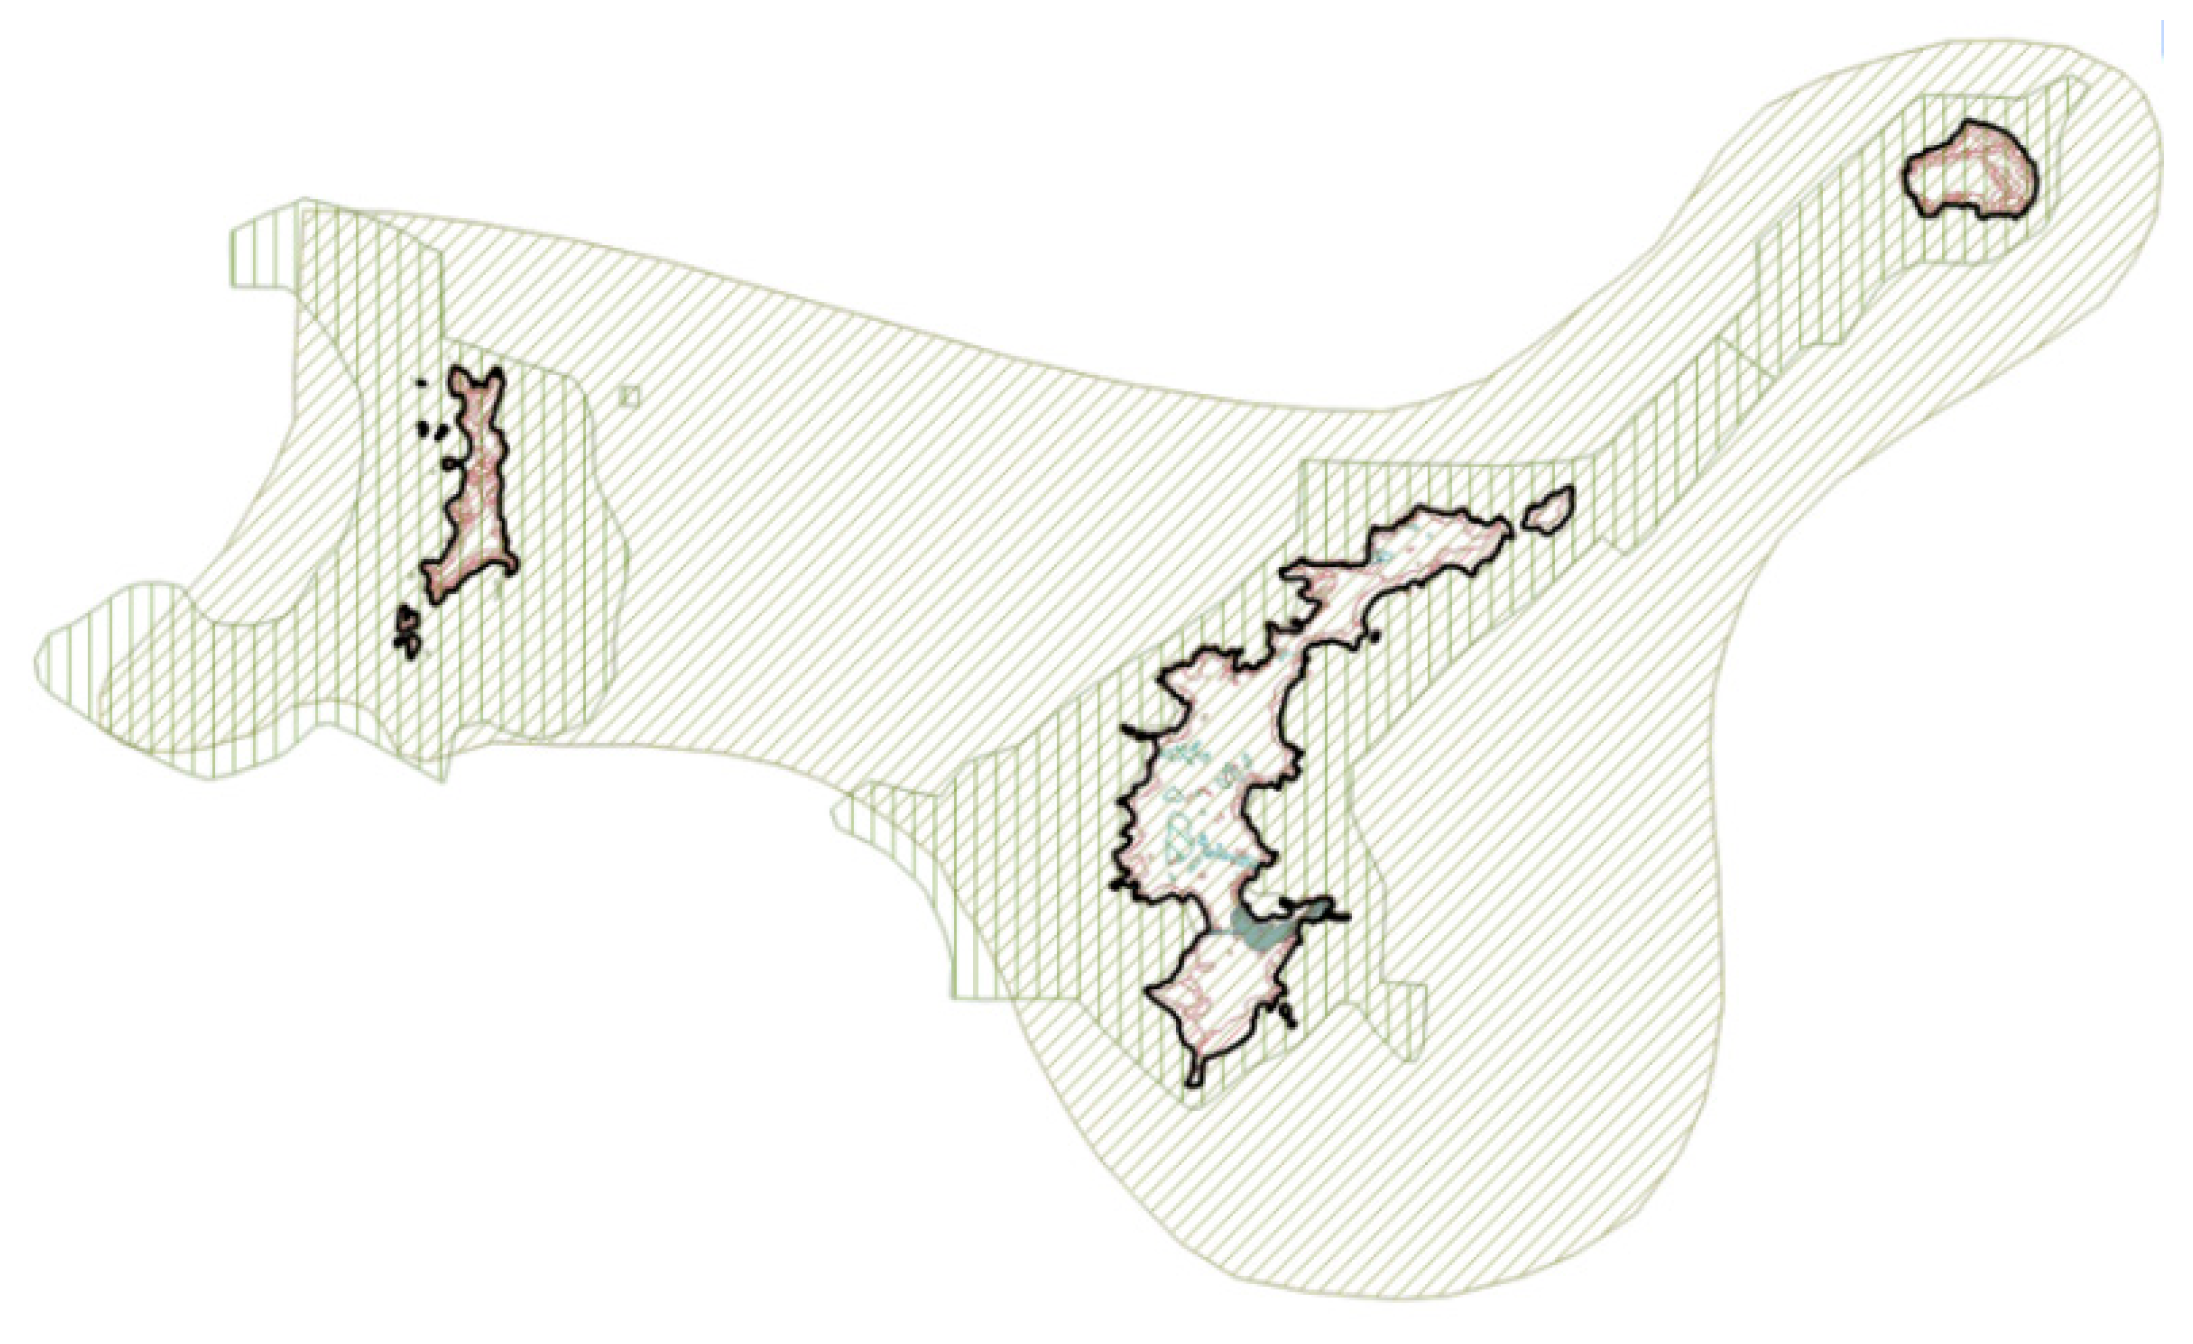
Figure 2.
Energy system base scenario.
Figure 3.
Energy systems in scenarios 1 and 2.

Figure 4.
Control logic scheme flow chart.
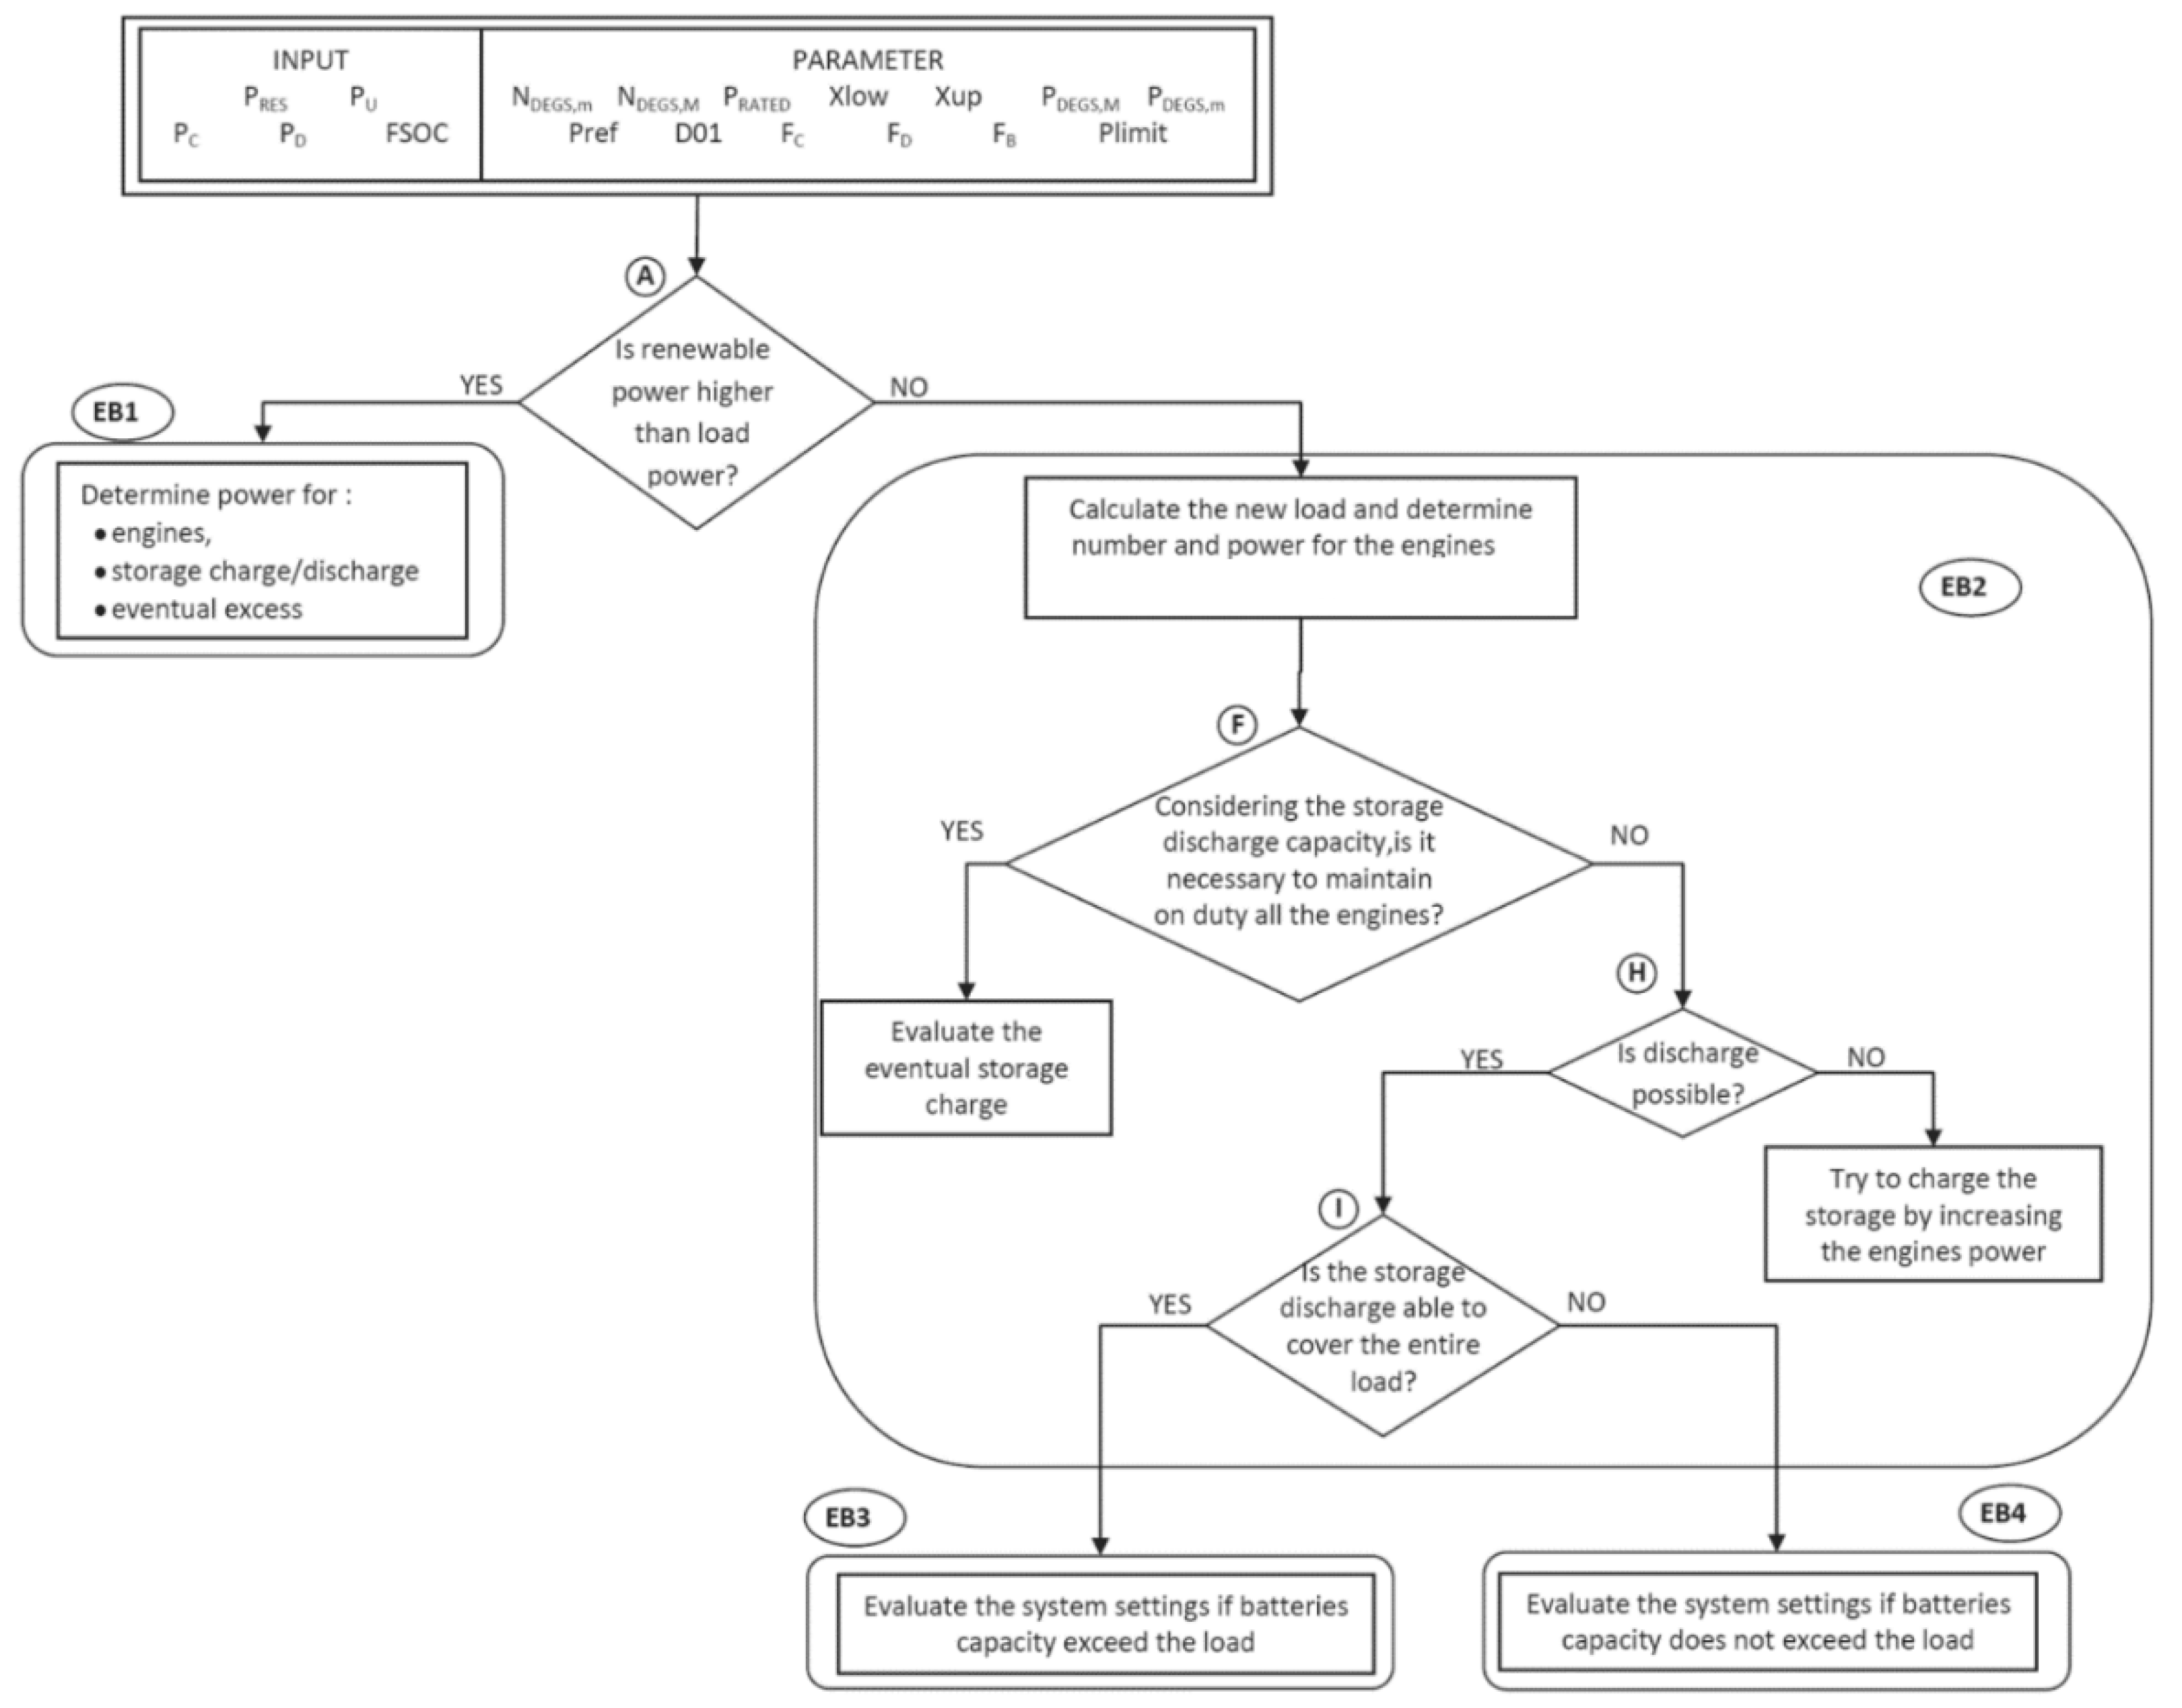
Figure 5.
Control logic flow chart—evaluation block EB1.

Figure 6.
Control logic flow chart—evaluation block EB2.
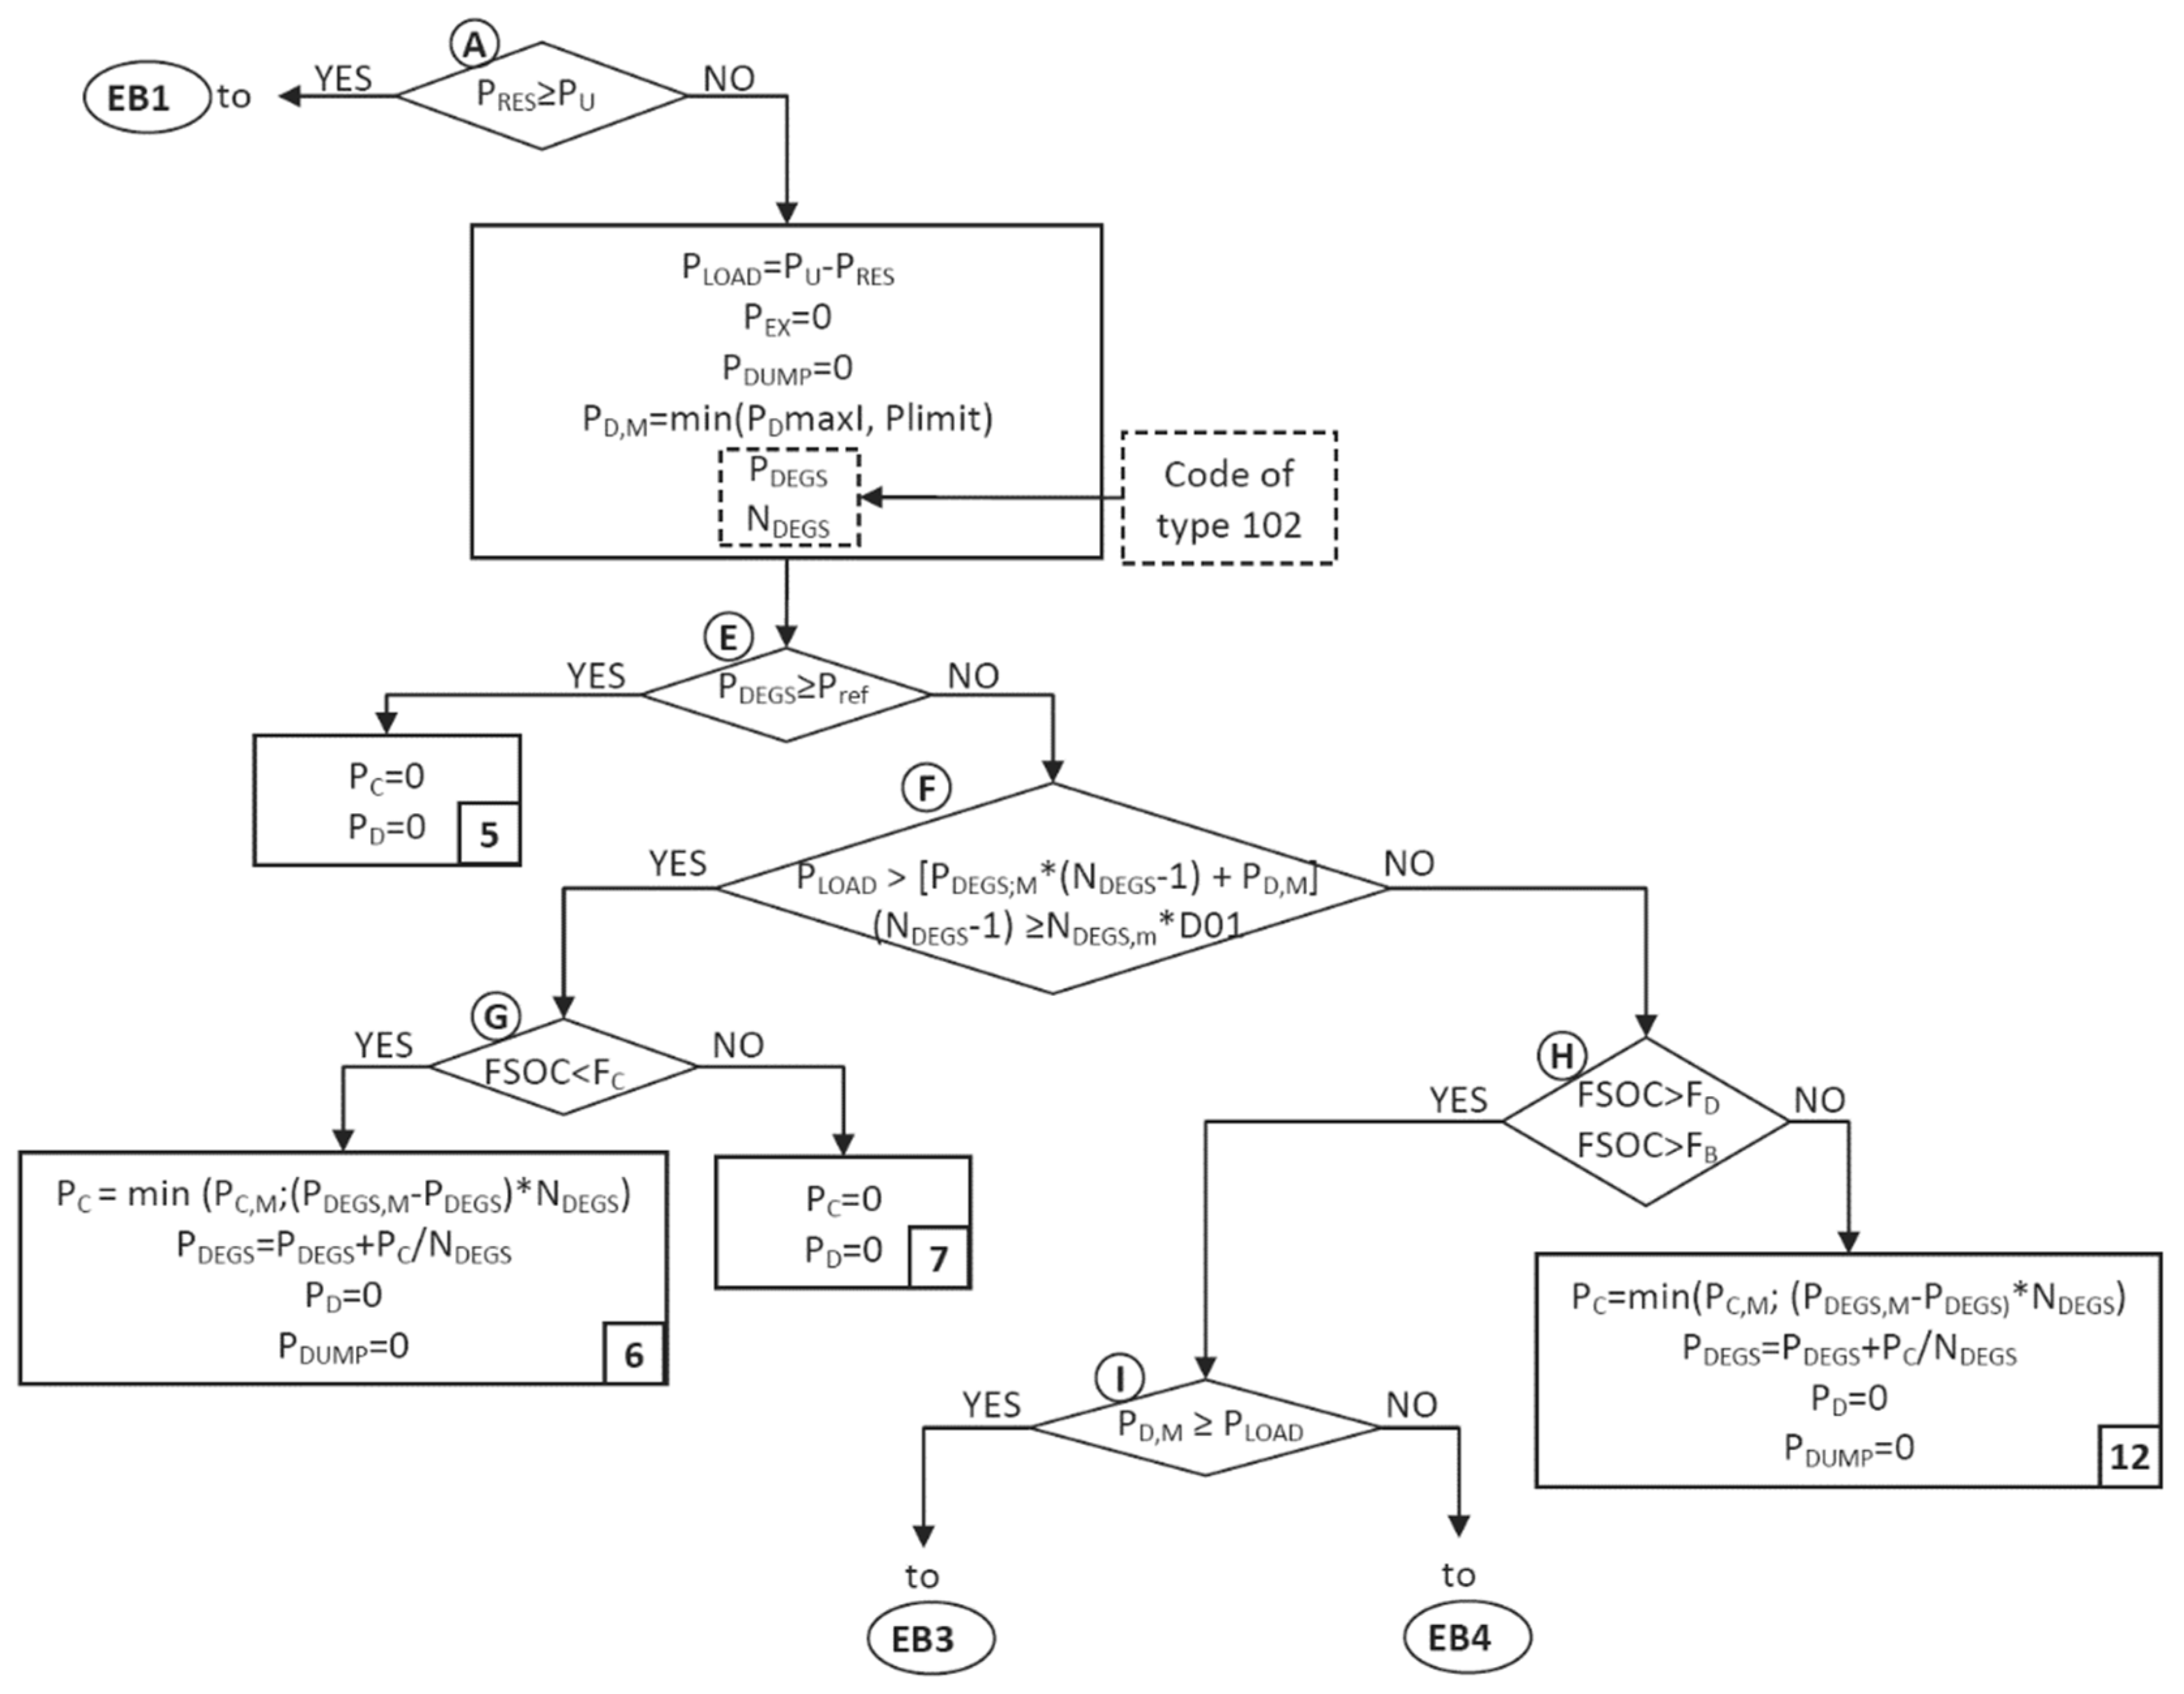
Figure 7.
Control logic flow chart—evaluation block EB3.

Figure 8.
Control logic flow chart—evaluation block EB4.
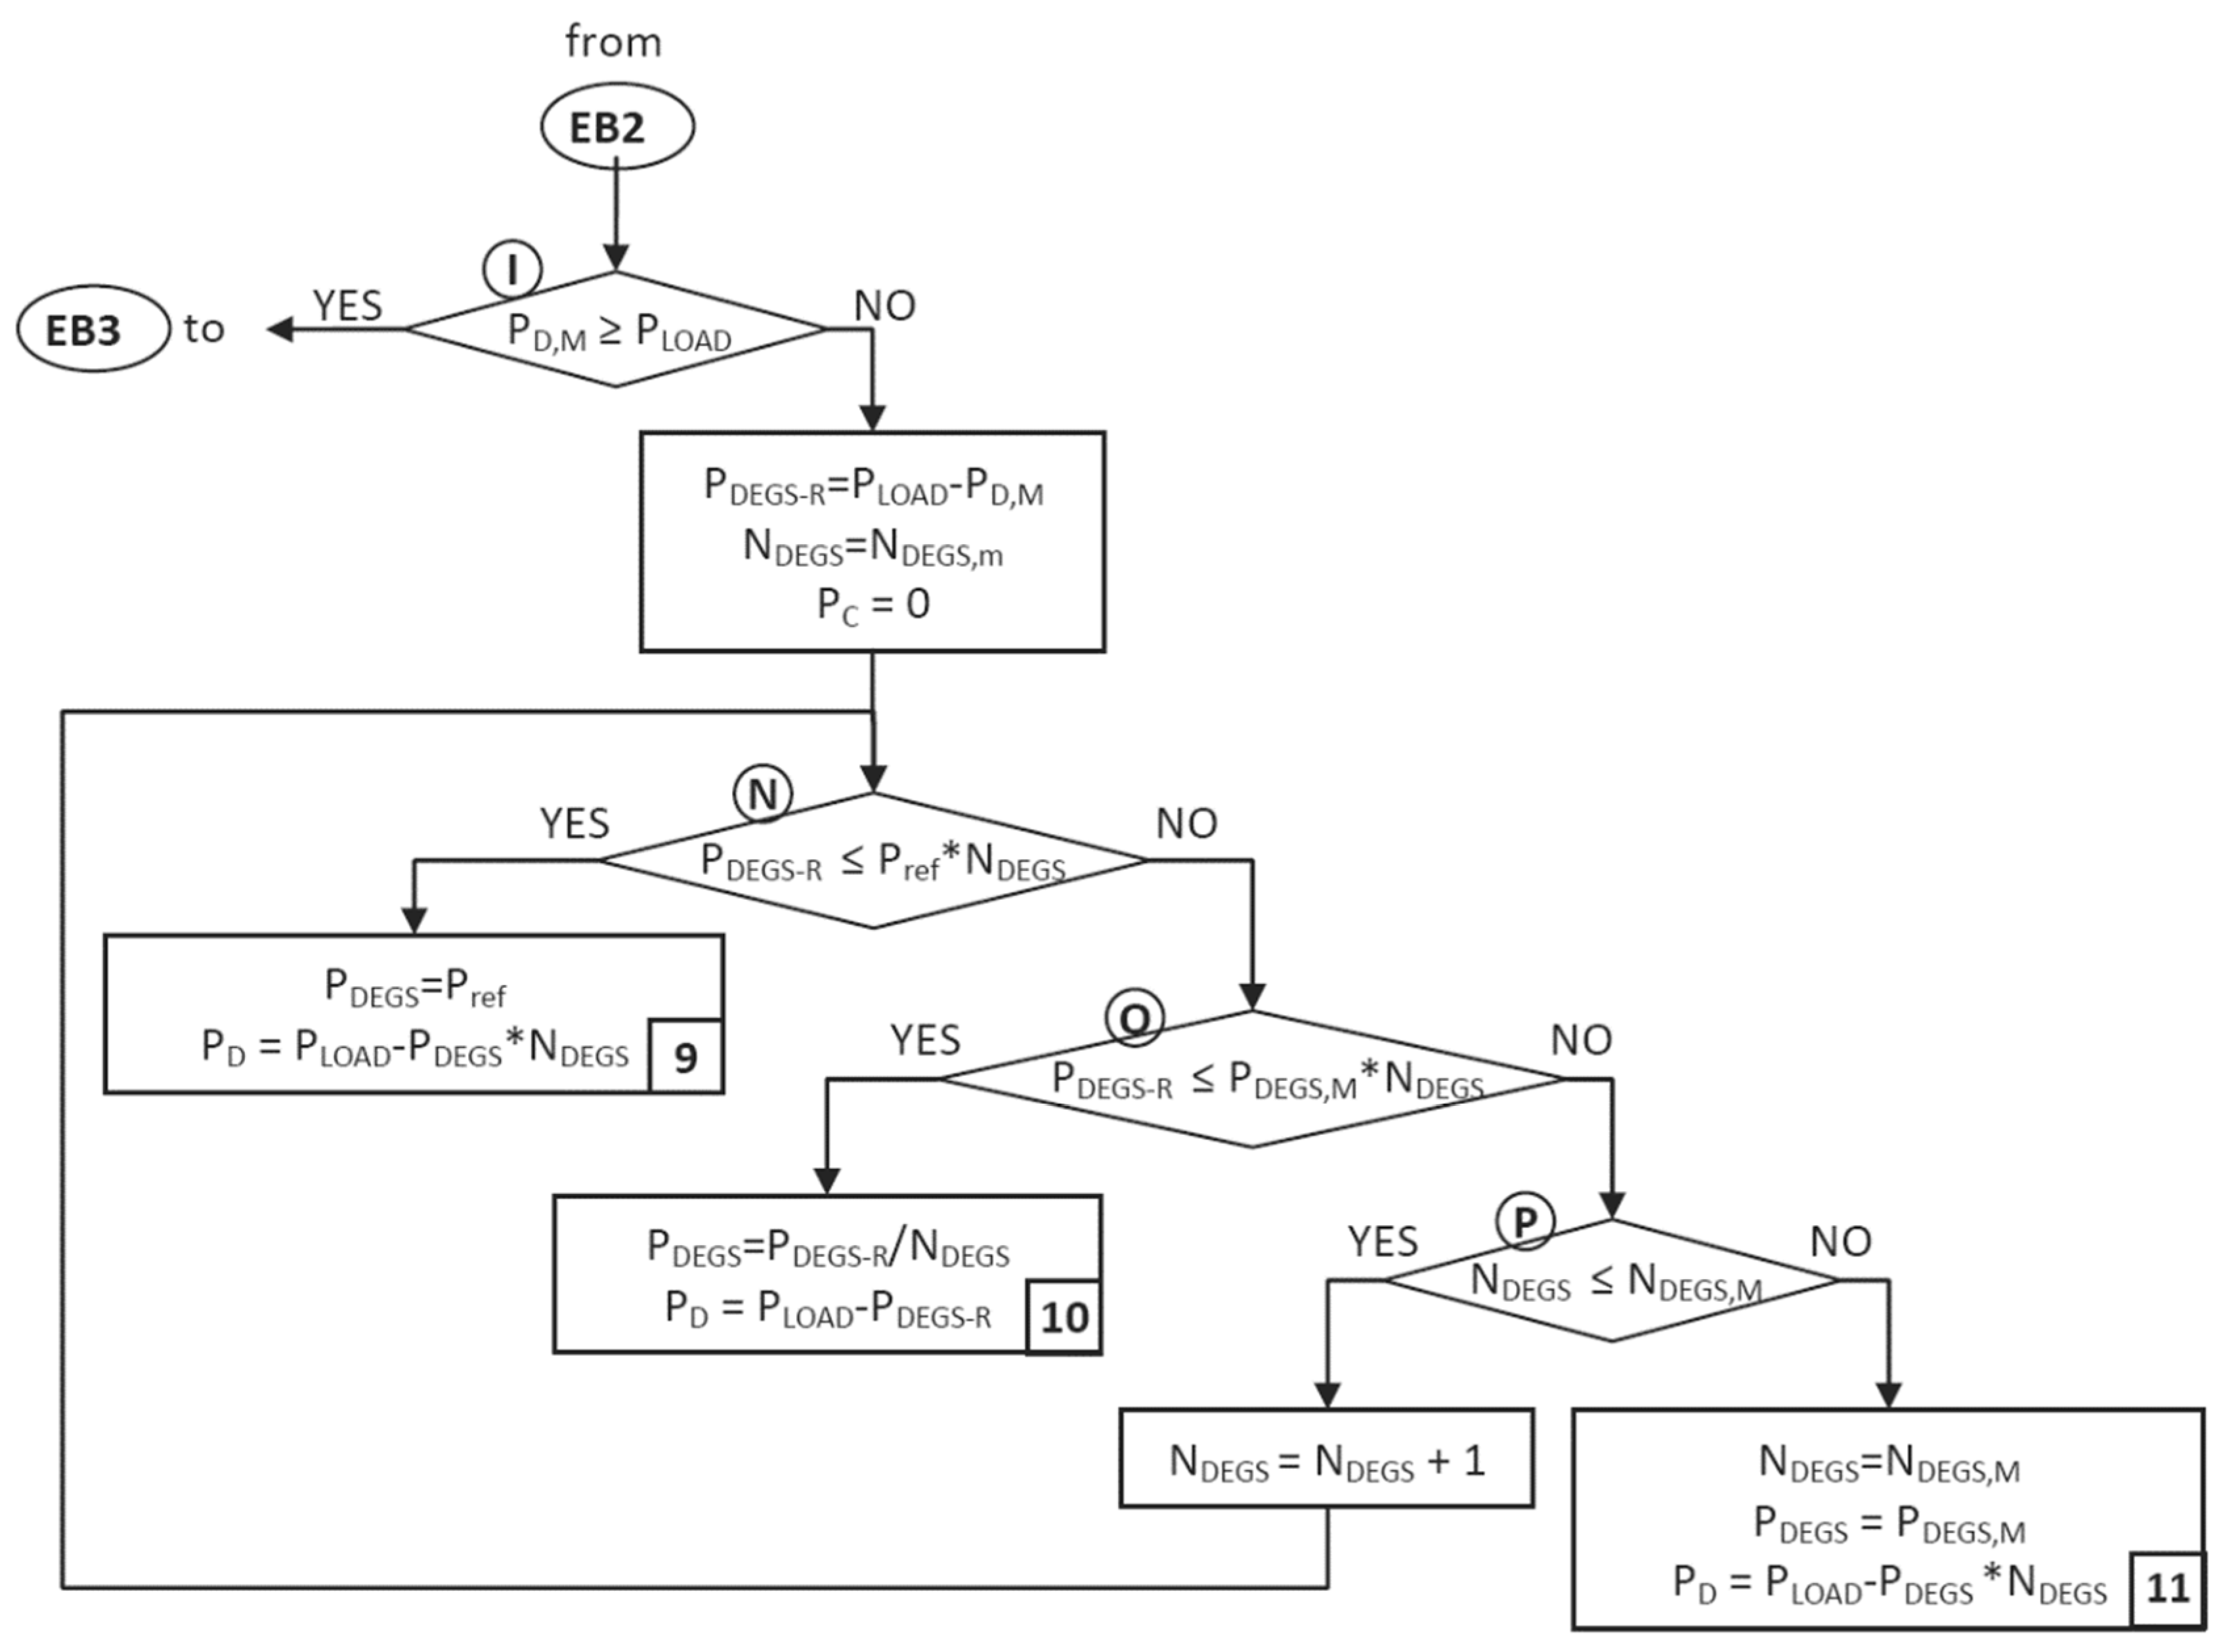
Figure 9.
Engine efficiency-power output curve.
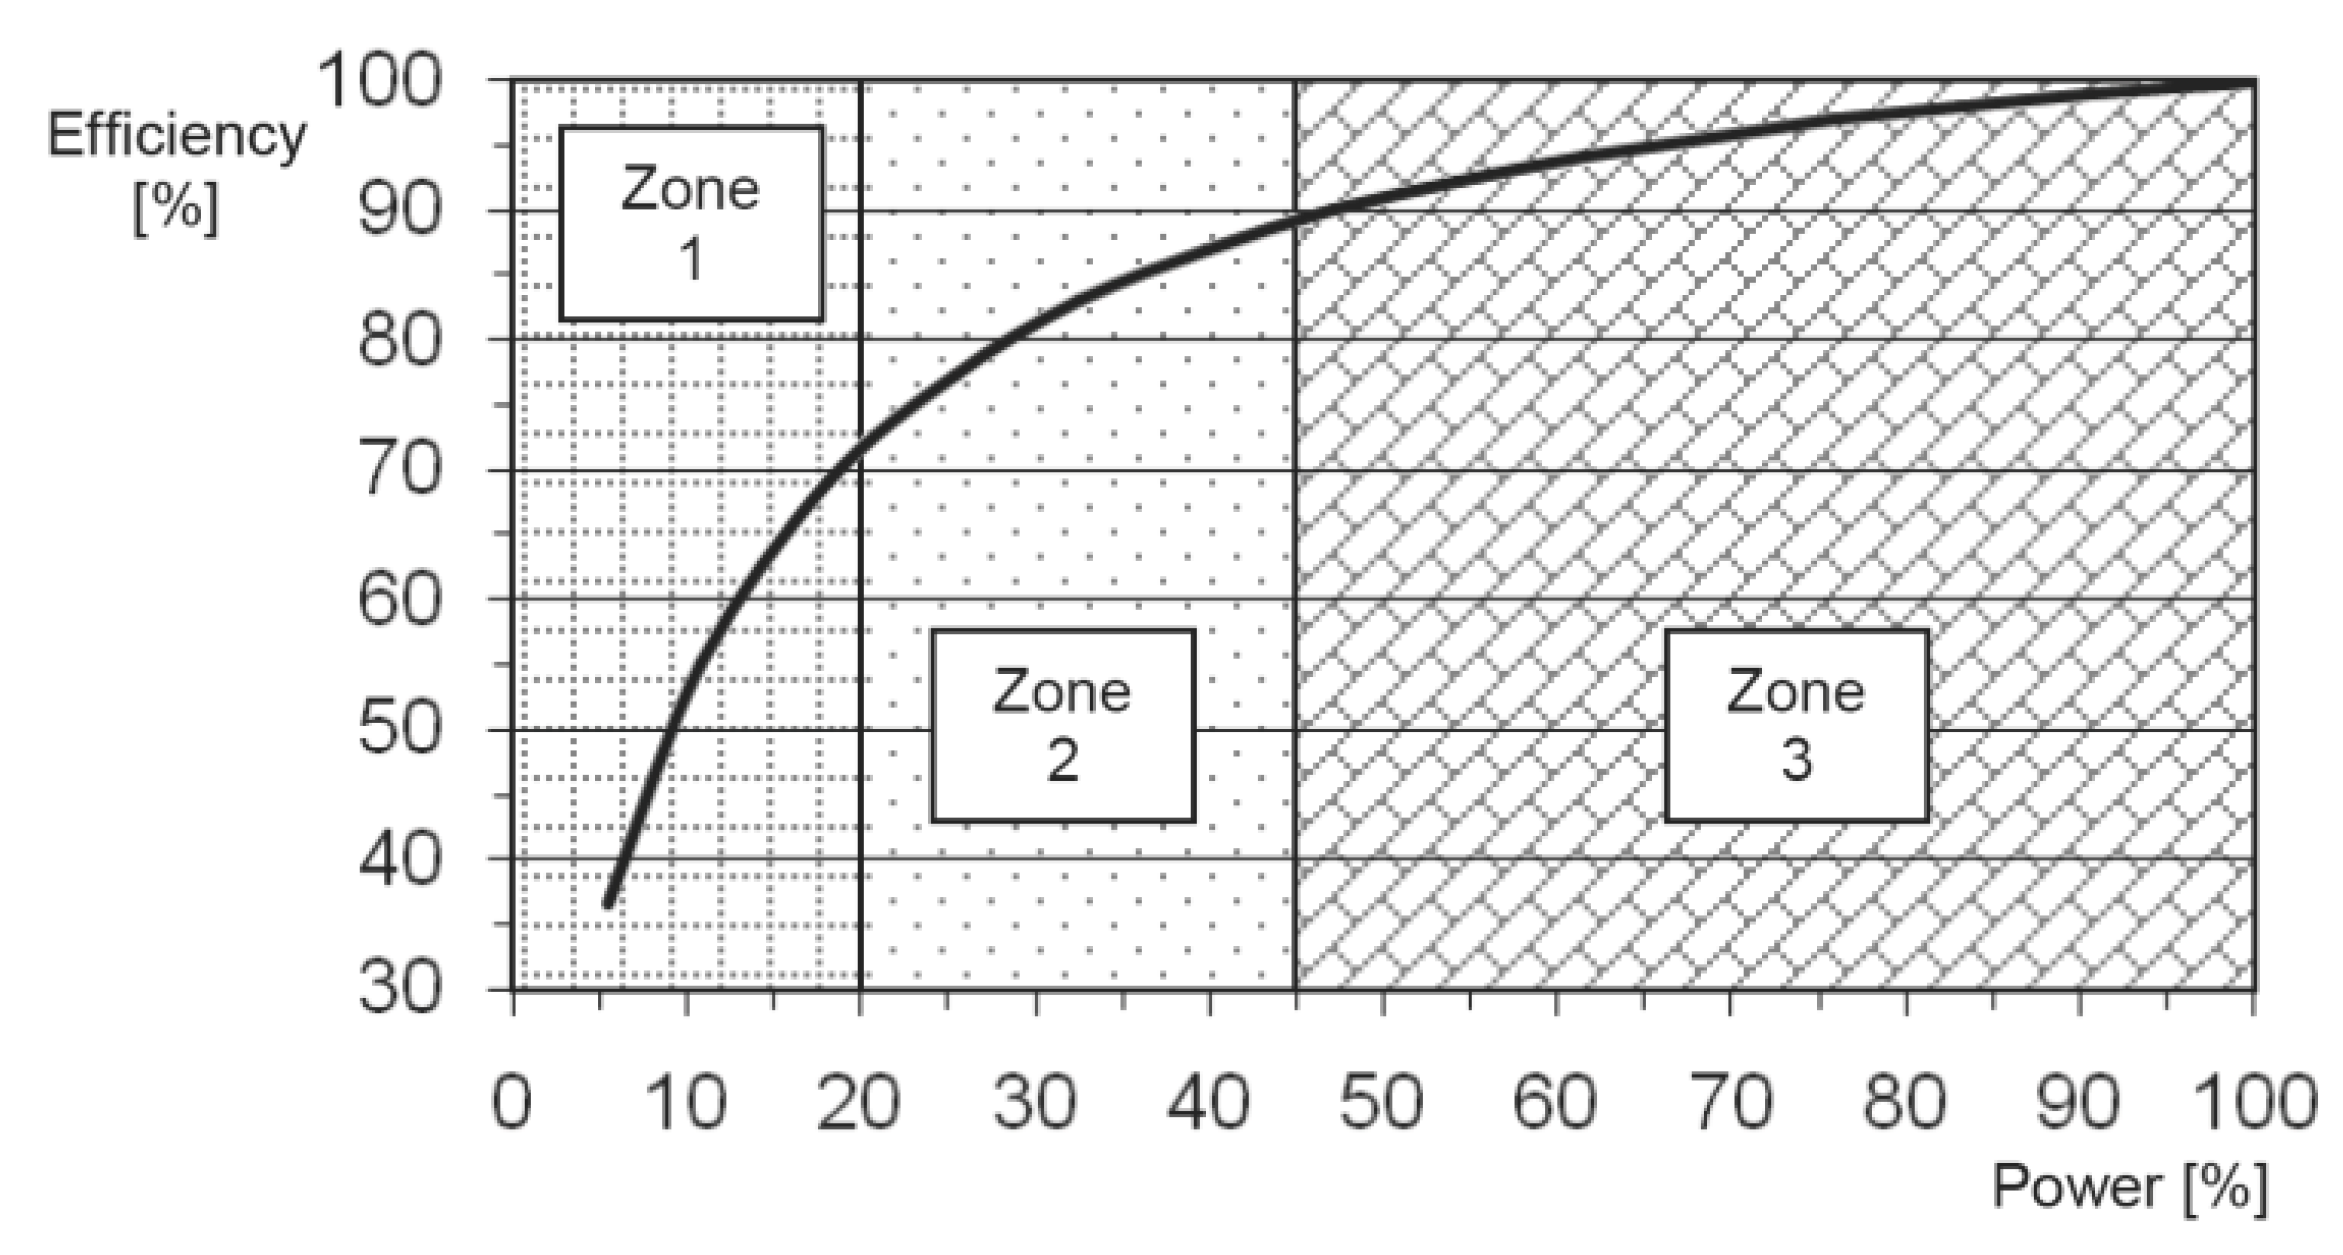
Figure 10.
Photovoltaic and wave power output.
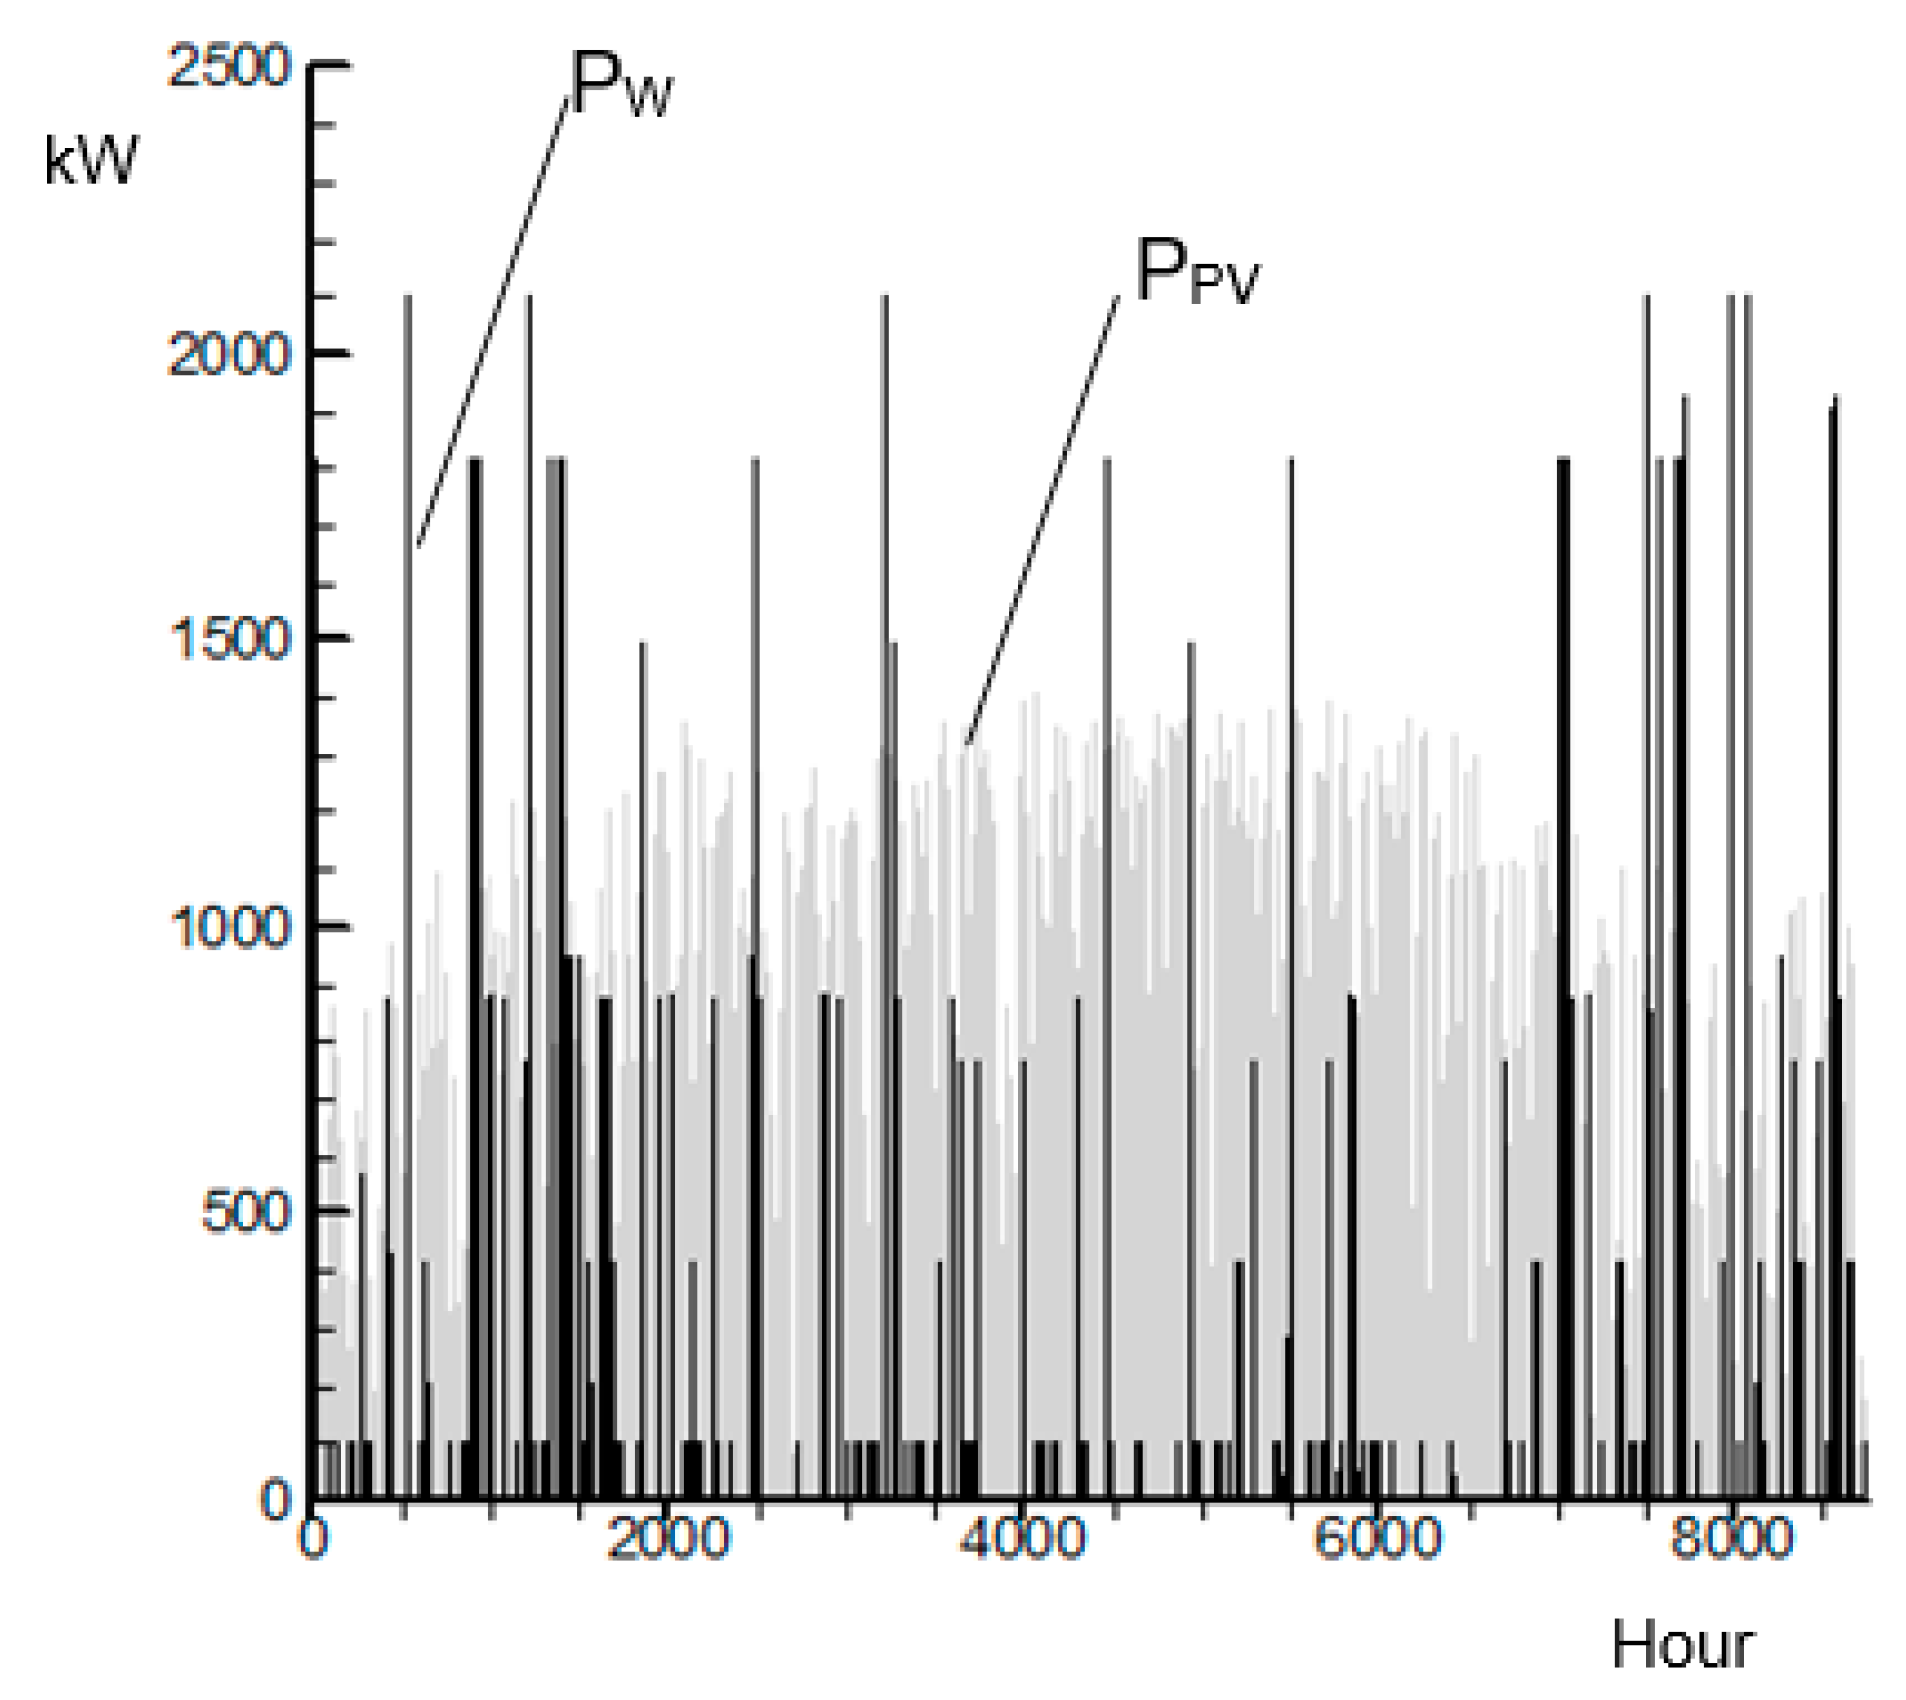
Figure 11.
Number of annual duty hours per engine.
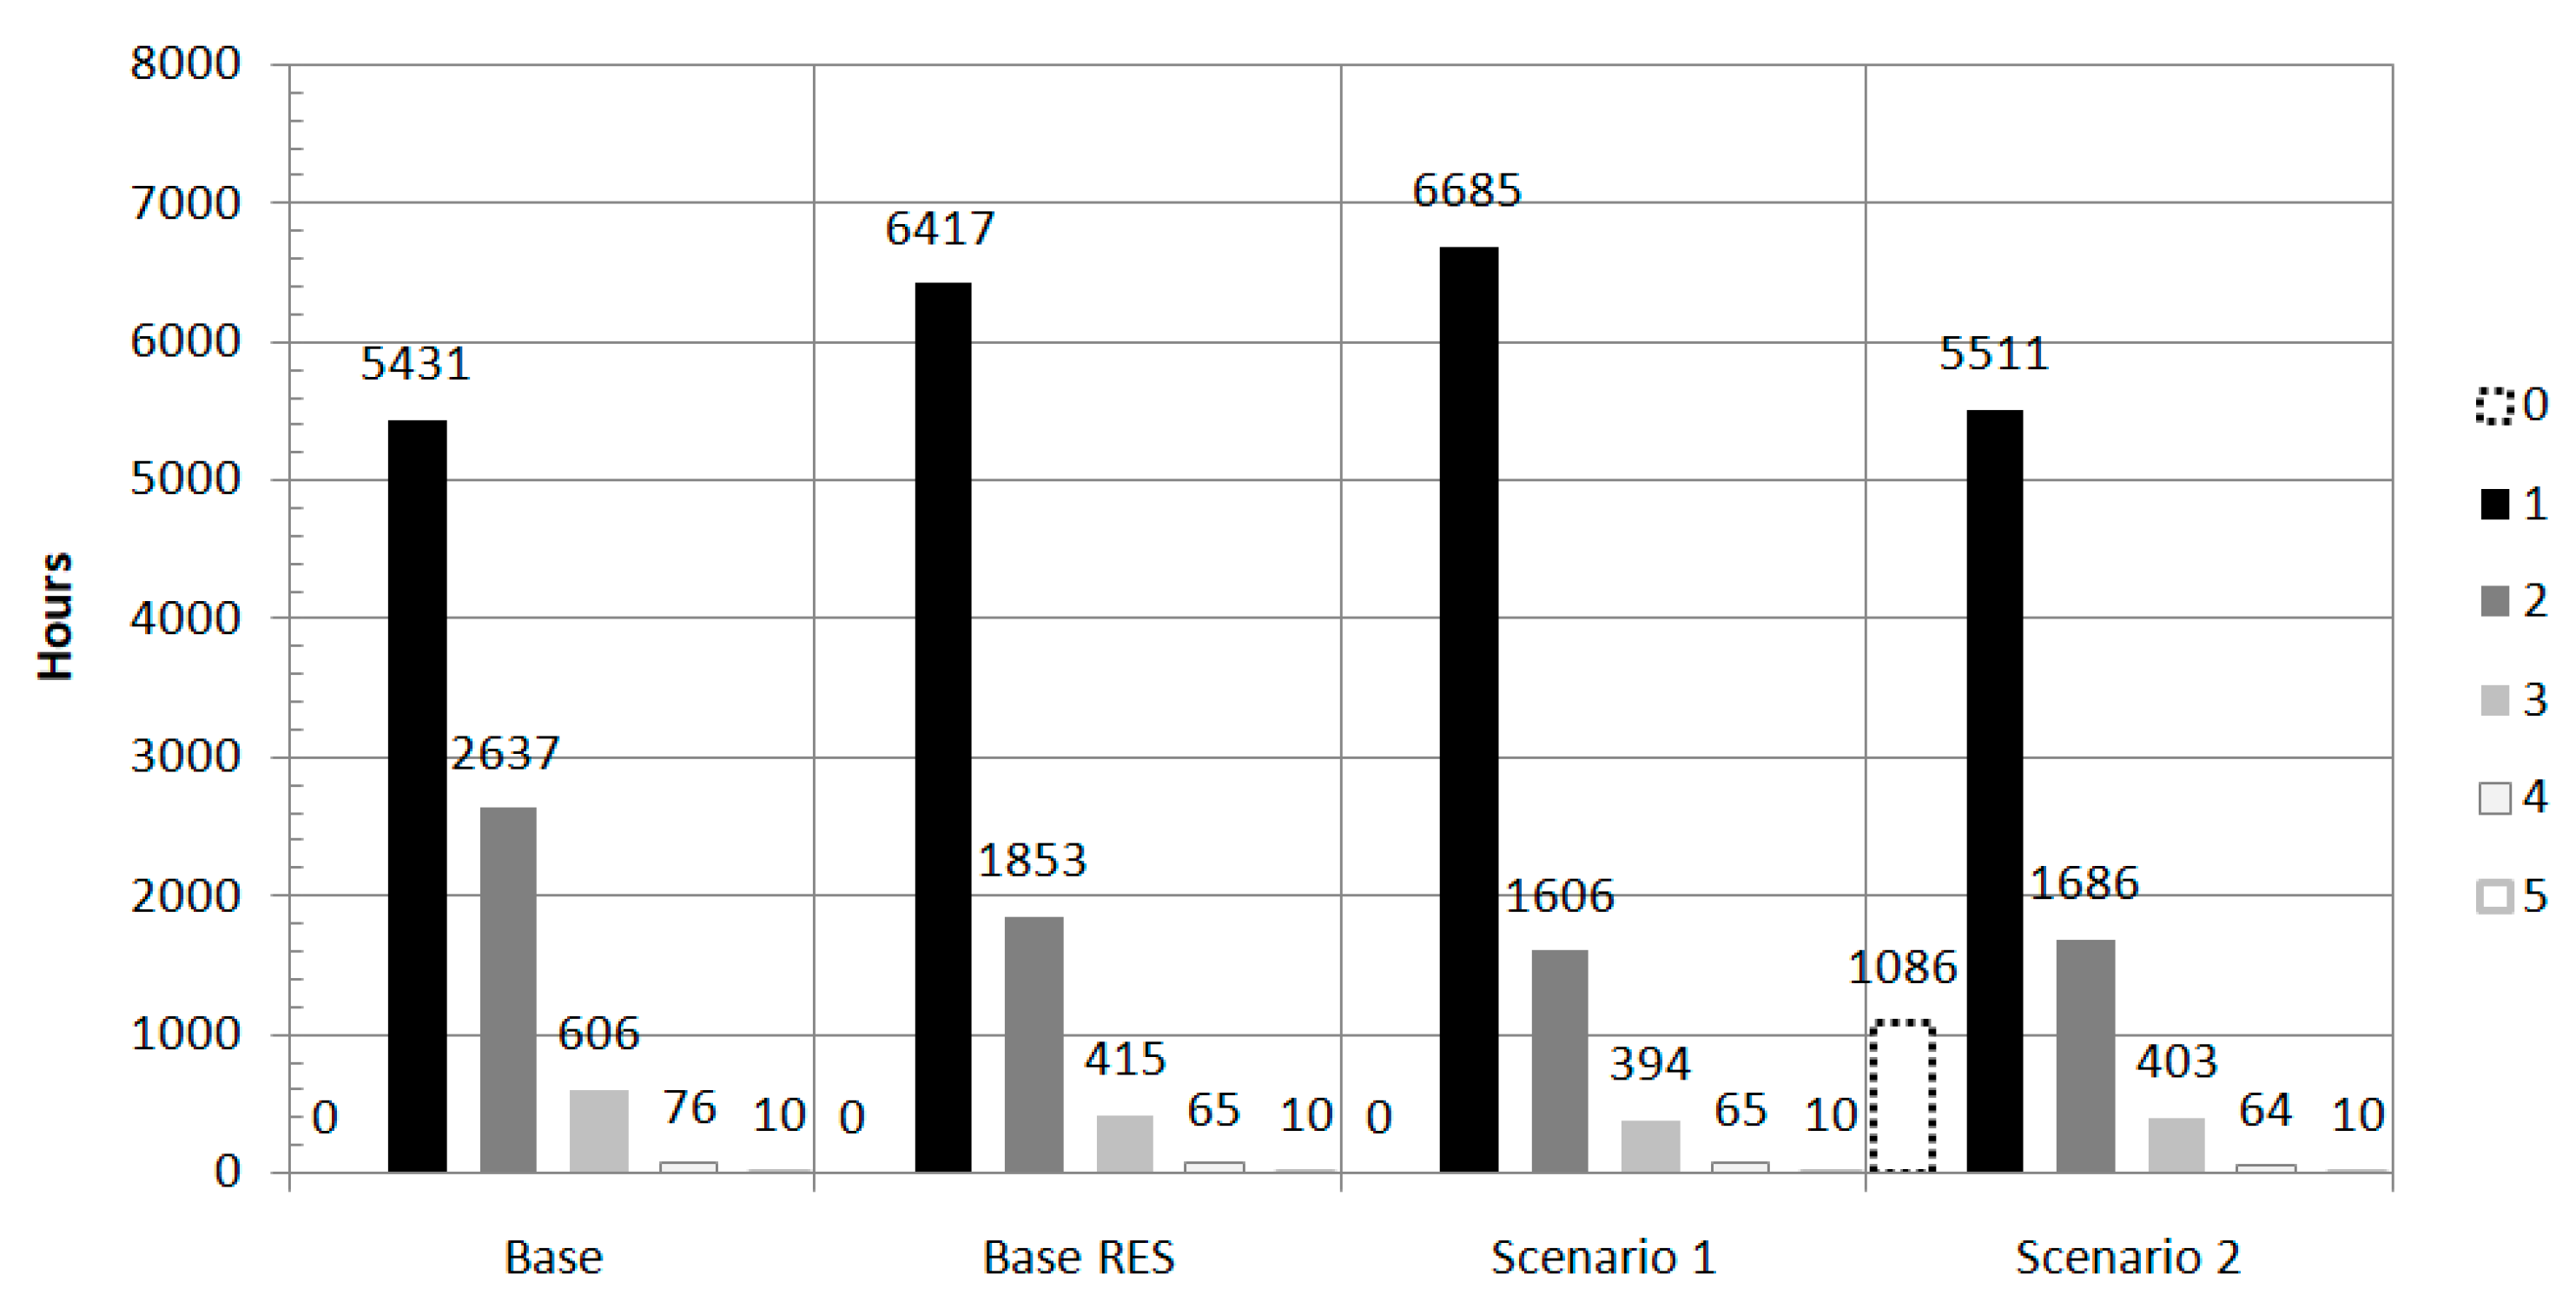
Figure 12.
Hourly based electrical efficiency of the engines for a reference year in the (a) base case; (b) renewable integrated base case; (c) scenario 1; (d) scenario 2.
Figure 12.
Hourly based electrical efficiency of the engines for a reference year in the (a) base case; (b) renewable integrated base case; (c) scenario 1; (d) scenario 2.
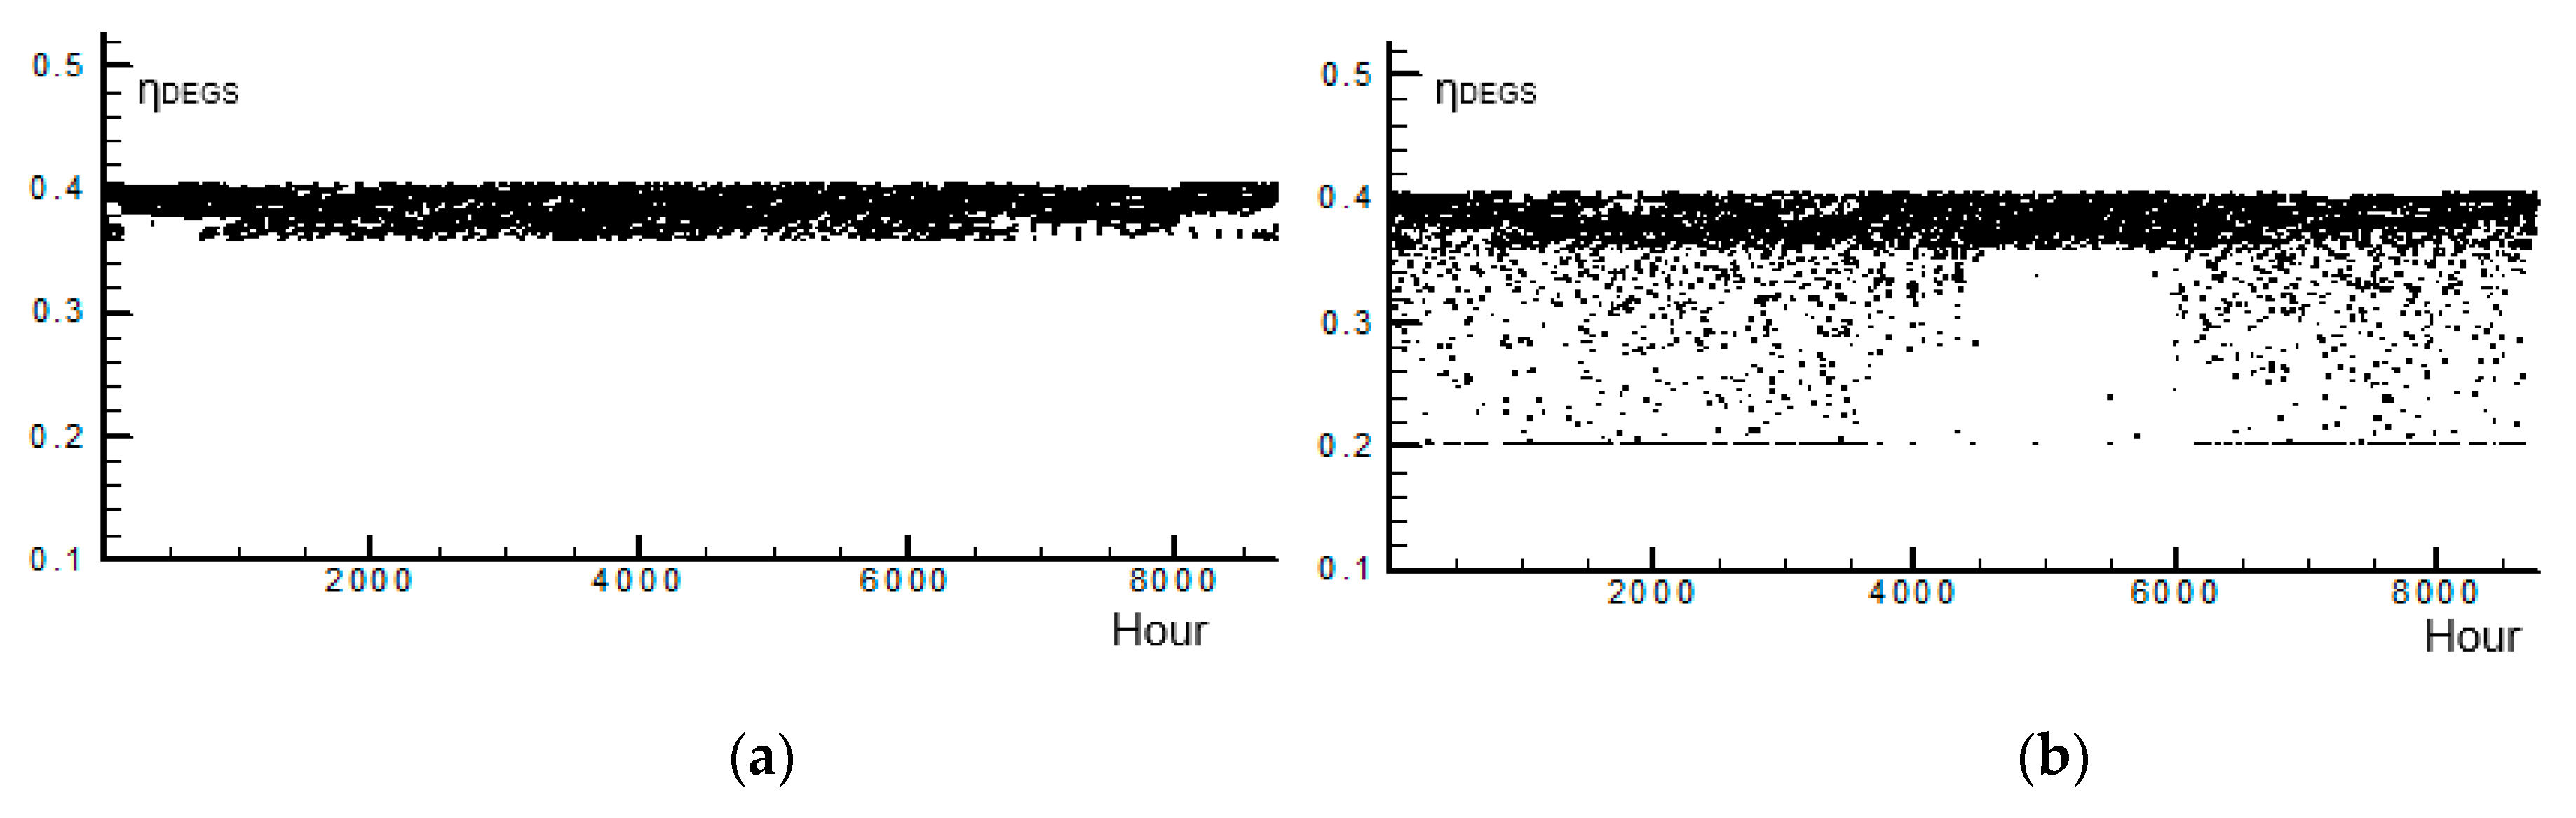
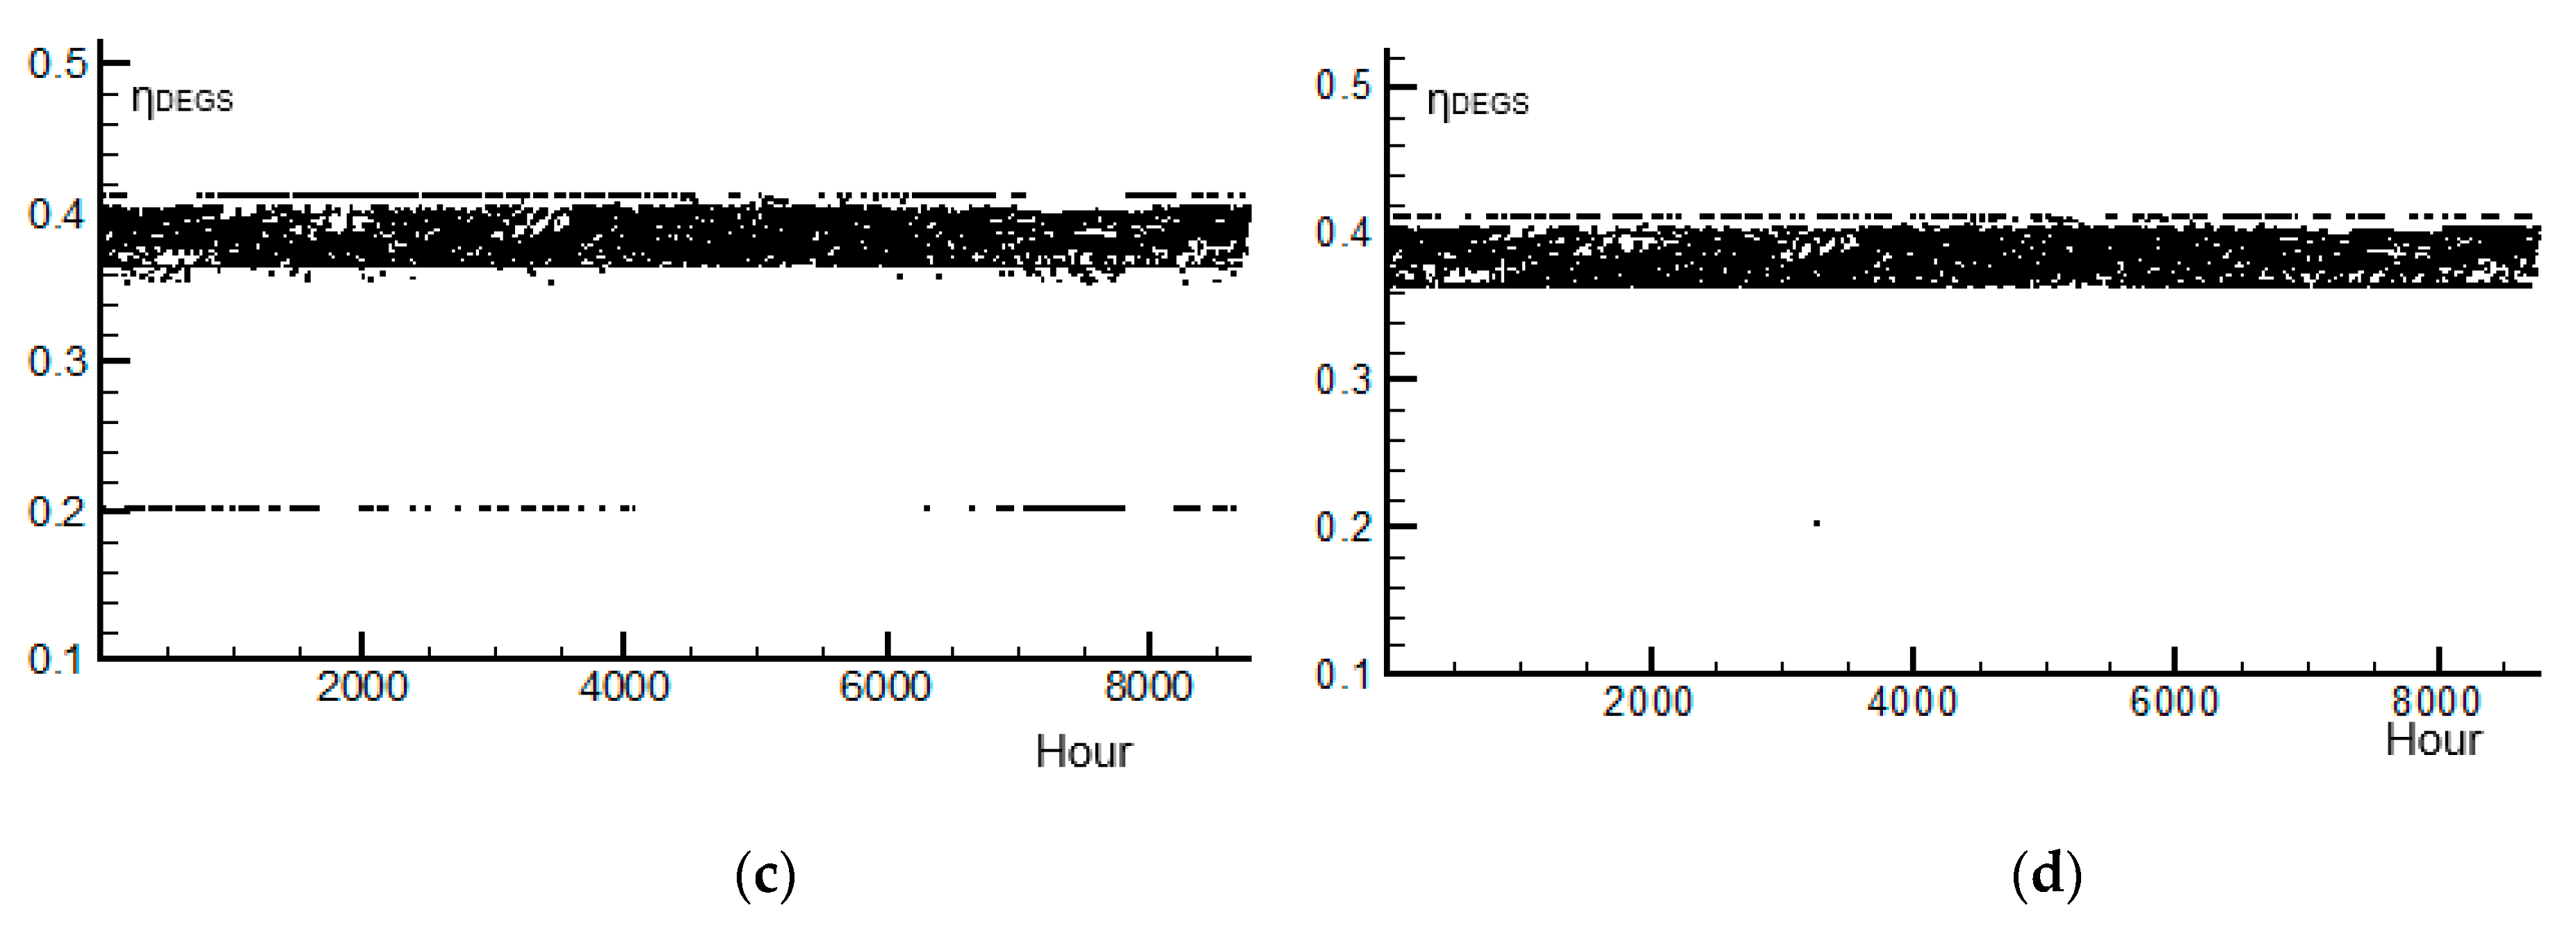
Figure 13.
Representative day behavior of (a) RES availability and generator set supplied power; (b) charge/discharge power for scenario 1; (c) charge/discharge power for scenario 2.
Figure 13.
Representative day behavior of (a) RES availability and generator set supplied power; (b) charge/discharge power for scenario 1; (c) charge/discharge power for scenario 2.

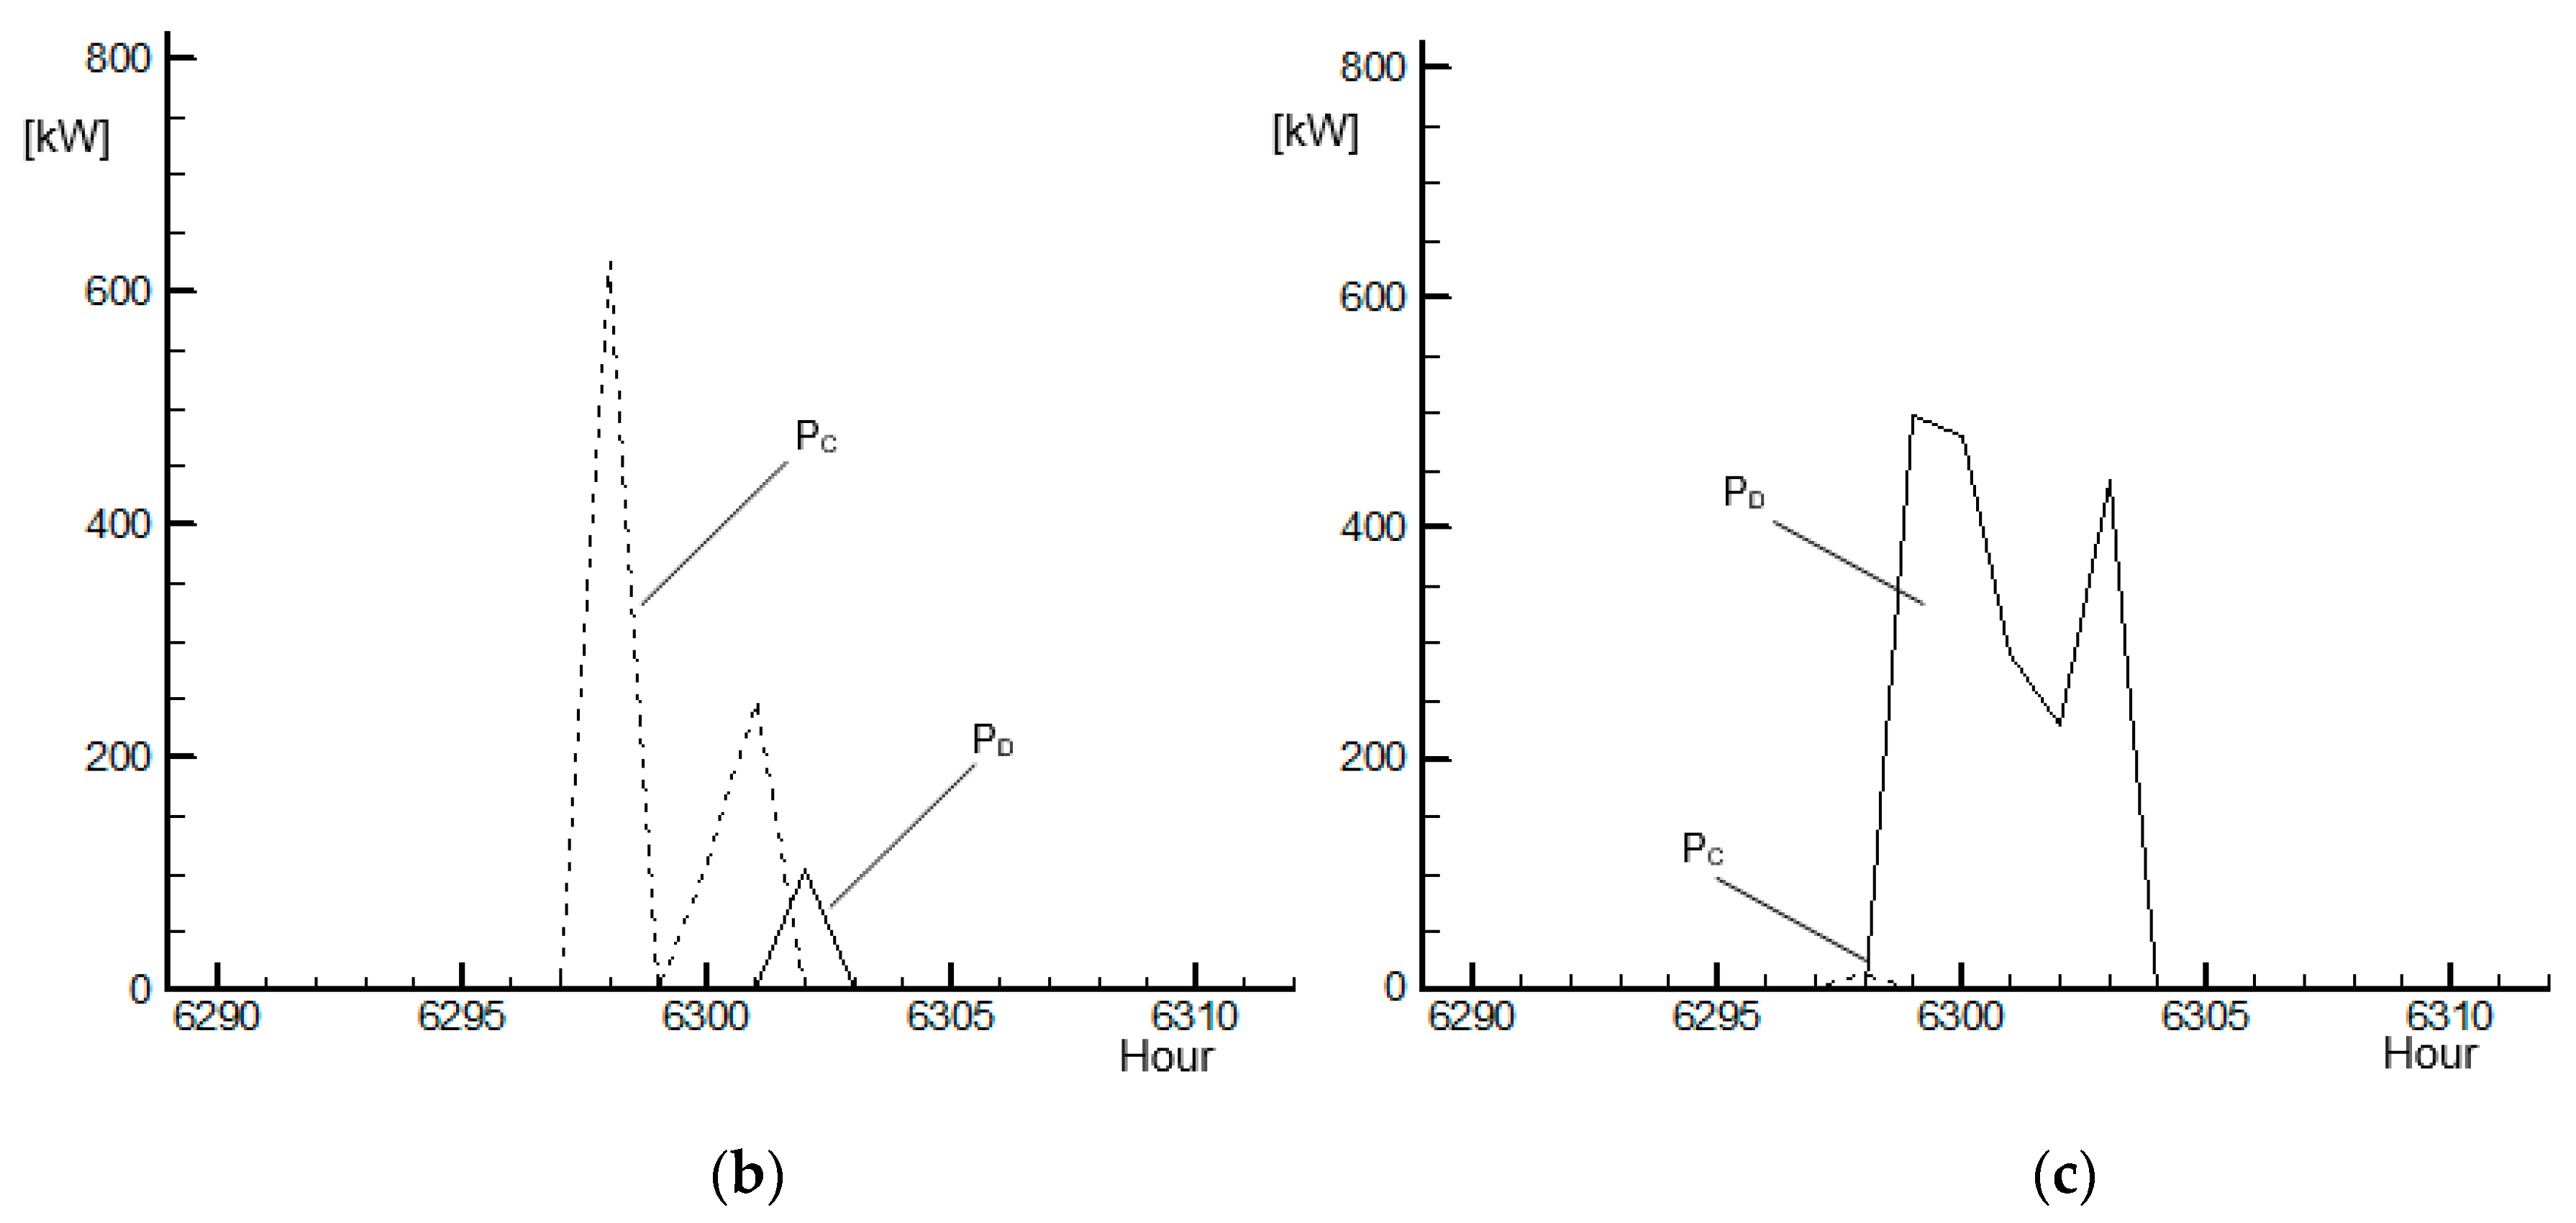
Figure 14.
Charge and discharge hourly power behavior and storage fractional state of charge for (a,c) scenario 1; (b,d) scenario 2.
Figure 14.
Charge and discharge hourly power behavior and storage fractional state of charge for (a,c) scenario 1; (b,d) scenario 2.

Table 1.
Mean climate data values.
| Month | Mean Temp. [27] | Min. Temp. [27] | Max. Temp [27] | Min Humidity [27] | Max Humidity [27] | Global Solar Radiation [28] |
|---|---|---|---|---|---|---|
| (°C) | (°C) | (°C) | (%) | (%) | (MJ/m2/d) | |
| 1 | 10.4 | 8.8 | 12.1 | 62 | 88 | 6.8 |
| 2 | 10.3 | 8.4 | 12.1 | 59 | 88 | 10.2 |
| 3 | 11.4 | 9.3 | 13.5 | 59 | 90 | 15.0 |
| 4 | 13.3 | 11.0 | 15.7 | 61 | 92 | 19.5 |
| 5 | 17.5 | 14.8 | 20.3 | 59 | 93 | 23.8 |
| 6 | 21.4 | 18.4 | 24.5 | 56 | 92 | 26.6 |
| 7 | 24.2 | 21.1 | 27.4 | 54 | 92 | 27.3 |
| 8 | 25.0 | 21.9 | 28.0 | 57 | 92 | 23.3 |
| 9 | 22.0 | 19.4 | 24.6 | 61 | 90 | 17.7 |
| 10 | 18.3 | 16.2 | 20.3 | 63 | 90 | 12.2 |
| 11 | 14.2 | 12.5 | 16.0 | 61 | 88 | 7.7 |
| 12 | 11.7 | 10.0 | 13.2 | 62 | 87 | 5.9 |
Table 2.
Diesel engine power plants’ composition.
| Main Power Plant—Provisional Plant of Monte Pagliaro | |
| DEUTZ TCD 2020 | 1.5 MW |
| DEUTZ 620 | 1.5 MW |
| DEUTZ TZ 2046 | 1.6 MW |
| Caterpillar 3516 I | 1.6 MW |
| Sub-tot | 6.2 MW |
| Peak Shaving Power Plant—Plant of Cala dell’Acqua (Le Forna) | |
| Caterpillar 3516 HD | 1.3 MW |
| Caterpillar 3516 HD | 1.3 MW |
| Sub-tot | 2.6 MW |
| Tot | 8.8 MW |
Table 3.
Description of power technologies.
| Power Technology | Units | Nominal Power |
|---|---|---|
| DEGS | Six units of 1380 kWp | 8.30 MW |
| PV array | 7018 panels of 285 Wp | 2.00 MW |
| ISWEC array | 35 units of 60 kWp | 2.10 MW |
| Battery storage | 90 modules of 6.25 kW Capacity 22.5 kWh Round trip efficiency 90% | 0.56 MW |
Table 4.
Monthly RES energy availability.
| Month | EPV | EW | ERES | EU |
|---|---|---|---|---|
| MWh | MWh | MWh | MWh | |
| 1 | 110.28 | 20.93 | 131.21 | 694.60 |
| 2 | 124.86 | 51.17 | 176.03 | 642.85 |
| 3 | 184.81 | 22.43 | 207.25 | 718.53 |
| 4 | 211.77 | 22.18 | 233.95 | 712.34 |
| 5 | 245.04 | 19.74 | 264.78 | 757.03 |
| 6 | 252.91 | 8.00 | 260.92 | 1055.88 |
| 7 | 281.57 | 7.79 | 289.35 | 1391.95 |
| 8 | 268.42 | 15.20 | 283.62 | 1710.82 |
| 9 | 222.02 | 3.29 | 225.31 | 1010.48 |
| 10 | 174.71 | 16.79 | 191.49 | 670.32 |
| 11 | 119.73 | 49.58 | 169.31 | 612.17 |
| 12 | 100.17 | 25.85 | 126.03 | 685.71 |
| Total | 2296.30 | 262.95 | 2559.26 | 10662.69 |
Table 5.
End-points occurrence for the developed and applied control system in Scenario 1 and Scenario 2.
Table 5.
End-points occurrence for the developed and applied control system in Scenario 1 and Scenario 2.
| End-Points | 1 | 2 | 3 | 4 | 5 | 6 | 7 | 80 | 81 | 82 | 83 | 9 | 10 | 11 | 12 |
|---|---|---|---|---|---|---|---|---|---|---|---|---|---|---|---|
| Scen. 1 h | 0 | 331 | 0 | 194 | 6484 | 166 | 103 | 0 | 198 | 873 | 102 | 25 | 253 | 0 | 31 |
| Scen. 2 h | 503 | 0 | 0 | 22 | 6484 | 0 | 0 | 561 | 0 | 0 | 0 | 532 | 173 | 0 | 485 |
Table 6.
Overall gen-set performance.
| Scenario | Base | Base-RES | 1 | 2 |
|---|---|---|---|---|
| Output (MWh/y) | 10,663.68 | 8326.761 | 9042.86 | 8734.78 |
| Overall duty time (h/y) | 12,877 | 11,678 | 11,389 | 10,398 |
| Mean power (kW) | 828.12 | 713.03 | 794.00 | 840.04 |
| Mean electric efficiency | 0.3842 | 0.3638 | 0.3753 | 0.3842 |
| Fuel consumption (103 L) | 2802.17 | 2242.73 | 2390.98 | 2288.36 |
| Specific fuel consumption (L/kWh) | 0.2649 | 0.2693 | 0.2644 | 0.2620 |
| Carbon Dioxide emissions (tCO2eq/y) | 8530.91 | 6772.17 | 7219.84 | 6909.96 |
Table 7.
Average power per number of active engines.
| Active Engines | 1 | 2 | 3 | 4 | 5 |
|---|---|---|---|---|---|
| Base | 899.50 | 761.72 | 810.94 | 809.02 | 818.90 |
| Base RES | 681.71 | 724.66 | 802.96 | 816.62 | 818.90 |
| Scenario 1 | 801.90 | 755.32 | 839.16 | 850.24 | 862.67 |
| Scenario 2 | 869.72 | 786.19 | 849.50 | 846.36 | 862.67 |
Table 8.
Monthly energy performance of the storage.
| Month | Scenario 1 | Scenario 2 | ||||
|---|---|---|---|---|---|---|
| EC | ED | EDump | EC | ED | EDump | |
| MWh | MWh | MWh | MWh | MWh | MWh | |
| 1 | 7.55 | 13.70 | 8.58 | 34.25 | 14.75 | 0.49 |
| 2 | 22.72 | 16.16 | 17.52 | 51.11 | 15.36 | 13.18 |
| 3 | 28.90 | 18.92 | 5.16 | 66.08 | 26.42 | 0.00 |
| 4 | 19.10 | 11.14 | 1.86 | 57.87 | 20.96 | 4.65 |
| 5 | 22.97 | 15.90 | 9.29 | 55.93 | 29.43 | 0.00 |
| 6 | 30.62 | 18.50 | 0.00 | 46.13 | 22.62 | 0.00 |
| 7 | 13.45 | 12.03 | 0.00 | 42.13 | 5.46 | 0.00 |
| 8 | 31.88 | 2.14 | 0.00 | 32.47 | 3.61 | 0.00 |
| 9 | 33.54 | 22.15 | 0.00 | 77.56 | 12.39 | 0.00 |
| 10 | 10.82 | 12.94 | 11.73 | 55.09 | 18.21 | 2.79 |
| 11 | 0.00 | 7.57 | 27.32 | 54.78 | 15.00 | 12.49 |
| 12 | 9.66 | 6.49 | 10.80 | 38.69 | 14.81 | 3.10 |
| Total | 231.20 | 157.65 | 92.27 | 612.09 | 199.03 | 36.70 |
© 2019 by the authors. Licensee MDPI, Basel, Switzerland. This article is an open access article distributed under the terms and conditions of the Creative Commons Attribution (CC BY) license (http://creativecommons.org/licenses/by/4.0/).
Share and Cite
MDPI and ACS Style
Corsini, A.; Cedola, L.; Lucchetta, F.; Tortora, E. Gen-Set Control in Stand-Alone/RES Integrated Power Systems. Energies 2019, 12, 3353. https://doi.org/10.3390/en12173353
AMA Style
Corsini A, Cedola L, Lucchetta F, Tortora E. Gen-Set Control in Stand-Alone/RES Integrated Power Systems. Energies. 2019; 12(17):3353. https://doi.org/10.3390/en12173353
Chicago/Turabian StyleCorsini, Alessandro, Luca Cedola, Francesca Lucchetta, and Eileen Tortora. 2019. "Gen-Set Control in Stand-Alone/RES Integrated Power Systems" Energies 12, no. 17: 3353. https://doi.org/10.3390/en12173353
Note that from the first issue of 2016, this journal uses article numbers instead of page numbers. See further details here.