Article

Characterization and Analysis of Malaysian Macroalgae Biomass as Potential Feedstock for Bio-Oil Production

by
Mei Yin Ong
1,
Nor-Insyirah Syahira Abdul Latif
1,
Hui Yi Leong
2,
Bello Salman
1,
Pau Loke Show
2,* and
Saifuddin Nomanbhay
1,*
1
Institute of Sustainable Energy, Universiti Tenaga Nasional, Jalan Ikram-UNITEN, 43000 Kajang, Selangor, Malaysia
2
Department of Chemical and Environmental Engineering, Faculty of Science and Engineering, University of Nottingham Malaysia, Jalan Broga, 43500 Semenyih, Selangor Darul Ehsan, Malaysia
*
Authors to whom correspondence should be addressed.
Energies 2019, 12(18), 3509; https://doi.org/10.3390/en12183509
Submission received: 28 June 2019 / Revised: 29 July 2019 / Accepted: 29 July 2019 / Published: 12 September 2019
(This article belongs to the Special Issue Algal Biotechnology)

Abstract

:
The potential of Caulerpa lentillifera, Gracilaria coronopifolia and Chaetomorpha linum, as biomass feedstock was investigated in this study. It was concluded that seaweed is more suitable for bio-based products synthesis, i.e., bioplastic and bio-lubricants, instead of biofuels due to its relatively low calorific value (~12 MJ/kg). Since seaweed has high moisture content (~80%), hydrothermal liquefaction is recommended, and its efficiency can be further enhanced through microwave technology. Besides, it is found that the thermal degradation of seaweed was best described with the reaction order of 1. The kinetic results also indicated that seaweed consists of lower activation energy (<30 kJ/mol) in comparison with terrestrial biomass (50–170 kJ/mol). Hence, seaweed has a high potential to be used as biomass feedstock, particularly Chaetomorpha linum, as it has no conflict with other interests. Lastly, acetic-acid pre-treatment was suggested to be an optional process in order to increase the algal conversion efficiency as it can reduce up to 25% of ash content.

Graphical Abstract

1. Introduction

Biomass is considered as one of the most favourable renewable resources to produce biofuels, i.e., a clean, sustainable and renewable alternative energy source. It is reported by Renewable Fuel Standard (RFS) of United States that by the year of 2022, 36 billion gallons of renewable fuels will be blended with petroleum-based fuels [1]. Algal biomass is one of the reliable biomasses for renewable resources, with a high growth rate and high carbon dioxide (CO2) fixation. Hence, algal biomass is considered to have a greater potential compared with terrestrial lignocellulosic biomass, specifically for biofuels production. Hence, algae biomass are described as the most suitable feedstocks for next-generation biofuels production and chemicals synthesis [2,3]. Generally, algae are categorised into two types, which are microalgae and macroalgae. It has been renowned that microalgae are widely used in the production of biofuels as they have high lipid contents. Thermochemical conversion of microalgae has also been broadly explored, including direct combustion, pyrolysis, direct liquefaction, hydrothermal liquefaction and gasification [4]. Microalgae have relatively gained more attention in the research field. However, macroalgae also have indisputable potential to be developed and improved for bio-based substance production [2]. Nevertheless, there is still a lack of research works related to the conversion of these low-lipid algae, especially macroalgae (usually called seaweed) into crude bio-oil production. Besides that, there are huge macroalgae resources in Malaysia due to its strategic coastal location and tropical weather, and hence, Malaysia has the potential to become one of the leading countries in seaweed cultivation. In Malaysia, Sabah, or more specifically Semporna, is the major seaweed production area. The development of seaweed production has been enhanced from time to time, and eventually, seaweed has become an important natural resource for Malaysia in term of economic development [2]. Hence, the algae supply in Malaysia is reliable and remains to have a huge potential for utilisation.
Thermochemical processing of algae involves complicated physicochemical processes. It is important to gain understanding of the solid-state decomposition kinetics of the feedstock to provide insight into the mechanism of these heterogeneous reactions, which is normally investigated by performing thermogravimetric analysis (TGA) [5]. TGA is one of the most prevailing practices for preliminary estimation of the pyrolysis behaviour of biomass feedstock, which is chemically complex as it involves simultaneous chemical reaction processes. TGA comprises two main categories, which are the isothermal and non-isothermal processes. In past decades, the non-isothermal method has been more extensive and widely implemented compared to the isothermal method due to the high sensitivity to experimental noise [6]. There is a large number of studies adopting different approaches to describe the thermal degradation using non-isothermal TGA [7]. Non-isothermal TGA is essential for analysing the kinetics of pyrolysis at lower heating rates. Besides, through the non-isothermal TGA at a temperature up to 900 °C, the kinetics of biomass devolatilization and its physical and chemical properties as a function of temperature can be determined. The kinetic parameters, including apparent activation energy and pre-exponential factor, can be calculated via TGA using the characteristic parameters extrapolated from the thermogravimetric (TG) and differential thermogravimetric (DTG) curves obtained [8]. There are several mathematical approaches that have been used to determine the kinetic parameters, such as Coats & Redfern, Freeman–Carroll, Ozawa-Flynn-Wall, Kissinger, Kissinger-Akahira-Sunose, and Friedman model [9]. The solid-state decomposition of kinetic study provides essential information on the behaviour of biomass and the mechanism of heterogeneous reaction in thermochemical processes. Several researchers have studied the thermal degradation behaviour of different biomass materials under different conditions [10,11].
To the authors’ best knowledge, there is a lack of information in exploring the potential of seaweed as biomass feedstock, especially to produce bio-oil and other bio-based materials. Another reason seaweed is selected as the studied biomass feedstock is because of the high potential of seaweed production in Malaysia, especially in the east of Malaysia (Sabah). As mentioned previously, due to the tropical weather in Malaysia, Malaysia has provided a suitable living environment for various kinds of algal species. Hence, Malaysia has huge algae resources and should be continuously discovered [2]. In this paper, the potentiality of macroalgae/seaweed (Caulerpa lentillifera, Gracilaria coronopifolia, and Chaetomorpha linum) to be used as renewable biomass feedstock was investigated. Thermogravimetric analysis (TGA) was used to analyse the thermal behaviour of these macroalgae at a temperature range between room temperature and 500 °C with three different heating rates (10 °C/min, 20 °C/min and 30 °C/min) under nitrogen atmosphere. Based on the TGA results, the kinetic parameters were then determined according to the Coat-Redfern method [12]. Besides, the elemental analysis for Carbon, Hydrogen, Nitrogen, Oxygen, and Sulphur (CHNOS) was conducted to identify the elemental composition of the sample biomass [13], and then its calorific value was calculated using modified Dulong’s equation [14,15]. Moreover, proximate analysis, ultimate analysis, and Fourier transform infrared (FTIR) spectroscopy analysis were also conducted for further seaweed characterization.

2. Materials and Methods

2.1. Biomass Feedstocks

The algae biomass feedstocks Caulerpa lentillifera, Gracilaria coronopifolia and Chaetomorpha linum used in this study, were obtained from the Institute International Aquaculture & Aquatic Sciences, Universiti Putra Malaysia (I-AQUAS UPM), Port Dickson, Malaysia. The algae were harvested at Blue Lagoon, Port Dickson (63.8804° N, 22.4495° W) between November 2018 to January 2019. Then, the algae were grown under pure culture technique at this institute and were provided through the courtesy of the I-AQUAS UPM for this work.
i.
Caulerpa lentillifera is one of the species used for food production. Hence, it will cause slight competition in the food industry. This species is one of the major species that has been grown and produced in Sabah.
ii.
Gracilaria coronopifolia is another established species which is categorised under red algae species. It is a tough species that can withstand various condition.
iii.
Chaetomorpha linum is a general species which can also be cultivated in a reef tank. This species is normally used in aquariums and has not been used for food or another pharmateutical benefit. Chaetomorpha have a considerably high growth rate. The cultivation of Chaetomorpha species also has the potential to give a continuous supply without competing with the other industry of seaweed.

2.2. Elemental Analysis and Calorific Value Determination

The elemental composition (Carbon, Hydrogen, Nitrogen, Oxygen, and Sulphur) of each algae biomass sample was determined using a TruSpec-Micro CHNS/O elemental analyser (Leco). The Carbon, Hydrogen, Nitrogen & Sulphur (CHNS) concentration were determined by undergoing complete combustion, and the combustion gases including CO2, H2O, N2 and SO2, were measured. For the determination of the Oxygen (O) composition percentage, however, the sample underwent instant pyrolysis. Once the composition percentage of C, H, N, O, and S was determined, the calorific value for each sample was calculated using a modified Dulong equation. The similar modified Dulong equation has been used by Refs. [14,15] for the determination of HHV for seaweed, which is represented as below:
H C V = ( 34.1 × C + 102   × H + 6.3   × N + 19.1   × S 9.85   × O ) / 100   MJ / kg

2.3. Thermogravimetric Analysis (TGA) of Algal Biomass

Thermogravimetric experiments were conducted on a thermogravimetric analyser (Perkin Elmer, Pyris Diamond model). Approximately 20 mg of algal biomass sample was placed in an alumina crucible in each experiment. Pure nitrogen (purity of 99.99%), with a flow rate of 80 mL min−1, was used as carrier gas during all the experiments to extinguish the mass transfer effect to a minimum level. Each macroalgae sample was heated from room temperature (~27 °C) to 500 °C at three different heating rates: 10 °C/min, 20 °C/min and 30 °C/min. After each test of the heating rate, a separate blank run was conducted for baseline correction, using an empty pan. Lastly, the weight loss relative to the temperature increment was automatically recorded, and its thermogram (TG) and derivative thermogram (DTG) were then plotted.

2.4. Kinetic Model

By assuming pressure has no consequential effect on the kinetics, the thermal conversion rate of the algae biomass sample is defined as:
d α dt = k ( T ) ( 1 α ) n
where n is the reaction order, α indicates the fractional weight loss (see Equation (3)) and k(T) represents the reaction rate constant (see Equation (4)).
α = m i m o m i m f
where mi, mo and mf are the initial mass, the current mass at time ‘t’, and the final mass of the algae biomass sample, respectively.
k ( T ) = A e E R T
where A symbolizes the pre-exponential factor (min−1). On the other hand, E indicates the activation energy of the decomposition reaction (kJ/mol), R is the universal gas constant (8.314 J/mol·K) and T is the absolute temperature with a unit of K.
By substituting Equation (4) into Equation (2), the kinetic/Arrhenius equation for the sample degradation is described as below:
d α d t = A e E R T ( 1 α ) n
For the non-isothermal case (at a constant heating rate, β), the above equation can be further modified to:
d α d T = d T d t = A e E R T ( 1 α ) n
As β = d T d t , the final kinetic equation in the non-isothermal TG experiments is
d α d T = A β e E R T ( 1 α ) n
Currently, there are numerous techniques available to calculate the kinetic parameters, including activation energy (E), pre-exponential factor (A) and order of reaction (n) for the thermal conversion of the samples [9,16]. These kinetic triplets can be determined by solving Equation (7) analytically and then applying mathematical approximation for the exponential term.
In this study, Coats and Redfern model was applied to determine the kinetic parameters for the main thermal degradation stage of the algae biomass sample. In this model, Equation (7) was rearranged, integrated and finally expressed as:
ln   [ 1 ( 1 α ) 1 n T 2 ( 1 n ) ] =   [ ( A R β E ) ( 1 2 R T E ) ] [ E R T ] ,   for   n 1
ln   [ ln ( 1 α ) T 2 ]   =   [ ( A R β E ) ( 1 2 R T E ) ] [ E R T ] ,   for   n = 1
Then, the Y against X plotting was produced for different reaction order (n), where
Y = ln { 1 ( 1 α ) 1 n T 2 ( 1 n ) }   a n d   X = 1 T ,   f o r   n 1
Y = ln { ln ( 1 α ) T 2 }   a n d   X = 1 T ,   f o r   n = 1
Among the plotting, the regression line with the highest R2 value was chosen as the suitable reaction order value [16,17]. By assuming   2 R T E a 1 , ln   [ ( A R β E ) ( 1 2 R T E ) ] ln   A R β E . Hence, the activation energy can be calculated from the slope, E R of the graph, and the pre-exponential factor, A, can be determined from the Y-intercept value, ln A R β E a .

2.5. Spectroscopic Analysis by Fourier Transform Infrared Spectroscopy (FTIR)

For spectroscopic analysis, the algae biomass sample was analysed using FTIR KBr (Potassium bromide) pellet method via Shimadzu IRPrestige-21 Fourier Transform Infrared Spectroscopy. The algae sample was first dried at 80 °C for 24 h. Then, the dried sample was grounded and sieved into a particle size of <200 µm. Next, the KBr pellet (act as control) and the sample pellet, in a ratio of 1:100 (sample: KBr) were prepared. After that, the sample pellet was measured in the frequency range of 4000–600 cm−1 for 100 scans at a resolution of 4 cm−1. The spectrums obtained were further baseline corrected for ease of comparison. Three runs were conducted for every sample, and the average results were reported.

2.6. Demineralization/Ash Content Determination by Proximate Analysis

The determination of ash content is based on the ASTM D2974-87 method [18] using proximate analysis. The algae were first pre-treated with 1% and 2% concentration of acetic acid. Then, an appropriate amount of the sample (untreated and acid-treated algae) in a tared porcelain crucible was weighed and recorded. The crucible with the sample was then placed in a preheated oven at 105 °C and its weight was recorded for every hour until it became constant. The moisture content was then calculated using Equation (10). Next, the oven-dried sample was placed in a preheated muffle furnace at 550 °C for about 12 h. The crucible was then taken out from the furnace, allowed to cool slightly, and then placed into a desiccator and left to cool to room temperature. The final weight of the sample obtained in this experiment was considered as ash content, which can be determined using Equation (11) and expressed on dry basis.
M o i s t u r e   c o n t e n t   % = ( B C )   × 100 B
A s h   c o n t e n t   % = D   × 100 C
where B and C represent the mass (g) of the “as-received” and oven-dried test specimen respectively. D, however, is the final mass (g) of the sample which remained in the crucible at the end of this proximate analysis.

3. Results and Discussion

3.1. Physiochemical Properties of Algae Biomass

The calorific value of a biomass sample normally represents a significant aspect for evaluating the biomass potential as a fuel. Table 1 presents the results of the elemental analysis of the algae biomass samples.
In comparison with other renewable biomass feedstocks and conventional fossil fuel, the calorific value of the seaweed (this study) is amongst the lowest. Overall, the calorific value of the biomass is lower than that of fossil fuel. In other words, much less energy (per same mass) is produced using renewable biomass feedstock in comparison to fossil fuel. However, there are advantages of biomass over fossil fuel, which are its sustainability and lower level of CO2 emissions. From previous studies, it can be observed that macroalgae/seaweed have the smallest calorific value among some of the biomass feedstocks including palm oil residue [19], sugarcane trash [20], rice husk [21], coffee husk [22], bamboo [23] and wood [24]. This might be due to the lower carbon content in the seaweed (marine biomass) as compared to the terrestrial plant biomass. There were also several studies on the conversion of macroalgae into bio-oil. The studies showed a comparable average heat value and elemental composition in this study, which then suggests that the macroalgae present as a good bio-oil feedstock applicant [25,26]. In terms of bio-oil yields, several studies show that macro gave a comparable percentage of bio-oil yields which is in the range of 40–50% [26,27]. Hence, it is not a good candidate for direct combustion, such as co-firing in the thermal power plant. Nevertheless, it could be suitable as feedstock for the production of a bio-based substance, like bio-polymer.
Besides that, seaweed usually consists of relatively high moisture content (~80%) and an average specific heat capacity of 1.5 kJ/(kg·K) [28]. Hence, almost 2000 kJ of energy is required to remove the moisture content in 1 kg of seaweed biomass. This eventually decreases its utilization efficiency as the energy input is increased to dry the biomass. So, the results suggested that the best technique to convert algae biomass are the wet techniques, such as the hydrothermal liquefaction (HTL) method. Moreover, it is recommended that a further increase of HTL efficiency can be done through the implementation of microwave green processing technology. Microwave is well known due to its ability to dramatically reduce the reaction time, decrease the energy consumption, provide volumetric heating and produce higher quality yield [29,30]. In the HTL method, the presence of water is an essential criterion. Similarly, water plays an important role in microwave processing technology since it has high microwave absorbability [30,31].

3.2. Thermogravimetric Analysis (TGA) of Algae Biomass

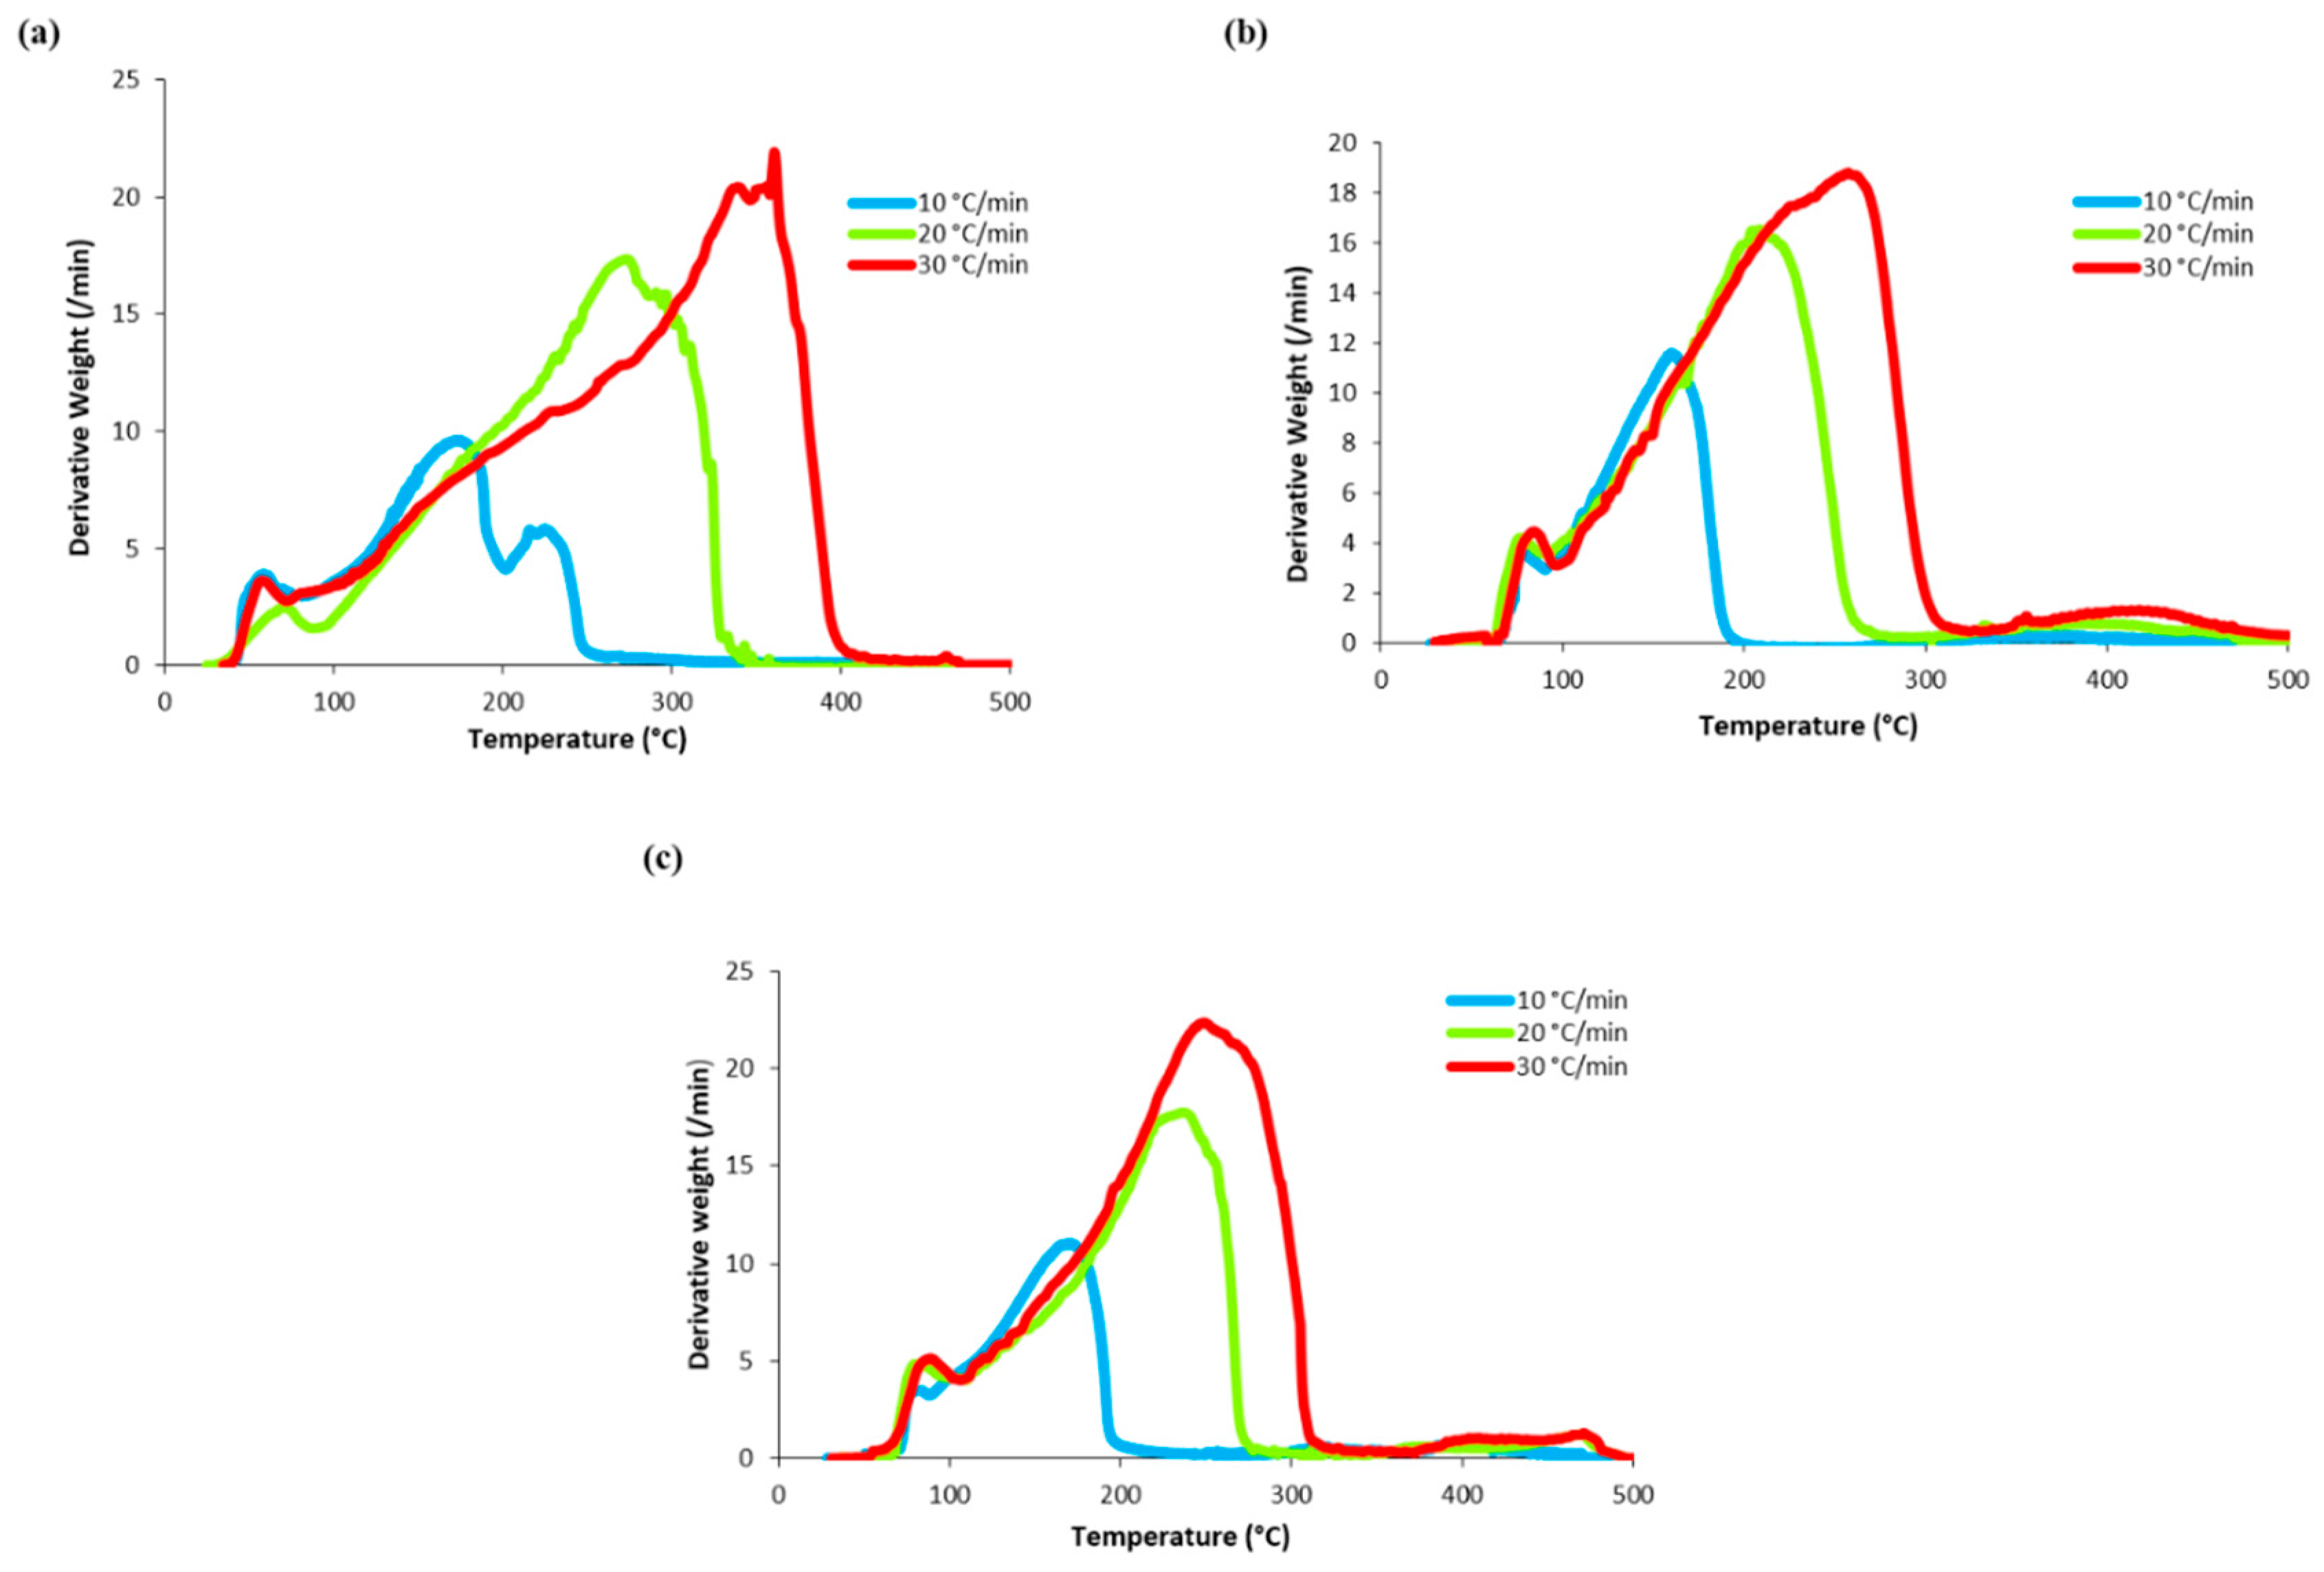
In this study, three species of seaweed have been used as a feedstock. The effect of heating rate on the thermal behaviour of three different seaweed samples was investigated using TGA. Three different heating rates of 10, 20 and 30 °C/min were implemented during this investigation. TGA and DTG thermograms of Caulerpa lentillifera, Gracilaria coronopifolia, and Chaetomorpha linum are shown in Figure 1 and Figure 2, respectively.
The TG graphs (Figure 1a–c) show the relation between the temperature and the weight percentage of the sample along with the process. From the DTG graph (Figure 2a–c), however, the thermal decomposition can be effectively differentiated, and the individual mass change steps can also be clearly identified. For this analysis, the experiment has been conducted up to 800 °C. However, the graphs were only plotted up to 500 °C, because the weight of the samples was constant after this point. Besides, the error bar was eliminated in the thermogram since negligible experimental deviations were observed.
Based on the results, the thermal degradation of three algae samples happened in a two-step reaction. At the first stage, there was a weight loss from 70 °C up to ~100 °C, which can be explained by the evaporation of the water content in the sample [32] or some light volatile matters [33,34]. The second stage, however, took place from ~100 °C to a temperature up to 400 °C. At this stage, a major weight loss, resulting from the main degradation process, was noticed. This loss is ascribed to the decomposition and/or depolymerization of the algae organic constituents, such as carbohydrates, protein, and lipids. The mass loss of algae between the ranges of 180–270 °C is attributed to the decomposition of carbohydrate, while the degradation of proteins takes place between 320–450 °C [11].
Moreover, it is observed that the increase in the heating rate has shifted the decomposition of volatiles to the marginally higher temperature, based on the thermogram. A similar pattern has been reported in the literature [35,36], and this lateral shift was substantially due to the limitations of heat transfer at higher heating rates. At the higher heating rate, the reaction time became shorter and hence, the higher temperature was needed for the volatiles evolution from the biomass samples, whereas at a low heating rate, longer residence time along with larger instantaneous energy was available for the volatiles to evolve from biomass [37].

3.3. Kinetic Analysis of Algal Biomass

Thermogravimetric analysis (TGA) is an ordinary technique used to assess the thermal degradation behaviour of biomass. As mentioned in Section 3.2, the thermal degradation of algae biomass sample involves two stages. It is concluded that the first stage degradation is the process of water evaporation, while the second stage involves the major thermal decomposition of volatile components, such as carbohydrates and protein. Hence, the kinetic study on the second stage was performed, and the Coat & Redfern kinetic model was used to determine the kinetic parameters, such as activation energy and pre-exponential factor, for this major degradation stage. A summary of kinetic results with the linear regression (R2 and slope) for the major thermal decomposition of algal biomass samples is presented in Table 2.
Based on Table 2, it can be observed that the kinetic parameters were affected by the heating rates. The variation of activation energy and pre-exponential factor showed similar trends for all biomass samples. The activation energy decreases as the heating rate increases. However, the data of activation energy for Caulerpa lentillifera slightly deviates from the trend, which might be due to some experimental error. In contrast, the pre-exponential factor increases along with the heating rate. Furthermore, it can also be concluded that the thermal degradation of the algae biomass is a first-order reaction (n = 1) as the coefficient of determination, R2, for three heating rates are higher than 0.95 and the values are nearest to 1. Hence, this indicates that the thermal degradation of algae biomass is a first-order reaction according to Coat and Redfern method. So, the data from the first order using Coat Redfern methods give the most acceptable value for kinetic parameters determination. The Coat Redfern plots for the first order (n = 1) are shown in Figure 3.
In addition, Table 3 presents the comparison of kinetic parameters between macroalgae and other biomass feedstocks. The activation energy of the macroalgae determined in the current work ranges between 15–30 kJ/mol. Besides, it is found that the macroalgae have the lowest activation energy as compared to terrestrial biomass feedstock. Theoretically, if the molecules in the reactants collide with adequate kinetic energy and this energy is larger than the transition state energy, then the reaction occurs and products form. In other words, the lower the activation energy, the easier the reaction to occur. Hence, it can be concluded that the energy required for the macroalgae samples for the conversion reaction is considered low and can react more easily. This inferred that the macroalgae (seaweed) have an advantage in the conversion and reaction process. Also, macroalgae have huge potential to be utilized as renewable biomass feedstock, especially Chaetomorpha linum because it is able to provide continuous supply due to its considerable high growth rate. Caulerpa lentillifera and Gracilaria coronopifolia, however, are usually used for food production and hence, there is a conflict with food interest.

3.4. Spectroscopic Analysis by FTIR

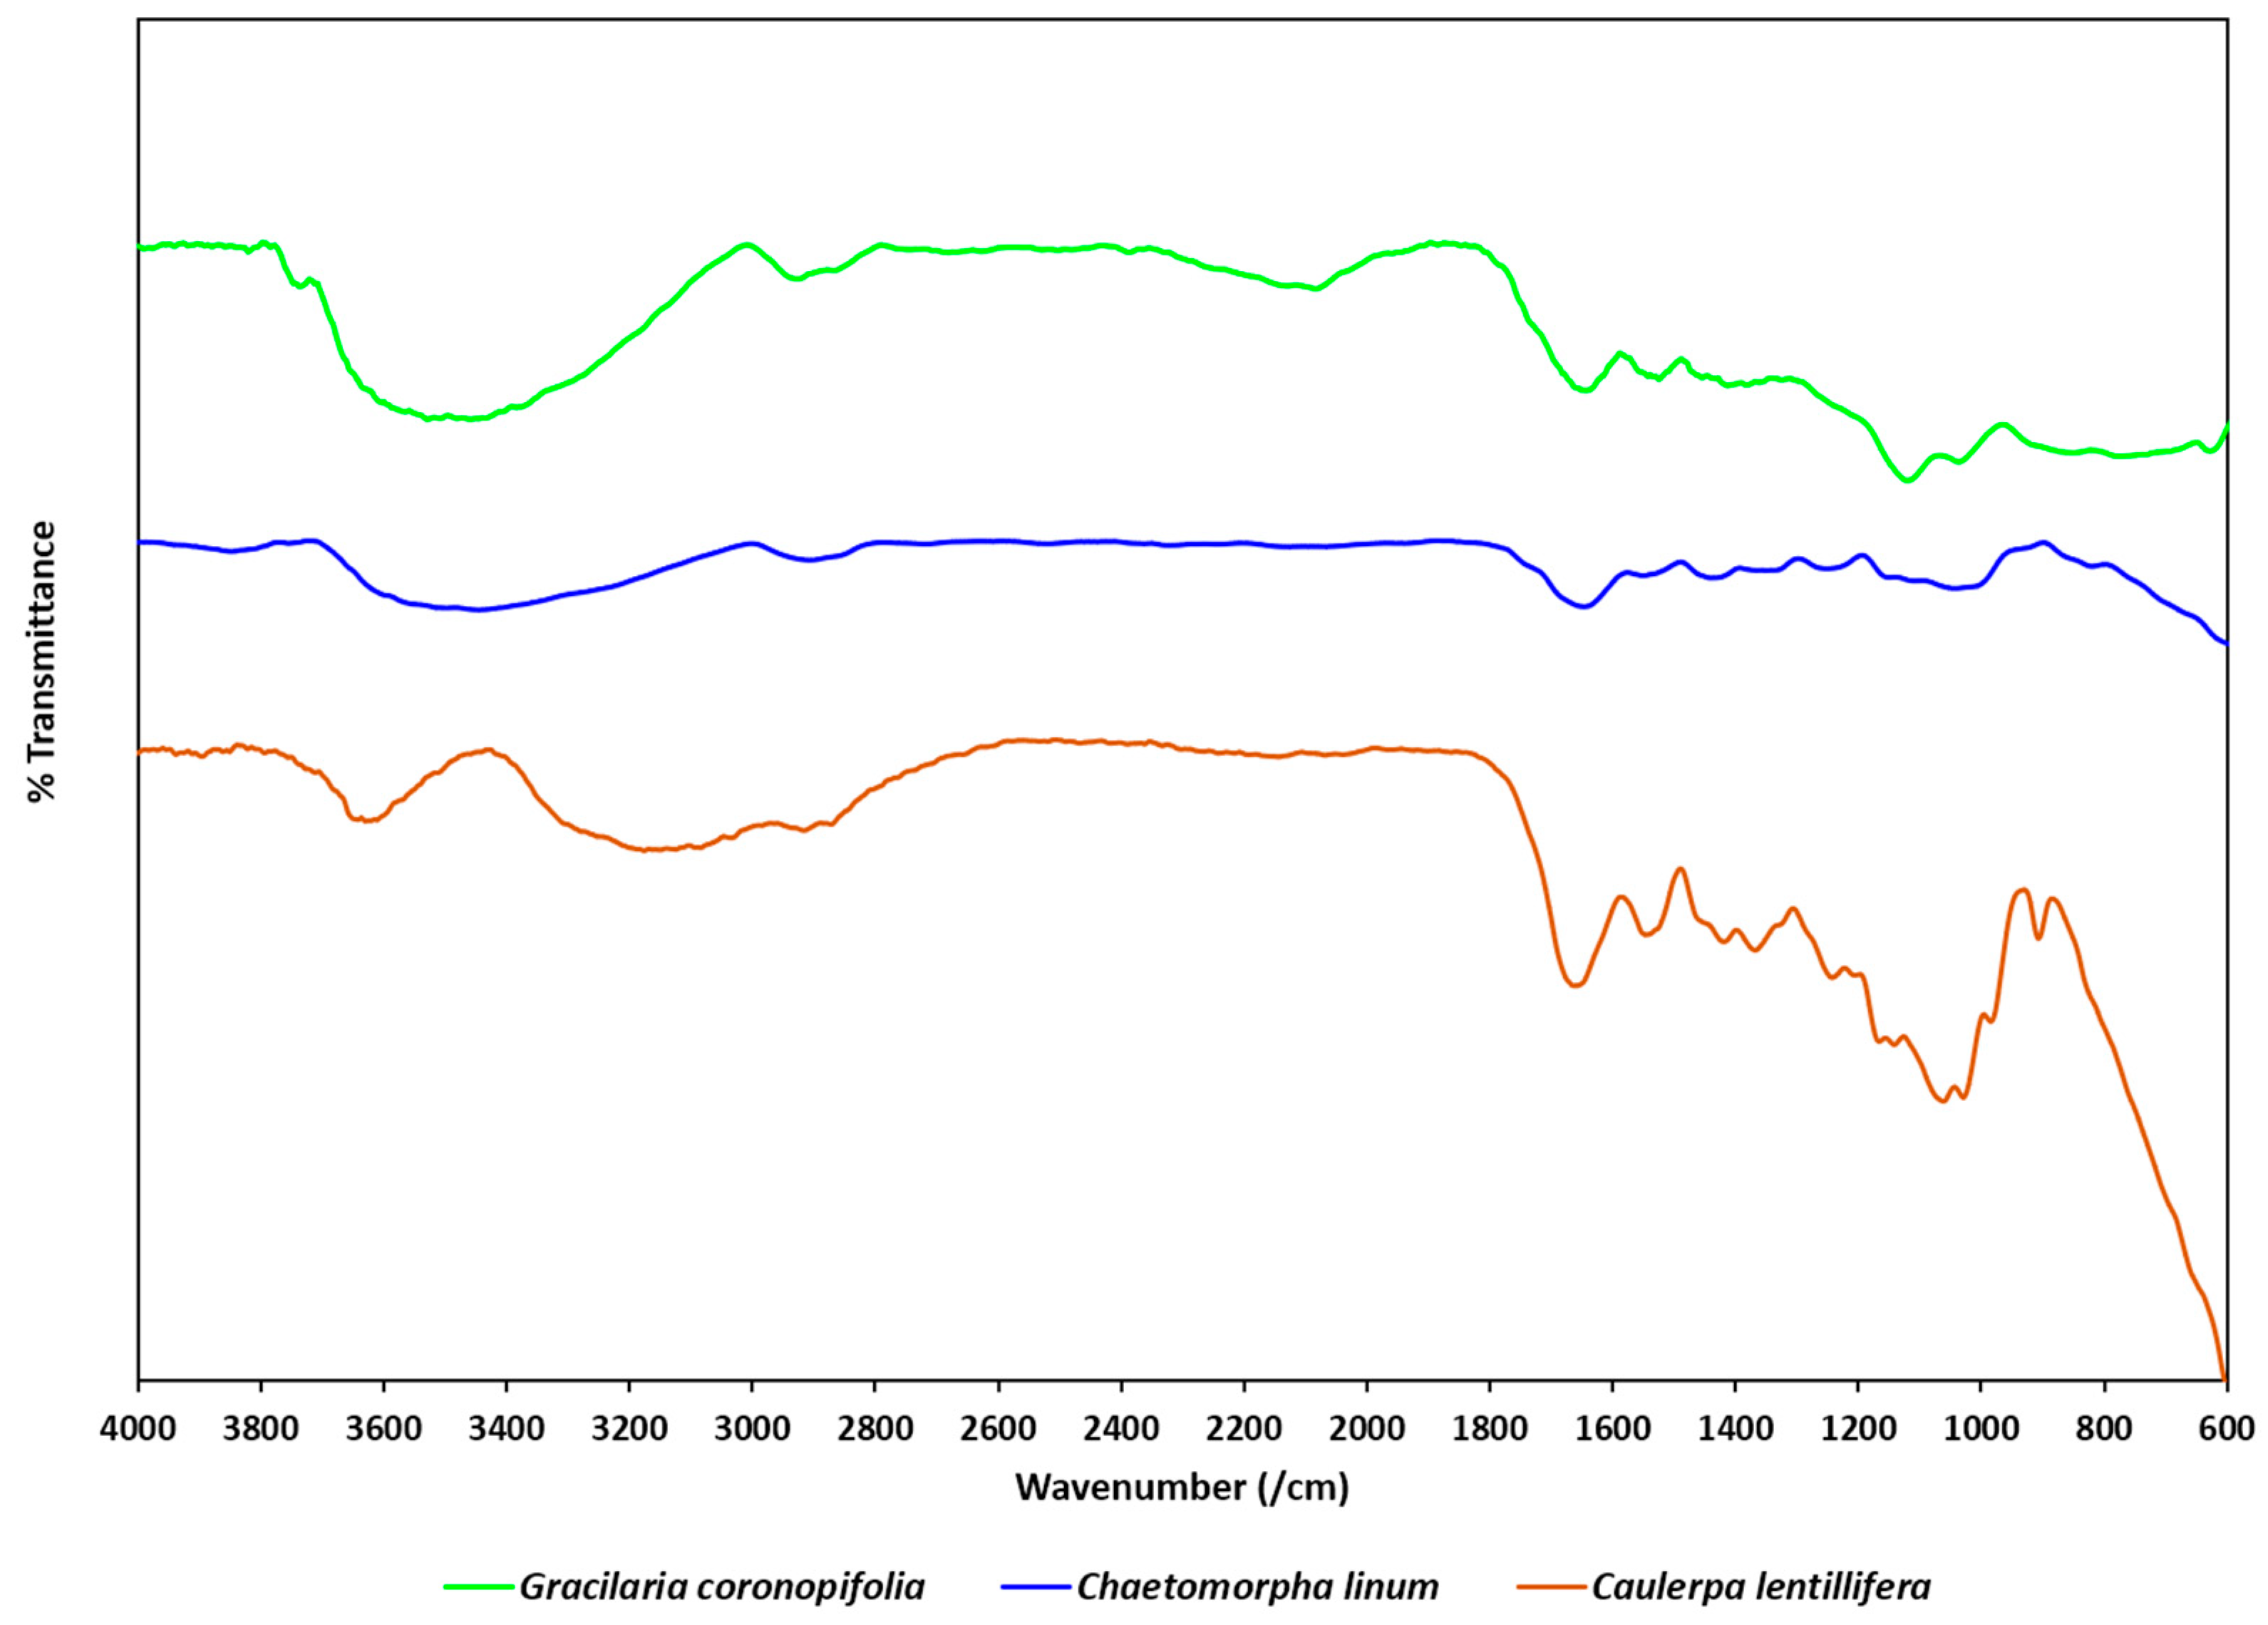
In this study, FTIR was performed to discover more information of the chemical characteristics of the algal biomass, including Caulerpa lentillifera, Gracilaria coronopifolia, and Chaetomorpha linum. As shown in Figure 4, there is a peak in the range of 3200–3700 cm−1 for all the samples. This peak might be assigned to the O–H stretching vibrations of the hydroxyl functional groups in carboxylic, phenolic and alcoholic compounds. The band at 2800–3000 cm−1 was related to =C–H and C–H stretching vibrations due to the lipid and carbohydrate content in the algae. Besides, the peaks which fall within this range can also be attributed to the N–H stretching of the protein. Another significant band that appeared at a frequency of 1709–1583 cm−1 is attributed to the C=O stretching vibration of free carboxyl groups present in lipids and some polysaccharides, such as alginate, laminarin, and fucoidan. Moreover, the breakdown and leaching of polysaccharides can also be observed through the presence of the peak at the wavenumber range of 1099–1356 cm−1. Lastly, the C–O–C stretching of polysaccharides is suggested at 980–1072 cm−1. The typical band assignment to the main peaks observed in the spectra is presented in Table 4.

3.5. Demineralization and Ash Content Determination by Proximate Analysis

Thermochemical conversion of biomass consists of a high amount of ash, which has a negative impact on equipment, the efficiency of the conversion process and the quality of products. Previous research reported that the acid-treated algae will lower the ash content [8]. Hence, in this study, acetic-acid treatment was applied to Chaetomorpha linum alone as it has the highest potential to be used as the future generation renewable biomass feedstock due to its low activation energy in comparison with other terrestrial biomass feedstock and it has no conflict with other interests.
Our results in Table 5 showed that there is a decrease in ash content after the acetic-acid treatment. However, the ash removal efficiency is less than 25%. Hence, it can be concluded that the acetic-acid treatment can be included as optional pre-treatment for future consideration.

4. Conclusions

In summary, this paper investigated the potentiality of three different macroalgae (Caulerpha lentillifera, Gracilaria coronopifolia and Chaetomorpha linum) as a renewable biomass feedstock. There are several studies which suggested that macroalgae are good applicants for bio-oil production, as stated in the discussion. The low calorific value of 10–13 MJ/kg suggested that the macroalgae species are less viable in fuel application but might be one of the best options for biochemical application. Also, hydrothermal liquefaction integrated with microwave processing technique is suggested to be the best wet algae conversion technique. Our results concluded that seaweed has high potential as biomass feedstock, particularly Chaetomorpha linum. Lastly, this study also reported that acetic-acid pre-treatment can be an optional process for future consideration to increase algae conversion efficiency.

Author Contributions

Conceptualization, P.L.S. and S.N.; Funding acquisition, S.N.; Investigation, M.Y.O.; Methodology, N.-I.S.A.L. and B.S.; Project administration, S.N.; Resources, M.Y.O.; Supervision, S.N.; Validation, M.Y.O., N.-I.S.A.L. and B.S.; Visualization, H.Y.L. and P.L.S.; Writing—Original draft, M.Y.O. and N.-I.S.A.L.; Writing—Review & editing, H.Y.L. and P.L.S.

Funding

This research was funded by the TNB Seed Fund (U-TR-RD-18-11). Besides, a note of appreciation to iRMC Universiti Tenaga Nasional (UNITEN) for the financial support through publication fund BOLD 2025 (RJO10436494).

Acknowledgments

The authors would like to acknowledge UNITEN for the research facilities. N.SAL would also like to thank UNITEN for the UNITEN Bold Postgraduate Scholarship (2018).

Conflicts of Interest

The authors declare no conflict of interest. The funders had no role in the design of the study; in the collection, analyses, or interpretation of data; in the writing of the manuscript, or in the decision to publish the results.

References

  1. USEPA. Guidelines for Water Reuse; U.S. Agency for International Development: Washington, DC, USA, 2012; p. 643.
  2. Latif, A.N.I.S.; Ong, M.Y.; Nomanbhay, S. Hydrothermal liquefaction of Malaysian’s algal biomass for high-quality bio-oil production. Eng. Life Sci. 2019, 246–269. [Google Scholar] [CrossRef]
  3. Nhat, H.P.; Ngo, H.H.; Guo, W.S.; Chang, S.W.; Nguyen, D.D.; Nguyen, P.D.; Bui, X.T.; Zhang, X.B.; Guo, J.B. Can algae-based technologies be an affordable green process for biofuel production and wastewater remediation? Bioresour. Technol. 2018, 256, 491–501. [Google Scholar] [CrossRef] [PubMed]
  4. Gollakota, A.R.K.; Kishore, N.; Gu, S. A review on hydrothermal liquefaction of biomass. Renew. Sustain. Energy Rev. 2018, 81, 1378–1392. [Google Scholar] [CrossRef]
  5. Ipina, A.A.; Urrutia, L.M.; Urrutia, L.D.; Portilla, A.D. Thermal oxidative decomposition estimation combining TGA and DSC as optimization targets for PMMA. J. Phys. Conf. Ser. 2018, 1107, 032011. [Google Scholar] [CrossRef]
  6. Edreis, E.M.A.; Yao, H. Kinetic thermal behaviour and evaluation of physical structure of sugar cane bagasse char during non-isothermal steam gasification. J. Mater. Res. Technol. 2016, 5, 317–326. [Google Scholar] [CrossRef] [Green Version]
  7. Saffe, A.; Fernandez, A.; Mazza, G.; Rodriguez, R. Prediction of regional agro-industrial wastes characteristics by thermogravimetric analysis to obtain bioenergy using thermal process. Energy Explor. Exploit. 2019, 37, 544–557. [Google Scholar] [CrossRef]
  8. Gao, W.; Chen, K.; Zeng, J.; Xu, J.; Wang, B. Thermal pyrolysis characteristics of macroalgae Cladophora glomerata. Bioresour. Technol. 2017, 243, 212–217. [Google Scholar] [CrossRef] [PubMed]
  9. Chandrasekaran, A.; Ramachandran, S.; Subbiah, S. Determination of kinetic parameters in the pyrolysis operation and thermal behavior of Prosopis juliflora using thermogravimetric analysis.pdfra using thermogr. Bioresour. Technol. 2017, 233, 413–422. [Google Scholar] [CrossRef]
  10. Daood, S.S.; Munir, S.; Nimmo, W.; Gibbs, B.M. Char oxidation study of sugar cane bagasse, cotton stalk and Pakistani coal under 1% and 3% oxygen concentrations. Biomass Bioenergy 2010, 34, 263–271. [Google Scholar] [CrossRef]
  11. Carpio, R.B.; Zhang, Y.; Kuo, C.T.; Chen, W.T.; Schideman, L.C.; Leon, R.L. Characterization and thermal decomposition of demineralized wastewater algae biomass. Algal Res. 2019, 38, 1–12. [Google Scholar] [CrossRef]
  12. Kantarli, İ.C.; Pala, M.; Yildirim, Y.; Yanik, J.; Abreu, M.H. Fuel characteristics and combustion behavior of seaweed-derived hydrochars. Turk. J. Chem. 2019, 43, 475–491. [Google Scholar] [CrossRef]
  13. Irini, A.; Dimitar, K.; Alvarado-Morales, M. Anaerobic Co-digestion of Cast Seaweed and Organic Residues; Technical University of Denmark: Lyngby, Denmark, 2017. [Google Scholar]
  14. Heaven, S.; Milledge, J.; Zhang, Y. Comments on Anaerobic digestion of microalgae as a necessary step to make microalgal biodiesel sustainable. Biotechnol. Adv. 2011, 29, 164–167. [Google Scholar] [CrossRef] [PubMed]
  15. Milledge, J.; Harvey, P. Grand Challenges in Marine Biotechnology; Springer Nature: Basingstoke, UK, 2018; ISBN 978-3-319-69074-2. [Google Scholar]
  16. Kök, M.V.; Pamir, R. Pyrolysis kinetics of oil shales determined by DSC and TG/DTG. Oil Shale 2003, 20, 57–68. [Google Scholar]
  17. Zhou, L.; Zou, H.; Wang, Y.; Le, Z.; Liu, Z.; Adesina, A.A. Effect of potassium on thermogravimetric behavior and co-pyrolytic kinetics of wood biomass and low density polyethylene. Renew. Energy 2017, 102, 134–141. [Google Scholar] [CrossRef]
  18. Lehner, T.; Challacombe, S.J.; Caldwell, J. An immunological investigation into the prevention of caries in deciduous teeth of rhesus monkeys. Arch. Oral Biol. 1975, 20, 305–310. [Google Scholar] [CrossRef]
  19. Paul, O.U.; John, I.H.; Ndubuisi, I.; Peter, A.; Godspower, O. Calorific Value of Palm Oil Residues for Energy Utilisation. Int. J. Eng. Innov. Res. 2015, 4, 2277–5668. [Google Scholar]
  20. Yamaji, G.T.N.; Mariana, P.M.; Larissa, S.H.; Yamamoto, H.F.M. Sugarcane trash for energy purposes: Storage time and particle size can improve the quality of biomass for fuel? Ind. Crops Prod. 2017, 108, 641–648. [Google Scholar]
  21. Shen, J.; Zhu, S.; Liu, X.; Zhang, H.; Tan, J. Measurement of Heating Value of Rice Husk by Using Oxygen Bomb Calorimeter with Benzoic Acid as Combustion Adjuvant. Energy Procedia 2012, 17, 208–213. [Google Scholar] [CrossRef] [Green Version]
  22. Mhilu, C.F. Analysis of Energy Characteristics of Rice and Coffee Husks Blends. ISRN Chem. Eng. 2014, 2014, 1–6. [Google Scholar] [CrossRef]
  23. Kumar, R.; Chandrashekar, N. Fuel properties and combustion characteristics of some promising bamboo species in India. J. For. Res. 2014, 25, 471–476. [Google Scholar] [CrossRef]
  24. Günther, B.; Gebauer, K.; Barkowski, R.; Rosenthal, M.; Bues, C.T. Calorific value of selected wood species and wood products. Eur. J. Wood Wood Prod. 2012, 70, 755–757. [Google Scholar] [CrossRef]
  25. Zhao, H.; Yan, H.X.; Liu, M.; Sun, B.B.; Zhang, Y.; Dong, S.S.; Qi, L.B.; Qin, S. Production of bio-oil from fast pyrolysis of macroalgae enteromorpha prolifera powder in a free-fall reactor. Energy Sources Part A Recover. Util. Environ. Eff. 2013, 35, 859–867. [Google Scholar] [CrossRef]
  26. Choia, J.H.; Woob, H.C.; Suha, D.J. Pyrolysis of Seaweeds for Bio-oil and Bio-char Production. Chem. Eng. Trans. 2014, 37, 121–126. [Google Scholar]
  27. Melendres, A.R., Jr.; Ilano, A.S. Bio-oil Product from Wild Brown Macro-algae Dunggandunggan (Padinasp) in Asturias and Carmen, Cebu, Philippines. Int. J. Med. Plants Nat. Prod. 2017, 3, 27–36. [Google Scholar]
  28. Wang, S.; Jiang, X.M.; Wang, Q.; Ji, H.S.; Wu, L.F.; Wang, J.F.; Xu, S.N. Research of specific heat capacities of three large seaweed biomass. J. Therm. Anal. Calorim. 2014, 115, 2071–2077. [Google Scholar] [CrossRef]
  29. Nomanbhay, S.; Hussein, R.; Ong, M.Y. Sustainability of biodiesel production in Malaysia by production of bio-oil from crude glycerol using microwave pyrolysis: A review. Green Chem. Lett. Rev. 2018, 11, 135–157. [Google Scholar] [CrossRef]
  30. Kalla, A.M.; Devaraju, R. Microwave energy and its application in food industry: A reveiw. Asian J. Dairy Food Res. 2017, 36, 37–44. [Google Scholar] [CrossRef]
  31. Li, Y.; Li, B.; Du, F.; Wang, Y.; Pan, L.; Chen, D. Microwave-assisted hydrothermal liquefaction of lignin for the preparation of phenolic formaldehyde adhesive. J. Appl. Polym. Sci. 2017, 134. [Google Scholar] [CrossRef]
  32. White, J.E.; Catallo, W.J.; Legendre, B.L. Biomass pyrolysis kinetics: A comparative critical review with relevant agricultural residue case studies. J. Anal. Appl. Pyrolysis 2011, 91, 1–33. [Google Scholar] [CrossRef]
  33. Chen, Z.; Hu, M.; Zhu, X.; Guo, D.; Liu, S.; Hu, Z.; Xiao, B.; Wang, J.; Laghari, M. Characteristics and kinetic study on pyrolysis of five lignocellulosic biomass via thermogravimetric analysis. Bioresour. Technol. 2015, 192, 441–450. [Google Scholar] [CrossRef]
  34. Gai, C.; Zhang, Y.; Chen, W.T.; Zhang, P.; Dong, Y. Thermogravimetric and kinetic analysis of thermal decomposition characteristics of low-lipid microalgae. Bioresour. Technol. 2013, 150, 139–148. [Google Scholar] [CrossRef]
  35. Idris, S.S.; Rahman, N.A.; Ismail, K.; Alias, A.B.; Rashid, Z.A.; Aris, M.J. Investigation on thermochemical behaviour of low rank Malaysian coal, oil palm biomass and their blends during pyrolysis via thermogravimetric analysis (TGA). Bioresour. Technol. 2010, 101, 4584–4592. [Google Scholar] [CrossRef]
  36. Slopiecka, K.; Bartocci, P.; Fantozzi, F. Thermogravimetric analysis and kinetic study of poplar wood pyrolysis. Appl. Energy 2012, 97, 491–497. [Google Scholar] [CrossRef]
  37. Waheed, Q.M.K.; Maqsood, S.; Nawaz, R.; Aqeel, A.B. Investigation of thermal behaviour and kinetic analysis of Pakistani biomass: Rice husk, sugarcane bagasse and wheat straw using thermogravimetric analysis. In Proceedings of the 2015 Power Generation System and Renewable Energy Technologies (PGSRET), Islamabad, Pakistan, 10–11 June 2015. [Google Scholar]
  38. Xiong, S.; Zhuo, J.; Zhou, H.; Pang, R.; Yao, Q. Study on the co-pyrolysis of high density polyethylene and potato blends using thermogravimetric analyzer and tubular furnace. J. Anal. Appl. Pyrolysis 2015, 112, 66–73. [Google Scholar] [CrossRef]
  39. Olajire, A.; Zhi, C.; Hanson, S.; Wai, C. Thermogravimetric analysis of the pyrolysis characteristics and kinetics of plastics and biomass blends. Fuel Proc. Technol. 2014, 128, 471–481. [Google Scholar]
  40. Vernieres-hassimi, L. Comparative investigation for the determination of kinetic parameters for biomass pyrolysis by thermogravimetric analysis. J. Ther. Anal. Calorim. 2017, 129, 1201–1213. [Google Scholar]
  41. Yaman, E. Pyrolysis kinetics of walnut shell and waste polyole fi ns using thermogravimetric analysis. J. Energy Inst. 2016, 1–13. [Google Scholar] [CrossRef]
  42. Azizi, K.; Moraveji, K.M.; Najafabadi, A.H. Characteristics and kinetics study of simultaneous pyrolysis of microalgae Chlorella vulgaris, wood and polypropylene through TGA. Bioresour. Technol. 2017, 243, 481–491. [Google Scholar] [CrossRef]
  43. Bartošová, A.; Blinová, L.; Gerulová, K. Characterisation Of Polysacharides And Lipids From Selected Green Algae Species By FTIR-ATR Spectroscopy. Res. Pap. Fac. Mater. Sci. Technol. Slovak Univ. Technol. 2015, 23, 97–102. [Google Scholar] [CrossRef] [Green Version]
  44. Stehfest, K.; Toepel, J.; Wilhelm, C. The application of micro-FTIR spectroscopy to analyze nutrient stress-related changes in biomass composition of phytoplankton algae. Plant Physiol. Biochem. 2005, 43, 717–726. [Google Scholar] [CrossRef]
  45. Jebsen, C.; Norici, A.; Wagner, H.; Palmucci, M.; Giordano, M.; Wilhelm, C. FTIR spectra of algal species can be used as physiological fingerprints to assess their actual growth potential. Physiol. Plant. 2012, 146, 427–438. [Google Scholar] [CrossRef]
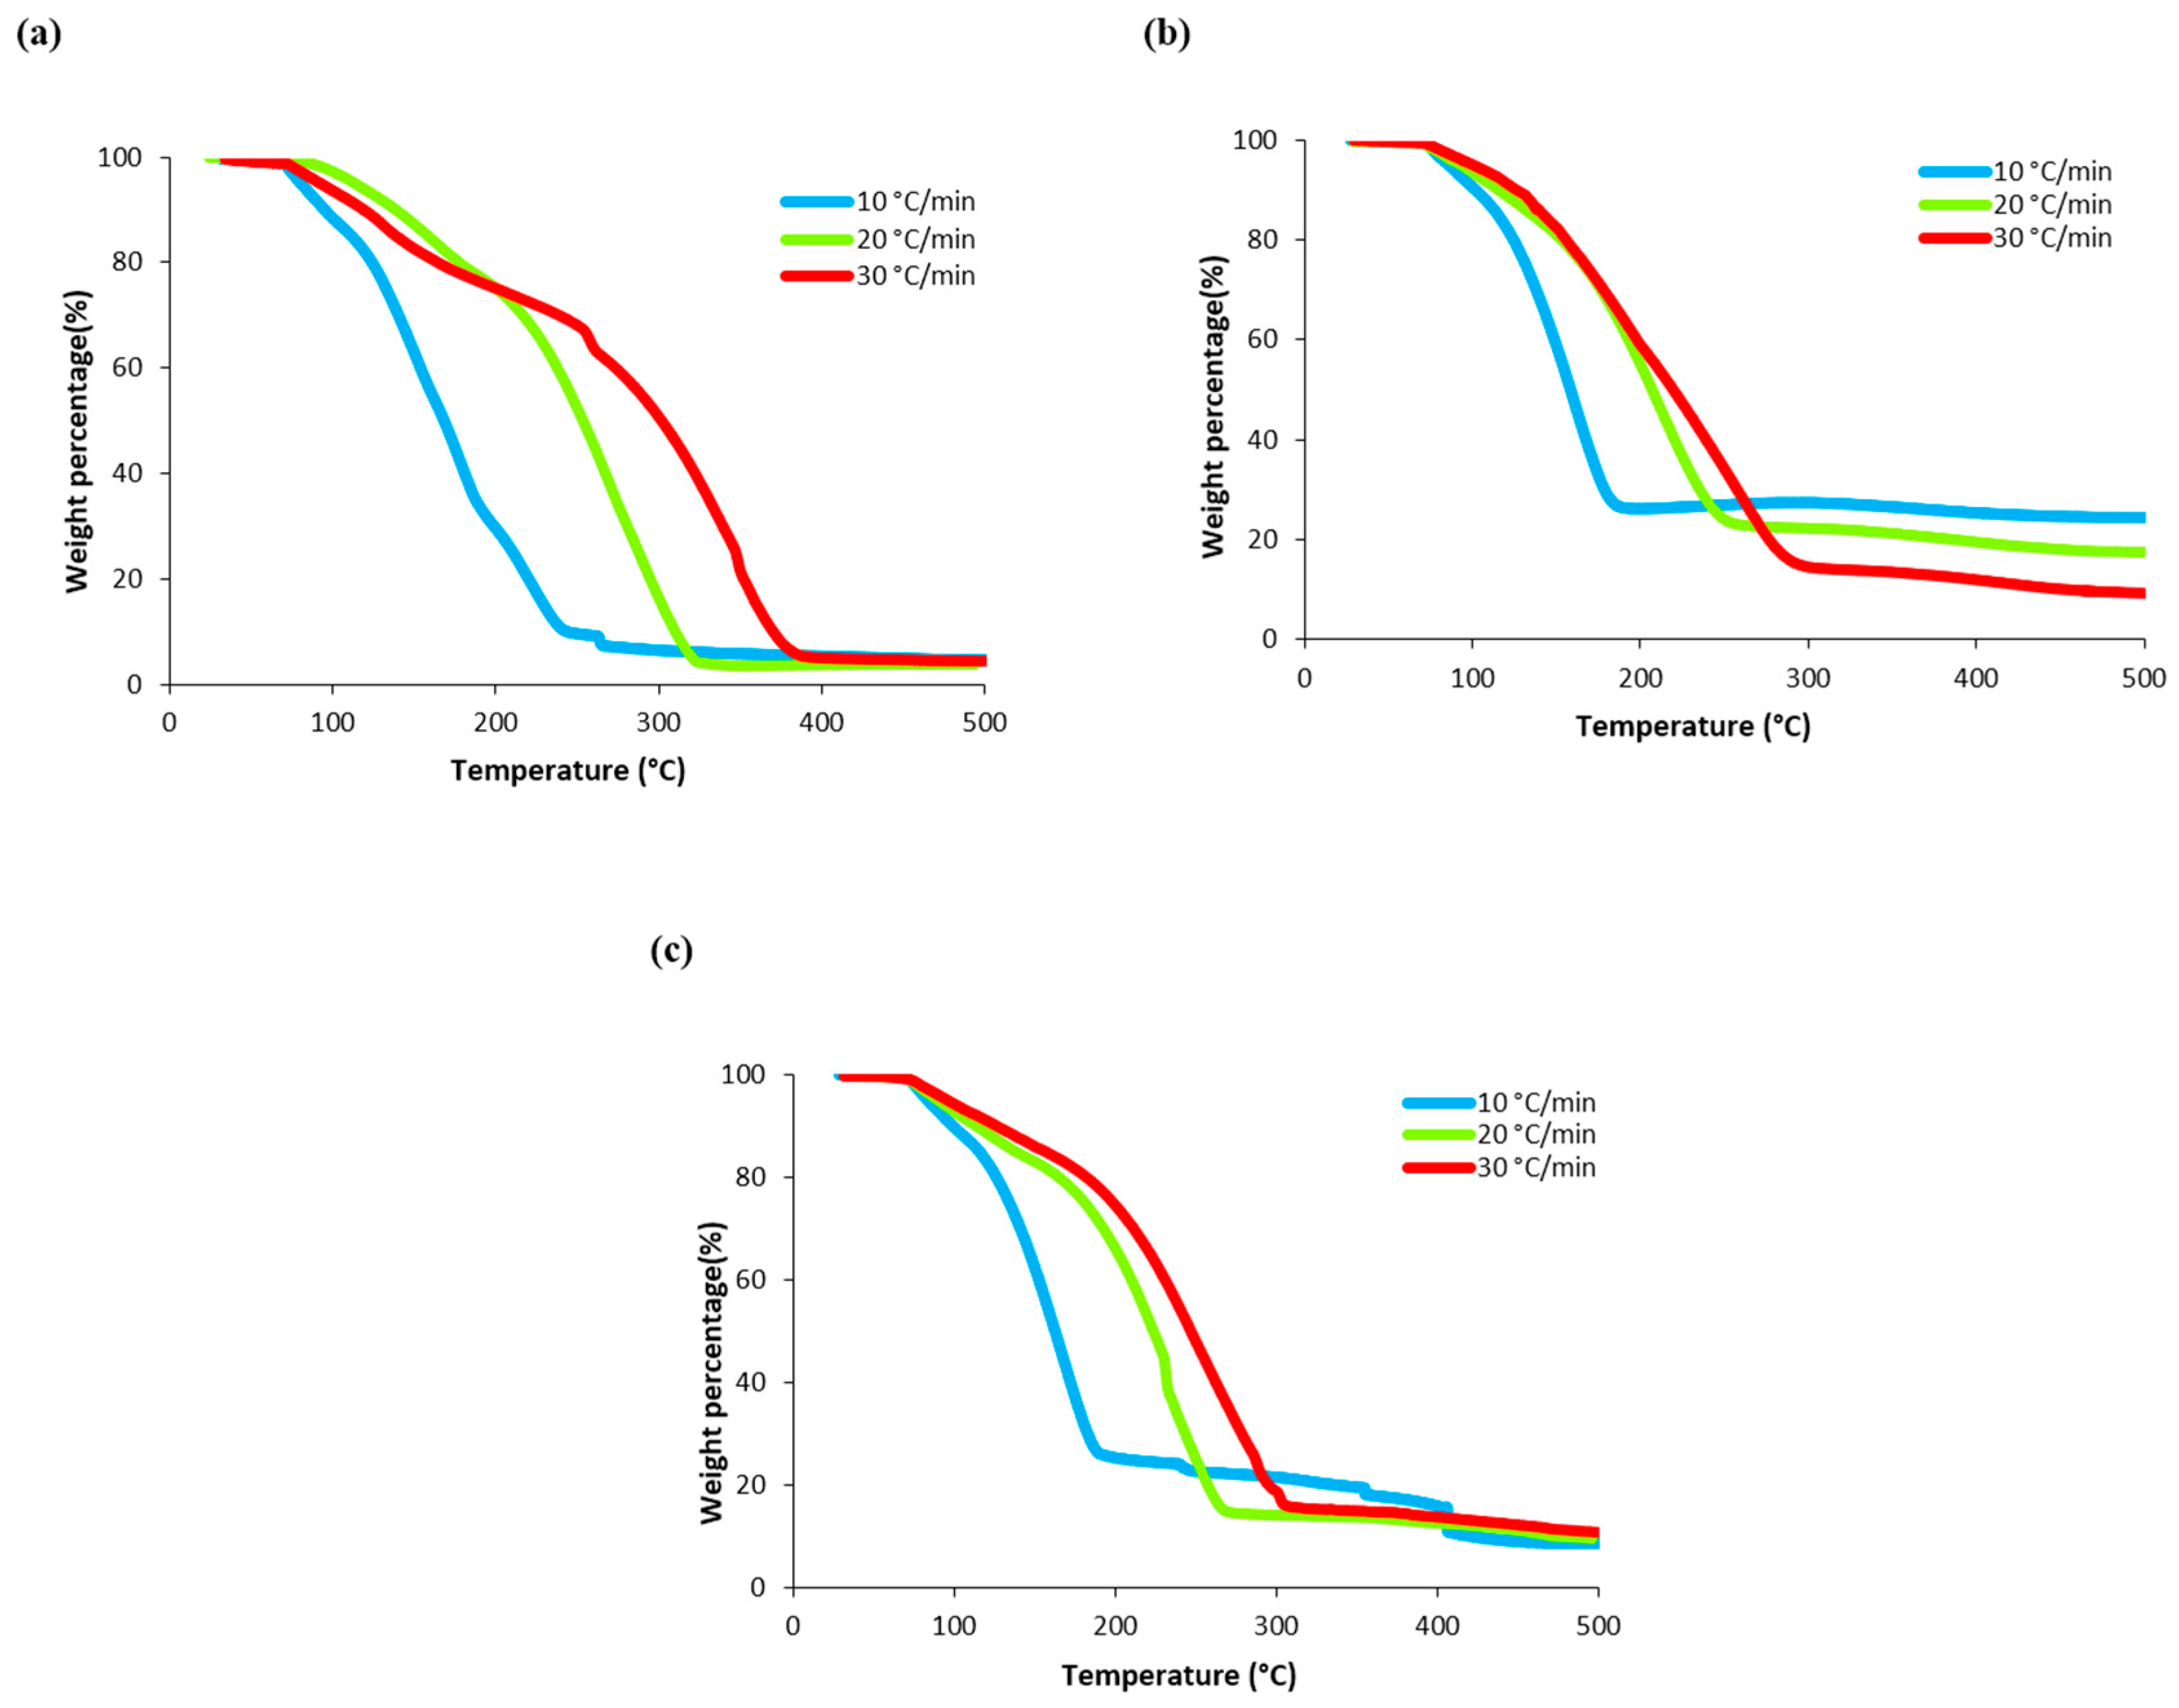
Figure 1. Thermogram (TG) of (a) Caulerpa lentillifera, (b) Gracilaria coronopifolia and (c) Chaetomorpha linum at three heating rates (10 °C/min, 20 °C/min and 30 °C/min).
Energies 12 03509 g001
Figure 2. Derivative Thermogram (DTG) of (a) Caulerpa lentillifera, (b) Gracilaria coronopifolia and (c) Chaetomorpha linum at three heating rates (10 °C/min, 20 °C/min and 30 °C/min).
Energies 12 03509 g002
Figure 3. Coat-Redfern plot for kinetic parameters determination of (a) Caulerpa lentillifera (b) Gracilaria coronopifolia and (c) Chaetomorpha linum.
Energies 12 03509 g003
Figure 4. Spectra of algal biomass using FTIR analysis.
Energies 12 03509 g004
Table 1. Elemental composition and high calorific values of algal biomass samples.
SampleComposition (%)Calorific Value (MJ/kg)
CarbonHydrogenNitrogenSulphurOxygen
Caulerpa lentifilla35.763.632.711.3230.1113.3538
Gracillaria coronopifolia23.084.011.767.8229.4310.6661
Chaetomorpha linum27.815.693.190.8529.6712.7278
Table 2. Summary of kinetic results for three different algae biomass samples.
SamplesHeating Rates (°C/min)Temperature Range (°C)R2Activation Energy, E (kJ/mol)Average E (kJ/mol)Pre-Exponential Factor, A (min−1)Average A (min−1)
n = 1
Caulerpa lentillifera10100–2200.958418.56518.8707 ± 0.37356.00 × 107(1.11 ± 1.61) × 109
20105–3200.983019.2872.96 × 108
30110–3900.950418.7602.96 × 109
Gracilaria coronopifolia10100–1800.993829.92922.3727 ± 6.66562.00 × 106(1.85 ± 2.17) × 108
20105–2400.998219.8621.28 × 108
30110–2800.960017.3274.25 × 108
Chaetomorpha linum10100–1800.997527.80920.1583 ± 6.66326.00 × 106(3.48 ± 3.73) × 108
20105–2600.971917.0392.93 × 108
30110–3000.988215.6277.45 × 108
n = 2
Caulerpa lentillifera10100–2200.995340.31333.1827 ± 6.76521.38 × 105(1.92 ± 2.50) × 107
20105–3200.945032.3811.00 × 107
30110–3900.688326.8544.76 × 107
Gracilaria coronopifolia10100–1800.942669.24848.6120 ± 17.91793.00 × 108(1.01 ± 1.72) × 108
20105–2400.936639.5866.28 × 105
30110–2800.977637.0022.75 × 106
Chaetomorpha linum10100–1800.983445.50337.7747 ± 6.72948.38 × 104(3.15 ± 5.13) × 106
20105–2600.847834.6102.98 × 105
30110–3000.876133.2119.07 × 106
n = 3
Caulerpa lentillifera10100–2200.974018.56518.8707 ± 0.37356.00× 107(1.11 ± 1.61) × 109
20105–3200.899819.2872.96 × 108
30110–3900.662718.7602.96 × 109
Gracilaria coronopifolia10100–1800.893229.92922.3727 ± 6.66562.00 × 106(1.85 ± 2.17) × 108
20105–2400.891419.8621.28 × 108
30110–2800.941317.3274.25 × 108
Chaetomorpha linum10100–1800.968127.80920.1583 ± 6.66326.00 × 106(3.48 ± 3.73) × 108
20105–2600.788317.0392.93 × 108
30110–3000.814915.6277.45 × 108
Table 3. Kinetic parameters of other biomass samples.
BiomassHeating Rates (°C/min)Activation Energy (kJ/mol)Pre-Exponential Factor (min−1)Reference
Potato1081.35.77 × 103[38]
2081.59.97 × 103[38]
30809.57 × 103[38]
Sawdust-59.761.50 × 104[39]
Bamboo-65.965.81 × 104[39]
EFB-50.372.32 × 103[39]
Beechwood-167.144.90 × 1011[40]
Walnut shell569.111.87 × 105[41]
1079.732.62 × 106[41]
1561.004.91 × 104[41]
2067.032.19 × 105[41]
5069.716.48 × 105[41]
Chlorella vulgaris (microalgae)-131.2282.80 × 1010[42]
Caulerpa lentillifera1018.5656.0 × 107This work
2019.2872.96 × 108
3018.7602.96 × 109
Gracilaria coronopifolia1029.9292.0 × 106
2019.8621.28 × 108
3017.3274.25 × 108
Chaetomorpha linum1027.8096.0 × 106
2017.0392.93 × 108
3015.6277.45 × 108
Table 4. Typical band assignment of major peaks of algae biomass.
Wavenumber Range (cm−1) *Typical Band Assignment *Main Peak (cm−1)
Caulerpa lentilliferaGracilaria coronopifoliaChaetomorpha linum
3700–3200O–H stretching of hydroxyl functional group3630.033481.513444.87
3000–2800N–H stretching (protein) or =C-H and C–H stretching (lipid carbohydrate)2916.372926.012906.73
1709–1583C=O stretching (protein amide I band)1662.641643.351647.21
1585–1481N–H bending and C–N stretching1544.981533.411550.77
1440–1395O–H bending of carboxylic acid1419.611411.891440.83
1356–1191P=O stretching of phosphodiesters (Nucleic Acid and other phosphate-containing compounds)1242.16-1251.80
1072–1099Carbohydrate C–O–C of polysaccharides (Nucleic Acid) or P=O stretching of phosphodiesters 1166.93--
1072–980Carbohydrate C–O–C of polysaccharides 1029.991037.701041.56
* Sources from Refs. [43,44,45].
Table 5. The results of demineralization through acetic-acid treatment.
SampleMoisture Content (%)Ash (%)Ash (%dw)Ash Removal Efficiency (%)
Chaetomorpha linum78.959.8746.864-
Chaetomorpha linum with 1% acetic acid79.728.8743.7336.681
Chaetomorpha linum with 2% acetic acid80.526.8335.04525.220