Article

Two Dimensional Axisymmetric Simulation Analysis of Vegetation Combustion Particles Movement in Flame Gap under DC Voltage †

1
College of Electrical Engineering and New Energy, China Three Gorges University, Yichang 443002, China
2
State Grid Shanxi Province Datong Power Supply Company, Datong 443002, China
*
Author to whom correspondence should be addressed.
This paper is an extended version of our paper published in the 2018 IEEE International Conference on High Voltage Engineering and Application (ICHVE), Athens, Greece, 10–13 September 2018.
Energies 2019, 12(19), 3596; https://doi.org/10.3390/en12193596
Submission received: 8 July 2019 / Revised: 14 September 2019 / Accepted: 16 September 2019 / Published: 20 September 2019

Abstract

:
In recent years, extreme high temperature weather occurs frequently, which easily causes forest fires. The forest fire is prone to the trip accident of the transmission line. Previous studies show that charged combustion particles cause electric field distortion in the gap below the transmission line, and trigger discharges near the conductor area. The motion and distribution characteristics of combustion particles in the gap have an important influence on the discharge characteristics. Therefore, the size and morphology of combustion particles are analyzed through combustion experiments with typical vegetation. The combustion particles are mainly affected by the air drag force, electric field force and gravity. The interaction and influence of temperature, fluid, electric field and the multi-physical field of particle motion are comprehensively analyzed. A two dimensional (2D) axisymmetric simulation model is established by simplifying the flame region. According to the heat release rate of vegetation flame combustion, the fluid temperature and velocity are calculated. Combined with the fluid field and electric field, the forces on particles and movement are calculated. The results can provide a basis for the analysis of the electric field distortion, and further study the discharge mechanism of the gap under the condition of vegetation flame.

1. Introduction

In recent years, more and more extreme weather has led to frequent forest fires. China’s energy center is in the central and western regions, while the load center is on the eastern coast. Therefore a large amount of electricity has to be transported over a long distance. Due to the limited transmission corridor, more and more extra high voltage/ultra-high voltage (EHV/UHV) transmission lines will inevitably pass through high forest fire risk areas. Tripping accidents of two-dimensional (2D) transmission line caused by forest fires are frequent [1,2,3]. There are also many reports in other countries, such as the forest fire in California in November 2018, which caused a considerable area of power supply interruption [4,5,6,7]. The influence of flame on gap breakdown mainly includes flame temperature, charged particles, ashes and so on [8,9,10]. High flame temperature reduces air density and promotes thermal ionization.
A large number of charged particles in flame are produced by a combustion reaction, thermal ionization and an electric field. They increase gap conductivity and charge combustion particles. The charged particles will distort the electric field. The trigger discharge is more likely to be produced when charged particles are near the electrode. It will cause the breakdown of the whole gap. These factors lead to transmission line tripping, which seriously affects the safe and stable operation of transmission lines.
Because of the difference in the corridor area, the vegetation of the transmission line is also quite different. The main vegetation that causes mountain fires and the trip of transmission lines are fir, eucalyptus, sugarcane, reed and straw, etc. The combustion of vegetation mainly produces carbon black particles. The particle size of carbon black varies from 0.2 to 5 microns, and it has a certain conductivity. They form granular chains and bridge parts intermittently, so that the gap insulation strength decreases rapidly [11]. In addition to small carbon black particles, vegetation combustion also produces large-scale ash. The maximum size of ash collected in relevant vegetation fire tests can reach 45 mm [8]. Materials with different dielectric constants and conductivities are used to simulate different vegetation particles. The effect of different vegetation particles on gap insulation strength was studied. The experimental results show that the higher the dielectric constant or conductivity, the greater the impact on the breakdown voltage [10]. But the test by Naidoo P. was not carried out in flames, and therefore cannot effectively reflect the impact of combustion particles on breakdown voltage under flame conditions. Typical vegetation in transmission line corridors burning experiments were conducted by some researchers. The direct current (DC) breakdown characteristics of clearance under flame conditions are studied. The effect of particles on the gap electric field distortion is preliminarily simulated and analyzed [12,13]. However, there is a lack of analysis of the motion and distribution of combustion particles under the action of electric field and hot air flow.
Experiments show that the spatial electric field distortion under positive and negative DC voltage is significantly different from that under the influence of particle charging and motion characteristics. The analysis of the distortion characteristics of the electric field plays an important role in studying the breakdown mechanism of the flame gap under DC voltage [14,15]. Distribution of uniform particles in the air gap is often used to analyze the electric field distortion in the existing literature, which is not in accord with the actual situation [16]. It is necessary to analyze the movement characteristics of vegetation combustion particles in a flame gap under DC voltage. Charged particles are affected by the drag force of the heat flow and electric field force. The motion and distribution of charged particles have great influence on the “distortion of space” electric field. In the previous research, the shape and size of different vegetation particles were observed, and the motion path of large particles was recorded by camera in some cases [17]. However, it is difficult to analyze the movement and distribution law of particles under the restriction of experimental conditions. It is necessary to establish a reasonable model for simulation.
Therefore, combined with the characteristics of vegetation combustion particles, temperature field, fluid field, electric field and fluid motion are comprehensively simulated and analyzed in this paper. Positive and negative DC voltages are applied to the electrode respectively, and then combustion experiments are carried out under the electrode using different typical vegetation. Both the size and morphology of typical combustion particles are statistically analyzed. The temperature distribution of the gap under different vegetation flames was measured. According to the measured thermal generation rate of vegetation flame, the temperature distribution and fluid characteristics are obtained by a coupling calculation of fluid and temperature fields. The drag force acting on the particles is further calculated. Considering the drag force, electric field force and gravity, the forces on particles and movement of the particles in the process of rising are calculated.

2. Combustion Experiment of Typical Vegetation

2.1. Experiment Arrangement and Steps

It is necessary to obtain the statistical law of the shape and size of vegetation combustion particles for simulation. The heat release rate and temperature distribution of vegetation combustion also need to be measured. The experimental arrangement of typical vegetation combustion and measurement is shown in Figure 1. The vegetation is placed on a plate electrode. A weight sensor is placed below the plate electrode to measure the rate of vegetation mass loss during combustion. Then the heat release rate can be calculated by combining the burning calorific value of different vegetation. The varied process of flame shape and height change is photographed and recorded, combined with a digital camera and ruler. An infrared thermal imager can be used to photograph the temperature distribution of the whole flame. At the same time, the thermocouple array can record the temperature values at different heights in the flame. Rod electrodes are suspended directly above the vegetation and applied with DC voltage.
The arrangement of the wooden crib is simple and repeatable. Most of the previous studies for breakdown characteristics of clearance under flame conditions use this wooden crib. However, due to the difference of component content, the combustion effect of branches and leaves is quite different from that of the wooden crib. It shows that the breakdown voltage of clearance under the branch and leaf combustion is significantly lower than that of a wooden stack. Therefore, reed, straw and fir branches were selected as three typical plants to cause the trip of transmission lines due to a vegetation fire. At the same time, the wooden crib test was carried out as a comparison. As shown in Figure 2, the vegetation or wooden crib is arranged in a square stack of 21 cm × 21 cm × 10 cm. In order to ensure the same burning intensity each time, the typical vegetation was assigned with the same quality in repeated experiments. Typical vegetation is exposed to the sun for several days before the experiment to ensure dryness, as in nature. The effect of different moisture content on combustion is avoided.
The test steps are as follows: (1) Arrange the equipment according to Figure 1; (2) take the same weight of vegetation and arrange it into square stacks; (3) apply the specified DC voltage on the electrode; (4) ignite the vegetation and observe the temperature and shape of vegetation flame by digital camera and infrared camera; (5) measure and record the temperature of the thermocouple and measure the mass loss rate by weight sensor; (6) observe the triggered discharge of particles; (7) the size, shape and weight of particles are collected and measured after combustion. The experiment is carried out indoors to avoid the influence of wind, under dry conditions, and with typical values of T = 20~30 °C, RH = 50~75%. Tests for different vegetation are repeated three times.

2.2. Test Results: Temperature Distribution and Particle Size

Temperature variations at different heights on the axis of each planting flame are obtained by temperature sensors. The burning time of the wooden crib is the longest, being about 14 min. After ignition, the temperature of each thermocouple is recorded every minute. The burning time of reed, straw and fir branches is relatively short, so the thermocouple readings are recorded every 10 s after ignition. For instance, comparison of the flame temperature distribution between the wooden crib and straw is shown in Figure 3. With the increase of flame, the temperature increases gradually. When the maximum fire is reached, the combustion will remain stable for a period of time, and the temperature will reach the maximum. The maximum flame temperature of wood is 747 °C, while that of straw is 518 °C. The maximum temperatures of reed and fir branches are 306 °C and 273 °C, respectively. According to vegetation combustion, the gap can be divided into a continuous area, an oscillating area and a smoky area. The continuous area is about 0~30 cm above the vegetation. The highest temperature is found in the continuous flame area about 15 cm above the wood. The height of the oscillating area is about 30~55 cm. In the oscillating area, the flame will oscillate up and down, and the flame does not always exist. The smoky area is filled with particles and smoke generated by combustion, and the temperature is low.
According to the experimental data, the mass loss rate is calculated. The maximum mass loss rates of wooden crib, reed, straw and fir branches are 2 g/s, 1.84 g/s, 1.34 g/s and 1.24 g/s, respectively, and it can be maintained at maximum flame for a period of time. The average heat release rates of the wooden crib, reed, straw and fir branches were 21.45 kJ/s, 16.89 kJ/s, 15.93 kJ/s and 15.19 kJ/s, respectively. According to the mass loss of the whole combustion process, the total heat generated by the four kinds of burners are 4.896 × 10³ kJ, 2.197 × 10³ kJ, 2.814 × 10³ kJ and 2.066 × 10³ kJ, respectively. The measurement results show that the heat generated is in good agreement with the temperature.
The stable combustion flames of the four combustible materials are shown in Figure 4. The smoke concentration produced during combustion is small. Because the burning material has been exposed to the sun for a week, the water content is low, and the burning is sufficient. The combustion products of vegetation in the experiment mainly consist of carbon black particles of micron magnitude and ashes of large size. A differential motion particle size meter (DMPS) was used to analyze the size of these carbon black particles. The particle size of carbon black is about 0.02–0.05 μm. These carbon black particles will aggregate into spherical or chain-like particles with a size of about 10–300 μm. For instance, the size of aggregated carbon black particles produced by the wooden crib combustion is from 0.01 μm to more than 43 μm. The two peaks of the contents of different sizes are 0.3 μm and 43 μm, respectively. These carbon black particles are charged, and may be adsorbed onto large size ashes. They further distort the space electric field and lead to trigger discharge.
Large size ashes produced by the insufficient burning of vegetation have a greater impact on the gap discharge. Typical large-scale ashes from the burning of four vegetations are shown in Figure 5. The longest ash of reed can reach 12 cm, with its diameter up to 4mm. But the weight of reed ash is very light, about 0.2 g. The largest ash of the fir branch is about 10 cm in length, 2 mm in diameter and 0.7 g in weight. The largest ash of straw is about 8 cm in length, 6 mm in diameter and 0.5 g in weight. The maximum ash length and weight of wooden crib burning are 7 cm and 8 g, respectively. The measured data show that the density of ash in wooden stacks is high. The large size particles are heavy, and will not rise with the hot air flow, and only the smaller size of ash will rise. The ash density of other vegetation combustion is smaller, and the ash of larger length can also rise. Reed ashes have the largest size and the lightest weight. Under the combined influence of the electric field and thermal convection, they float into the gap, bridge the gap, and trigger the discharge.

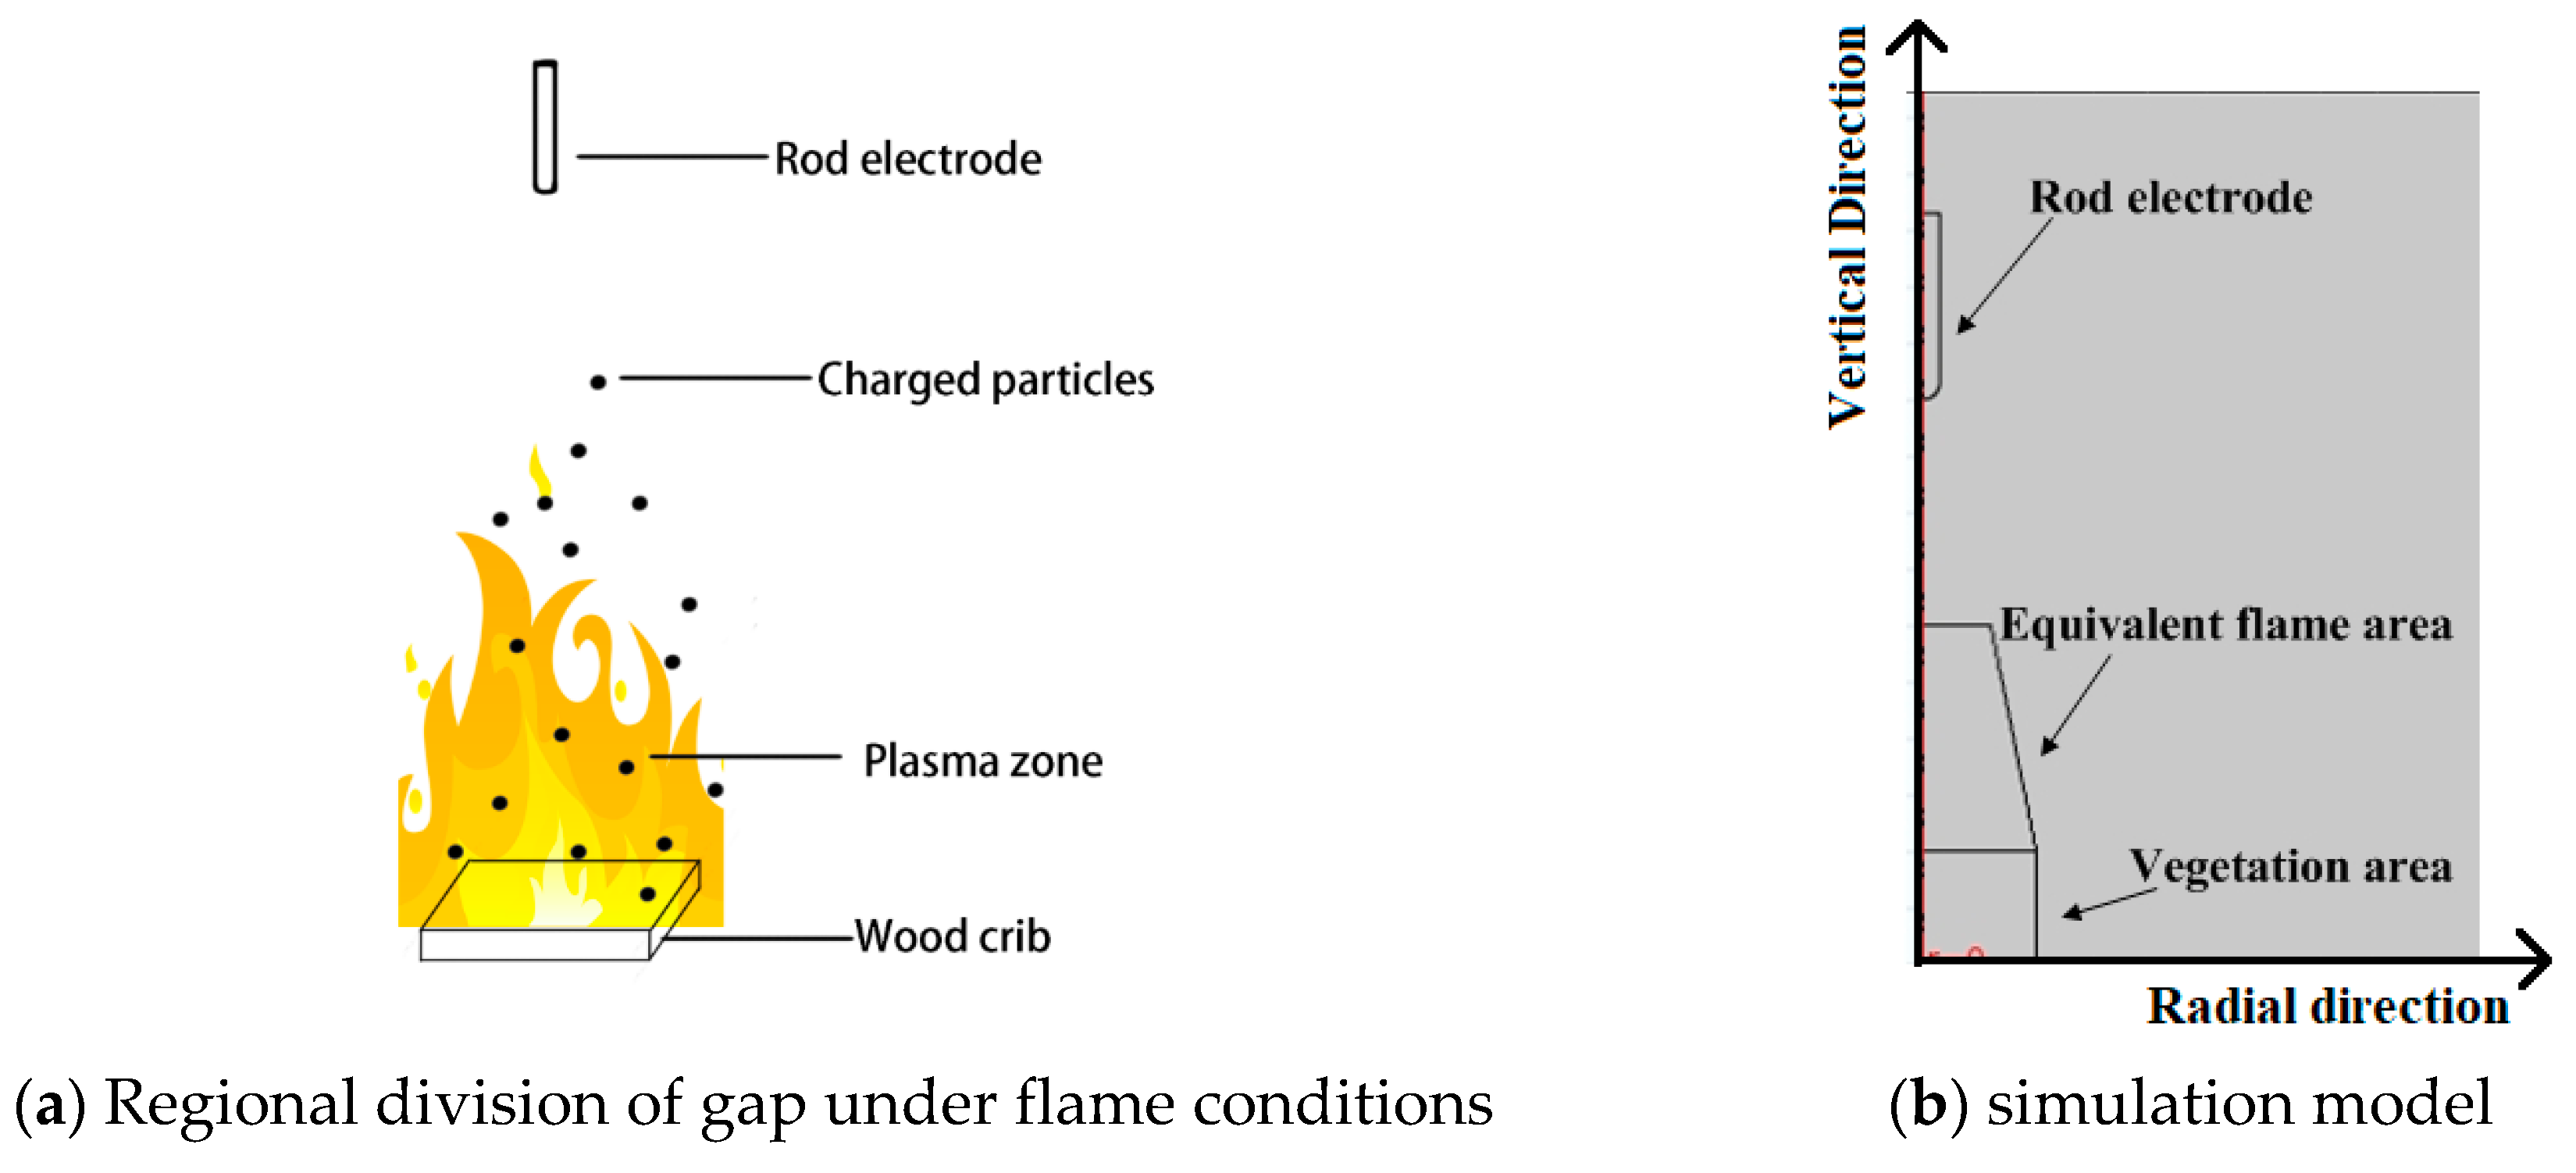
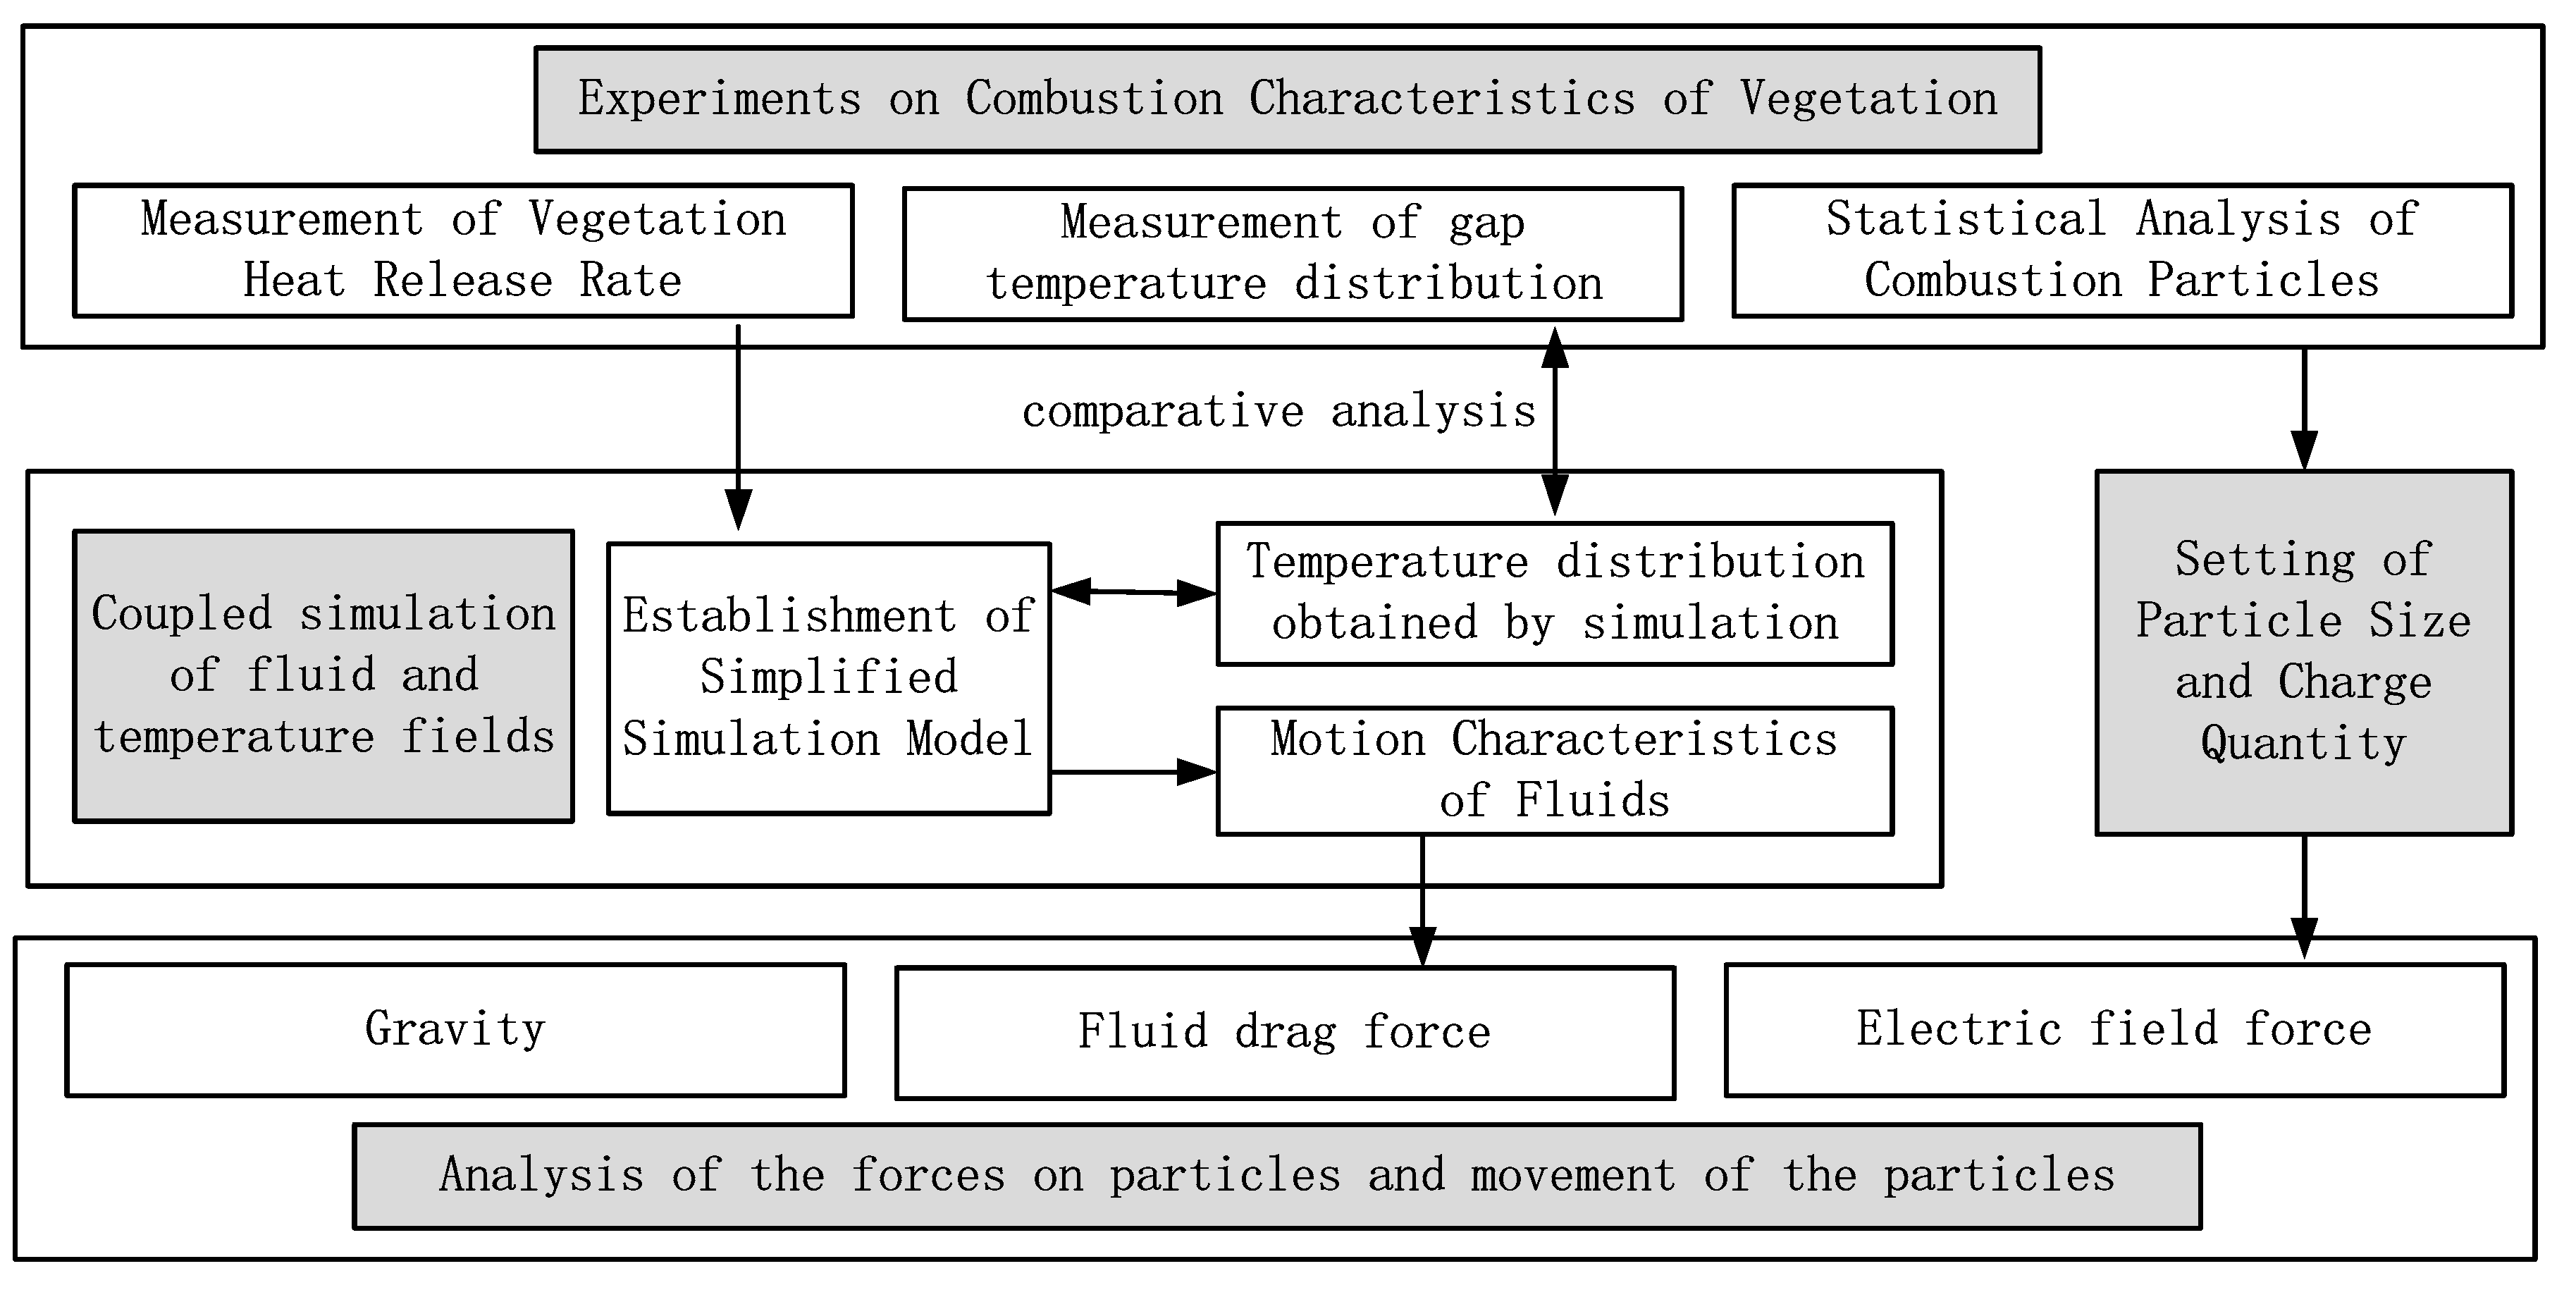
3. Simulation Mechanism and Model Establishment

3.1. Mathematical Model of Multiple Physical Fields for the Combustion Particles

3.1.1. Charging Mechanism of Combustion Particles

The generation of charged particles in a vegetation fire mainly includes chemical reaction, collision ionization, thermal dissociation, etc. The main component of vegetation is cellulose, which is similar to hydrocarbons. The process of generating electrons and ions in the reaction of hydrocarbons is shown in Formula (1) [9]. During combustion, alkali metal and alkaline-earth metal salts can react with the combustion byproduct CO to produce electrons and CO2, such as in Formula (2). Flame is a kind of plasma (ionized gas). The ion concentration in the reaction zone of mixed hydrocarbon and air flame is 109–1012/cm3, and the typical ion concentration of flame is 1010/cm3.
CH + O → CHO+ + e
CaO + CO → Ca+ + e + CO2
Vegetation combustion produces high temperatures. If the flame contains alkali metal salts (S(g)), ionization mainly comes from the thermal ionization of metals. Although the content is only in a ppm order of magnitude, it can produce a large number of electrons. For instance, the dry weight of vegetation contains up to 3.4% potassium salt. The ionization energy of potassium salt is relatively low, such as K2CO3 is 3.79 eV. When the burning efficiency of vegetation is 98%, 28% of potassium salt is dissolved. Thermal ionization of alkali metals can be expressed by Formula (3).
S(g) → S(g)+ + e
The high temperature of flame decreases the gas density and increases the average free travel of electrons. The ionization energy of the gas molecule does not change with the increase of temperature. Therefore, collision ionization is more likely to occur under flame conditions. Vegetation flames are filled with these positive and negative ions. Some small particles produced by combustion will continuously adsorb free ions or collide with charged particles when they float upward. Finally, small charged particles of the chain or agglomeration type are formed. The particles can reach the saturated charge in the flame. The saturated charge qs of the particle can be calculated by Formula (4) [18].
q s = 3 ε r ε r + 2 π ε 0 d p 2 E
where εr is relative permittivity, ε0 is vacuum permittivity, dp is particle diameter, and E is electric field strength.

3.1.2. Motion Control Equation of Combustion Particles

The fluid motion produced by a high temperature vegetation flame is typical turbulence. Compared with the standard model, the κ-ε model based on the renormalization group (RNG) takes turbulent vortices into account. The RNG κ-ε model is selected to describe the fluid field in this paper. The control equation is shown in Formulas (5) and (6).
( ρ κ ) t + ( ρ κ u i ) x i = x j [ ( μ + μ t σ κ ) κ x j ] + μ t u i x j ( u j x i + u i x j )
( ρ ε ) t + ( ρ ε u i ) x i = x j [ ( μ + μ t σ ε ) ε x j ] + C 1 ε ε κ μ t u i x j ( u j x i + u i x j ) C 2 ε ρ ε 2 κ R ε
where κ is turbulent kinetic energy, ε is turbulent dissipation rate, σκ and σε are the turbulent Plante numbers of κ and ε, respectively, and C and C2ε are the computational constants for the models.
Due to the low concentration of particles, gas-solid flow in the dispersed phase can be used for analysis. The forces acting on moving particles in fluids usually include traction, gravity, buoyancy, saffman lift, thermophoresis, pressure gradient force, virtual mass force, etc. When the number of particles is small and the gas density is far less than the particle density, the forces acting on the particles are mainly the heading force, electric field force and the acceleration due to gravity. The other forces are several orders of magnitude smaller than the main forces. They can be neglected in simplifying calculation. The equation of motion of particles can be described as Formulas (7)–(9).
m p d u p / d t = F D + F E + F g
F D = m p ( u v ) / τ p τ p = ρ ρ d ρ 2 / 18 μ
F E = q E / m p
where mp is the mass of particles, up is the velocity of particles, FD, FE and Fg are traction, electric field force and gravity, respectively, v is the velocity of fluid, τp is the influence factor, ρρ is the particle density, dρ is the particle diameter, and finally μ is the dynamic viscosity.

3.2. Coupled Model of Multi-Physical Field

As shown in Figure 6, the test area can be divided into three areas: The vegetation area, the equivalent flame area and the smoky area. The total heat release rate is set in both the vegetation area and equivalent combustion area, respectively, in a certain proportion. The proper proportion is selected to make the temperature distribution in good agreement with the experiment. The particles are set to release from the surface of the vegetation areas. The equivalent flame area contains a large number of plasmas. Charged particles are subject to an electric field force and thermal airflow drag force in the gap, and float up above the flame to form the smoky area. Motion analysis of combustion particles involves the interaction of a temperature field, fluid field and electric field. It is complex and difficult to calculate a multi-physical field using a three dimensional (3D) model, especially involving the movement of fine particles. A 2D axisymmetric model is adopted for simplifying this numerical simulation. It can be considered that there is an approximate axisymmetric relationship between the flame center and its surroundings, and the electrostatic field produced by the electrodes has an approximate axisymmetric relationship. In this paper, the flame region is simplified as an axisymmetric model. Because the combustion material is stacked into a square shape, a simplified equivalent treatment is carried out. In order to ensure the same volume, the size of the vegetation area is set to 11.8 cm in radius and 10 cm in height. The flame area is set as a circular platform, and part of the heating power can be applied.
The size of the flame area is set according to the experimental data of different vegetation. The radius of the rod electrode is 1.5 cm, and the length is 15 cm. The boundaries of the whole model are set to open boundaries.
Gas-solid two-phase motion is complex when the vegetation flame burns under DC voltage. If the physical field is considered to be closely related, the mathematical model considering all of the coupling terms will inevitably lead to extremely complex equations which are very difficult to solve. This paper mainly studies the movement of a small number of particles with different sizes. The simulation model is simplified as follows: (1) Considering the small volume ratio of particulate matter, the influence of particulate matter on the fluid motion is neglected; (2) the influence of particles on the background electric field is not considered.
The flow chart of the multi-physical field coupling analysis is shown in Figure 7. Firstly, the temperature field and fluid field are strongly coupled and simulated according to the heat release rate obtained from the experiment. The simulation model is improved by comparing it with the temperature distribution. Then, according to the statistical data of combustion particle size, the charge of particles is set. The maximum charge of particles does not exceed the saturated charge. Finally, the coupling simulation of particle motion, fluid field and electric field is carried out. The forces on particles and movement of the particles are simulated and analyzed.

4. Analysis of Simulation Results

4.1. Simulation Results of Temperature and Fluid Field

For instance, when straw burns steadily, the heat release rate is set at 15.93 kJ/s. The heat release rate is applied to the vegetation area and the equivalent flame area, correspondingly. By adjusting the equivalent flame area, the temperature distribution is closer to the experimental situation. The flame will oscillate in the process of steady combustion. The simulation results are shown in Figure 8.
The maximum temperature is about 500 °C and is close to the test results. The temperature near the stacking area is lower than that in the exterior flame area. The temperature decreases gradually with the increase in height from the outer flame area upward. These laws are in agreement with the experimental results. The average temperature of a period on the central axis is compared with the experimental measurements, as shown in Table 1. The deviation is about 10%. There are still some differences in the overall temperature distribution. The main reason is the uniform distribution of heat release rate in the flame zone, which is different from the actual situation. The initial velocity of flame fluid at the wood stack ranges from 0.25 m/s to 0.1 m/s. The velocity of fluid from the inside to the outside of the flame decreases gradually.

4.2. Analysis of Force and Motion Characteristics of Combustion Particles

50 kV DC voltage with positive and negative polarities is applied to the electrodes respectively. Particles with different sizes and charges are set up to simulate and analyze. The gravity action is considered. The electrode is set to positive polarity. The combustion particles are set up with different mass, charge polarity and quantity. Firstly, five initial points are selected along the edge of the vegetation, and the overall trajectory of the particles is shown in Figure 9. When the polarity of the particles is the same as that of the electrode, the particles are mainly affected by the drag force of the fluid in the initial drift stage.
Particles rise with hot air flow, and diffuse slowly outward at the same time. When the particles approach the height near the electrode, the electric field increases and is just in the vertical direction. The particles move outward rapidly under the action of electric field force. The closer the electrode is, the stronger the electric field force is. When the polarity of the particles is opposite and approaching the height near the electrodes, the particles are attracted by the electric field and move towards the electrode. For a certain charge-mass ratio, there is a critical distance from the flame center. The particles will be adsorbed by the electrode when the distance between particle and electrode is less than the critical distance. Beyond the critical distance, the particles will re-move away from the electrode along with the hot air flow.
Then the force acting on the particles in the whole process is analyzed. Take a charged particle as an example, the variations of air drag force, electric field force and gravity are shown in Figure 10. Particles begin to rise from the initial position at a certain initial velocity. When the polarity of the particles is the same as that of the electrodes, the particle rises under the action of drag force to overcome the influence of gravity and of the electric field. As the electric field force increases near the electrode, the drag force increases rapidly. When away from the electrode, the drag force and electric field force in the x-axis direction decrease gradually. When particles move from below the electrode to above it, the electric field force in the y-axis direction will be reversed, and the corresponding air drag force direction will also be reversed, and then gradually reduce. When the polarity of particles is opposite to that of electrodes, there are two situations: One is that the particles are adsorbed by the electrodes, the other is not adsorbed. In initial period, particles are subjected to electric field force and drag force to overcome gravity and rise. When the particle rises near the electrode height, the x-axis electric field force increases rapidly, which makes the particle move toward the electrode. The Y-axis electric field force increases slowly and then decreases as it approaches the electrode. If the particles are adsorbed by the electrodes, the y-axis electric field force is approximately 0, and the x-axis electric field force reaches the maximum. If the particles are not adsorbed by the electrodes, the particles are first close to the electrodes and then far away. The Y-axis electric field force and air drag force will be reversed, and because it is closer to the electrode, the reverse peak will be larger, and then gradually decrease.
As shown in Figure 11a, when the particle size is the same, the larger the charge-mass ratio, the greater the longitudinal drag force on the particle. When the particle is near the center of the flame, the drag force on the particle will increase gradually. As shown in Figure 11b, when the charge of particles is constant, the larger the particle size, the larger the longitudinal drag force. With the increase in size, the drag force of fluid mainly balances gravity, and the electric field force is relatively small. When the particle size is large, the distance between the particle and the center has little effect on the drag force.
As shown in Figure 12a, the particles are easily adsorbed by electrodes when the charge of particles is large. Although the drag force decreases with the distance from the electrode, the electric field force decreases more. The farther away from the electrode, the harder the charge is to be absorbed. As shown in Figure 12b, the farther away from the electrode, the larger the critical charge-mass ratio required for particles to be adsorbed by the electrode, and the critical charge-mass ratio decreases with the increase of particle size. Under the same charge-mass ratio, larger particles are easier to be adsorbed by the electrode.

5. Conclusions

In this paper, combustion experiments under DC voltage are carried out using typical vegetation. The heat release rate and spatial temperature distribution of vegetation combustion were measured. The shape and size of combustion particles were collected and analyzed. Through the coupled simulation of the temperature field, fluid field, electric field and particle motion, the forces on particles and the movement of the particles are analyzed. Combining with the actual vegetation combustion heat release rate, the simulation analysis is carried out. The model is modified by comparing with the actual temperature distribution. The simulation results are in good agreement with the experimental results. The situation of ash and carbon black particles in flame was obtained by experiments. In this paper, the motion of carbon black particles with different sizes is mainly analyzed. The force acting on the combustion particles is constantly changing during the rising process. When the charge of particles is the same as the polarity of the electrodes, the electric field force is always opposite to the drag force. When the charge of the particle is opposite to the polarity of the electrode, the particle will approach the electrode. The larger the charge-mass ratio, the easier it is to be captured and adsorbed by the electrodes, and the more charged are the particles farther away from the electrodes. Under the same charge-mass ratio, the larger the particle size, the easier it is to be captured by the electrode. The number of particles with a positive polar charge in flame is larger than that with a negative polar charge. The distribution characteristics of particles are different under positive and negative polarity DC voltage. The influence of charge statistical distribution on the space electric field will be considered for further analysis.

Author Contributions

Z.P. and T.W. propose the main idea of the paper. G.Z. and B.Y. conceived and designed the experiments. P.L. and C.Z. performed the experiments. Z.P. and C.Z. analyzed the data. The paper is written by Z.P. and is revised by T.W. and Y.X.

Funding

This work has been supported by the Natural Natural Science Foundation of China project (51607103).

Conflicts of Interest

The authors declare no conflict of interest.

References

  1. Hu, Y.; Liu, K.; Wu, T.; Liu, Y. Analysis of influential factors on operation safety of transmission line and countermeasures. High Volt. Eng. 2014, 40, 3491–3499. [Google Scholar]
  2. Zhou, Z.Y.; Ai, X.; Lu, J.Z. A real-time analysis approach and its application for transmission-line trip risk due to wildfire disaste. Proc. CSEE 2017, 37, 5321–5330. [Google Scholar]
  3. Huang, D.; Shu, Y.; Ruan, J.; Hu, Y. Ultra-high voltage transmission in China: Developments, current status and future prospects. Proc. IEEE 2009, 97, 555–583. [Google Scholar] [CrossRef]
  4. Maabong, K.E.; Mphale, K.; Letsholathebe, D.; Chimidza, S. Measurement of Breakdown Electric Field Strength for Vegetation and Hydrocarbon Flames. J. Electromagn. Anal. Appl. 2018, 3, 53–66. [Google Scholar] [CrossRef]
  5. Sukhnandan, A.; Hoch, D.A. Fire induced flashovers of transmission lines: Theoretical model. In Proceedings of the IEEE Africon 6th Africon Conference in Africa, George, South Africa, 2–4 October 2002. [Google Scholar]
  6. Wu, T.; Ruan, J.; Hu, Y.; Liu, B.; Chen, C. Study on forest fire induced breakdown characteristics and mechanism of 500kV transmission line. Proc. CSEE 2011, 31, 163–170. [Google Scholar]
  7. Peng, L.; Jiangjun, R.; Daochun, H. Study on Breakdown Characteristic and Discharge Model of Conductor-plane Gap Under Typical Vegetation Flame. Proc. CSEE 2016, 36, 4001–4010. [Google Scholar]
  8. Robledo-Martinez, A.; Guzman, E.; Hernandez, J.L. Dielectric characteristics of a model transmission line in the presence of fire. IEEE Trans. Electr. Insul. 1991, 26, 776–782. [Google Scholar] [CrossRef]
  9. Mphale, K.M.; Heron, M.; Ketlhwaafetse, R.; Letsholathebe, D.; Casey, R. Interferometric measurement of ionization in a grassfire. Meteorol. Atmos. Phys. 2010, 106, 191–203. [Google Scholar] [CrossRef] [Green Version]
  10. Naidoo, P.; Swift, D.A. Large particle initiated breakdown of an atmospheric air gap: Relating to AC power line faults caused by sugar cane fires. In Proceedings of the 8 th International Symposium on High Voltage Engineering, Yokohama, Japan, 23–27 August 1993. [Google Scholar]
  11. Fonseca, J.R.; Tan, A.L.; Silva, R.P.; Monassi, V.; Assuncao, L.A.R.; Junqueira, W.S.; Melo, M.O.C. Effects of agricultural fires on the performance of overhead transmission lines. IEEE Trans. Power Deliv. 1990, 5, 687–694. [Google Scholar] [CrossRef]
  12. Daochun, H.; Peng, L.; Jiangjun, R.; Yafei, Z.; Tian, W.U. Review on discharge mechanism and breakdown characteristics of transmission line gap under forest fire condition. High Volt. Eng. 2015, 41, 622–632. [Google Scholar]
  13. Hexun, X.I.; Guangfu, T.A.N.G.; Junzheng, C.A.O.; Jie, L.I.U.; Xiaoguang, W.E.I. Research porgress of electromagnetic field and electromagnetic compatibility of UHVDC converter valves. Proc. CSEE 2012, 32, 1–6. (In Chinese) [Google Scholar]
  14. Hu, Y. Analysis on operation faults of transmission line and countermeasure. High Volt. Eng. 2007, 33, 1–8. (In Chinese) [Google Scholar]
  15. Wu, T.; Hu, Y.; Ruan, J.J.; Liu, K.; Liu, T.; Chen, C. Air gap breakdown mechanism of model AC transmission line under forest fire. High Volt. Technol. 2011, 37, 1115–1122. (In Chinese) [Google Scholar]
  16. Hu, X.; Lu, J.Z.; Zeng, X.J.; Zhang, H.X. Ayalysis on transmission line trip caused by mountion fire and discussion on tripping preventing measure. J. Electr. Power Sci. Technol. 2010, 25, 73–78. (In Chinese) [Google Scholar]
  17. You, F.; Chen, H.; Zhang, L.; Zhang, Y.; Zhou, J.; Zhu, J. Experimental study on flashover of high-voltage transmission lines induced by wooden crib fire. Proc. CSEE 2011, 31, 192–197. (In Chinese) [Google Scholar]
  18. Pu, Z.; Xiong, Y.; Wu, T.; Lu, Z.; Fang, C. Simulation Analysis on Influence of Combustion Particles on the Gap Electric Field under DC Voltage. In Proceedings of the 2018 IEEE International Conference on High Voltage Engineering and Application, Athens, Greece, 10–13 September 2018. [Google Scholar]
Figure 1. Experimental arrangement of typical vegetation combustion and measurement.
Energies 12 03596 g001
Figure 2. Arrangement of typical vegetation.
Energies 12 03596 g002
Figure 3. Comparison of flame temperature distribution between the wooden crib and straw.
Energies 12 03596 g003
Figure 4. The stable combustion flames of four combustible materials.
Energies 12 03596 g004
Figure 5. Typical ashes of four kinds of combustions.
Energies 12 03596 g005
Figure 6. Equivalent Model of the Vegetation Flame Gap under Direct Current (DC) Voltage.
Energies 12 03596 g006
Figure 7. Flow chart of the multi-physical field coupling simulation.
Energies 12 03596 g007
Figure 8. Coupled simulation results of temperature and fluid field in straw combustion.
Energies 12 03596 g008
Figure 9. The overall trajectory of the combustion particles.
Energies 12 03596 g009
Figure 10. Force analysis of combustion particles.
Energies 12 03596 g010
Figure 11. Force analysis of particles under the same polarity.
Energies 12 03596 g011
Figure 12. Force analysis of particles under different polarities.
Energies 12 03596 g012
Table 1. Comparison of temperature data between experiment and simulation.
Height (cm)Experimental Data (°C)Simulation Data (°C)Deviation (%)
154654219.03
253873655.68
353063183.92

