Research on Windage Yaw Flashovers of Transmission Lines under Wind and Rain Conditions


1
Department of Mechanical Engineering, North China Electric Power University, Baoding 071003, China
2
Hainan Electric Power Research Institute, Haikou 570100, China
*
Author to whom correspondence should be addressed.
Energies 2019, 12(19), 3728; https://doi.org/10.3390/en12193728
Submission received: 26 July 2019
/
Revised: 13 September 2019
/
Accepted: 25 September 2019
/
Published: 29 September 2019
Abstract
:Windage yaw flashovers under strong wind and rain conditions leave a negative impact on the safe operation of transmission lines. However, the mechanism behind this is not well known yet. Therefore, this paper proposes a systematic method, including three basic parts described as simulation of wind and rain loads, calculation of windage yaw, and flashover analysis, to analyze windage yaw flashovers of transmission lines. The YanMeng-particle swarm optimization (YanMeng-PSO) algorithm is proposed to enhance the simulation accuracy. Unlike the conventional approach, the windage yaw status of conductors and insulator strings is dynamically described with key nodes and the breakdown voltage of their clearances rather than windage yaw angle. Furthermore, in the second part, a new method named key-node method (KNM) is proposed to calculate the conductors’ windage yaw. Moreover, the rain effect is also considered in this paper. This paper then presents a case study on a 110 kV double-circuit transmission line section that suffered severe collapse when the typhoon Rammasun landed in Hainan island. Particular focus was placed on the windage yaw flashover before the structural failure of the transmission line. The results validated the significant rain effect and found that conductors/ground suffer more severe windage yaw flashover than insulator strings. Finally, constructive solutions such as interphase spacers, reasonable conductor arrangement in the design phase, and regular measurements and adjustments of conductor sag in the maintenance phase are proposed to improve the design of transmission lines to enhance their capacity against windage yaw flashovers.
1. Introduction
Windage yaw flashovers due to extreme wind and rain conditions under typhoon weather greatly threaten the stability of transmission lines, especially for the coastal area with an average of nine typhoons landing [1]. According to the accident analysis report provided by the Hainan power grid, there were totally 117 trippings that happened in transmission lines with a voltage level of 35 kV and above in Hainan when the super typhoon Rammasun landed. About 29.42% of trippings were ascertained to be caused by towers collapses and strand fractures, while 59 trippings accounted for approximately 50.43% of the total due to unknown reasons, which were likely to be windage yaw flashovers. Therefore, to reduce the losses caused by strong wind and rain conditions under typhoon and ensure the stability of transmission lines, it is of great significance to study the mechanisms of windage yaw flashovers. Figure 1 shows the windage yaw phenomenon during transmission line operation under wind conditions.
Numerous studies across the world have made their contributions to this area. Deng and Yang tried to study the response of a tower-line system under wind conditions through numerical simulation [2,3]. An’s research based on numerical simulation considered both wind and rain effect [4,5]. However, their study mainly focused on structural failure of towers. Liu Xiaohui tried to study windage yaw of transmission lines under loads through numerical simulation [6], however, without rain effect taken into account. Numerous studies care about the insulation performance of air clearance under certain conditions, which can provide some contributions to the design and maintenance of transmission lines to reduce the risk of flashover. In 2002, Yamagata carried out the full-scale experiment on insulation with different gap lengths in dry and wet conditions using shielding rings [7]. Hu [8] studied the influence of rain and wind on power frequency breakdown characteristic of conductor-to-tower clearance in 2008. These literatures offered convincing data about the breakdown characteristics of air clearance based on experiments. At the same time, some researchers tried to analyze windage yaw of insulator strings and wires due to wind and rain loads. Yan et al. [9] introduced a numerical model of transmission line section to calculate the dynamic swing of the suspension insulator. Chao Zhou [10] proposed a model with derived stability criterion to analyze the large swing of the overhead conductor under wind and rain conditions. These two studies have made valuable work in this area, however, they just studied the motion of windage yaw, without considering the flashover characteristics of clearance under windage yaw situation. Moreover, windage yaw of insulator strings and conductors/ground wires are both critical for transmission lines, requiring comprehensive consideration in the study.
Therefore, a systematic analysis method consisting of three basic parts is proposed to analyze the windage yaw flashovers of transmission lines in this paper. The wind and rain loads are simulated using a corresponding numerical model according to the data established by the Chinese meteorological station. Furthermore, the YanMeng-particle swarm optimization (PSO) algorithm is proposed to enhance the simulation accuracy of average wind speed. Then windage yaw is calculated with a tower-line system model built up using the finite element method. A new approach named key-note method (KNM) is put forward to calculate the conductors/ground wires’ windage yaw. The safety factor, R, is introduced to conduct the flashover analysis. Finally some constructive improvements about transmission line design can be put forward according to the analysis results.
2. Windage Yaw Flashover Analysis Method
2.1. The Proposed Method
As shown in Figure 2, a systematic procedure was introduced to conduct analysis of the transmission line windage yaw flashovers. There were three basic parts in the procedure: simulation of wind loads, windage yaw calculation, and flashover analysis. In the first part, the 10 min average wind speed at 10 m height was simulated using the YanMeng typhoon model that was dynamically optimized by a PSO algorithm, which is called YanMeng-PSO in this paper. Meanwhile, the fluctuating wind speed was simulated using a power spectrum. The dynamic response simulation of the tower-line system model was then conducted using the finite element method with wind and rain loads applied. Moreover, the transmission line windage yaw was calculated in the second part. After that, the safety factor, R, was used to evaluate the flashover danger that a transmission line may encounter under strong wind and rain conditions. Finally, findings about the transmission line windage yaw flashovers were obtained through the analysis.
2.2. Simulation of Wind Loads
The wind loads under typhoon weather generally consist of two parts, average wind loads and fluctuating wind loads. The average wind speed at 10 m height during the typhoon Rammasun can be simulated with the YanMeng typhoon wind field considering the friction effect in the boundary layer [11,12]. Its equilibrium equation is written as:
where vt is the typhoon wind speed, ρa is the air density, fc is the Coriolis force parameter, and Ft is the boundary layer friction force, k is a unit vector.
The simulation accuracy greatly depends on two critical parameters in the YanMeng wind field, the equivalent roughness length, z0, and the Holland pressure profile parameter, B. z0 describes the friction impact on vt due to topography, while B directly decides the pressure distribution in the wind field, as shown in Equation (2) [13]:
where P0 is the typhoon center pressure; Rm is the maximum wind speed radius; B is the Holland pressure profile parameter; with P∞ taken as 1010 hPa.
They are both highly related to the simulation accuracy of typhoon average wind speed. Therefore, to enhance to simulation accuracy, the two parameters were dynamically determined by an algorithm named YanMeng-PSO, instead of by the conventional way, data fitting, in this paper.
The YanMeng-PSO algorithm creatively connects a typical PSO algorithm [14] and the YanMeng wind field together. The basic idea of a typical PSO comes from the predation behavior of a bird swarm in nature. To find out the best place with the most food, each bird in the swarm keeps improving its search strategy according to its own experiences and predation information provided by other birds. In the YanMeng-PSO algorithm, what a particle does is similar to what a bird does. Each particle carries a z0 and B and keeps searching for better parameters according to its own search experience, which is also called individual experience. All particles share their search experience with each other to find out the best value of the two parameters. So a particle can obtain search experience form other particles. This is called social experience. Then, a particle changes its z0 and B considering both individual experience and social experience.
The brief procedure of YanMeng-PSO is shown in Figure 3.
1. Parameter initiation
As the first step of the whole YanMeng-PSO procedure, a few critical parameters are required to be determined in this part before the algorithm functions. The swarm size represents the total amount of particles in the swarm. Greater swarm size can speed up the convergence, however, this brings heavy calculation workload for computers. It was taken as 500 in this paper. Number of iteration represents how many times the swarm conducts the search. Less iterations may cause instability of solution while more iterations can slow down the calculation speed. It was determined as 100 through numerous tests.
2. Objective function calculation
The second step is particle objective function calculation. Every time the swarm conducts the search, an objective function is used to evaluate the performance of each particle with the contrast between the simulated wind speed/direction and real-time measured wind speed/direction. The objective function used is expressed by the Equation (3):
where F is the objective function value for a particle, vt is the simulated average wind speed, vr is the real-time measured average wind speed, Ψt is the simulated average wind direction, θr is the real-time measured wind direction.
3. Experience update
Then it will be evaluated whether the best objective function value for the whole swarm is great enough, in other words, whether the simulated average wind speed meets the accuracy conditions. If not, it will go to the next part, experience update. Each particle needs to update the optimization experience in iteration, including individual experience and social experience.
4. Parameter adjustment
In the most cases, individual experience is different from the social experience. Therefore, a particle needs to make a decision about parameter adjustment considering both of them. For any particle, i, the adjustment of parameter B during the YanMeng-PSO procedure is conducted according to the following Equations (4) and (5):
where ΔBi is the adjustment of parameter B for particle i in the current iteration, ΔBi′ is the adjustment of parameter B for particle i in the last iteration, cita is the inertia constant, cind is the constant of individual experience, rind is a random value for individual experience, Bind is the best value of B ever found in history for particle i, Bi is the value of B for the particle i in the current iteration, Bi′ is the value of B for the particle i in the last iteration, cswm is the constant of swarm experience, rswm is a random value for swarm experience, Bswm is the best value of B ever found in history for the whole swarm. The adjustment of parameter B is illustrated in Figure 4.
The adjustment of the parameter z0 is the same as that of B, expressed as:
where Δz0i is the adjustment of parameter z0 for particle i in the current iteration, Δz0i′ is the adjustment of parameter z0 for particle i in the last iteration, z0ind is the best value of z0 ever found in history for particle i, z0i is the value of z0 for the particle i in the current iteration, z0i′ is the value of z0 for the particle i in the last iteration, z0swm is the best value of z0 ever found in history for the whole swarm.
After the parameter adjustment, the YanMeng-PSO algorithm will carry on to the next iteration. The circle will keep functioning until the average wind speed meets the accuracy conditions.
2.3. Calculation of Rain Loads
During the rainfall accompanying the typhoon, the speed of the raindrops reduces sharply to become 0 when they collide with transmission line towers or wires. This process follows Newton’s second law. The mass of the raindrop, mr, is expressed as [15,16]:
where dr is the diameter of the raindrop, ρr is the density of rainfall.
mr = ρrπdr3/6,
The action time is τ = dr/(2Vrs), according to the momentum theorem:
where, Vrs is the raindrop’s velocity before the collision. The mean impinging force, F(τ), of a droplet during time τ is:
The action area on of each raindrop is Ar = πdr2/4, and the action force of raindrop can be converted into a uniform load using Equation (11):
The rain load (N/m) calculation can be simplified to be Equation (12).
where αr is the percentage of raindrops per unit volume of air at a certain rainfall intensity; br is the effective width of the object impacted. It is taken as the diameter for the conductor and ground wire and as the equivalent width of each panel for the tower body. The equation for calculating αr is:
where N(D) is the number of the raindrops with diameter D of per unit volume of air in 1/mm3. In order to establish a more accurate rain load model, the distribution of corresponding raindrops and raindrops during rainfall should be addressed. The Marshall–Palmer exponential distribution [17] is used to describe how the number of raindrops distributed with the size of the raindrops, as shown in Equation (15):
where n0 = 8 × 10³ in 1/(m3·mm), the gradient factor Λ = kΛRh−0.21 in 1/mm, constant kΛ = 4.1(h/mm)−0.21, Rh is the horizontal rain intensity in mm/h.
2.4. Calculation of Windage Yaw
In the Chinese code of transmission line design [18], the most emphasis will be put on insulator string windage yaw for it is taken as the main reason for the flashover. With the wind and rain loads applying on insulator strings and conductors, the conductor suspension points get close to the tower body and the cross-arm, which may lead to flashover phenomenon if the spacing is reduced to below the permissible value for the certain voltage level. What is more, the windage yaw of conductors/ground wires is also considered and studied through the numerical simulation in this paper to find out the root cause of transmission line trippings under strong wind conditions.
With wind and rain loads applied, the finite element model of tower-line system needs to be built up according to the detailed information of transmission line, such as the structure of towers, the span of line, etc. The dynamic response of the finite element model with a certain duration is simulated to calculate windage yaw.
2.4.1. Calculation of Insulator String Windage Yaw
So far, in the design procedure of overhead transmission line, two kinds of static methods, polygon method and rigid straight bar method, are mainly used for calculation of windage yaw [19,20]. In the transmission line design, the insulator string is usually regarded as a rigid body with a straight rod shape, not considering its relatively tiny bending effect. Figure 5 shows all the loads acting on an insulator string. Then the action point of all loads is moved to the conductor suspension point according to the moment invariance principle. Furthermore, the clearance of the conductor suspension point to the tower, dins1 and dins2 can be derived as the Expressions (17) and (18) using mechanics and geometry.
In Figure 5, Gv is the vertical load of fittings and insulator string; Gh is the horizontal load of fittings and insulator string; Wv is the vertical load of conductor; Wh is the horizontal load of conductor.
where dins1 is the clearance of the conductor suspension point to the cross-arm; dins2 is the clearance of the conductor suspension point to the tower body; L is the length of the cross arm; l is the length of the insulator string; θ is the angle between the insulator string and the vertical direction; α is the angle between the tower outline and the ground; L1 is the central axis in the bottom plane of the cross-arm; L2 is the central axis in the windward side of the tower body.
Though the static methods are convenient to implement as demonstrated above, the bad accuracy cannot be ignored. Therefore, the transmission line windage yaw was calculated through dynamical simulation based on the finite element method in this paper. The three-dimensional tower-line system model was built up according to transmission line characteristics. In the tower-line system model, the spatial position of suspension point, S (x,y,z), and the analytical equation of L1 and L2 can be obtained in the dynamic response simulation. Moreover, the clearance, dins1, is equal to the distance between S and L1, and dins2 is equal to the distance between S and L2.
The shorter clearance, dins, is regarded as the most dangerous clearance in the insulator string windage yaw situation, as expressed in Equation (19):
dins = min{dins1, dins2}.
2.4.2. Calculation of Conductor/Ground Wire Windage Yaw
Unlike the windage yaw of the insulator string, the windage yaw of conductors/ground wires is much more complicated as wires swing asynchronously during the wind loads impact. This paper creatively proposes a new approach named key-node method (KNM) to solve this problem. In this approach, movements of conductor key nodes in the tower-line system model are used to study the mechanisms of conductor windage yaw.
The basic idea of KNM is to estimate the clearance of different conductors/ground wires through investigating the clearance of certain key nodes during the dynamic response simulation of tower-line system model. Before the wind loads were applied on the tower-line system model, conductor/ground wires were in a static state with no windage yaw. Those key nodes approximately in the same X–Y plane are classified to the same group, as shown in Figure 6. The group is called the key-node group (KNG) and the X–Y plane is called key-node-group plane (KNG plane).
Figure 7 shows the basic flow chart of the KNM. The first step in KNM is to choose KNG within the span. Equal and proper spatial distances between two adjacent KNG plane need to be guaranteed. Additionally, each KNG plane represents the windage yaw situation of a different part of the span.
Then clearances of conductor-to-conductor and conductor-to-ground wire are calculated respectively using the Equations (20) and (21):
where Dp-p is the set of the clearance for phase conductor key node to phase conductor key node, pi (i = 1,2,…,m) represents any phase conductor key node, m is the number of the phase conductor key nodes in a KNG plane, Dp-g is the set of the clearance for phase conductor key node to ground wire key node, gi (i = 1,2,…,n) represents any ground wire conductor key node, n is the number of the ground wire key nodes in a KNG plane. dA,B represents the clearance of key node A and key node B. The spatial coordinates of the key nodes A and B can be expressed as (xA, yA, zA) and (xB, yB, zB), and the dA,B is given by Equation (22):
Dp-p = {dpi,pj}(i ≠ j, i,j = 1,2,3,…,m),
Dp-g = {dpi,gj}(i =1,2,3,…,m, j = 1,2,3,…,n),
The minimum clearance of two phase conductor key nodes for a KNG is expressed as
dmin,p-p = min(Dp-p).
Additionally, the minimum clearance of the phase conductor key node to the ground wire key node for a KNG is expressed as
dmin,p-g = min(Dp-g).
dmin,p-p and dmin,p-g stand for the most dangerous clearance, after these two minimum clearances are found, information about their KNG number and their key node number will be recorded for further flashover analysis.
2.5. Flashover Analysis
The windage yaw status of transmission lines is dynamically described with key nodes and the breakdown voltage of their clearances in this paper, different from the conventional static method. The safety factor, R, is proposed to conduct the flashover analysis of the transmission line under strong wind and rain load conditions, as shown in Equation (25):
where Uf is the breakdown voltage of the most dangerous clearances dmin,p-p and dmin,p-g calculated in the Section 2.4 previously. With rain effect correction, Umax is the maximum working voltage of the transmission line during operation under power frequency condition. A smaller R value represents higher danger level, with greater probability of windage yaw flashover. It is reasonable to estimate that flashover can happen when the R is below 1.0—the safety criterion taken in this paper.
R = Uf/Umax,
Uf is calculated using Equation (26):
where U50% is voltage with a breakdown probability of 50%, which is broadly used to describe the characteristics of clearance in electrical engineering. Chinese standard GB 50545-2010 [15] provides the flashover characteristics curve of clearance under a few kinds of situations, as shown in Figure 7. Curve No. 1 in the figure represents the clearance of conductor–conductor and rod–rod, while curve No. 2 stands for the clearance of conductor–tower. U50% of clearance is given according to Figure 8 [18]. It is worth noting that other convincing data based on experiments about flashover characteristics in addition to the Chinese standard GB 50545-2010 are also available in the systematic method.
Uf = krU50%,
kr is the rain effect coefficient. Geng Cui-ying et al. [21] studied clearance breakdown characteristics in rainy weather under power frequency through an artificial simulation test. In this paper, the coefficient of rain effect, kr, was determined by fitting the test data, as expressed by Equation (27):
where d represents clearance; coefficients a1, a2, and a3 were fitted according to experimental data using quadratic polynomial fitting. Table 1 shows the fitting results.
3. Case Study
This paper presents a case study on a section of 110 kV double-circuit transmission line named Baoyi II in Hainan island. It suffered severe collapse when the super typhoon Rammasun swept across Hainan in 2014. The particular focus is placed on the windage yaw situation of transmission line before its structural failure due to the strong wind and rainfall.
3.1. Wind and Rain Load of the Rammasun
Rammasun caused catastrophic damage to the power grid in Hainan province, including 117 tower trippings and 27 tower collapses in several transmission lines of 35 kV, 110 kV, and above. Figure 9 shows the 10 min average wind speed and direction at 10 m height of the Rammasun. It strengthened sharply from 5:00 on July 18 and landed in Wenchang City, Hainan at 15:30 [22].
It is speculated that the collapse of this transmission line section likely occurred at about 15:00 on 18 July because the average wind speed exceeded the design wind speed and the wind attack angle was approximately 90 degrees [23]. Therefore, this study conducted dynamic response simulation at 14:50 on 18 July, slightly before the potential failure moment. The 10 min average wind speed and the wind attack angle were simulated to be 44.47 m/s and 80.73 degrees. The fluctuating wind was then simulated using the Shiyuan wind power spectrum [24] based on the average wind. The following Equation (28) describes the relation between the power of the fluctuating wind and its frequency.
where x = 1200 n/V10; Sv (m2/s) is the fluctuating wind power spectrum; V10 (m/s) is the average wind speed at 10 m height; k is the surface frictional drag coefficient and taken as 0.003; n (Hz) is the fluctuating wind frequency.
Figure 10 shows the fluctuating wind at 10 m height and the power spectral density curve.
It was reported by the Chinese meteorological station that the super typhoon Rammasun brought severe rainfall to Hainan Province. Haikou city, where the transmission line was located, suffered a severe rainfall intensity of more than 100 mm/h. The corresponding load effect and electric effect of rainfall were then simulated in the study.
3.2. Modeling of the Tower-Line System
The tower-line system model with three towers and four spans was built according to the characteristics of the transmission line section, as shown in Figure 11. The insulator string model installed in suspension tangent towers in this transmission line was rod suspension composite insulator FXBW4-110/100, whose technical parameters are shown in Table 2. Table 3 shows the detailed characteristics of conductors and ground wires.
The finite element model of tower-line system was built up with the commercial software ANSYS (15.0, Pittsburgh, PA, USA) according to the characteristics of the transmission line section focused on. In the finite element model, the tower legs and bracing members are modeled with element “beam188”, a 3D two-node beam element in ANSYS with six degrees of freedom per node. Considering that relative rotation and friction effect tend to be very minor, an insulator string and an auxiliary member can be regarded as an equivalent rigid body, modeled with a uniaxial tension–compression (truss) element named “link8” with translational degrees of freedom in the nodal X, Y, and Z directions. Conductors and ground wires were modeled according to catenary equation with numerous “link10” elements, uniaxial tension-only two-node truss elements in ANSYS, considering the slack of conductors and ground wires. At the same time, fixed constraints were applied on the bottom of each tower.
1998 “beam188” elements were used for modeling tower legs and bracing members, 1216 “link8” elements for insulator strings and auxiliary members, and 892 “link10” elements for conductors and ground wires.
3.3. Windage Yaw Flashover Analysis
The wind and rain loads simulated previously were applied on the tower-line system and the dynamic response simulation with a duration of 180 s was conducted using the finite element method. Then, the transmission line windage yaw was calculated through the method mentioned before in Section 2. After that, the safety factor, R, was used to evaluate the flashover danger that the line section might encountered before its structural failure. Figure 12a shows the safety factor, R, of the conductor span between tower No. 39 and No. 40 in time domain. Figure 12b shows the safety factor, R, for three conductor insulator strings of windward side of tower No. 39.
In Figure 12, the bold black line stands for the minimum R value during the dynamic response simulation of 180 s. Every peak below 1.0, the safety criterion, represents a possible windage flashover. There are 34 peaks of the conductors/ground wires and 29 peaks of the insulator string. Detailed information about conductors/ground wires is illustrated in Figure 13.
It can be inferred from Figure 13 that the spatial distance of two wires is the most crucial factor that decides the probability of windage yaw flashover occurring between them. The least value of safety factor, R, occurred between vertically adjacent wires, such as upper conductor and middle conductor, middle conductor and lower conductor, mainly because there were close to each other. The number of peaks for upper conductor and middle conductor reached 13, the largest among all situations, while that for combinations with relatively greater vertical distance such as ground wire and lower conductor, was 0, i.e., much lesser. Another interesting phenomenon is that the combination of the same type of wires rarely encountered flashover, such as upper conductor and upper conductor, middle conductor and middle conductor. It was probably because they were impacted by similar wind loads at the same height.
As mentioned previously, the windage yaw flashover analysis considers the rain effect, including load effect and electric effect. Figure 14 shows the results.
Figure 14 shows the comparison between R value with rain effect and that without rain effect. Conclusions can be drawn as follows: Accompanying heavy rain during the super typhoon Rammasun significantly reduced the safety factor, R, with root mean square (RMS) obviously dropped down. For conductors/ground wires, RMS dropped down from 2.4751 to 1.6531 while that of insulator strings dropped down from 2.5721 to 1.9735. Moreover, the RMS of insulator strings was much less than 3.3642, which was calculated with static method presented in the previous section. Therefore, the rain effect cannot be ignored when studying the windage yaw flashover. On the other hand, it can be seen in Figure 14 that the RMS of the minimum R value of insulator string windage yaw is 1.9735, while the R of conductors/ground wires windage yaw is 1.6531, pointing out that conductors/ground may suffer more severe windage yaw flashover that insulator strings.
4. Conclusions and Future Study
This paper proposes a systematic method to conduct the analysis of transmission line windage yaw flashover. A case study was done on a section of 110 kV double-circuit transmission line named Baoyi II in Hainan island that suffered severe collapse when the typhoon Rammasun landed Hainan island. The conclusions in this study are drawn as follows:
- The analysis of transmission lines windage yaw flashovers was conducted using a creative systematic method proposed in the paper. The first step was to simulate the average wind, fluctuating wind, and accompanying rain loads. Then windage yaw was calculated using the finite element method with tower-line system model built up. Finally, windage flashovers danger was evaluated according to the safety factor, R, which compares the breakdown voltage of the minimum clearance, Uf, and the maximum working voltage, Umax.
- The YanMeng-PSO algorithm was creatively used to improve the simulation accuracy of average wind speed. Additionally, a new approach named KNM was proposed to calculate clearance of conductors/ground wires under strong wind and rain conditions.
- According to the analysis results of the case study, safety factor, R, significantly reduced with rain effect. It dropped down to 1.6531 from 2.4751 for conductors/ground wires while that of insulator strings dropped down to 1.9735 from 2.5721. Therefore, it can be concluded that the heavy rain along with the strong wind has significant impact on transmission line windage yaw in two aspects. One is that raindrops increase the load acting on tower-line system, the other is that raindrops reduce the breakdown voltage of clearance by changing the ambient electric field distribution. The rain effect requires more consideration when it comes to transmission line design. However, it is quite insufficient in the present design code. The design clearance (including interphase clearance and clearance between insulator string to tower) requires appropriate increment to enhance the capacity of lines against windage yaw under wind and rain conditions.
- In the case study results, the RMS of the minimum R value of insulator string was 1.9735, greater than the R of conductors/ground wires, 1.6531. Moreover, the amount of R peaks below the safety criterion for conductors/ground wires was 34, more than that for insulator string, 29. The conclusion is thus drawn that conductors/ground wires suffer more severe windage yaw flashover than insulator strings. There are several ways to reduce the conductors/ground wires windage yaw flashovers. On the one hand, an anti-galloping device such as an interphase spacer is an effective solution reducing the swing of wires. Moreover, reasonable conductor arrangement in design phase and regular measurements and adjustments of conductor sag in maintenance phase are required to ensure that the interphase clearance is within safe arrangement.
As the mechanisms of windage yaw flashover in transmission line are not well known so far, some further study is necessary for the safety and stability of electric power system in coastal areas, maybe including: dynamic calculation of windage yaw for transmission line, windage yaw flashover analysis of bundled conductors, relation between transmission line span and windage yaw flashover.
Author Contributions
Investigation, Z.Z. and R.Z.; Methodology, L.A.; Project administration, L.A.; Writing—original draft, L.A. and Y.G.
Funding
This research was funded by [the National Natural Science Foundation of China] grant number [51675179].
Acknowledgments
The first author has been supported by the National Natural Science Foundation of China (no. 51675179), which is gratefully acknowledged.
Conflicts of Interest
The authors declare no conflict of interest.
Nomenclature:
| ar | percentage of raindrops per unit volume of air at a certain rainfall intensity |
| Br | effective width of the object impacted |
| B | Holland pressure profile parameter |
| Bind | the best B value ever found in history for particle i |
| Bi | B value for the particle i in the current iteration |
| Bi′B | value for the particle i in the last iteration |
| Bswm | the best B value ever found in history for the whole swarm |
| cita | inertia constant |
| cind | constant of individual experience |
| cswm | constant of swarm experience |
| d1 | clearance of conductor suspension point to cross-arm |
| d2 | clearance of conductor suspension point to tower body |
| dmin,p-p | the minimum clearance of two phase conductor key nodes for a KNG |
| dmin,p-g | the minimum clearance of phase conductor key node to ground wire key node for a KNG |
| fc | Coriolis force parameter |
| Ft | boundary layer friction force |
| F | objective function value for a particle |
| Gv | vertical load of fittings and insulator string |
| Gh | horizontal load of fittings and insulator string |
| k | a unit vector |
| k | surface frictional drag coefficient |
| n | fluctuating wind frequency in Hz |
| kr | coefficient of rain effect |
| L | length of cross-arm |
| l | length of insulator string |
| P0 | typhoon center pressure |
| rind | a random value for individual experience |
| rswm | a random value for swarm experience |
| Rm | the maximum wind speed radius |
| Sv | fluctuating wind power spectrum in m2/s |
| U50% | voltage with a breakdown probability of 50% |
| Uf | break down voltage with rain effect correction |
| vt | simulated average wind speed |
| vr | real-time measured average wind speed |
| vt | typhoon wind speed |
| vg | gradient wind speed |
| vf | surface friction wind speed |
| V10 | average wind speed at 10 m height |
| Vrs | speed of the droplet movement before impinging the tower and wires |
| Wv | vertical load of conductor |
| Wh | horizontal load of conductor |
| z0 | equivalent roughness length |
| z0ind | the best z0 value ever found in history for particle i |
| z0i | z0 value for the particle i in the current iteration |
| z0i′ | z0 value for the particle i in the last iteration |
| z0swm | the best z0 value ever found in history for the whole swarm |
| Ψt | simulated average wind direction |
| ΔBi | adjustment of parameter B for particle i in the current iteration |
| ΔBi′ | adjustment of parameter B for particle i in the last iteration |
| Δz0i | adjustment of parameter z0 for particle i in the current iteration |
| Δz0i′ | adjustment of parameter z0 for particle i in the last iteration |
| α | angle between tower outline and the ground |
| θ | angle between the wind and the transmission line |
| Θr | real-time measured average wind direction |
| ρr | rainwater density |
| ρa | air density |
References
- Xiao, F.J.; Xiao, Z.N. Characteristics of tropical cyclones in China and their impacts analysis. Nat. Hazards 2010, 54, 827–837. [Google Scholar] [CrossRef]
- Deng, H.Z.; Xu, H.J.; Duan, C.Y.; Jin, X.H.; Wang, Z.H. Experimental and numerical study on the responses of a transmission tower to skew incident winds. J. Wind Eng. Ind. Aerodyn. 2016, 157, 171–188. [Google Scholar] [CrossRef] [Green Version]
- Yang, S.C.; Hong, H.P. Nonlinear inelastic responses of transmission tower-line system under downburst wind. Eng. Struct. 2016, 123, 490–500. [Google Scholar] [CrossRef]
- An, L.Q.; Guan, Y.Y.; Zhu, Z.J.; Wu, J.; Zhang, R.L. Structural failure analysis of a river-crossing transmission line impacted by the super typhoon Rammasun. Eng. Fail. Anal. 2019, 104, 911–931. [Google Scholar] [CrossRef]
- An, L.Q.; Wu, J.; Zhang, Z.Q.; Zhang, R.L. Failure analysis of a lattice transmission tower collapse due to the super typhoon Rammasun in July 2014 in Hainan Province, China. J. Wind Eng. Ind. Aerodyn. 2018, 182, 295–307. [Google Scholar] [CrossRef]
- Liu, X.H.; Yan, B.; Lin, X.S.; Li, W.Y. Numerical simulation of windage yaw of 500KV UHV transmission lines. Eng. Mech. 2009, 33, 244–249. [Google Scholar] [CrossRef]
- Yamagata, Y.; Oe, A.; Miyake, K.; Aihara, Y.; Shindo, T. Phase-to-Ground and Phase-to-Phase Sparkover Characteristics of External Insulation at the Entrance of a UHV Substation. IEEE Trans. Power Deliv. 2002, 17, 223–232. [Google Scholar] [CrossRef]
- Hu, Y.; Wang, L.N.; Shao, K.W.; Liu, K.; Luo, C.L.; Chen, S.J.; Geng, C.Y. Influence of Rain and Wind on Power Frequency Discharge Characteristic of Conductor-to-tower Air Gap. High Volt. Eng. 2008, 34, 845–850. [Google Scholar] [CrossRef]
- Yan, B.; Lin, X.S.; Luo, W.; Chen, Z.D.; Liu, Z.Q. Numerical Study on Dynamic Swing of Suspension Insulator String in Overhead Transmission Line under Wind Load. IEEE Trans. Power Deliv. 2010, 25, 248–259. [Google Scholar] [CrossRef]
- Zhou, C.; Yin, J.Q.; Liu, Y.B. Large Swing Behavior of Overhead Transmission Lines under Rain-Load Conditions. Energies 2018, 11, 1092. [Google Scholar] [CrossRef]
- Meng, Y.; Matsui, M.; Hibi, K. An analytical model for simulation of the wind field in a typhoon boundary layer. J. Wind Eng. Ind. Aerodyn. 1995, 56, 291–310. [Google Scholar] [CrossRef]
- Meng, Y.; Matsui, M.; Hibi, K. A numerical study of the wind field in a typhoon boundary layer. J. Wind Eng. Ind. Aerodyn. 1997, 67, 437–448. [Google Scholar] [CrossRef]
- Holland, G.J. An analytic model of the wind and pressure profiles in hurricanes. Mon. Weather Rev. 1980, 108, 1212–1218. [Google Scholar] [CrossRef]
- Tsiptsis, I.N.; Liimatainen, L.; Kotnik, T.; Niiranen, J. Structural optimization employing isogeometric tools in Particle Swarm Optimizer. J. Build. Eng. 2019, 24, 100761:1–100761:12. [Google Scholar] [CrossRef]
- Choi, E.C.C. Simulation of wind-driven-rain around a building. J. Wind Eng. Ind. Aerodyn. 1993, 46, 721–729. [Google Scholar] [CrossRef]
- Choi, E.C.C. Determination of wind-driven-rain intensity on building faces. J. Wind Eng. Ind. Aerodyn. 1994, 51, 55–69. [Google Scholar] [CrossRef]
- Marshall, J.S.; Palmer, W.M. The distribution of raindrops with size. J. Atmos. Sci. 1948, 5, 165–166. [Google Scholar] [CrossRef]
- China Electricity Council. GB 50545-2010 Code for Construction and Acceptance of 110kV-750kV Overhead Transmission Line; China Planning Press: Beijing, China, 2010. [Google Scholar]
- St. Clair, J.G. Clearance calculations of conductors to buildings. IEEE Trans. Power Deliv. 1997, 12, 979–984. [Google Scholar] [CrossRef]
- Wang, S.X. Study on Calculation of Anti-Windage Yaw Flashover Performance for UHV Transmission Line; Southwest Jiaotong University: Chengdu, China, 2008. [Google Scholar] [CrossRef]
- Geng, C.Y.; Wei, D.; He, X. Raining Effect on Frequency Breakdown Voltage. High Volt. Appar. 2010, 46, 103–105. [Google Scholar] [CrossRef]
- China Weather Typhoon Net. Available online: http://typhoon.weather.com.cn/ (accessed on 6 September 2019).
- Mara, T.G.; Hong, H.P. Effect of wind direction on the response and capacity surface of a transmission tower. Eng. Struct. 2013, 57, 493–501. [Google Scholar] [CrossRef]
- Lou, W.J.; Xia, L.; Jiang, Y.; Jin, X.H.; Wang, Z.H. Wind-induced response and wind load factor of transmission tower under terrain B wind field and typhoon wind field. J. Vib. Shock 2013, 32, 13–17. [Google Scholar] [CrossRef]
Figure 1.
Windage yaw phenomenon of transmission line.
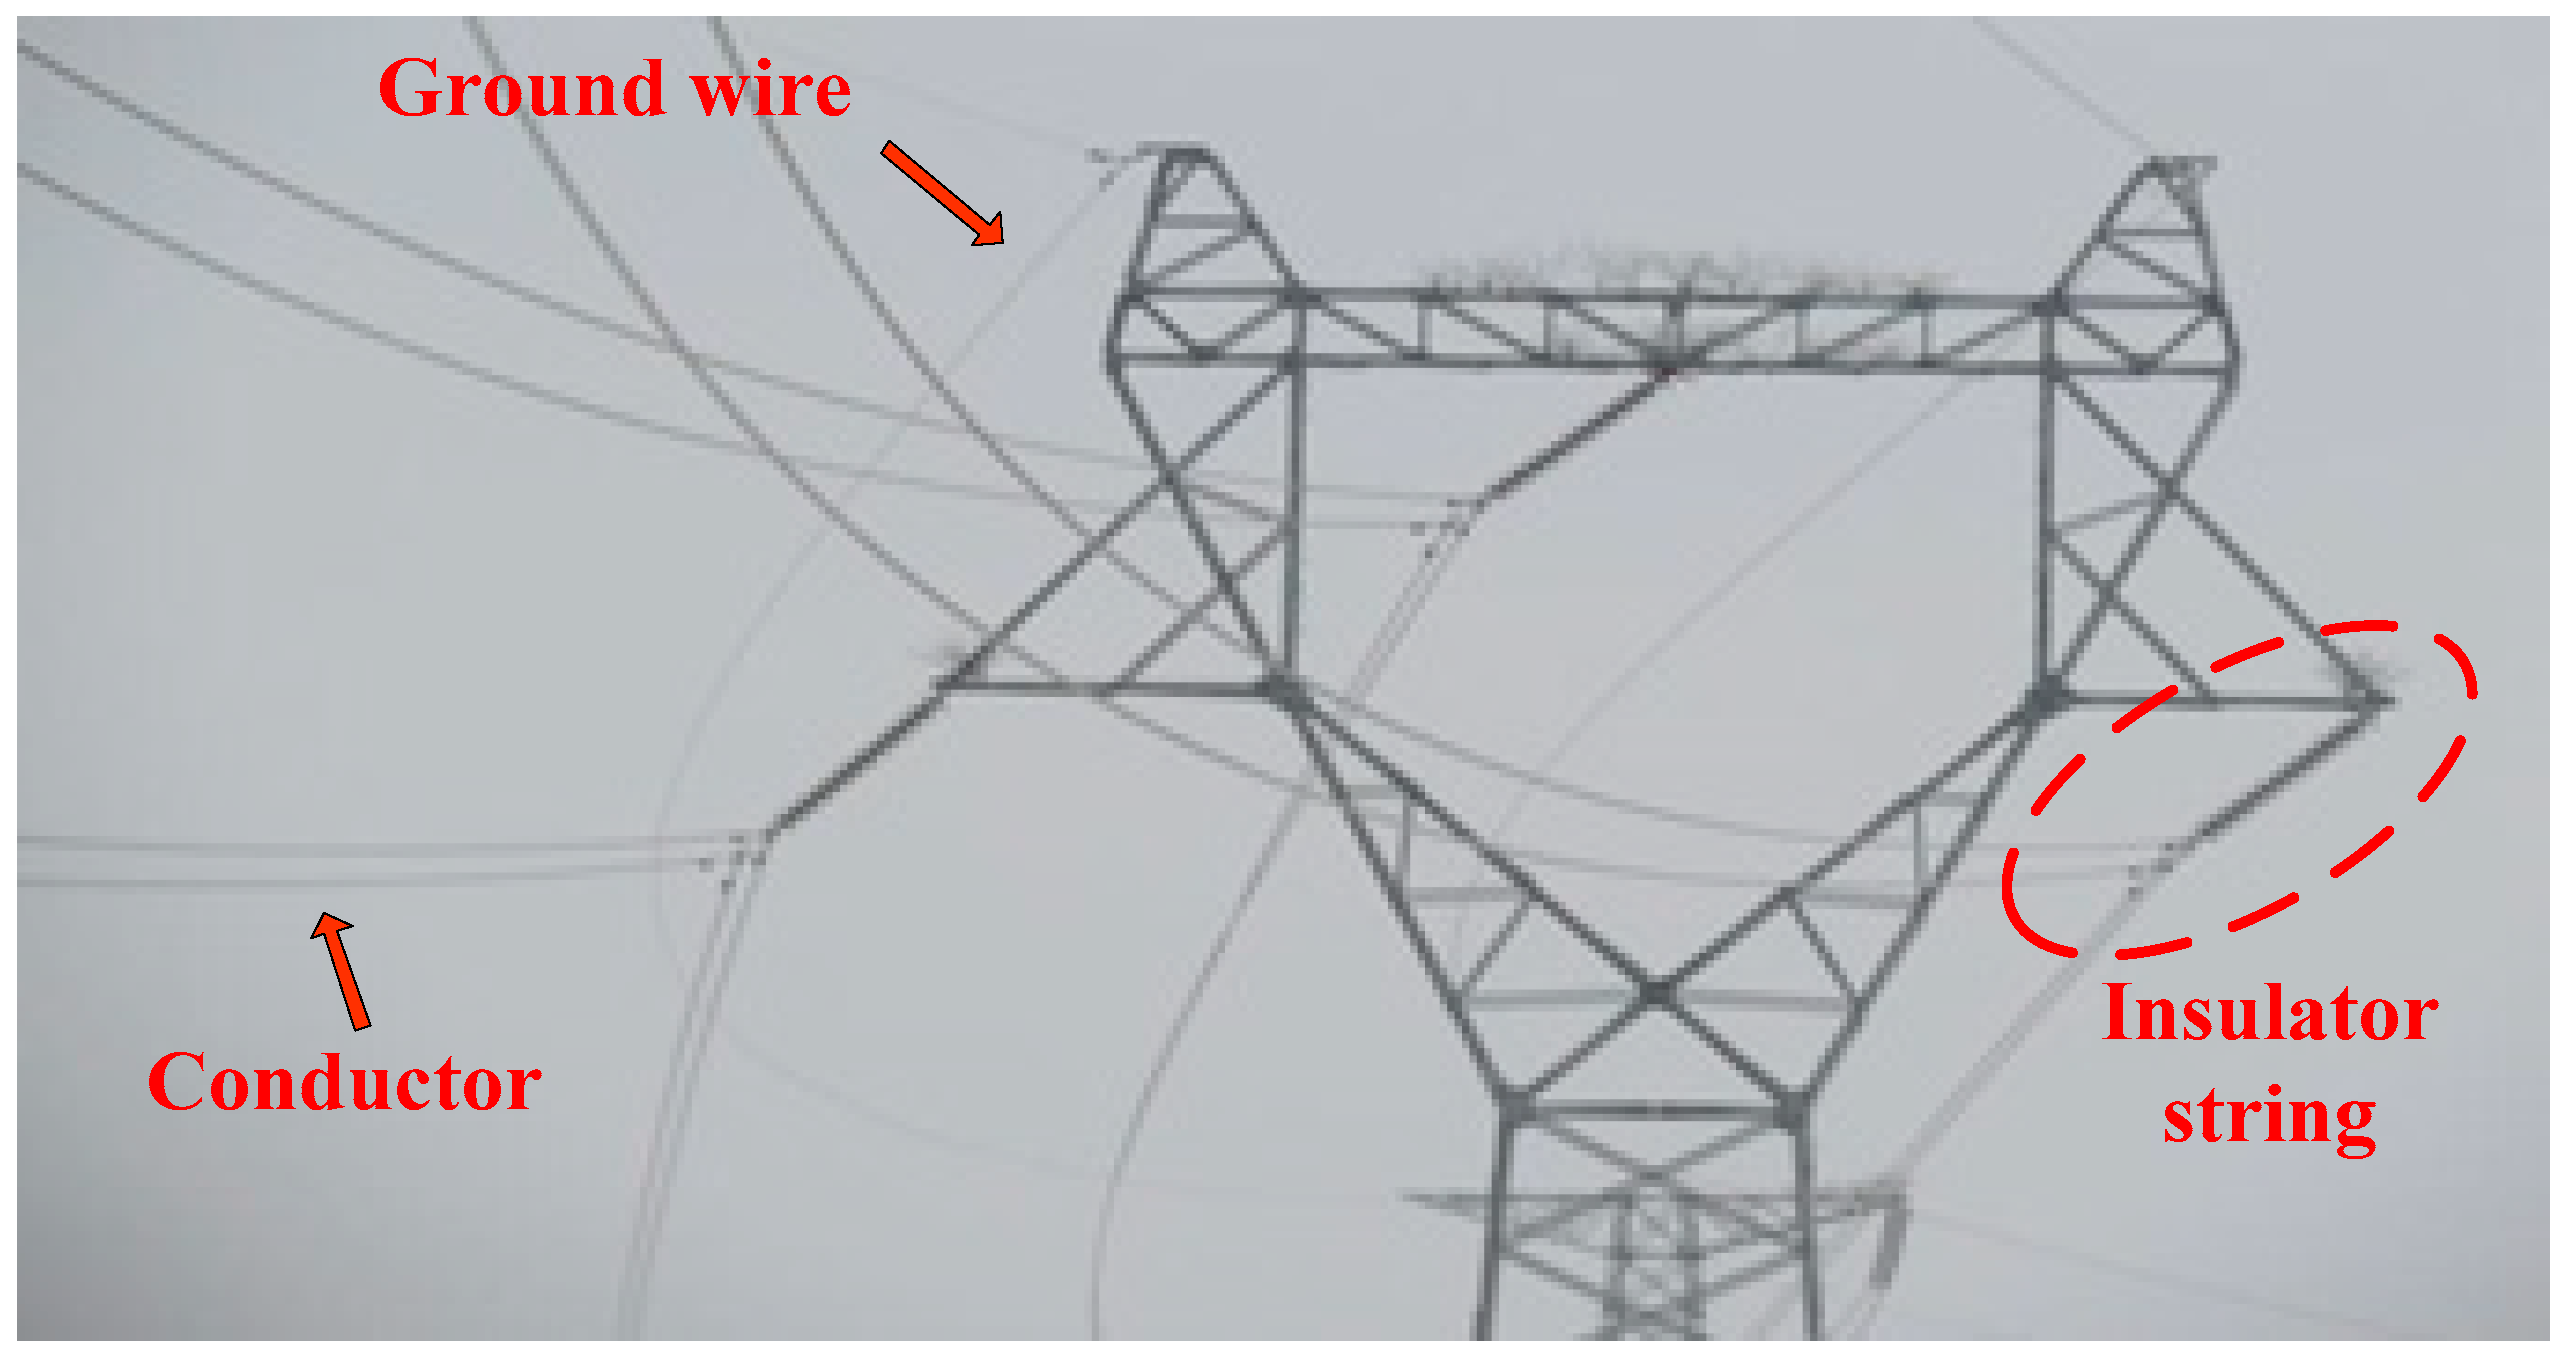
Figure 2.
Procedure of the windage yaw flashover analysis.
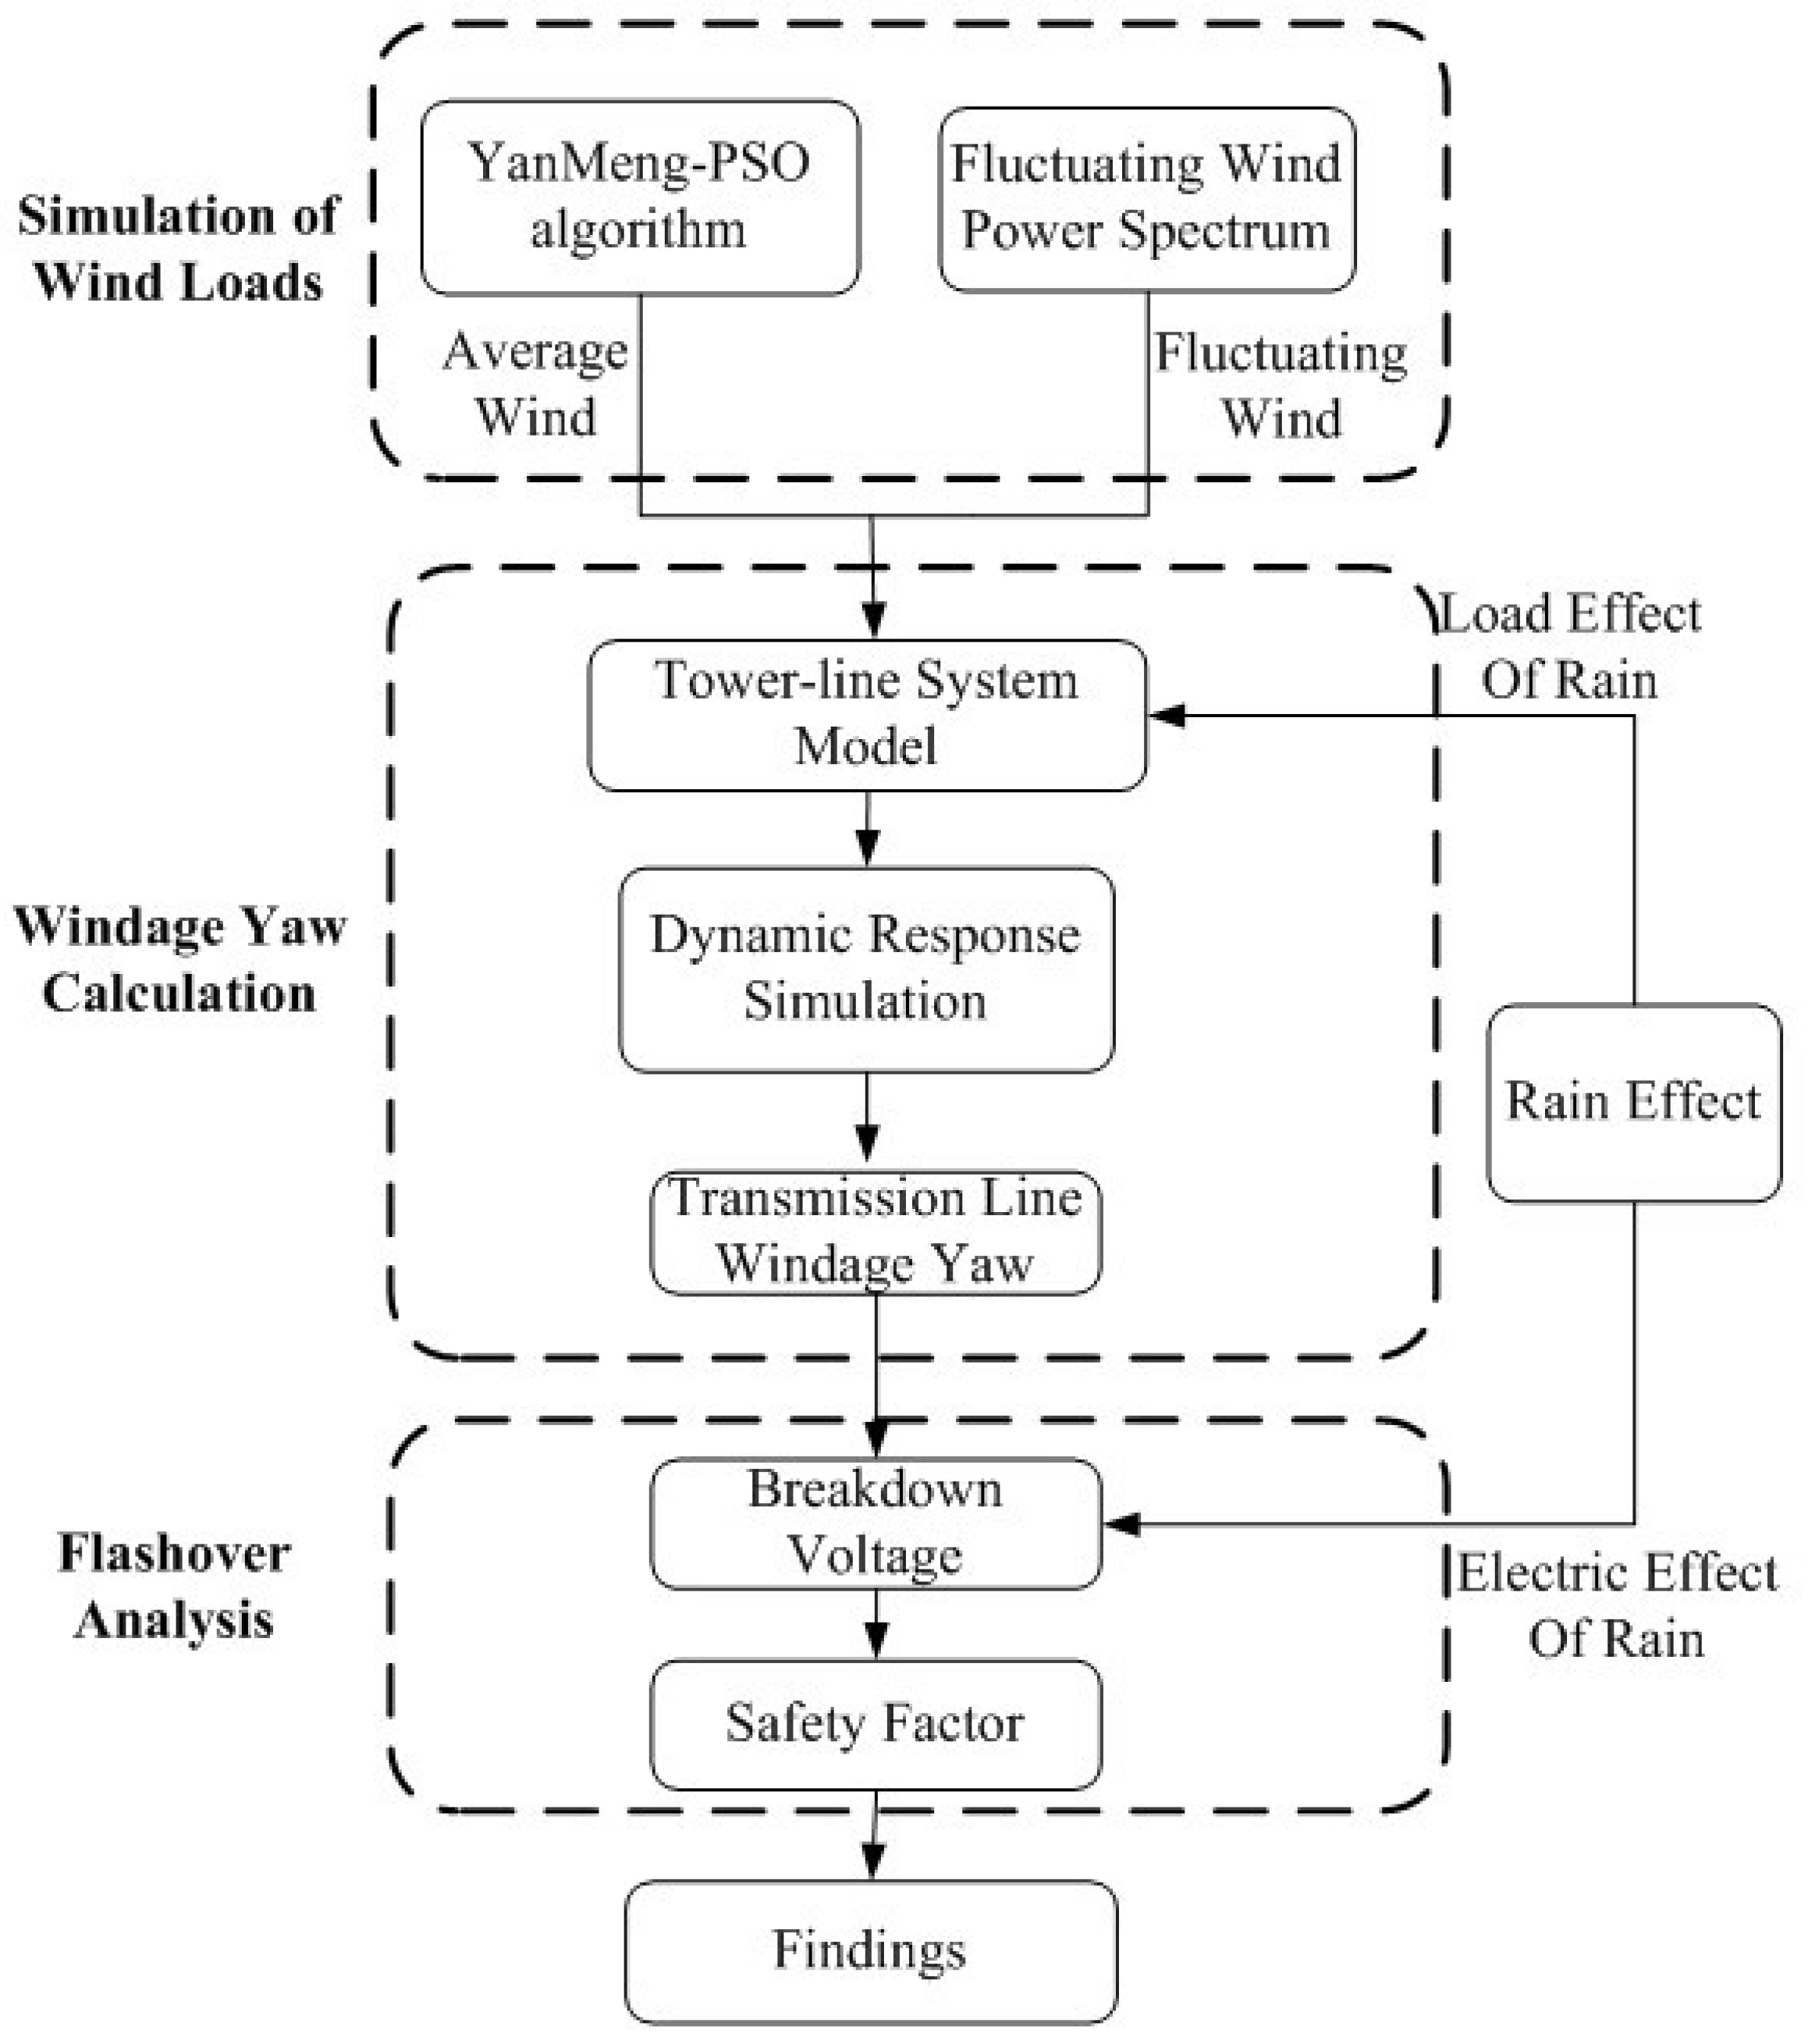
Figure 3.
The flowchart of YanMeng-particle swarm optimization (PSO) algorithm.

Figure 4.
Schematic diagram of search strategy adjustment.

Figure 5.
Rigid straight bar method diagram.
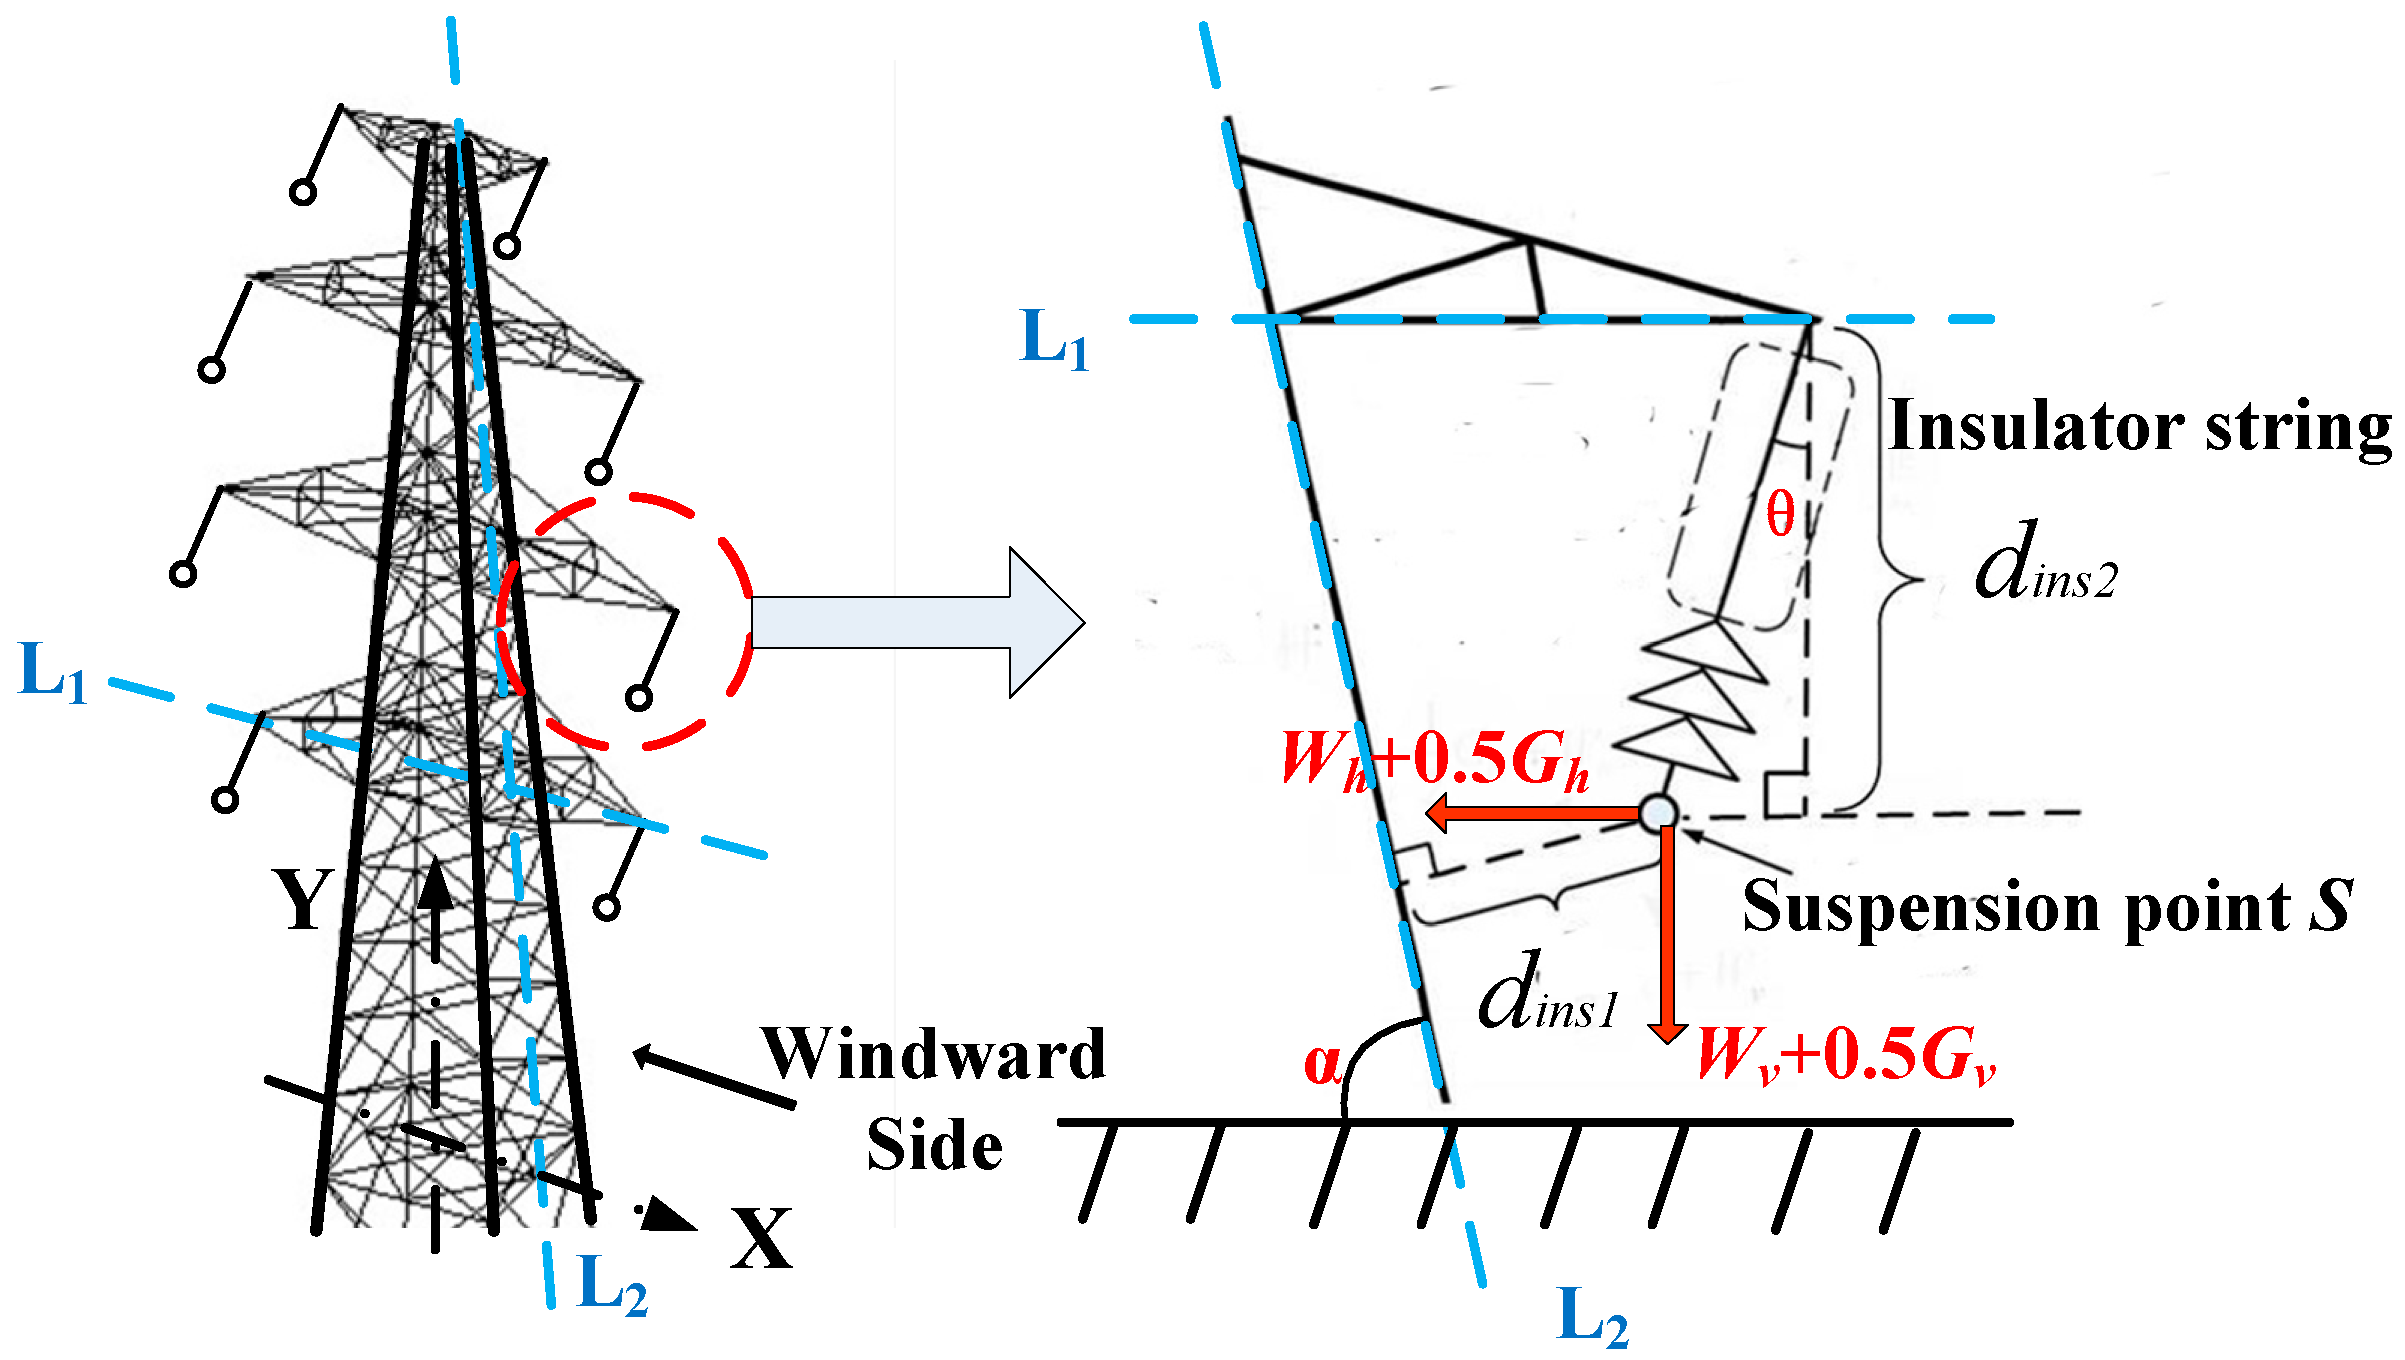
Figure 6.
Schematic diagram of key-node method (KNM).

Figure 7.
The flow chart of KNM.

Figure 8.
Flashover characteristics curve of clearance.

Figure 9.
The average wind speed and direction of the Rammasun.
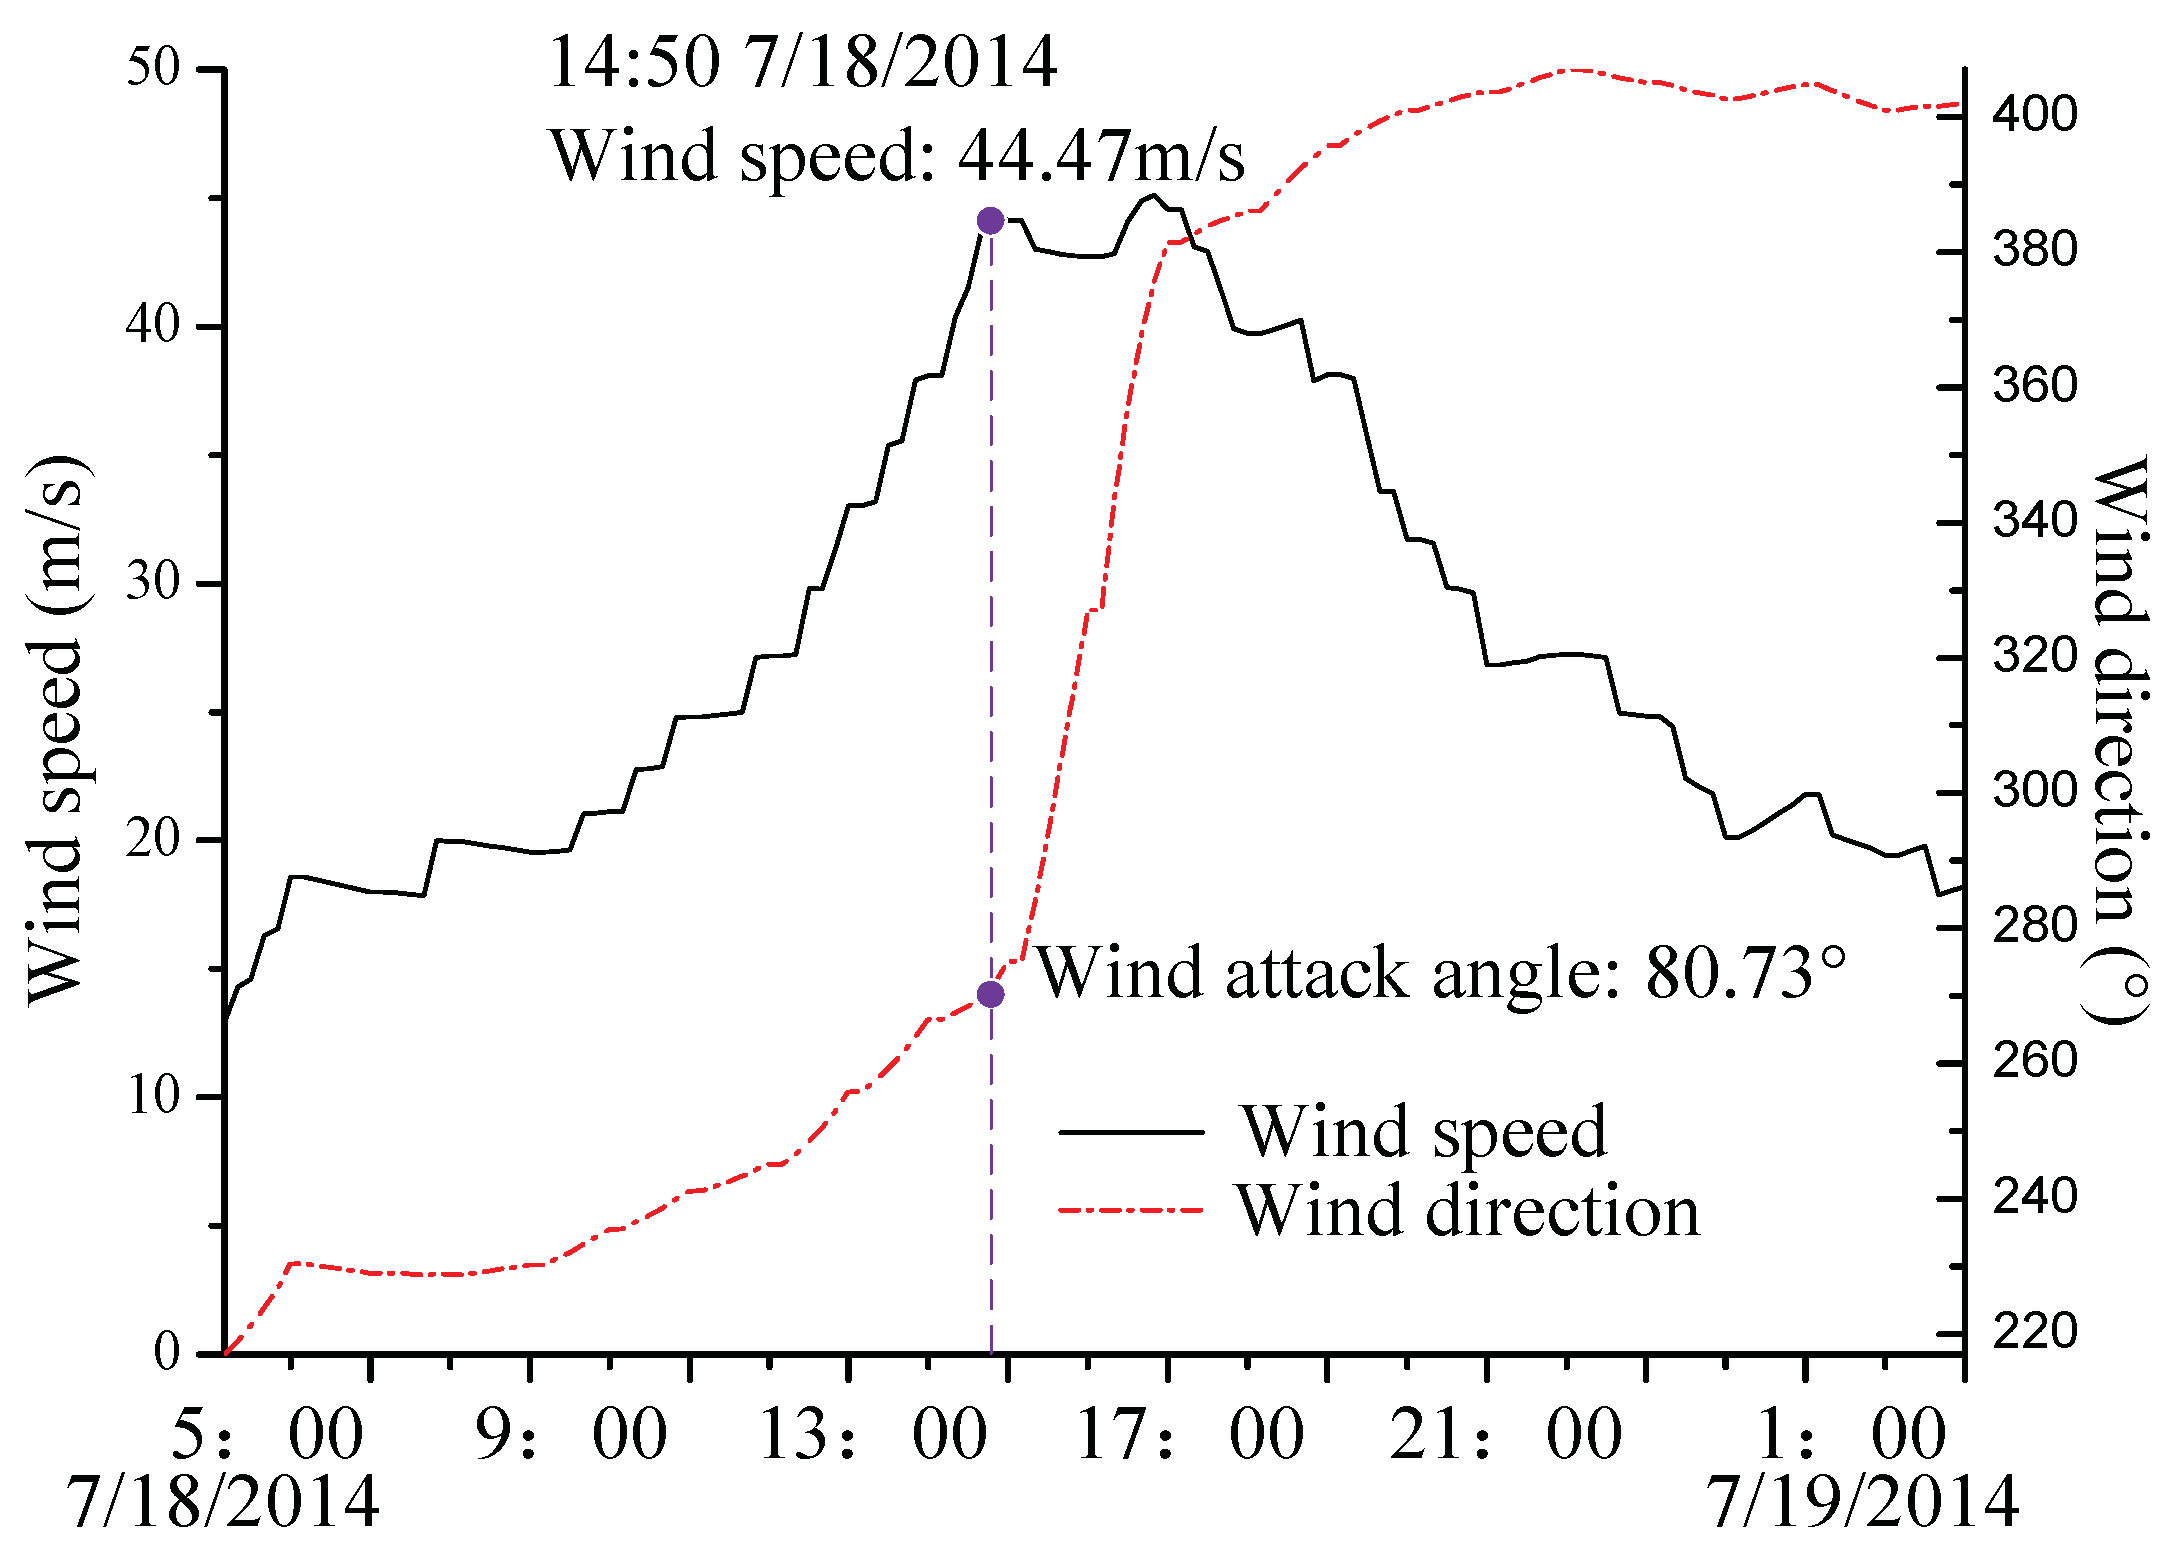
Figure 10.
Simulation results of fluctuating wind at 10 m height. (a) Wind speed in time domain. (b) Power spectral density.
Figure 10.
Simulation results of fluctuating wind at 10 m height. (a) Wind speed in time domain. (b) Power spectral density.
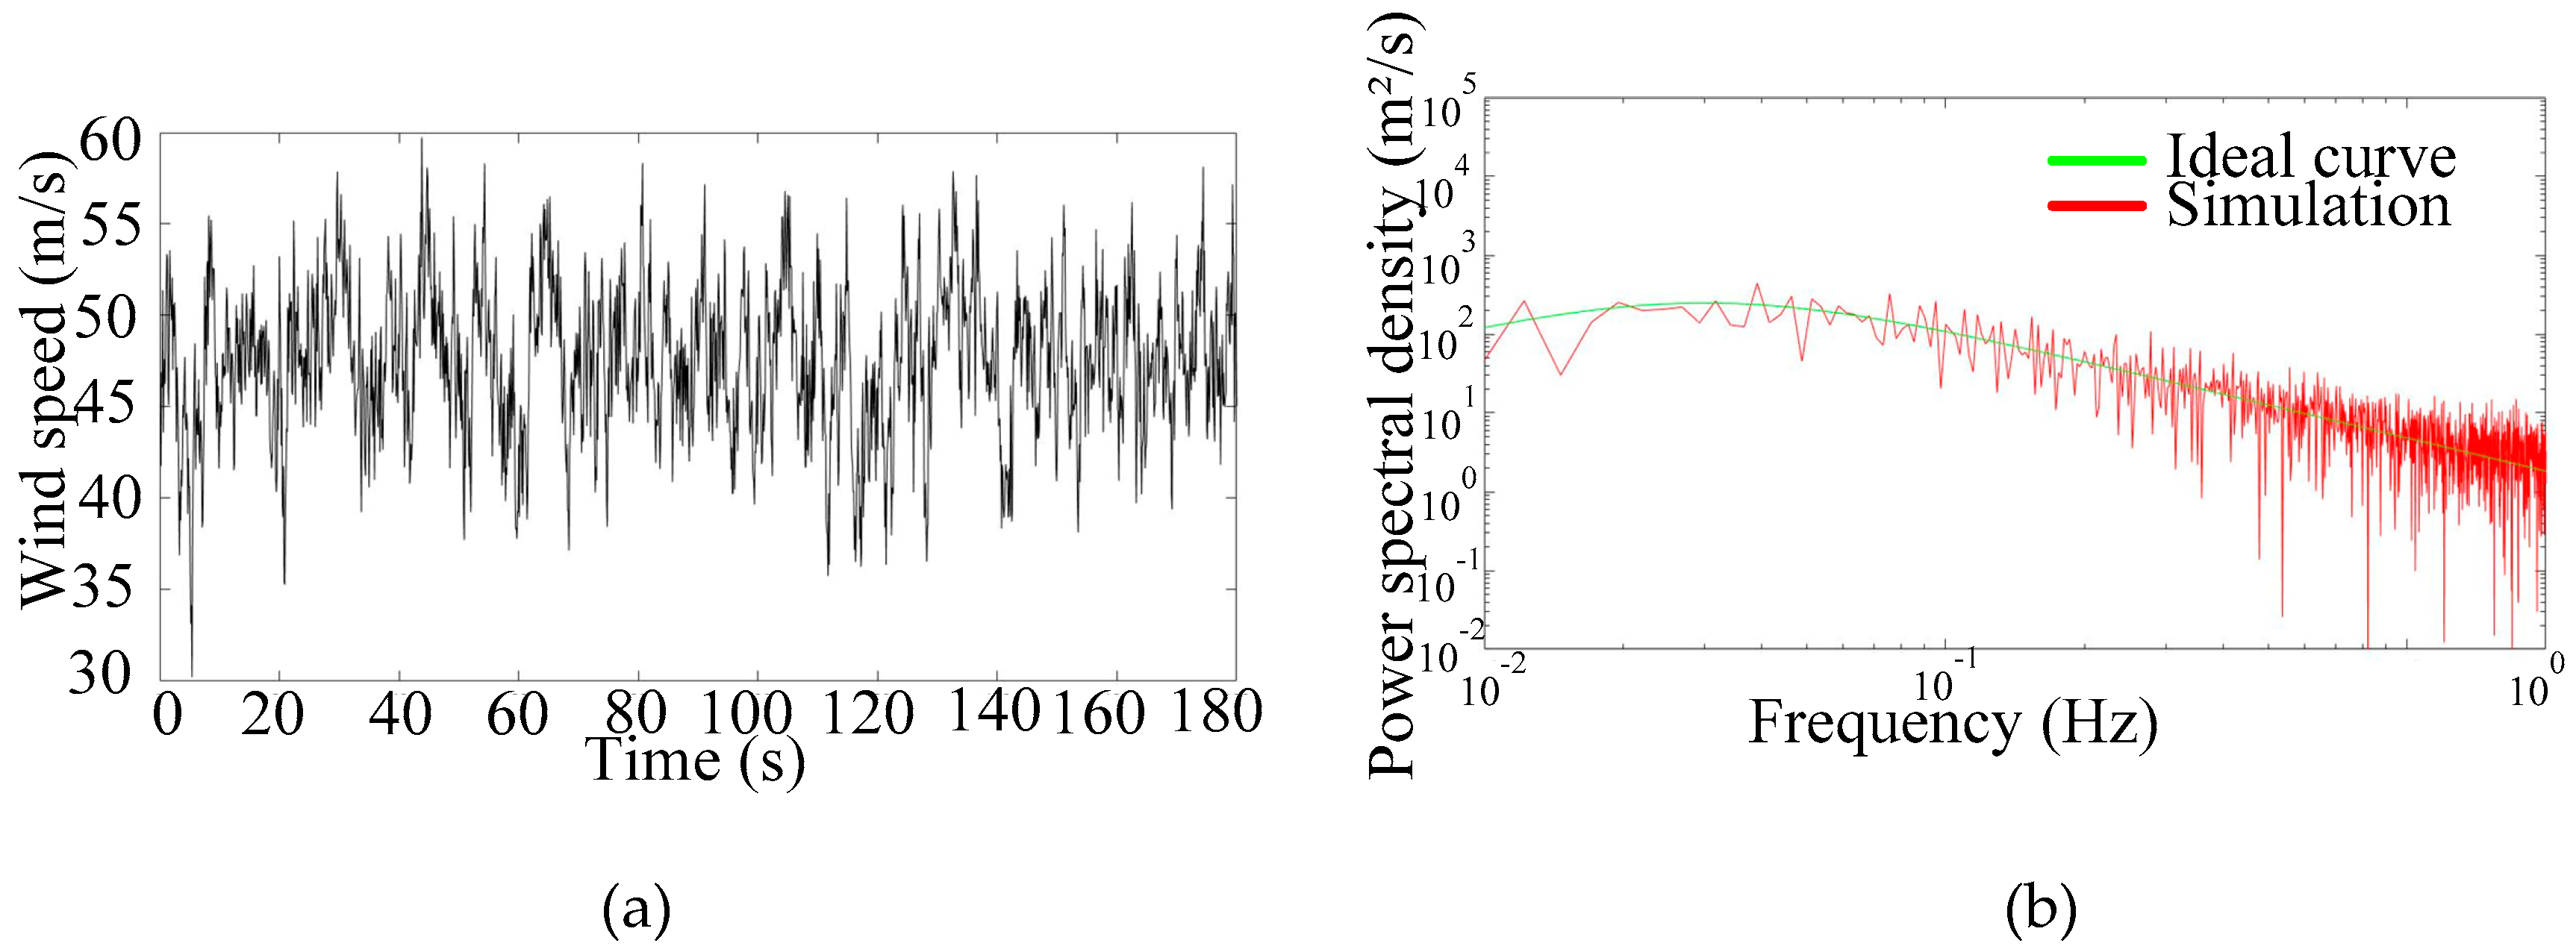
Figure 11.
The tower-line system model.
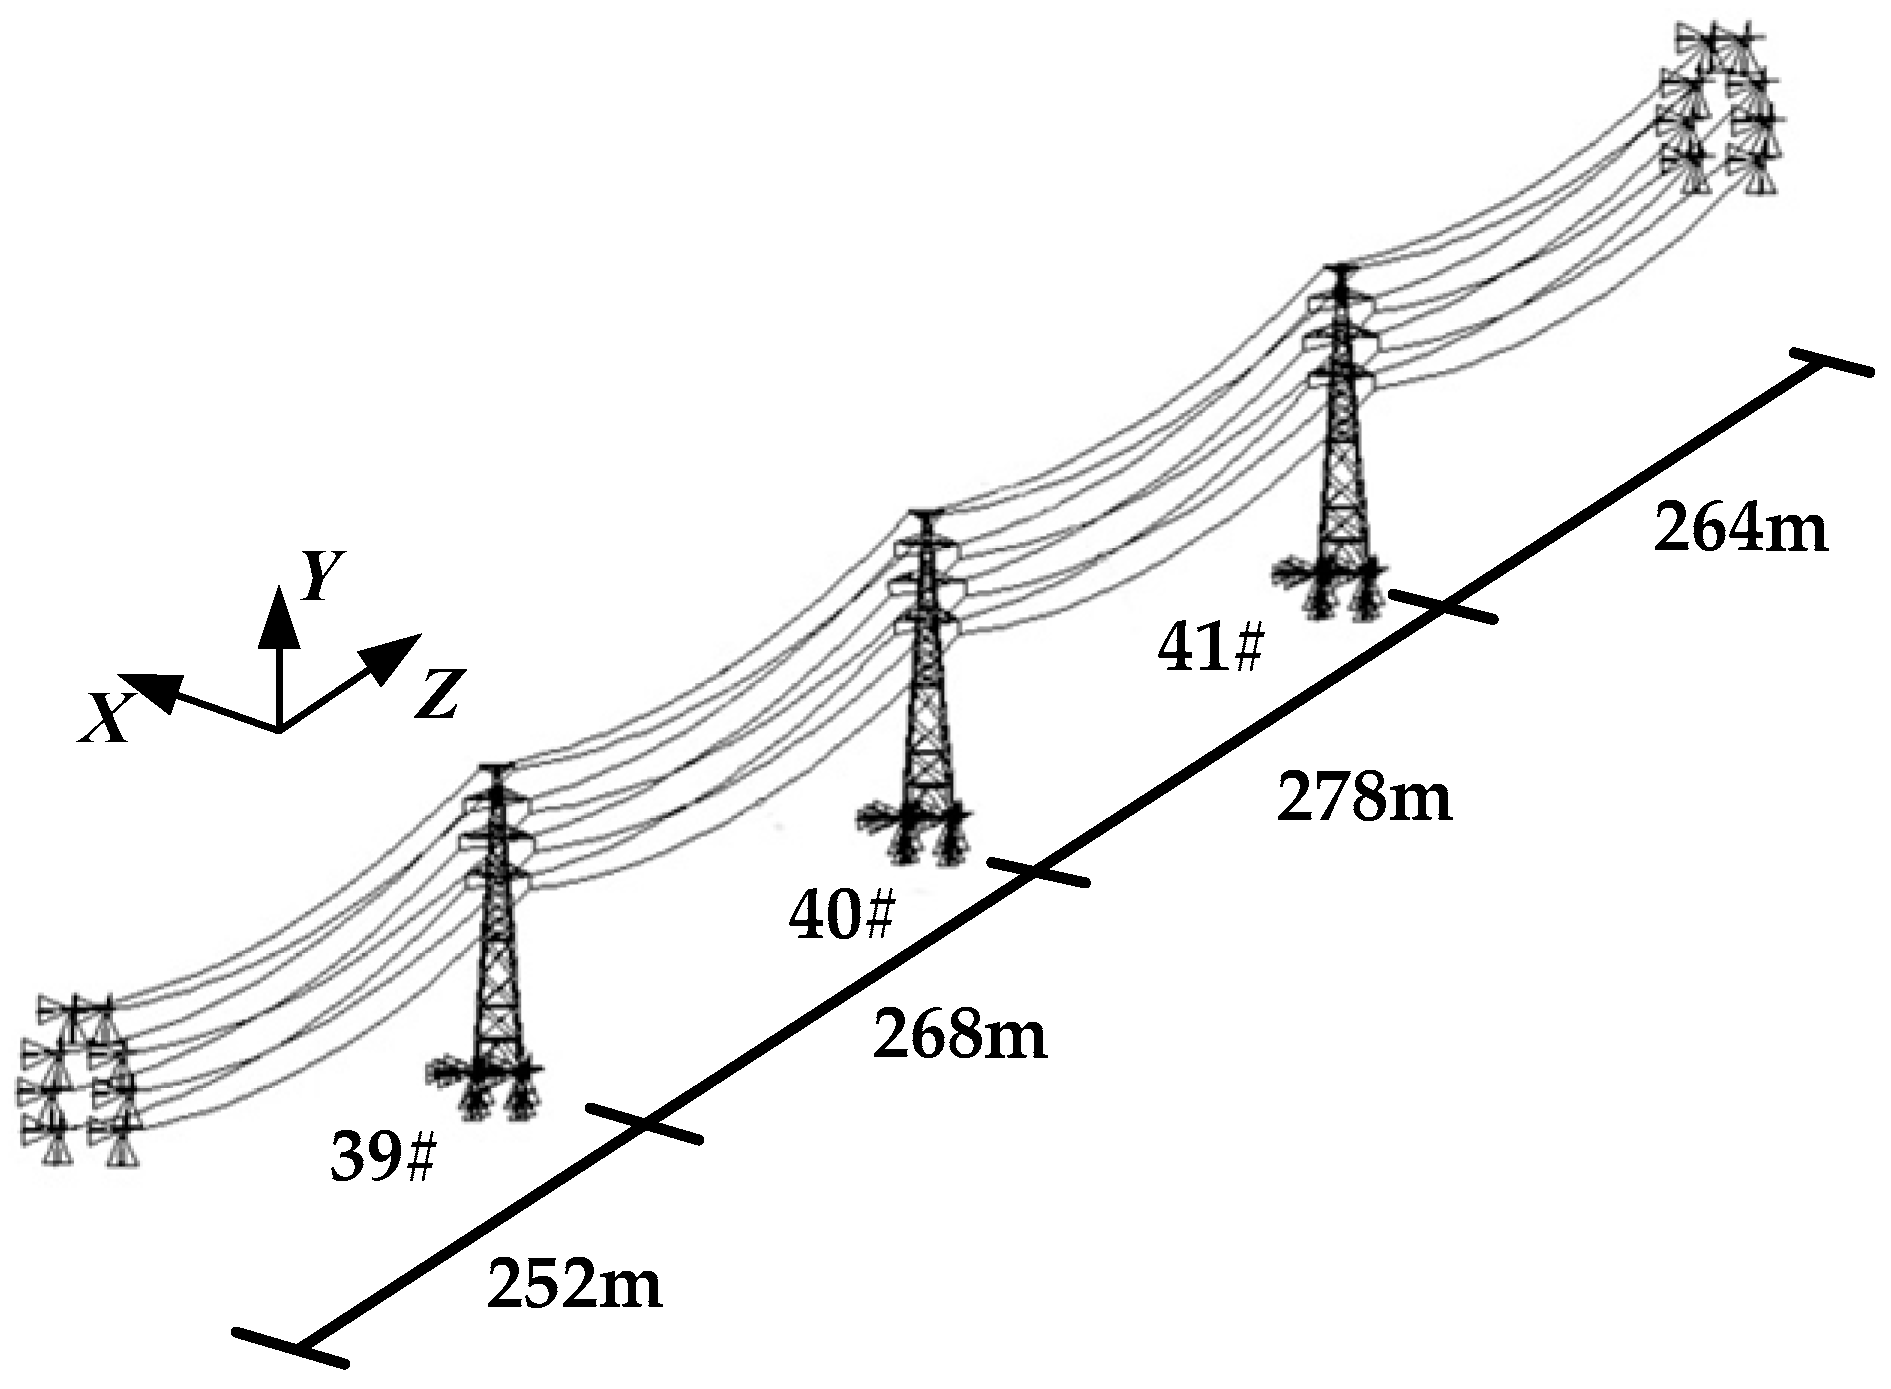
Figure 12.
Safety factor, R, of windage yaw flashover. (a) Conductors/ground wires. (b) Insulator string.
Figure 12.
Safety factor, R, of windage yaw flashover. (a) Conductors/ground wires. (b) Insulator string.
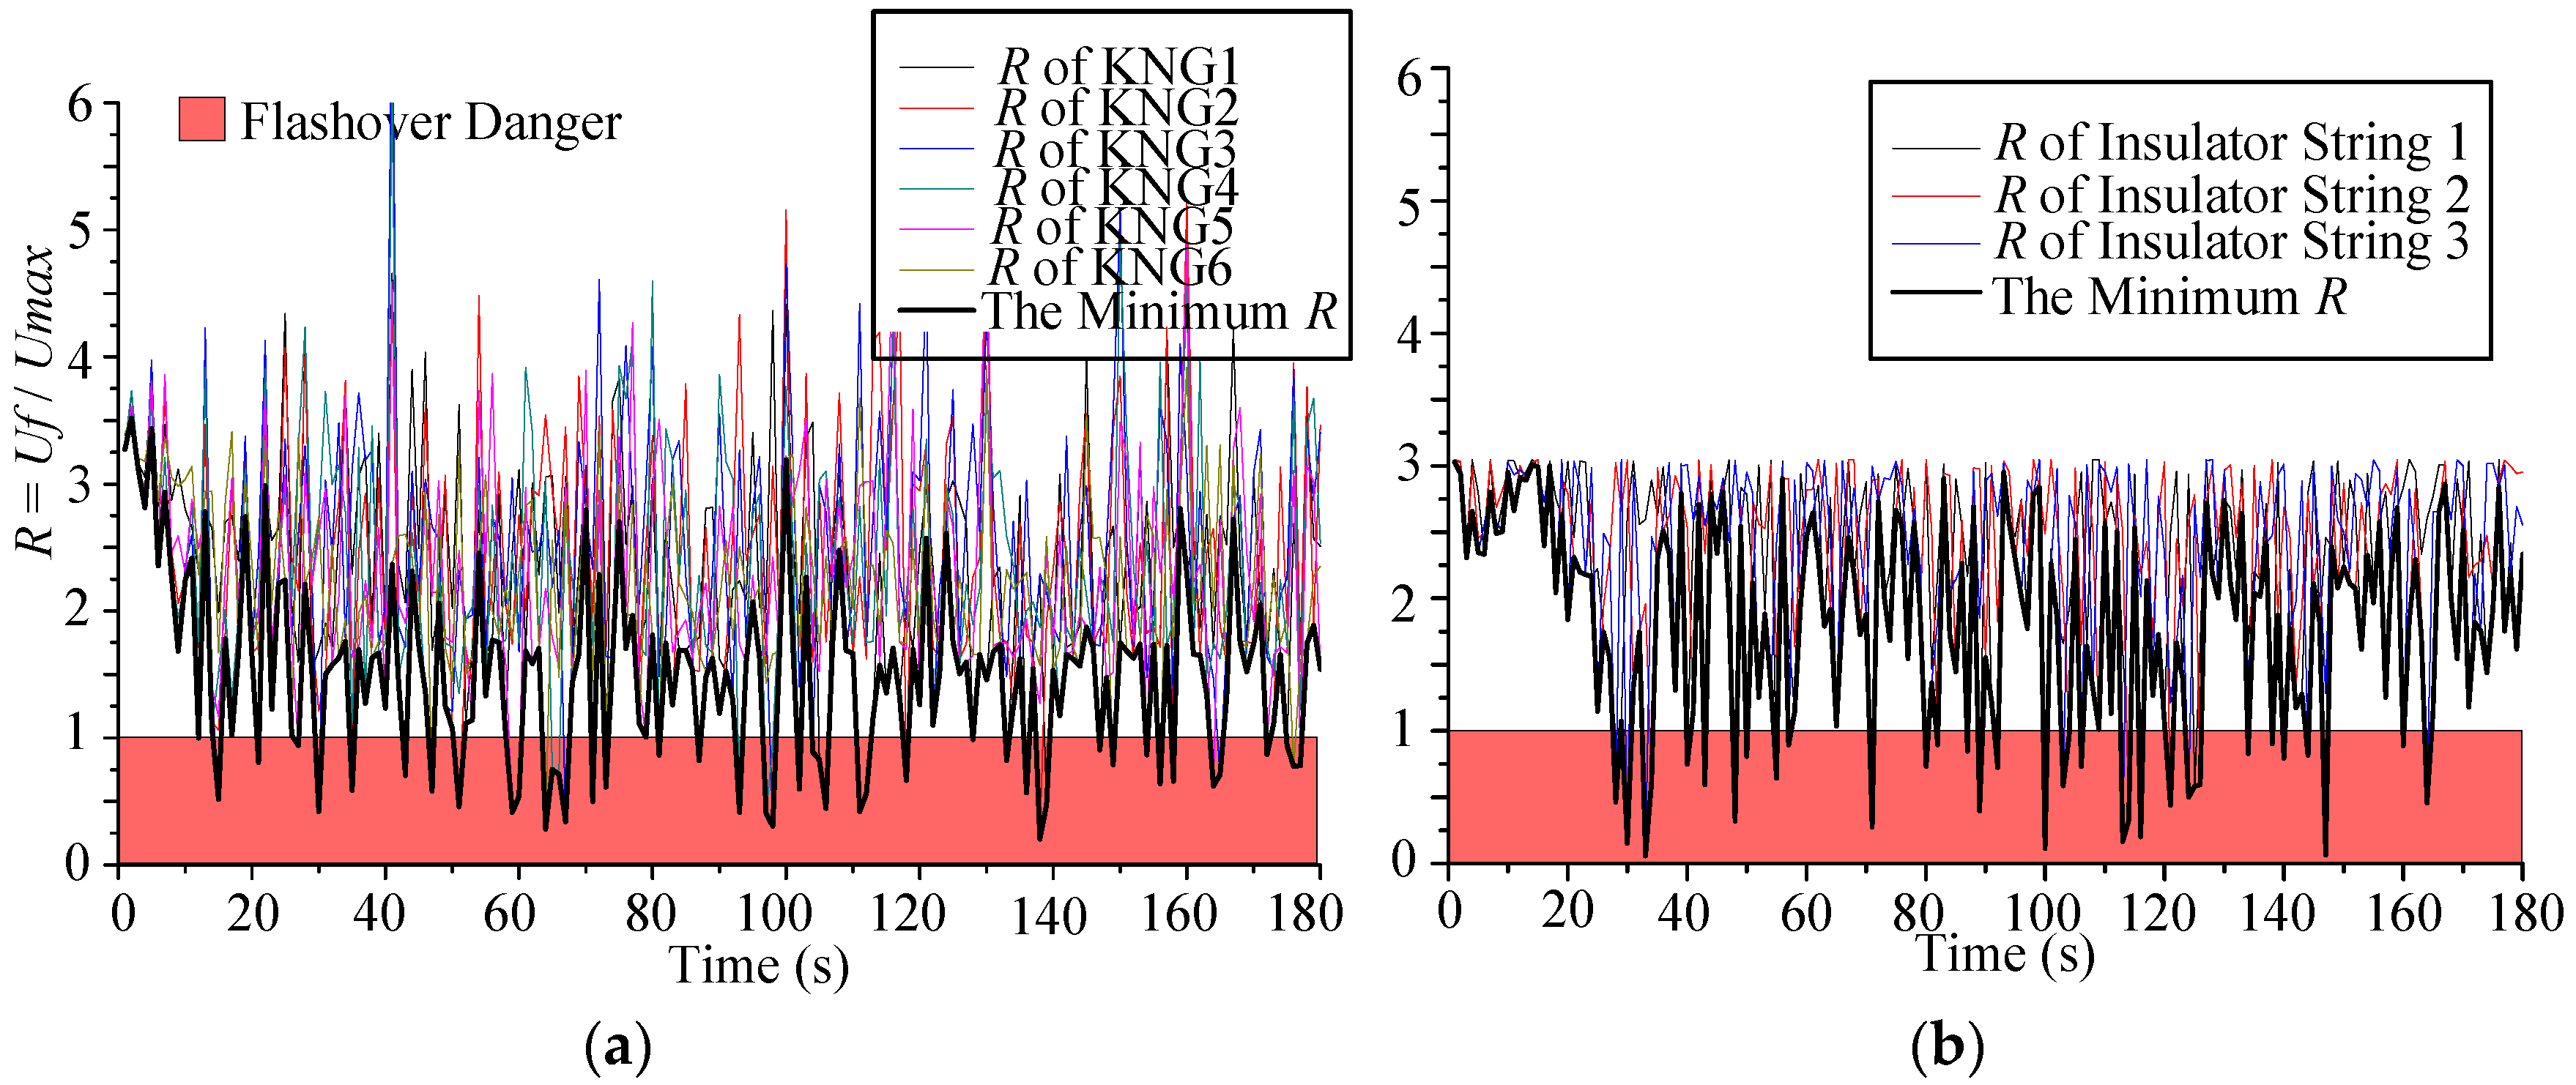
Figure 13.
Detailed information of conductors/ground wires. Notes: U is upper conductor, M is middle conductor, L is lower conductor, and G is ground wire.
Figure 13.
Detailed information of conductors/ground wires. Notes: U is upper conductor, M is middle conductor, L is lower conductor, and G is ground wire.

Figure 14.
Rain effect on windage yaw flashover. (a) Conductors/ground wires. (b) Insulator strings. Notes: RMS is the root mean square of the minimum R value.
Figure 14.
Rain effect on windage yaw flashover. (a) Conductors/ground wires. (b) Insulator strings. Notes: RMS is the root mean square of the minimum R value.


Table 1.
Fitting coefficients.
| Rainwater Density ρr (mm/h) | a1 | a2 | a3 | SSE | RMSE |
|---|---|---|---|---|---|
| 144 | −0.7166 | 1.399 | 0.2337 | 1.647 × 10⁻⁷ | 4.058 × 10⁻⁴ |
| 288 | −0.6966 | 1.381 | 0.2077 | 5.309 × 10⁻⁸ | 2.304 × 10⁻⁴ |
| 576 | −0.6994 | 1.405 | 0.1656 | 1.207 × 10⁻⁵ | 3.474 × 10⁻³ |
| 864 | −0.6865 | 1.391 | 0.1555 | 5.505 × 10⁻⁶ | 2.346 × 10⁻³ |
Note: SSE represents sum of squares for error, RMSE represents root mean square error.
Table 2.
Technical parameters of rod suspension composite insulator FXBW4-110/100.
| Composite Insulator Type | FXBW4-110/100 |
|---|---|
| Rated voltage (kV) | 110 |
| Rated mechanical tensile load (kN) | 100 |
| Structural height (mm) | 1240 ± 15 |
| Minimum arc distance (mm) | 1015 |
| Minimum nominal creepage distance (mm) | 3150 |
| Lightning full-wave withstand voltage (kV) | 550 |
| Power frequency withstand voltage (kV) | 230 |
Table 3.
Characteristics of conductors and ground wires.
| Type | JL/LB1A-240/40 | JLB23-50 |
|---|---|---|
| Area (mm2) | 277.74 | 49.86 |
| Diameter (mm) | 21.66 | 9.00 |
| Mass per unit length (kg/km) | 916.9 | 315.1 |
| Rated tensile strength (N) | 85,851 | 54,900 |
| Elastic modulus (N/mm2) | 69,990 | 141,300 |
| Linear expansion coefficient (1/°C) | 19.76 × 10⁻⁶ | 12.9 × 10⁻⁶ |
| Maximum working strength (N) | 30,207 | 16,486 |
© 2019 by the authors. Licensee MDPI, Basel, Switzerland. This article is an open access article distributed under the terms and conditions of the Creative Commons Attribution (CC BY) license (http://creativecommons.org/licenses/by/4.0/).
Share and Cite
MDPI and ACS Style
An, L.; Guan, Y.; Zhu, Z.; Zhang, R. Research on Windage Yaw Flashovers of Transmission Lines under Wind and Rain Conditions. Energies 2019, 12, 3728. https://doi.org/10.3390/en12193728
AMA Style
An L, Guan Y, Zhu Z, Zhang R. Research on Windage Yaw Flashovers of Transmission Lines under Wind and Rain Conditions. Energies. 2019; 12(19):3728. https://doi.org/10.3390/en12193728
Chicago/Turabian StyleAn, Liqiang, Yongyu Guan, Zhijian Zhu, and Ronglun Zhang. 2019. "Research on Windage Yaw Flashovers of Transmission Lines under Wind and Rain Conditions" Energies 12, no. 19: 3728. https://doi.org/10.3390/en12193728
Note that from the first issue of 2016, this journal uses article numbers instead of page numbers. See further details here.