Towards Energy Neutral Wireless Communications: Photovoltaic Cells to Connect Remote Areas


LiFi Research & Development Centre, Institute of Digital Communications, The University of Edinburgh, JCMB, King’s Building, Edinburgh EH9 3FD, UK
*
Author to whom correspondence should be addressed.
Energies 2019, 12(19), 3772; https://doi.org/10.3390/en12193772
Submission received: 30 August 2019
/
Revised: 17 September 2019
/
Accepted: 27 September 2019
/
Published: 3 October 2019
(This article belongs to the Special Issue Integration of PV in Distribution Networks)
Abstract
:In this work, we have designed, developed and deployed the world’s first optical wireless communication (OWC) system using off-the-shelf lasers and solar photovoltaics. Four bidirectional OWC prototypes have been installed on the Orkney Islands of Scotland at a 30 m link distance for the provision of high-speed internet access to two residential properties. The silicon-made solar panels can harvest power up to 5 W from sunlight and they offer data rates as high as 8 Mb/s. Using additional analogue processing, data rates higher than the existing landline broadband connection are achieved. This breakthrough opens the development path to low cost, self-powered and plug-and-play free-space optical (FSO) systems.
1. Introduction
Optical wireless communications (OWC) have been widely accepted as a technology with the potential to meet the ever-increasing demand in network capacity [1]. Light fidelity (LiFi) is an optical wireless networking technology that typically uses light-emitting diodes (LEDs) for data transmission and photodiodes (PDs) for data reception in indoor environments [2]. LiFi is considered as the dominant networking technology in OWC and a lot of work has been carried out towards its convergence into the next generation of wireless networking [3]. While LEDs and PDs have traditionally been considered as the main communication devices in LiFi, other types of light sources and detectors such as lasers and photovoltaic (PV) panels can also be used [4]. Currently, the most common type of receivers used are positive-intrinsic-negative (PIN) and avalanche PDs due to their high-bandwidth and linear photodetection. However, these photodetectors require an external power source in order to operate. As mankind is shifting from fossil fuel to other renewable resources of energy, such as solar power. A solar panel can directly convert the optical signal to an electrical signal without the application of any external power source.
Since their invention, solar panels have already undergone three generations of development for optimizing their power efficiency. The first generation consists of solar panels made of monocrystalline or polycrystalline silicon (Si) [5] which is still the most commonly used type in conventional applications. Monocrystalline panels have a higher power output, better temperature stability and last longer than polycrystalline panels [6]. The second generation of solar panels consists of different types of thin-film solar cells and are mainly integrated into buildings or used in power stations or smaller solar power systems. Third-generation solar panels include a variety of thin-film technologies but many of them are still in the phase of research and development. Some of them generate electricity by using organic materials, while others use inorganic substances [6]. There are solar cells that use hybrid organic-inorganic substances such as the perovskite solar cell. Perovskite solar cells have perovskite structured compound of tin or lead halide-based material as the light-harvesting layer [7]. The main advantage of perovskite solar cells over silicon-based cells is that they are cheaper to manufacture [7]. This study focuses mainly on the first generation of solar panels, as they are inexpensive and readily available for deployment.
The idea of using a Si solar cell as a data detector was demonstrated for the first time in 1977 [8]. However, the concept of simultaneous wireless information and power transfer in the optical spectrum was only recently studied in [9] and [10] using white LEDs and ordinary Si solar cells. The data rate of 3 kb/s achieved in [9] is considered insufficient for high-speed data communication. A significant data speed of 7 Mb/s and harvested power of 2.1 mW are reported in [10] by using a polycrystalline Si PV panel and OFDM. Going forward from these initial demonstrations, a 12 Mb/s wireless data link with a distance of 1 m was created in [11] using a white LED and the same solar panel receiver with that in [10]. Alternative PV technologies used for data detection include organic [12] and GaAs PV cells [13]. Those devices offer lower capacitances than Si-made solar panels due to their reduced sizes and their electrical bandwidth is much higher, i.e., of the MHz order. In [12], a data rate of 34.2 Mb/s is reported for a 1 m OWC link using an organic solar cell. A record data rate of 522 Mb/s has been achieved using a GaAs PV cell as a data detector in [13] at a 2 m link distance. However, there are strict alignment requirements for organic and GaAs PV cells due to their reduced areas.
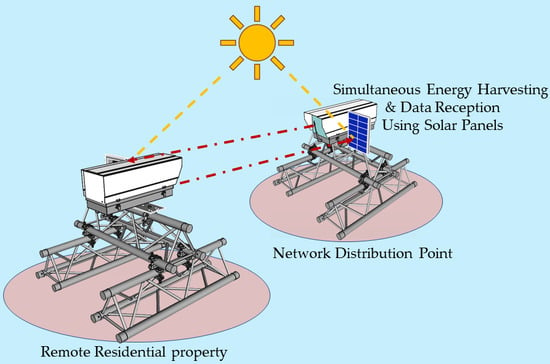
All the experimental prototypes in [8,9,10,11,12,13] have only been tested in an indoor laboratory environment. In this paper, a world’s first FSO system with solar panels as data detectors is shown to be deployed and tested under real-world conditions. The prototype was used as a solution for backhaul communication over a 30 m distance to provide internet connectivity to two residential properties on a remote island as depicted in Figure 1.
A key advantage of using a solar panel as a data communication receiver over a conventual PD is the minimal requirement for beam tracking and alignment [11]. A conventional FSO system requires a highly complex system for beam tracking and alignment owing to the very small receiver dimensions. This leads to the need for highly precise alignment between the transmitter and receiver. As solar panels are significantly bigger than FSO receivers, the required mechanical control is much simpler. Although the large area of the detector reveals the potential for signal jamming and eavesdropping, the system carries over all the physical and network layer security features which have already been deployed and tested for its robustness in 802.11 IEEE Wireless Local Area Network (WLAN) standards [14], making it similar to Radio Frequency (RF) based links.
The rest of this paper is organized as follows: Section 2 discusses how a solar panel can be used to harvest energy and receive data simultaneously; Section 3 presents an overview of the system and its main characteristics and in Section 4 results obtained after deployment are discussed. Finally, conclusions are presented in Section 5.
2. Background
Solar PV panels are not designed to function as OWC receivers. Therefore, the communication bandwidth of a solar panel was never considered during its manufacturing process. In order to use a solar panel as a data receiver, two aspects need to be considered: The electrical characteristics of the solar cells and the profile of the beam incident on the panel.
2.1. Electrical Characteristics
In order to design a suitable receiver with the silicon solar panel, it is necessary to determine important optical detector characteristics and choose the right type of solar panel. The performance of an optical detector may be defined by the following characteristics:
- Sensitivity to an incident optical signal
- Speed of response
- Linearity
- Temperature stability
2.1.1. Optical Sensitivity
The solar panel can be modelled as a PN diode structure as shown in Figure 2 where Wp and Wn are the widths of p-doped and n-doped regions respectively, V is voltage generated, I is the current flowing through the load resistance RL.
An important specification of a solar cell that needs to be considered is the quantum efficiency. The quantum efficiency of a solar panel quantifies the capability of converting optical energy in different wavelengths to electrical energy, i.e., sensitivity to the incident light. It can be calculated using [15]:
where R is the responsivity, α is the absorption coefficient and xn + xp denotes the thickness of the depletion zone, as shown in Figure 2.
2.1.2. Speed of Response
The bandwidth of a solar cell is critical to understand which affects the maximum data rate of the communication system. The bandwidth of a solar cell is dependent on the intrinsic bandwidth and extrinsic bandwidth. The intrinsic bandwidth is determined by the doping level which determines the thickness of the depletion region. When light is incident on the depletion region, an exciton (i.e., an electron-hole pair) is generated, resulting in potential difference across the terminals. As the electric field is directly proportional to the potential difference for a given distance, assuming the doping level across the substrate is homogenous the electric field through the semiconductor will be homogenous. The time taken by these charge carriers to traverse through the depletion region will determine the intrinsic bandwidth of this semiconductor device. Let the time taken by an electron be τe and for a hole be τh. The velocity at which these charges will be moving will be given by µeΕ and µhΕ, where μ is the mobility factor and Ε is the electric field across the semiconductor. Hence, the time can be simply expressed by the distance divided by velocity, which is expressed using:
and
From Equations (2) and (3), it can be observed that the thinner the depletion region, the larger bandwidth of the solar cell will be.
As can be seen from Equations (1)–(3), the quantum efficiency and the speed of response are dependent on the thickness of the depletion region. The thicker the depletion region the higher the quantum efficiency, however, the solar cell will have a lower bandwidth. Therefore, during the manufacturing of a solar cell, there will always be a tradeoff between the energy harvesting capability and bandwidth.
The second factor which determines the bandwidth of a solar panel is the extrinsic bandwidth. The extrinsic bandwidth is dependent on the parasitic and junction capacitance between the interconnection of each solar cell in a PV module. In a semiconductor device, the capacitance associated with the charge variation in the depletion layer is called the junction capacitance and the capacitance associated with the excess carriers in the quasi-neutral region is called the diffusion capacitance.
The solar cell can be represented as a current source. Figure 3 gives an equivalent electrical circuit to a solar cell used as a data receiver [15]. Parameter h(f) is the parameter which is dependent on the intrinsic bandwidth, and P(f) is the time-varying optical signal as a function of frequency which is expressed as f [15]. The responsivity of the panel depends on the wavelength of the incident light and the material used. In the case of Si, the responsivity peaks at the wavelength window between 900 and 1000 nm [15].
where fτe = 1/τe, fτh = 1/τh, Rext is the external load resistance, Rd the diode resistance, Cd and Cj the diffusion and junction capacitance of the solar cell.
It can be observed that if the solar cells are connected in series, the effective diffusion capacitance reduces. The junction capacitance will completely depend on the process of how each solar cell is connected.
2.1.3. Linearity
The linearity of the solar panel can be verified by considering its two different modes of operation commonly referred to as the PV mode and the short-circuit mode. In the PV mode, the load resistance RL is very low compared to the effective cell shunt resistance Rsh as shown in Figure 4.
For an open circuit, I = 0, hence the generated photocurrent IL can be expressed as:
As the solar cell has been modelled as a PN diode we can use the diode equation:
where ID is the current through the diode, I0 is the saturation current, q is the charge of an electron, K is the Boltzmann’s constant and T is temperature. For a constant temperature α = (q/KT) can be considered as a constant.
Substituting Equation (7) in Equation (6) and solving for VD we have:
Assuming IL >> Ish and IL >> I0,
Using the small-signal approach, it can be assumed that:
where VS is the output voltage signal of the detector and ILs is the portion of IL related to the incident optical signal. Here it is seen that the signal voltage gain is inversely related to the total radiant energy incident to the detector, which is composed of both the carrier and background illumination. In many applications, the detector will operate under conditions of widely varying signal strength and background illumination, which would make this mode of operation undesirable.
If we consider the short-circuit mode, in which RS + RL is very small as compared to the diode effective shunt resistance, then
and the small-signal gain is given by:
IL = I,
Equation (12) indicates a perfectly linear response with no dependence on the signal strength and background illumination which is highly desirable.
2.1.4. Temperature Stability
Temperature affects the characteristics of Si cells in two ways. Firstly, the diode saturation current depends strongly on temperature. Secondly, the photogenerated current varies because the spectral response of the cell shifts towards the infrared region as the temperature is increased.
Differentiating Equation (8) with respect to temperature T we get,
Since IL >> Io
Typically, for Si VD = 0.7 V. Hence, the voltage temperature coefficient we get is −0.078 V/K per solar cell.
Considering the theoretical voltage temperature coefficient from Equation (14), a 5 W polycrystalline solar panel was chosen with a voltage temperature coefficient of −0.13 V/K [16] for the whole panel. This was the solar panel with the closest voltage temperature coefficient available off-the-shelf.
All the above derivations assumed that the solar panel is a time-varying current source. Hence, a circuit that can hold the voltage across the solar panel constant would result in keeping the electric field (E) across the PN junction of the cells in Equations (2) and (3) constant thereby implying in Equation (6) that h(f) is constant. Therefore, the bandwidth of the solar panel will depend only on the extrinsic bandwidth.
2.2. Beam Profile on the Solar Panel
In order to understand the effects of illumination of the laser beam on the frequency response of a solar panel, an experiment was carried out to measure its electrical output. In the experiment, a 660 nm laser was used with a collimating lens, a plano-convex lens and a diffuser. The size of the beam was varied by changing the distance between the plano-convex lens and the collimating lens. Figure 5 shows the three different cases of illumination patterns: (a) Below 20% of the solar panel’s area, (b) over 60% of the solar panel’s area and (c) 100% of the panel’s area.
Figure 6 gives the normalized magnitude as a function of frequency. It is observed that when the solar panel is fully illuminated with the optical beam, it gives the best performance. This is in agreement with the energy harvesting results presented in [17]. This is because all the solar cells in the panel are connected in series and are illuminated with the most uniform pattern. Hence, the electrical performance of the panel is determined from the least illuminated cell. In this experiment, it was also found that a minimum of 6mW optical swing with a 660 nm laser source on the surface (306 × 218 mm2) of the panel [16] is required to observe a corresponding electrical signal of ~1 mVpp. Also, from Figure 6, it can be concluded that the solar panel has a low pass response.
3. System Design and Integration
3.1. Transmitter: Requirements and Limitations
One of the most important limitations in the design of an FSO communication system is eye safety [18]. The majority of FSO transmitters operate at a wavelength of 1550 nm due to their high maximum permissible exposure (MPE), which is 100 mW/cm2 [19]. However, the laser wavelength in this research is selected to be 940 nm because of the peak responsivity of Si cells in the region between 940 nm and 1000 nm. The MPE of 940 nm lasers is 3.1 mW/cm2 and the laser system is certified to be classified as Class 1M. Another requirement in the optical domain is the transmission of a divergent laser beam that can overfill the solar panel. This is not only to project a uniform beam covering the entire solar panel, but also to tackle any misalignment due to unfavourable weather conditions such as strong winds. In addition, the transmitter should be able to dynamically control the signal’s power based on the weather conditions. Hence, the control unit becomes crucial in order to maintain the link throughout varying weather conditions including cloud cover, rain and fog.
3.1.1. Laser Driver and Control Circuit
A voltage-controlled current-driven laser driver circuit was designed. A temperature sensor and digitally controlled attenuator were added to the design in order to control the signal input to the laser for maximising the link performance. The frequency response of the laser driver was measured using a 1 GHz AC-coupled optical receiver. From Figure 7 it can be inferred that the −3 dB bandwidth of the driver is 65 MHz, which was much higher than the bandwidth of the receiver.
3.1.2. Laser Beam and Optics
The optical design software Zemax was used for ray tracing and a calculation of the power budget of the link. A 2 × 2 vertical-cavity surface-emitting laser (VCSEL) array [20] is used with a diffuser on top of the package. The maximum DC optical power of the laser is 0.5 W. The VCSEL generates a rectangular beam pattern with four hot spots as shown in Figure 8. The laser beam has a wide horizontal and vertical divergence of 65° and 78°, respectively.
In order to increase the directivity of the diffused laser beam and overfill the solar panel at a link distance of 30 m (designated for the installation in Orkney), an off-axis parabolic mirror Edmund Optics 35–533 with a diameter of 76.2 mm is used. Also, to ensure that no user can open the enclosure of the prototype and be exposed to any radiation above the MPE limit, the enclosure is locked with bolts as recommended by the laser safety agency. The transmitter’s optical setup and the illumination pattern of the laser beam at the enclosure aperture are given in Figure 9. It was observed that only two of the four initial hotspots are transmitted in free space. This is because the rays of the bottom two hotspots of the rectangular VCSEL pattern travel a shorter distance than those of the top two hotspots towards the mirror; thus, they are getting reflected with higher power from the mirror.
In practice, to make sure that the laser source was placed at the focal point of the off-axis parabolic mirror; a pitch, yaw, x, y and z translation stage is used. The optical source is attached to the printed circuit board (PCB) of the laser driver and the PCB is mounted on the translation stage. Thus, the beam shape and size can be controlled by modifying any of the five degrees of freedom of the translation stage. In order to ensure that the beam covers the entire area of the solar panel at the 30 m link distance, the beam shape and size were optimized at 20 m distance. Figure 10 gives the simulated irradiance distribution of the beam and the beam observed through a camera and an infrared filter at 20 m. As the beam is not uniform, the beam is analysed along the vertical axes x and y and not along a single axis in Zemax. The Full Width at Half-Maximum (FWHM) intensity along the x-axis and y-axis is calculated to be 135 and 124 mm, respectively. Therefore, an average FWHM intensity of 129.5 mm is determined for the laser beam at 20 m from the transmitter. The beam diameter of the circle observed in practice was measured to be 325 mm, while the size of the solar panel is 306 × 218 mm2 [16]. Hence, the laser beam was expected to cover the whole solar panel.
3.2. Receiver
As mentioned in Section 2, the solar panel has a low-pass frequency response. In order to achieve the optimum bandwidth, the signal needs to be drawn as a current source by holding the voltage constant across the cells. This function is performed by the solar-panel interfacing circuit; it holds the voltage constant across the panel and separates the DC power from the AC signal for further usage as shown in Figure 11.
3.2.1. Energy Harvesting and Storage
To harvest energy from solar cells there are two widely used methods: Pulse Width Modulation (PWM) and Maximum Power Point Tracking (MPPT). MPPT has been proven to be the best, as it operates at the maximum point of the panel [21]. A solar panel has a unique point on the I-V curve, at which the entire photovoltaic system operates with maximum efficiency and produces its maximum output power; this is the point defined as the maximum power point.
In order to implement MPPT and charge a battery, a charge controller BQ24650 from Texas Instruments Inc. [21] was chosen. This device has the capability of MPPT by ± 0.6% input voltage regulation, the maximum power point can be set and can charge the battery with ± 0.5% charge voltage and ± 3% charge current regulation. The charge controller supports charging Li-Ion/Polymer, LiFePO4 and lead-acid batteries [21]. It uses a constant voltage algorithm which is the simplest MPPT method, which is also desirable for the communication circuitry. The device can be set to a charging voltage threshold at which the voltage is held constant with only the charging current varying depending upon the power generated. Depending on the battery chosen, the charging current and voltage can be set.
A 300 W halogen lamp (OSRAM 64515) was used to illuminate the solar panel which was connected to the charge controller circuit and battery. Using a lux meter, the optical power incident on the panel was measured and at the same time voltmeters were used to measure the voltage across the panel and battery. Ammeters were used to measure the current flowing from the panel to the charge controller circuit and the current flowing from the circuit to the battery. Table 1 shows the data gathered from the measurement and it was calculated that using MPPT 92.7% of the power generated by the panel could be delivered to the battery. The efficiency of the panel was calculated to be 13.5% and the efficiency of the overall system was 12.5%.
From the sun graph [22] for Edinburgh, UK it can be noted that the longest duration of darkness in a year is 16 hours. Hence, a battery pack with a capacity to provide power back up for the unit through the longest darkness hours should be chosen. But on the contrary, the battery should be small enough such that it could be charged throughout the day. One of the two units face west directly, and the solar panels are positioned vertically as they are used as OWC receivers simultaneously. While the other unit is facing eastwards, the average solar irradiance for vertical panel facing east is comparable to that facing west [23]. Reference [23] shows that the month of January has the least solar irradiance of 0.94 kWh/m2 on the panel. Hence, the total energy that can be stored using the chosen 5 W Si-based panel with the MPPT charger circuit is calculated to be 7.05 Wh.
In June the solar irradiance is 2.55 kWh/m2, therefore the total maximum energy that can be stored in a day is 19.13 Wh. As the system was being deployed in June, a battery of 38 Wh capacity was chosen which meant that it would take an average of two days to charge the battery unloaded.
3.2.2. Analogue Equalisation for Communication
In order to have real-time high-speed communication, low complexity in the digital processing chain is desired, which demands a flat channel response to avoid the need for digital filters. The measured 3 dB bandwidth of the chosen solar panel was measured to be 270 kHz. Using analogue equalisation, the bandwidth was increased to 5 MHz. Equalisation is the reversal of distortion incurred by a signal through a channel. Equalisers are used to render the frequency response flat from end to end. When a channel has been equalised, the frequency domain attributes of the signal at the input are reproduced at the output. Analogue equalisation can be achieved by selective attenuation or selective gain. In this system, both techniques were used with a higher weight given to selective gain. The orange curve in Figure 12 depicts the measured response of the solar panel post equalisation. The response was no longer a low pass within the 5 MHz bandwidth of interest. To ensure that the maximum data rate can be obtained, the quality of the signal post-processing can be quantified with Signal-to-Noise Ratio (SNR) i.e., the higher the better. Hence, the whole channel response was measured using the transmitter described in Section 3.1 and the receiver. From Figure 13 it can be inferred that the response is flat and the SNR peaks up to 30 dB, which enables 64-QAM, in other words, a higher data rate.
3.3. Overall System Architecture
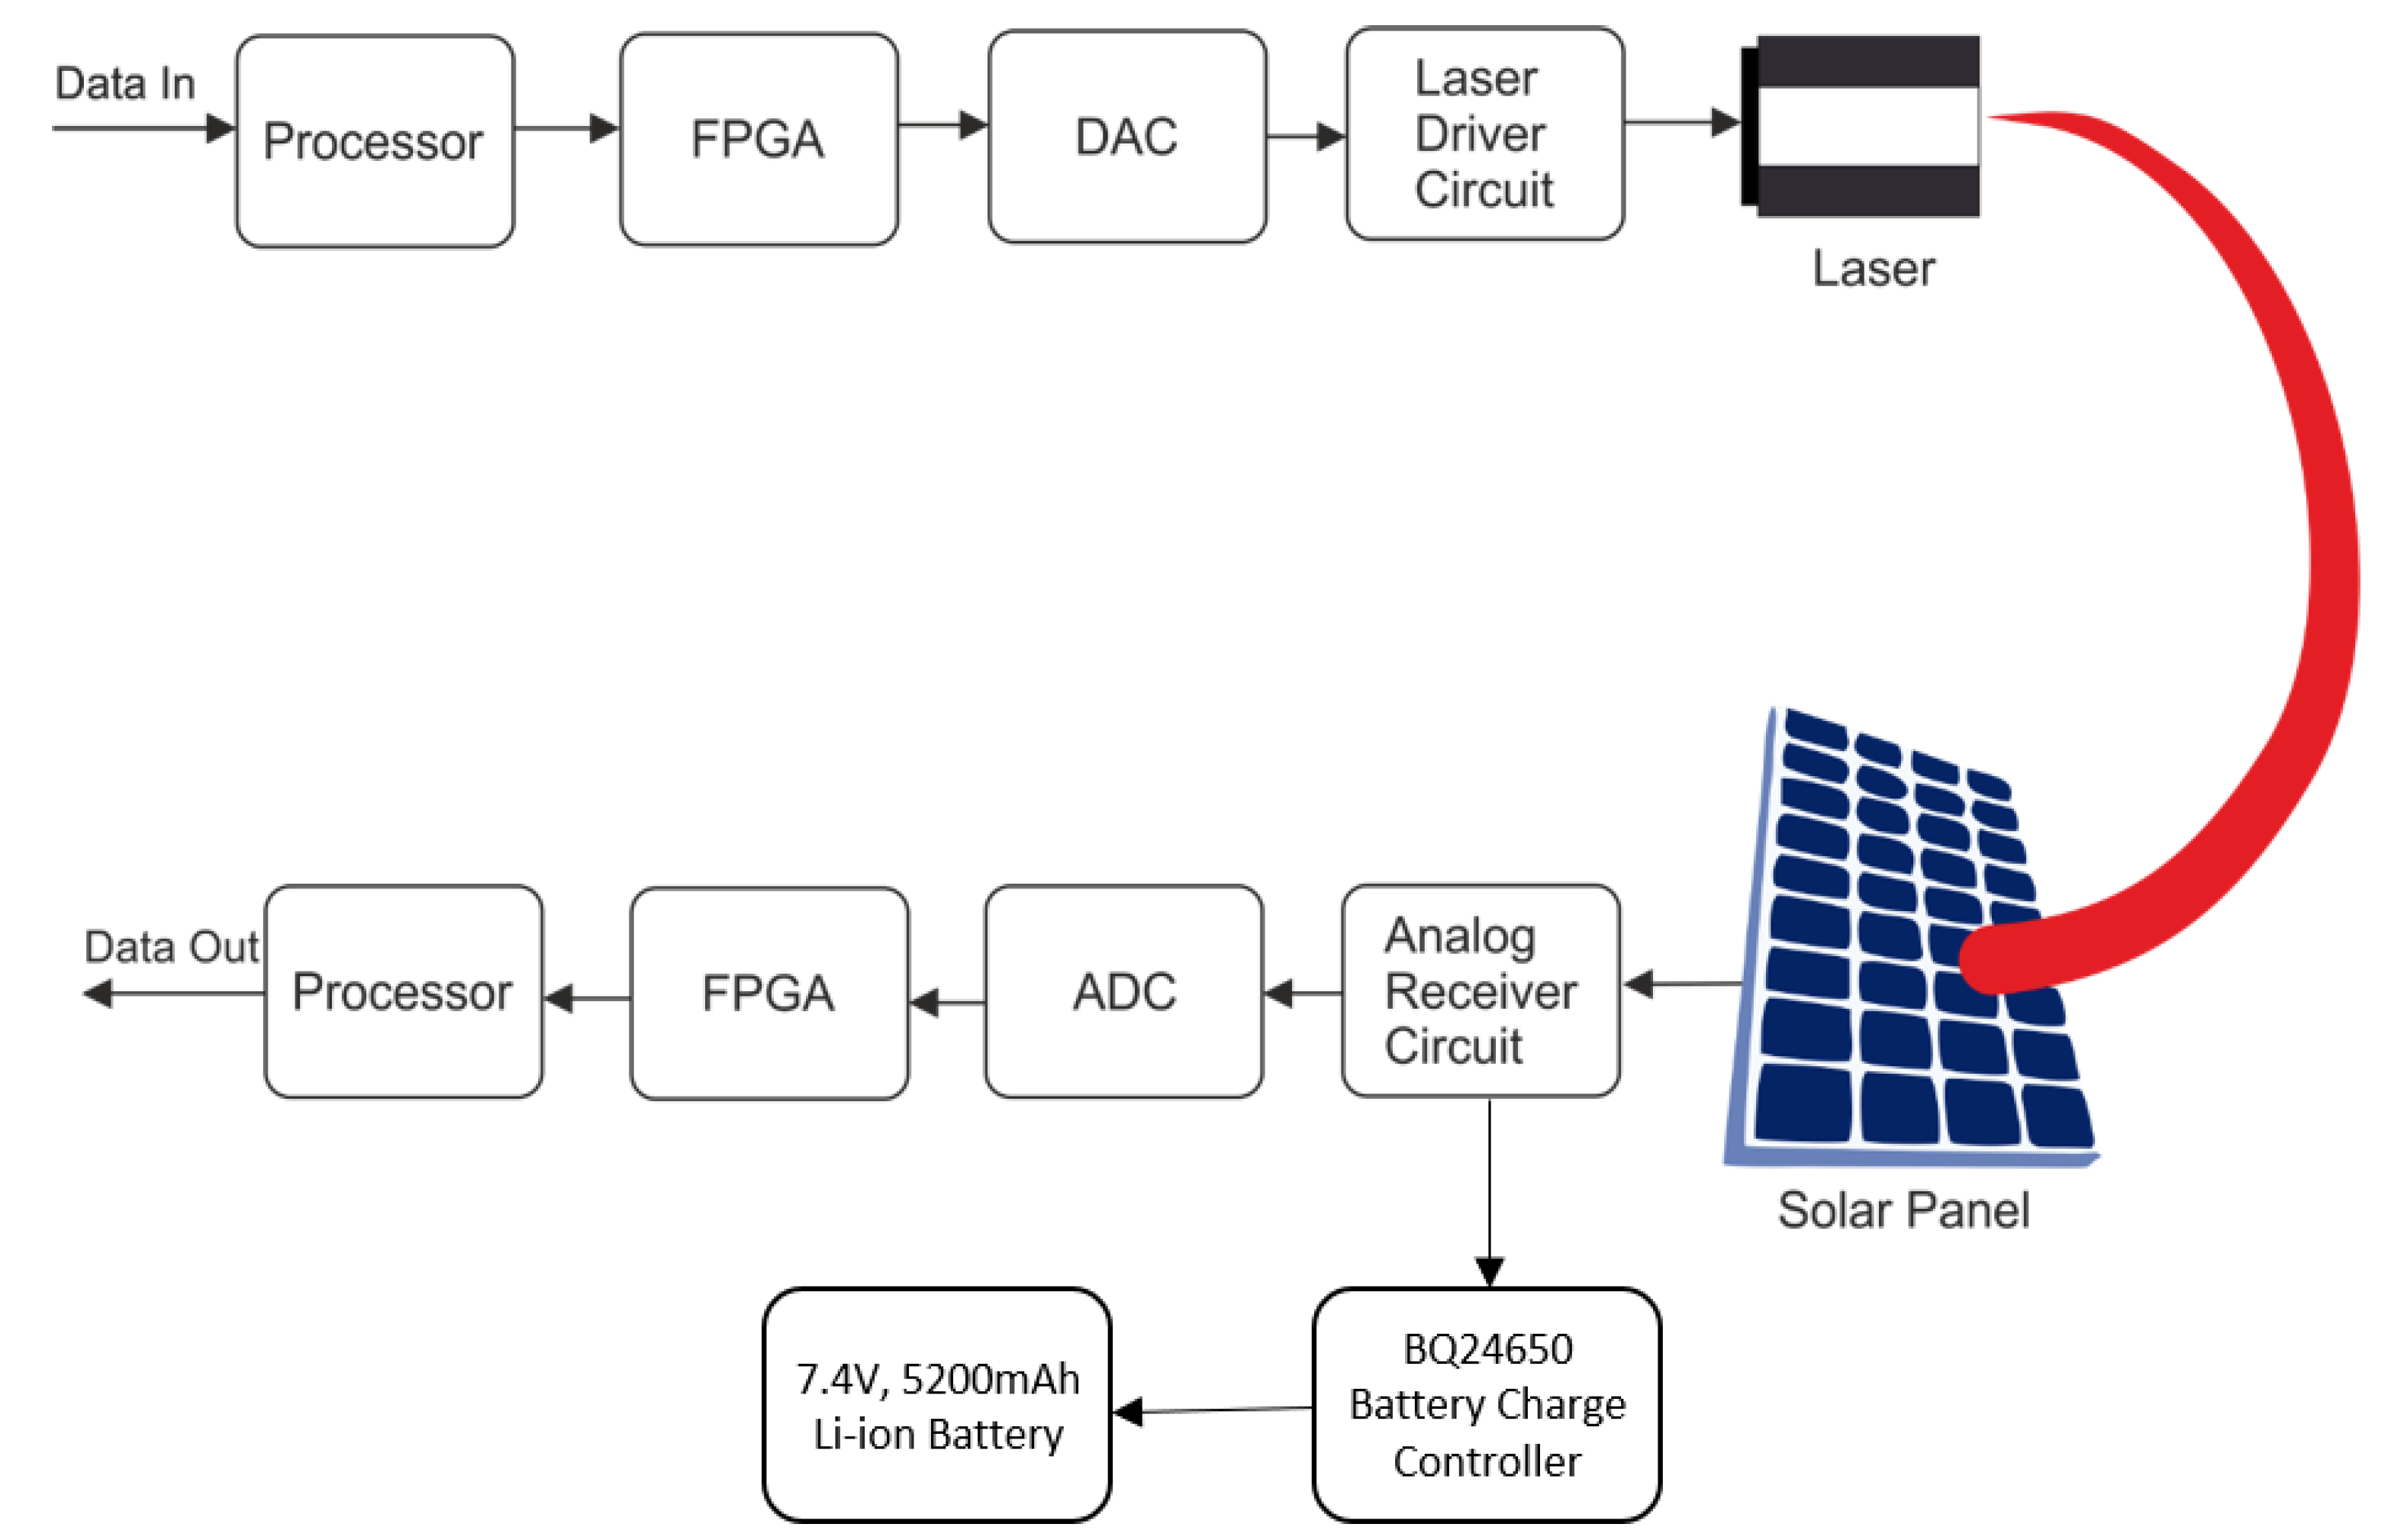
This section describes the flow of information from the transmitter to the receiver as well as the energy harvesting and storage capability of the system. Figure 14 depicts the working of the transmitter on one end and the receiver unit on the other end. The whole system is designed to be a fully functional bidirectional link with networking capability.
As shown in Figure 14, the data is first fed to the processor to generate the packet with the information to be transmitted as the payload. Then this whole packet is passed on to the FPGA where this is converted to a time-based signal using an OFDM based modulation technique. The DAC then converts the time-based bit symbols to an analogue waveform. As the channel varies due to the change in ambient light, weather, wind and visibility, the laser driver circuit needs to precondition this analogue waveform. This is based on the feedback of the channel conditions which is determined by the number of received packets dropped and ping time interval. When these two factors go above a given threshold, the optimum signal power search algorithm is triggered. The signal power is varied in a cyclic order of low-high-low on both the transmitters at each end. Meanwhile on both the receiver ends the received packets dropped and ping time interval is monitored. The combination of AC and DC signal power is chosen at each end at which the received packets dropped, and ping time interval is least. Then the signal is modulated onto the output intensity of the laser.
On the receiver side, the solar panel is simultaneously performing two tasks in one, harvesting energy from the sunlight and receiving the transmitted optical signal. As mentioned in Section 3.2, the receiver circuit separates the DC harvested energy from the AC signal. The equalised AC signal is then fed to the ADC which performs the inverse function of a DAC. Then the FPGA demodulates the time-based signal to back digital packets and passes it to the processor. Meanwhile, the DC harvested energy is fed to the charge controller circuit which charges a 3-cell 7.4 V Li-Ion battery with 5.2 Ah capacity. The peak power consumption of the processor, FPGA, DAC, ADC, the laser driver circuit and the receiver circuit is 6 W in total. The 38 Wh battery can, therefore, provide energy for the transceiver unit for about 6.33 hours in the absence of power, making it a self-sustained communication system.
4. Results
The developed OWC system was first deployed on the premises of the University of Edinburgh to test the communication performance under different daylight and weather conditions. The system was left unattended, running for two weeks to gather data.
Figure 15 shows the variation of the data rate of the link against varying wind conditions, visibility, daylight and weather conditions on a day. The weather data were collected from [24] for 7 May 2019 in Edinburgh. The throughput measurement was done using iPerf [25] and the traffic was forced to TCP/IP to emulate real-world bandwidth usage. The data rate peaks at 8 Mbps during nighttime and cloudy conditions. But during the sunnier parts of the day, the data rate dropped to 6.5 Mbps. This can be attributed to the additional thermal noise and shot noise generated in the solar panel when sunlight hits the panel directly. In this scenario, the generation of exciton would be at its peak which increases the thermal and shot noise. The added noise induces fall in signal-to-noise ratio leading to a noticeable drop in the data rate. The next noticeable drop is during periods of rain, where the data rate dropped to the lowest level of 4.5 Mbps. This fall in data rate can be attributed to the bad channel condition due to the presence of rain droplets that attenuate the signal power received [26].
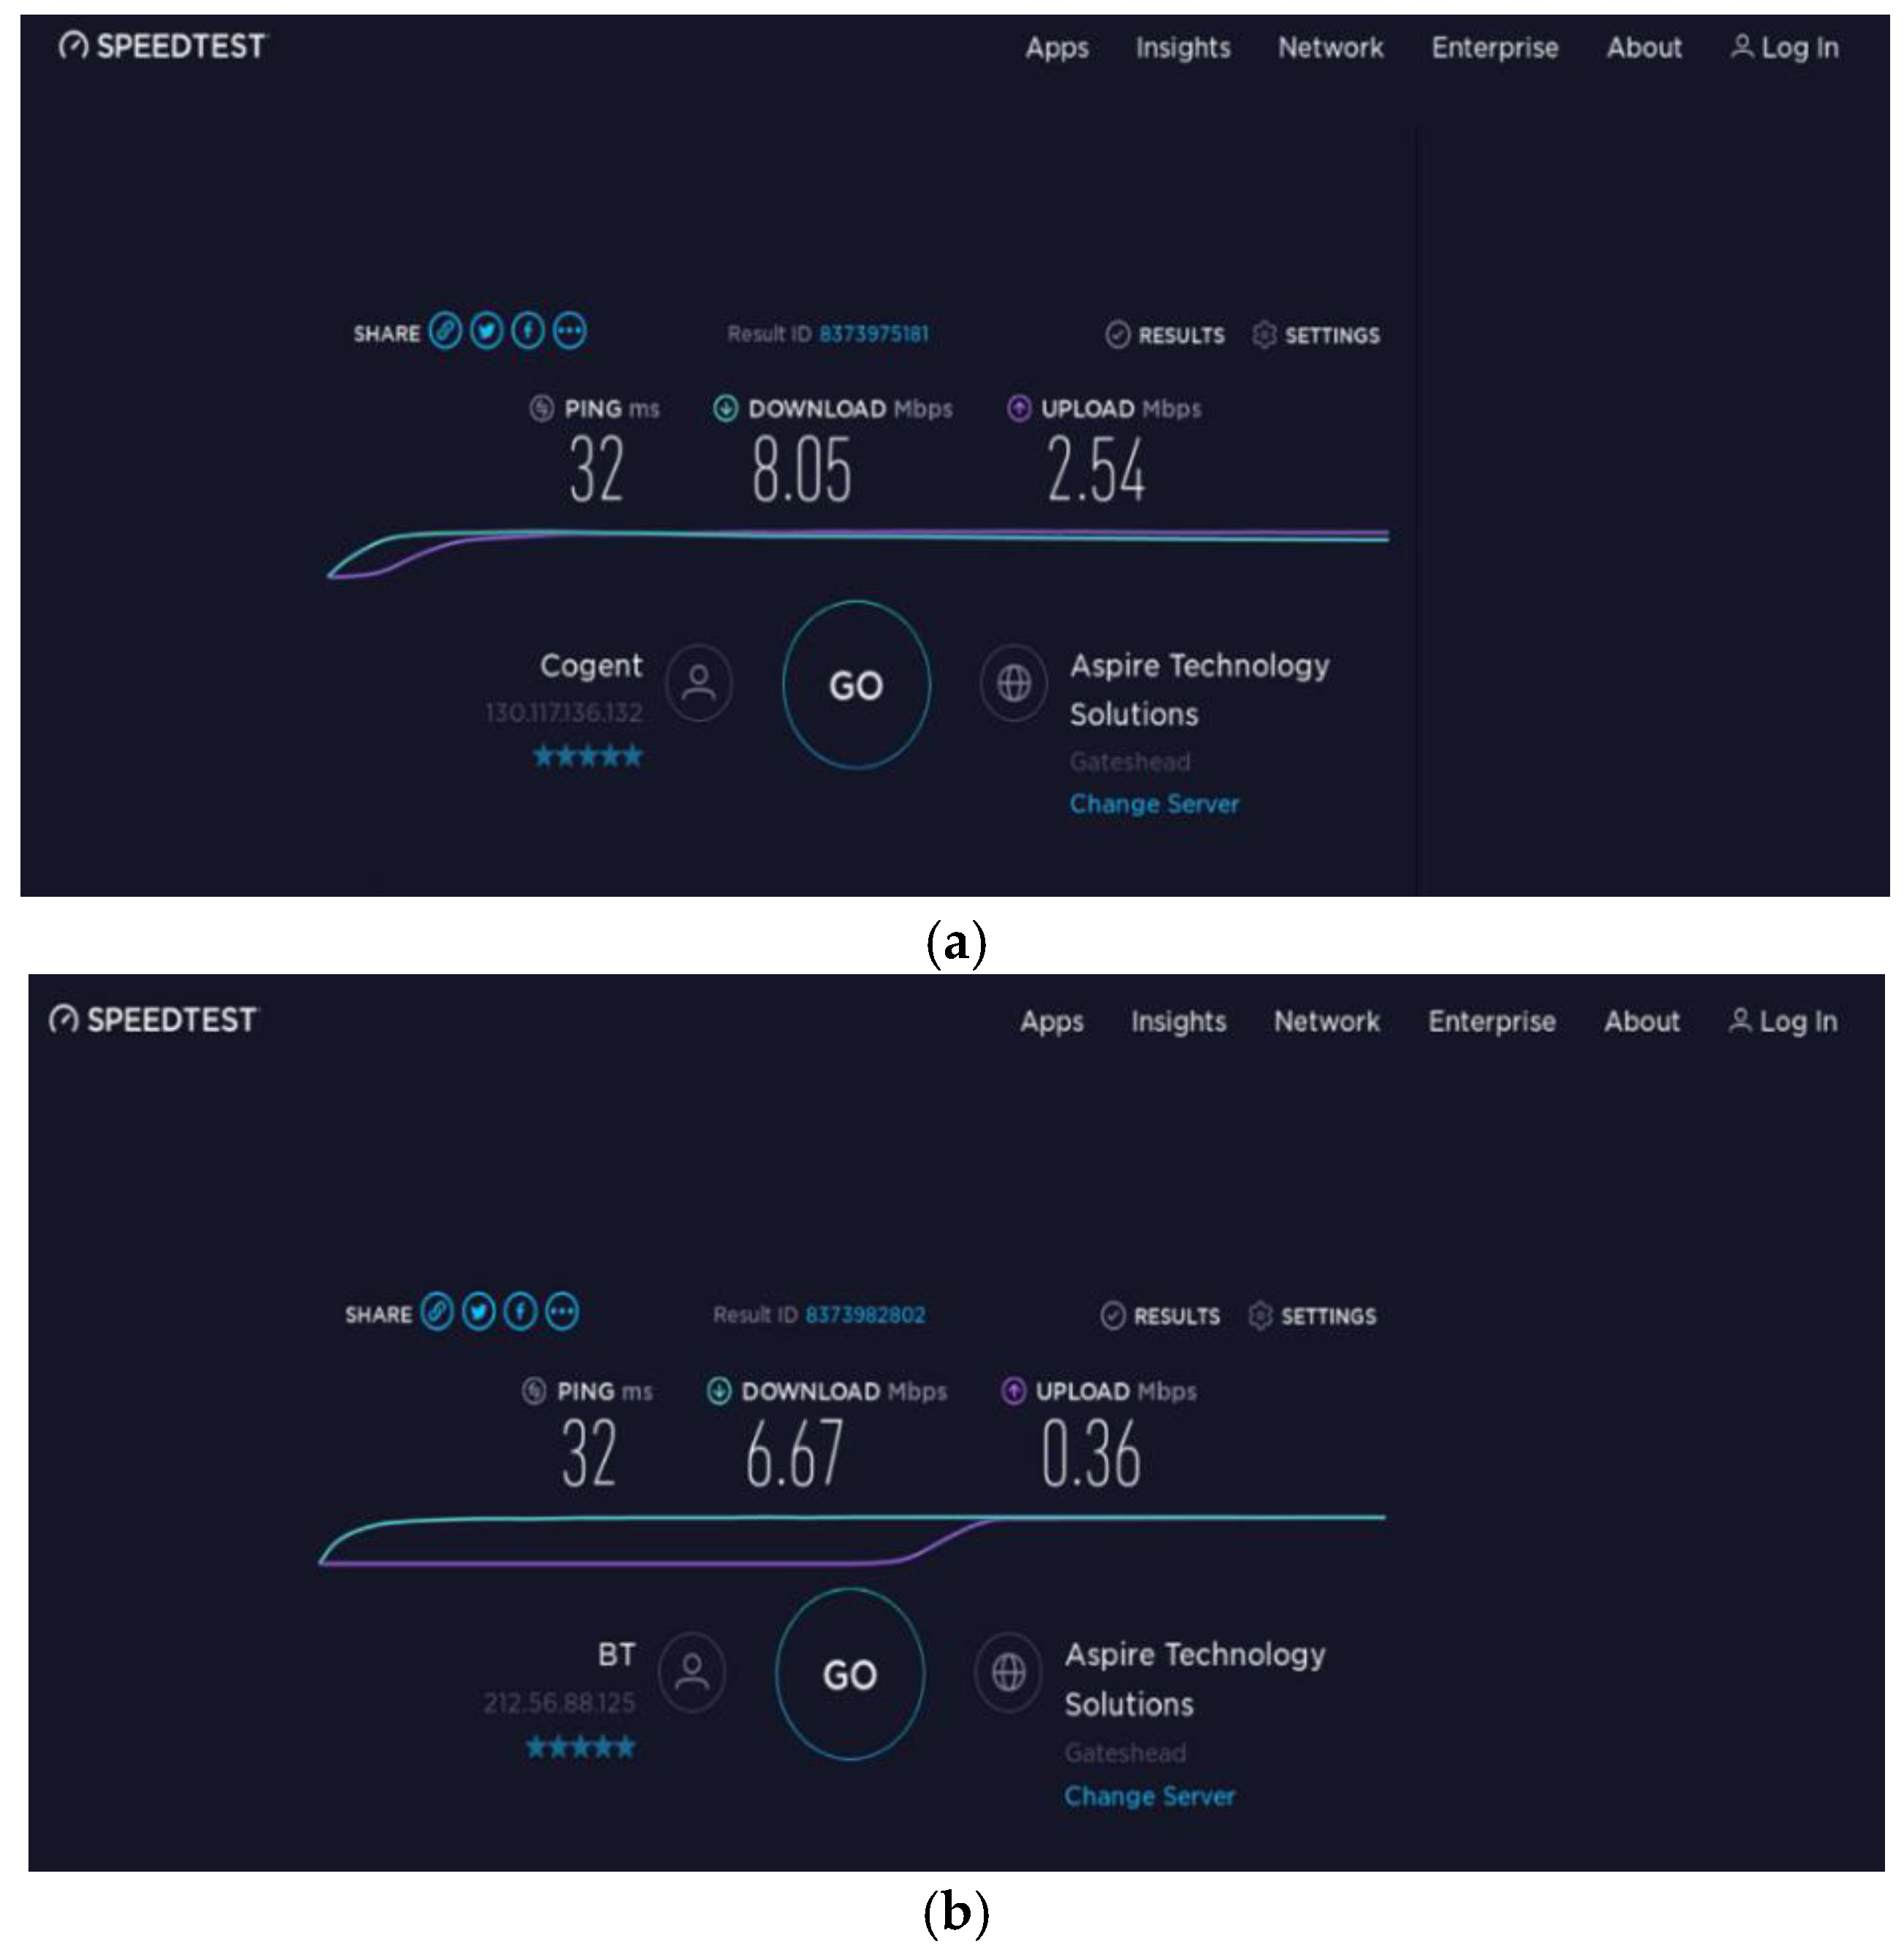
After the testing phase, the system was deployed in Graemsay, Orkney Islands. Figure 16 shows the installation of the units on the properties. A comparison between the installed optical link and the existing broadband connection shows that the upload speed increased by 8 times and the download speed increased by 20% (see Figure 17). The two links were aggregated and provided to the residents thereby doubling the user download experience and enabling them to use higher bandwidth-demanding services such as streaming multiple high-definition videos, high-definition video calls, etc.
5. Conclusions
This paper introduces an OWC system based on off-the-shelf lasers and solar cells. The solar panel simultaneously harvests 5 W of power and communicates at a data rate of 8 Mb/s. The system has been certified to be eye-safe (Class 1M) and has been installed on the Scottish island of Graemsay to demonstrate achievable performance in the field, under varying weather conditions. The data obtained shows no dropouts on the installed link, with data throughput in excess of existing landline-based broadband connections during 90% of the time.
The use of solar panels shows the possibility of self-powered optical data hubs providing long-distance communications at a much lower cost than exists presently. Cost reduction is achieved through equipment reuse, reducing the need for accurate optical alignment and removing the need for power delivery infrastructure without compromising on outcomes. This system is well suited to rural communities, where the cost of provisioning communication services can be prohibitive, despite strong demand from the scattered population.
The use of rooftop photovoltaic systems, consisting of large solar panel arrays, will enable the implementation of communication techniques designed to multiply the capacity of the link by using multiple independent receiver elements.
Author Contributions
S.D., J.F. and A.S. designed the system and performed the experiments; S.V. and E.P. performed the project administration and H.H. provided supervision and guidance.
Funding
This work was funded by the Department of Digital, Culture, Media and Sport of the United Kingdom as part of the 5G RuralFirst project.
Acknowledgments
The LiFi Research and Development Centre would like to express its gratitude to CloudNet IT Solutions and the Orkney Council for their advice on the design and deployment of the system and their work on the installation of the backhaul link. The LRDC would also like to thank the Northern Lighthouse Board for their support of the project.
Conflicts of Interest
The authors declare no conflict of interest.
Abbreviations
The following abbreviations are used in this manuscript:
| ADC | Analog-to-Digital Converter |
| DAC | Digital-to-Analog Converter |
| FWHM | Full Width at Half-Maximum |
| FPGA | Field-Programmable Gate Array |
| LASER | Light Amplification by Stimulated Emission of Radiation |
| LED | Light-Emitting Diode |
| MPE | Maximum Permissible Exposure |
| MPPT | Maximum Power Point Tracking |
| OFDM | Orthogonal Frequency Division Multiplexing |
| OWC | Optical Wireless Communication |
| PD | Photodiode |
| RF | Radio Frequency |
| SNR | Signal-to-Noise Ratio |
| VCSEL | Vertical-Cavity Surface-Emitting Laser |
References
- Elgala, H.; Mesleh, R.; Haas, H. Indoor optical wireless communication: Potential and state-of-the-art. IEEE Commun. Mag. 2011, 49, 56–62. [Google Scholar] [CrossRef]
- Haas, H.; Yin, L.; Wang, Y.; Chen, C. What is LiFi? J. Lightwave Technol. 2016, 34, 1533–1543. [Google Scholar] [CrossRef]
- Light Communications Alliance. Light Communications Alliance. 2019. Available online: http://lightcommunications.org/ (accessed on 3 August 2019).
- Tsonev, D.; Chun, H.; Rajbhandari, S.; McKendry, J.J.D.; Videv, S.; Gu, E.; Haji, M.; Watson, S.; Kelly, A.E.; Faulkner, G.; et al. A 3-Gb/s Single-LED OFDM-Based Wireless VLC Link Using a Gallium Nitride µLED. IEEE Photonics Technol. Lett. 2014, 26, 637–640. [Google Scholar] [CrossRef]
- Charles, H.K., Jr.; Ariotedjo, A.P. Review of amorphous and polycrystalline thin film silicon solar cell performance parameters. Sol. Energy 1980, 24, 329–339. [Google Scholar] [CrossRef]
- Hameiri, Z. Photovoltaics literature survey (No. 125). Progress Photovoltaics Res. Appl. 2016, 24, 405–407. [Google Scholar] [CrossRef]
- Bhandari, K.P.; Ellingson, R.J. A Comprehensive Guide to Solar Energy Systems; Academic Press: Cambridge, MA, USA, 2018; pp. 233–254. [Google Scholar]
- Saltsman, S.O. The Silicon Solar Cell as an Optical Detector; Florida Technological University: Orlando, FL, USA, 1976. [Google Scholar]
- Kim, S.M.; Won, J.S. Simultaneous reception of visible light communication and optical energy using a solar cell receiver. In Proceedings of the 2013 International Conference on ICT Convergence (ICTC), Jeju, Korea, 14–16 October 2013; pp. 896–897. [Google Scholar] [CrossRef]
- Wang, Z.; Tsonev, D.; Videv, S.; Haas, H. Towards Self-powered solar panel receiver for optical wireless communication. In Proceedings of the 2014 IEEE International Conference on Communications (ICC), Sydney, NSW, Australia, 10–14 June 2014. [Google Scholar]
- Wang, Z.; Tsonev, D.; Videv, S.; Haas, H. On the design of a solar panel receiver for optical wireless communication with simultaneous energy harvesting. IEEE J. Sel. Areas Commun. 2015, 33, 1612–1623. [Google Scholar]
- Zhang, S.; Tsonev, D.; Videv, S.; Ghosh, S.; Turnbull, G.A.; Samuel, I.D.W.; Haas, H. Organic solar cells as high-speed data detectors for visible light communication. Optica 2015, 2, 607–610. [Google Scholar] [CrossRef] [Green Version]
- Fakidis, J.; Videv, S.; Helmers, H.; Haas, H. 0.5-Gb/s OFDM-Based Laser Data and Power Transfer Using a GaAs Photovoltaic cell. IEEE Photonics Technol. Lett. 2018, 30, 841–844. [Google Scholar] [CrossRef]
- Lashkari, A.H.; Danesh, M.M.S.; Samadi, B. A survey on wireless security protocols (WEP, WPA and WPA2/802.11i). In Proceedings of the 2009 2nd IEEE International Conference on Computer Science and Information Technology, Beijing, China, 8–11 August 2009; pp. 48–52. [Google Scholar] [CrossRef]
- Rana, F. Photodetectors and Solar Cells. In Semiconductor Optoelectronics; Rana, F., Ed.; Cornell University: Ithaca, NY, USA.
- Solar Technology International Ltd. 5 Watt Solar Panel Kit. Available online: https://www.solartechnology.co.uk/pv-logic/5w-solar-panel-kit (accessed on 9 January 2019).
- Fakidis, J.; Videv, S.; Kucera, S.; Claussen, H.; Haas, H. Indoor Optical Wireless Power Transfer to Small Cells at Nighttime. J. Lightwave Technol. 2016, 34, 3226–3258. [Google Scholar] [CrossRef]
- Bloom, S.; Korevaar, E.; Schuster, J.; Williebrand, H. Understanding the performance of free-space optics. J. Opt. Netw. 2003, 2, 178. [Google Scholar] [CrossRef]
- British Standards Institution. Safety of Laser Products. Equipment Classification and Requirements; BS EN 60825-1:2014; BSI: London, UK, 2014. [Google Scholar]
- OSRAM Opto Semiconductors GmbH. BIDOS®, PLPVQ 940A. Available online: https://www.osram.com/ecat/BIDOS%C2%AE%20PLPVQ%20940A/com/en/class_pim_web_catalog_103489/global/prd_pim_device_5062066/ (accessed on 6 February 2019).
- Texas Instruments Inc. BQ24650 High Efficiency Synchronous Switch-Mode Charger Controller—Solar battery charger. Available online: http://www.ti.com/product/BQ24650 (accessed on 25 March 2019).
- Matti Tukiainen. Sun Graph Edinburgh. GAISMA. 2005. Available online: https://www.gaisma.com/en/location/edinburgh.html (accessed on 12 July 2019).
- Greenstream Publishing Limited. Solar Irradiance. Solar Electricity Handbook. 2009. Available online: http://www.solarelectricityhandbook.com/solar-irradiance.html (accessed on 10 July 2019).
- Time and Date. Time and Date. 1995. Available online: https://www.timeanddate.com (accessed on 7 May 2009).
- Dugan, J.; Estabrook, J.; Ferbuson, J.; Gallatin, A.; Gates, M.; Gibbs, K.; Hemminger, S.; Jones, N.; Qin, F.; Renker, G.; et al. iPerf—The TCP, UDP and SCTP Network Bandwidth Measurement Tool. Available online: https://iperf.fr/ (accessed on 12 July 2019).
- Khalighi, M.A.; Uysal, M. Survey on Free Space Optical Communication: A communication theory perspective. IEEE Commun. Surv. Tutor. 2014, 16, 2231–2258. [Google Scholar] [CrossRef]
Figure 1.
Deployment architecture.

Figure 2.
PN junction of a solar cell [15].
Figure 2.
PN junction of a solar cell [15].

Figure 3.
Circuit model of a solar cell as a data receiver [15].
Figure 3.
Circuit model of a solar cell as a data receiver [15].

Figure 4.
Single-diode model of a solar cell for energy harvesting.

Figure 5.
Illumination patterns on a solar panel (a) highly concentrated; (b) partially illuminated; (c) completely illuminated.
Figure 5.
Illumination patterns on a solar panel (a) highly concentrated; (b) partially illuminated; (c) completely illuminated.

Figure 6.
Frequency response of solar panel with different illumination levels.

Figure 7.
Frequency response of the laser driver.

Figure 8.
Incoherent irradiance of the vertical-cavity surface-emitting laser (VCSEL) array on a square detector at 1 cm.
Figure 8.
Incoherent irradiance of the vertical-cavity surface-emitting laser (VCSEL) array on a square detector at 1 cm.

Figure 9.
(a) Basic optical setup at the transmitter (b) laser beam at the enclosure’s aperture.

Figure 10.
Beam profile at 20 m (a) simulated using Zemax; (b) captured using an infrared camera.

Figure 11.
Receiver functional block diagram.

Figure 12.
Frequency response of the solar panel with and without equalisation.

Figure 13.
Channel response on a spectrum analyser.

Figure 14.
Overall system architecture.

Figure 15.
Data rate measurement plot against the daylight and different weather conditions.

Figure 16.
Installation at the location (a) residence property; (b) residence property to the lighthouse.
Figure 16.
Installation at the location (a) residence property; (b) residence property to the lighthouse.

Figure 17.
Internet speed test measurements (a) through the optical link and (b) through landline broadband.
Figure 17.
Internet speed test measurements (a) through the optical link and (b) through landline broadband.


Table 1.
Power generated from the solar panel and power delivered to the battery.
| Incident Light (W) | Power Generated (W) | Power Delivered (W) |
|---|---|---|
| 30.45 | 4.11 | 3.81 |
© 2019 by the authors. Licensee MDPI, Basel, Switzerland. This article is an open access article distributed under the terms and conditions of the Creative Commons Attribution (CC BY) license (http://creativecommons.org/licenses/by/4.0/).
Share and Cite
MDPI and ACS Style
Das, S.; Poves, E.; Fakidis, J.; Sparks, A.; Videv, S.; Haas, H. Towards Energy Neutral Wireless Communications: Photovoltaic Cells to Connect Remote Areas. Energies 2019, 12, 3772. https://doi.org/10.3390/en12193772
AMA Style
Das S, Poves E, Fakidis J, Sparks A, Videv S, Haas H. Towards Energy Neutral Wireless Communications: Photovoltaic Cells to Connect Remote Areas. Energies. 2019; 12(19):3772. https://doi.org/10.3390/en12193772
Chicago/Turabian StyleDas, Sovan, Enrique Poves, John Fakidis, Adrian Sparks, Stefan Videv, and Harald Haas. 2019. "Towards Energy Neutral Wireless Communications: Photovoltaic Cells to Connect Remote Areas" Energies 12, no. 19: 3772. https://doi.org/10.3390/en12193772
Note that from the first issue of 2016, this journal uses article numbers instead of page numbers. See further details here.