Effect of the Implementation of Carbon Capture Systems on the Environmental, Energy and Economic Performance of the Brazilian Electricity Matrix


Chemical Engineering Department, Polytechnic School, University of Sao Paulo, Avenida Professor Lineu Prestes, 580, Bloco 18—Conjunto das Químicas, São Paulo 05508-000, SP, Brazil
*
Author to whom correspondence should be addressed.
Energies 2019, 12(2), 331; https://doi.org/10.3390/en12020331
Submission received: 14 December 2018
/
Revised: 16 January 2019
/
Accepted: 18 January 2019
/
Published: 21 January 2019
(This article belongs to the Special Issue Carbon Capture and Storage)
Abstract
:This study examined the effect of Carbon Capture and Storage units on the environmental, energy and economic performance of the Brazilian electric grid. Four scenarios were established considering the coupling of Calcium Looping (CaL) processes to capture CO2 emitted from thermoelectric using coal and natural gas: S1: the current condition of the Brazilian grid; S2 and S3: Brazilian grid with CaL applied individually to coal (TEC) and gas (TGN) operated thermoelectric; and S4: CaL is simultaneously coupled to both sources. Global warming potential (GWP) expressed the environmental dimension, Primary Energy Demand (PED) was the energy indicator and Levelised Cost of Energy described the economic range. Attributional Life Cycle Assessment for generation of 1.0 MWh was applied in the analysis. None of the scenarios accumulated the best indexes in all dimensions. Regarding GWP, S4 totals the positive effects of using CaL to reduce CO2 from TEC and TGN, but the CH4 emissions increased due to its energy requirements. As for PED, S1 and S2 are similar and presented higher performances than S3 and S4. The price of natural gas compromises the use of CaL in TGN. A combined verification of the three analysis dimensions, proved that S2 was the best option of the series due to the homogeneity of its indices. The installation of CaL in TECs and TGNs was effective to capture and store CO2 emissions, but the costs of this system should be reduced and its energy efficiency still needs to be improved.
1. Introduction
According to information released by the International Panel on Climate Change (IPCC), global Greenhouse Gases emissions (GHG) in 2010 exceeded the 49 Gt CO2eq mark. The most significant portion of this total originates from the generation of electric and thermal energy from fossil fuel burning. Prognoses by the same institution indicate that, by 2030, atmospheric CO2 concentrations will reach between 600 and 1550 ppm, making the dynamic balance between anthropic systems and the biosphere unsustainable [1,2]. The Brazilian matrix differs slightly from this profile, given that 43% of the energy consumed in the country in 2017 originated from renewable sources. This behavior is strongly influenced by the domestic electricity supply, whose share of renewables was led by hydroelectric power plants, contributing with 65% of the generated total [3]. This model is, however, threatened in extreme situations, such as those recorded between 2012 and 2015, when effects as changes in rainfall regimes, associated with increases in demand (which was not fully supplied by hydropower), exposed Brazil to successive energy crises [4].
Phenomena such as population growth, urbanization, improved industrialization and increased availability of digital and computer systems over the past decade have increased the country’s domestic electricity supply [3]. This scenario led the national electric system operator to seek short-term ways to enhance the capacity of the Brazilian electric grid (BR grid). This strategy has increased the participation of fossil sources, such as coal, petroleum derivatives and natural gas in the BR grid and, consequently, GHG emissions [5,6].
Faced with this situation, actions aimed at raising the electricity conversion efficiency and/or utilization rate, as well as the intensification of renewable source use, were established in order to improve the environmental performance levels of the system [7]. However, the discovery of gas and oil fields on the coastlines of the states of Rio de Janeiro and São Paulo, increasing energy generation potential from these resources, projects a scenario in which fossil sources will continue to represent a significant portion of the BR grid.
An opportunity to reconcile the domestic electricity supply expansion policy with the defined GHG emission reduction proposals is to adopt Carbon Capture and Storage (CCS) technologies. Such systems make it possible to separate the CO2 generated in anthropic transformations that use combustion of fossils as way to generate energy to later store it in places where the CO2 does not come in contact with the atmosphere [8,9,10].
Recent developments give CCS the status of a technically-economically viable alternative in terms of mitigating global warming. In this context, the study carried out by Cormos and Petrescu [11], who evaluated the suitability of the Calcium Looping (CaL) process as a carbon capture option in coal- and natural gas-operated electricity generation systems, is noteworthy. The authors observed significant decreases in atmospheric CO2 emissions (66–82 kg/MWh) compared to plants where CCS were not implanted (760–930 kg/MWh). Following the same trend, Cormos [12] compared the performance of reactive absorption systems based on methyldiethanolamine and of CaL systems in capturing CO2 in gas-powered plants. The author noted that the CCS approach provides better environmental and economic indicators than its counterpart for the study conditions.
Other researchers are more skeptical about the effectiveness of CCS in curbing global warming. In their view, these techniques are innocuous, as they only delay the release of CO2 into the air, since this gas cannot be stored indefinitely [13,14,15,16,17,18]. Moreover, for these scientists, the processes typically applied by CCS—absorption, adsorption, and membrane separation—are also uneconomical. Thus, their implementation would raise the electricity unit price in situations where regulations or subsidies are not practiced. Adanez et al. [14] and Rochedo et al. [19] also demonstrated the intensive energy character of CCS technologies that can reduce the energy efficiency and operational flexibility of plants in which they are applied. There is, however, one wing of the scientific community that prefers to examine these arrangements more rigorously. Performing independent studies, Singh et al. [20], Korre et al. [21] and Branco et al. [22] noted that, even in cases where the use of CCS results in high CO2 contents in combustion gases of natural gas- and coal-fueled thermoelectric plants, this effect will be attenuated due to GHG emissions occurring during other stages of the same process cycle. In order to reach this conclusion, the authors comprehensively determined the releases of GHG along the established productive arrangement, so that the CCS could fulfill the applications for which they were designed. This estimation was possible only through the Life Cycle Assessment (LCA) technique. Singh et al., Korre et al. and Branco et al. noted that by adopting the LCA approach—from which GHG emissions from energy and chemical consumption and infrastructure resources are also included in performance analysis—the efficiency of carbon sequestration systems could be drastically reduced, reaching limits of only 14% to 23%.
The literature records an expressive set of studies in which the application of CCS systems in fossil-fueled thermoelectric plants is addressed under different perspectives. However, a survey carried out with the same sources did not identify correlated research in which multiple analysis dimensions were verified by applying a systemic approach. This research seeks to fill this gap, even if only partially, by approaching the effects of the installation of CCS systems on the environmental, energy and economic performance of the Brazilian grid in a systemic way.
The findings of this initiative will, hopefully, serve as a basis for future Brazilian energy planning to address the trend antagonism established between the (expected) expansion of the domestic electricity supply and the (desirable) reduction of the global warming impacts that originate from electricity generation in Brazil.
2. Material and Methods
The method established for this study includes six steps: (i) characterization in terms of average technology, operational aspects, resource consumption and emissions from the current Brazilian grid; (ii) definition of electricity generation scenarios considering CCS implementation in coal and natural gas thermoelectric plants; (iii) estimate of the consumption of raw materials, inputs, process additives and utilities required by CCS systems integrated with thermoelectric plants; (iv) drawing up electricity generation Life Cycle Inventories coupled with CCS systems to quantify global warming impacts from GHG emissions and Primary Energy Demand throughout the life cycle of the defined arrangements; (v) accomplishment of an Economic Analysis to determine the costs associated with each scenario; and (vi) performance of a combined analysis of the dimensions assessed in the study, in order to verify synergies and discrepancies arising from this integration.
2.1. Backgrounds
2.1.1 Current Overview of the Brazilian Grid
The Brazilian electric generator complex is characterized by the grouping of large hydroelectric projects, which represent 96 GW of installed capacity [23,24,25]. The largest fraction of hydroelectric generation occurs in plants that use combined cycles, with an installed capacity of over 4.0 GW, and average yield of ηCC,H ≈ 55%. These units are concentrated in the Southeast region, which also presents the highest electric energy demand rate [26]. The Brazilian grid comprises a share of thermoelectric generation derived from natural gas, fuel oil and coal burning, representing 27 GW of the total available power. In most cases, coal-fired power plants operate under a subcritical cycle, and use Pulverized Coal Combustion (PCC) systems, ηPCC ≤ 40% [23]. Finally, the electric generation from petroleum derivatives is carried out in boilers or internal combustion engines. The fuels regularly used in these situations are fuel oil and diesel [23].
Another 14 GW of the Brazilian grid’s installed comes from biomass-powered thermoelectric plants. Typically, the technological routes of this generation source comprise steam generator cycles with backpressure and condensation-extraction turbines, as well as a combined cycle integrated with biomass gasification. Although different types of fuel can be used in the process (i.e., wood, crop residues from rice, soy, and corn, or even urban and industrial waste), about 80% of the biomass consumed in Brazil for energy purposes is derived from bagasse and straw of sugarcane [27]. Boiler-turbine assemblies that operate according to the Rankine or Brayton cycles and produce steam at 65 bar and 550 °C have been extensively applied in electricity exports [23,26,27,28].
Brazilian nuclear generation comes from two plants: Angra I, comprising 640 MW of installed capacity, and Angra II, with capacity for 1350 MW. Located in the state of Rio de Janeiro, these plants are of the Pressurized Water Reactor (PWR) type [29]. Brazil has 534 wind farms distributed mostly in the states of Rio Grande do Norte, Bahia, Ceará, Rio Grande do Sul and Piauí. This generation source has significant expanse since 2013, reaching 13 GW of installed capacity in the current grid. Wind energy is seen as a promising option for future DESs, as it displays lower environmental impacts than some of its congeners [24,25].
Finally, by mid-2018, the country registered over 30,000 photovoltaic solar generation facilities, which together make up 2.4 GW of capacity [30]. Even though power indices are less significant than those from other renewable sources, the number of solar micro-generators grew by 407% from 2015 to 2017. This behavior can be attributed to technology maturing, lower investment costs, environment awareness by the population and fiscal and political incentives provided by the Brazilian government [23,29]. Figure 1 depicts the Brazilian installed capacity of electricity generation in the year of 2017 [30].
2.1.2. Carbon Capture and Storage and Calcium Looping Technology
Given their CO2 generation volumes, CCS systems have spread more significantly in the energy, petrochemical, cement and metallurgical sectors [8,9,31]. In the energy sector such technologies are even seen as a means to enable the continuous use of fossil resources—thus avoiding their substitution by renewable sources—despite GHG emission levels [32,33].
In this study, CCS systems were represented by the CaL process. This decision was based on the following factors: (i) technological concept compatibility between the CaL process and the active thermoelectric plants in the country, which allows for system implementation without requiring significant adjustments to the electric generation power plant; (ii) reduced energy consumption; and, (iii) lower implementation and operating costs than those estimated for equivalent technologies [34,35].
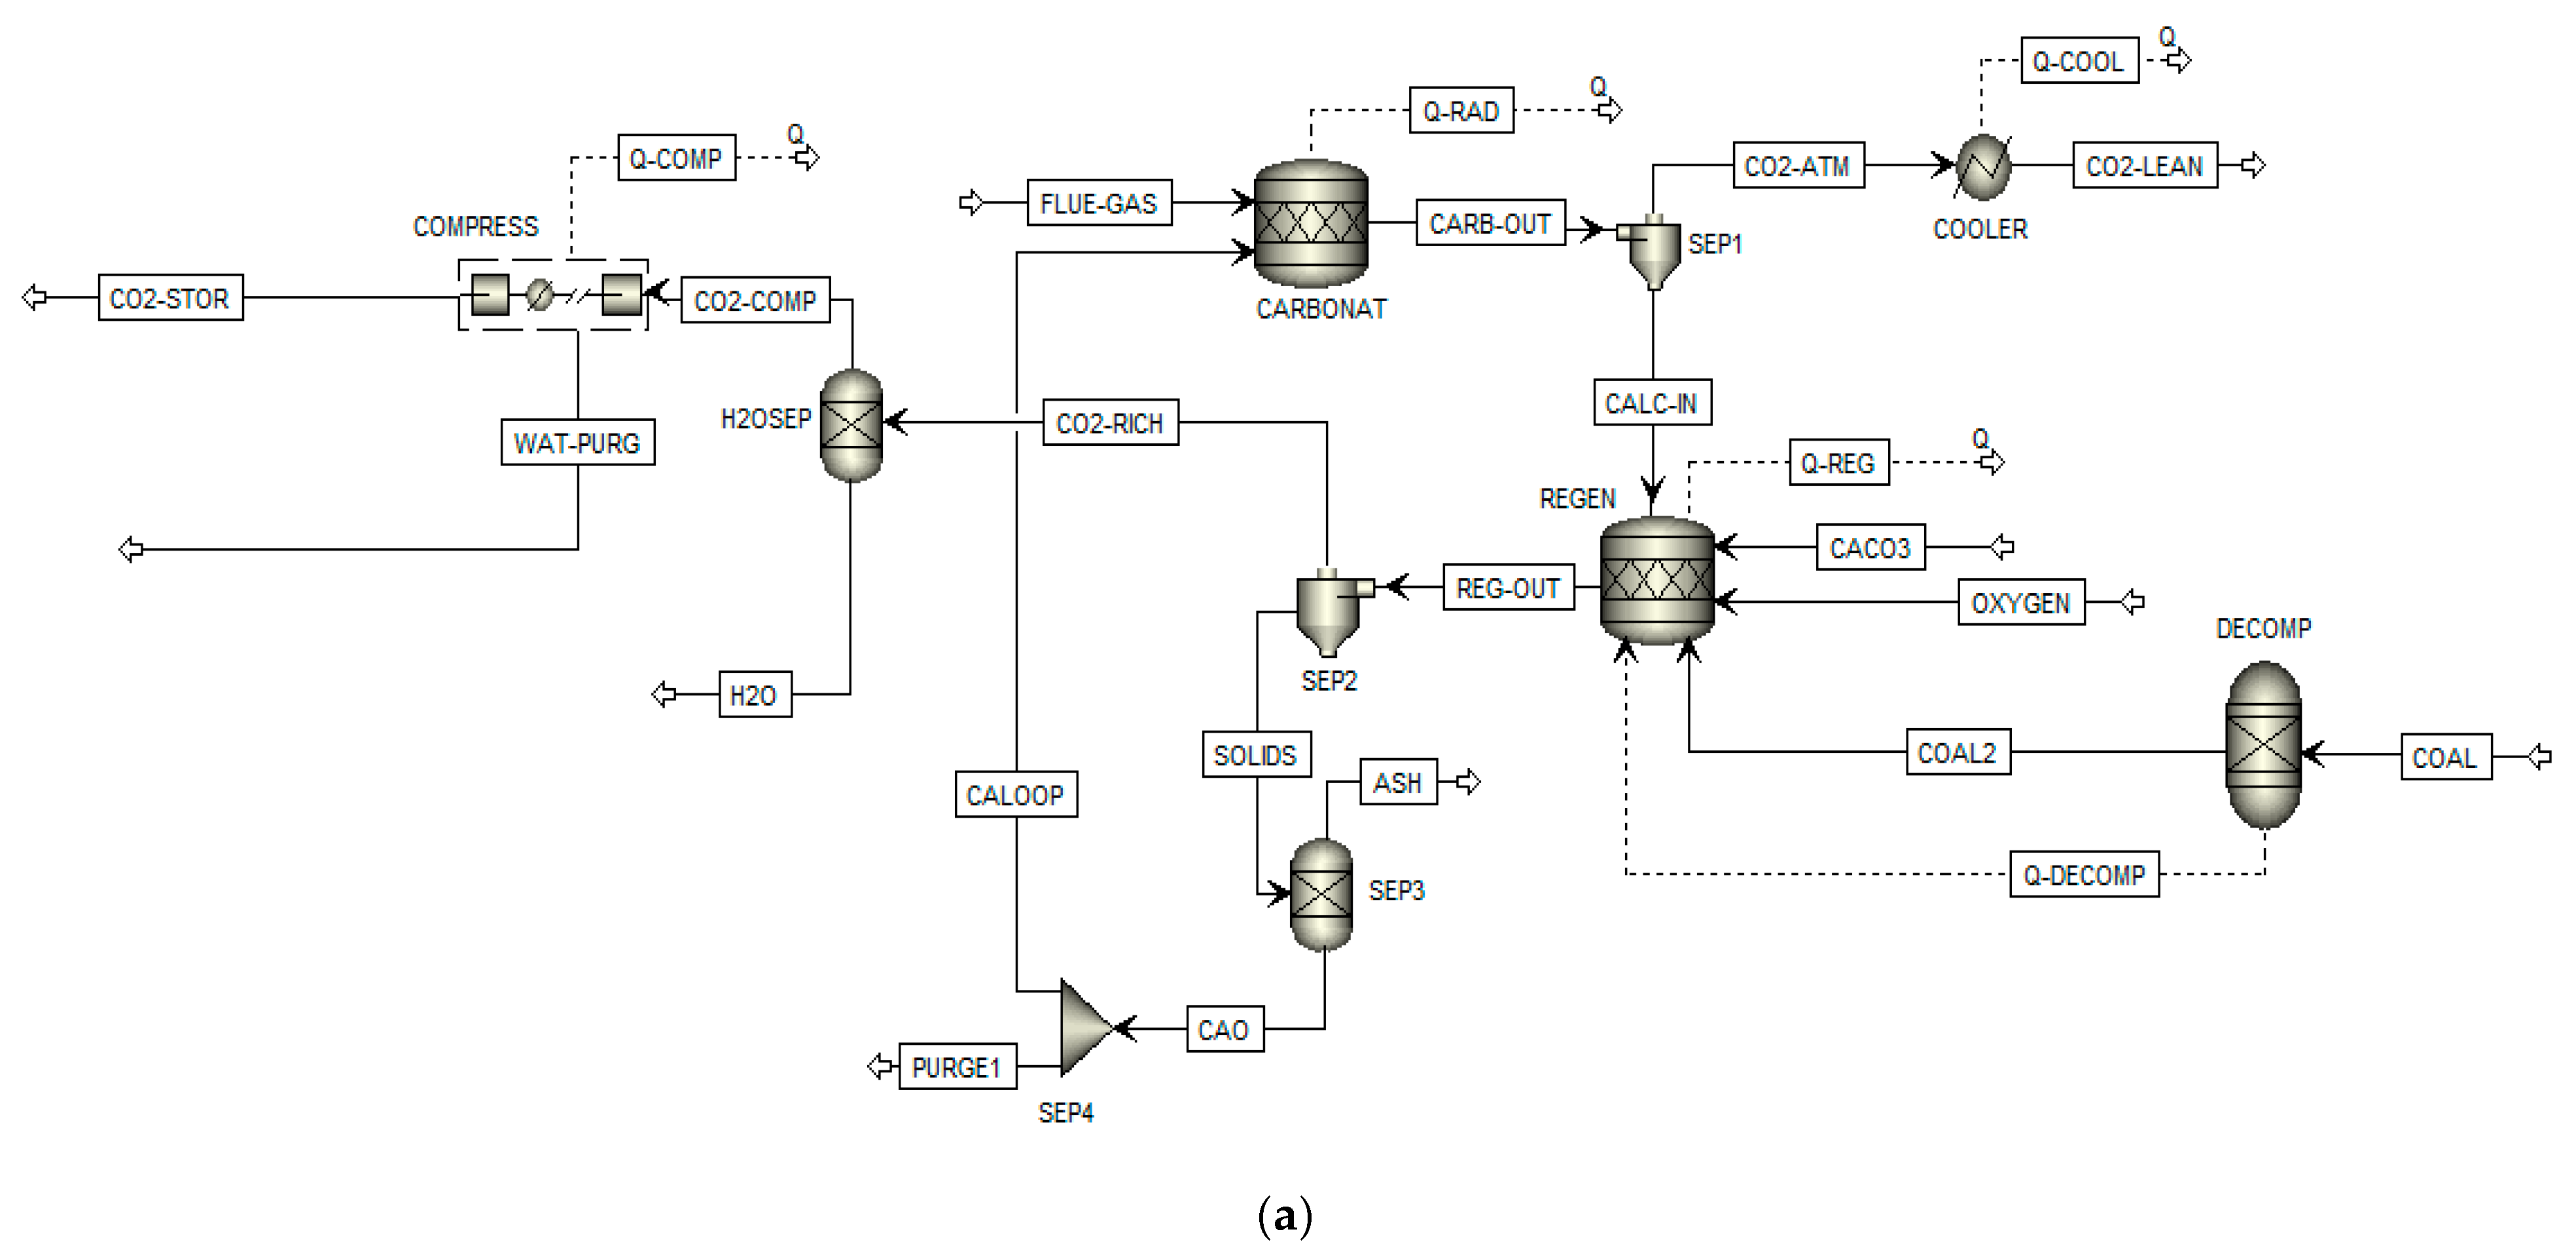
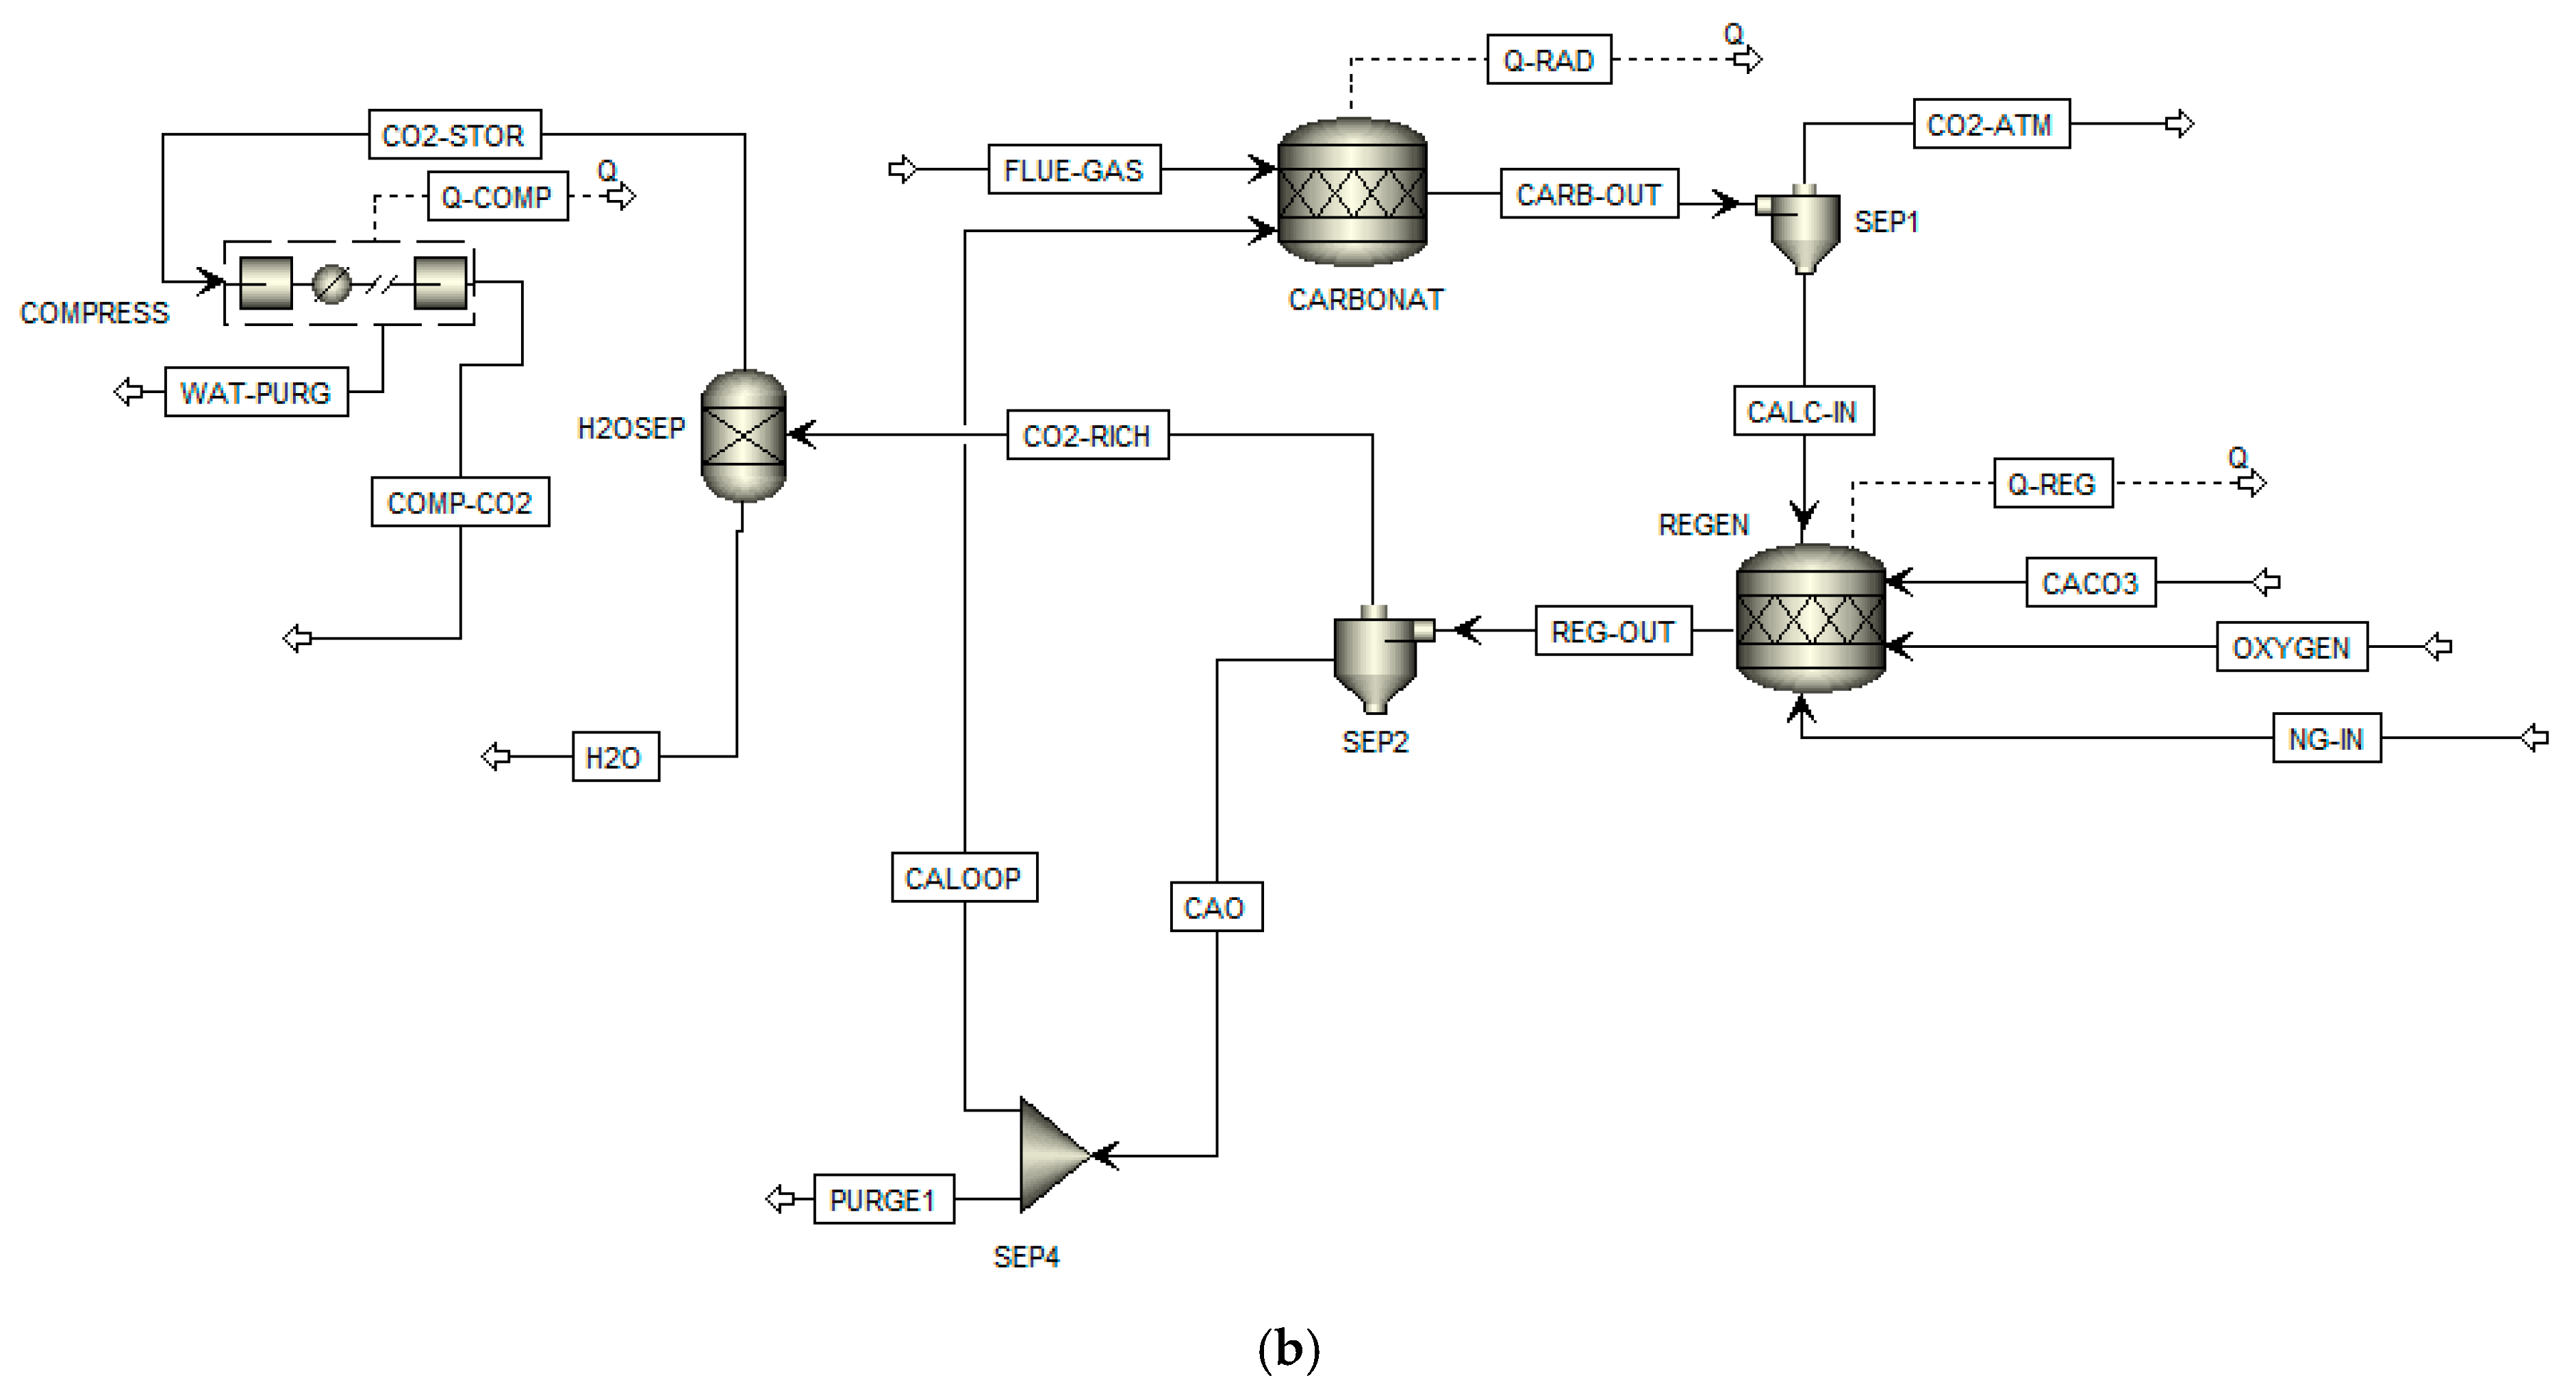
In the CaL process, the CO2 present in the combustion gases emanating from the plant reacts with calcium oxide (CaO) inside a vessel (carbonator) to form CaCO3. This transformation is represented by Equation (1). The fact that it is endothermic predisposes the transformation to occur at temperatures ranging from 500 to 650 °C. The product stream from this stage feeds another reactor (calciner) in which CaO regeneration occurs, again by a thermal effect (Equation (2)). The conditions required for decomposition (800–950 °C) are provided by the burning of fossil fuels in the presence of pure O2. Equation (3) represents the global combustion reaction (on stoichiometric bases) that occurs in a coal-fired power plant. Equation (4) describes the same transformation for a thermoelectric unit operated with natural gas [11,35,36]:
The CO2 is then dried and compressed prior to storage. The CaO, however, returns to the first reactor in order to be reused by the process [37].
2.2. Scenario Definition
Table 1 describes the scenarios selected for the analysis. The adopted system for this process was based on the application of four criteria. The first determined the creation of a reference scenario (S1) representing the current Brazilian grid arrangement. The second criterion established that the CaL process would be coupled only to coal and natural gas-operated thermoelectric plants. This decision was made taking into account the (high) Domestic Electricity Supply expansion potential of these sources [29].
The third criterion established that the environmental, energy and economic effects of CaL coupling would be verified both individually—by generation source (S2 and S3) –, and associated, in which case this CCS technology would be applied simultaneously to gas- and coal-powered plants (S4). The last criterion defined that the other generation sources constituting the Brazilian grid would be represented by technologies consistent with those currently practiced in the country (Section 2.1.1). This measure sought to avoid the influence of external parameters to the field of analysis on the research findings. The domestic electricity supply data per electricity generation source were obtained from the National Energy Balance for 2018, for a total production of 588 TWh [38].
2.3. Calcium Looping Process Simulation: Assumptions and Process Parameters
The CaL behavior was simulated with the aid of the Aspen Plus software v.8.8 by Aspentech®. The process, like others involved in the simulation, operates in steady state. Production patterns and technical parameters adopted for these estimates agree with the average technological profile practiced in Brazil for the corresponding modeled plants. In the case of coal-fired thermoelectric plants, the CaL was coupled to a plant with an electric generation capacity of 500 MW, equipped with a system for the removal of sulfur compounds from the combustion gases (flue gas desulfurization), whose average efficiency reaches ηS = 90%. It was assumed by boundary condition that the combustion gas would be fed to the carbonator only after it had been cooled and desulphurized. Bituminous coal was considered as ‘non-conventional’ flow, due to its composition profile, represented in Table 2 [34].
For the thermoelectric plants that run on natural gas, the defined installed capacity was of 300 MW. The molar average composition of the fuel used in the simulation is given in Table 3 below [39].
The process diagrams, corresponding to the coal-fired and natural gas thermoelectric power plants are presented in Figure 2a,b. The carbonator and calciner behaviors were simulated by RStoic-type reactors, a model available in Aspen Plus® software to represent transformations whose progression profile is stoichiometric or close enough to it. The rate of CO2 conversion into CaCO3 in the carbonator was determined by Equation (5):
where () corresponds to the conversion rate of CO2 to CaCO3 in the carbonator, () refers to the CO2 removal efficiency of the combustion gas fed to the carbonator. () refers to the molar ratio between the CaO that circulates between this device and the calciner () and the CO2 current introduced into the carbonator The conversion rate (ηr) in the calciner, which expresses the degree of CaO regeneration, was set at ηr = 100%.
The oxygen burned for the heat generation inside the calciner is obtained from the Air Separation Unit (ASU). Oxygen flows and the fuel consumed in the calciner (coal or natural gas) have been determined using the Design Spec tool available in the Aspen Plus® software. Pure CO2 is raised to a pressure of 80 bar, after being subjected to three compression stages interspersed by chillers. The gas is cooled to 28 °C during each of these stages [40]. The basic process parameters used for the simulation of the CaL system coupled to the coal-fired and natural gas power plants are presented in Table 4 [33,40,41,42].
2.4. Environmental Assessment
Environmental performance was determined according to the Life Cycle Assessment approach. The LCA is a management approach capable of quantifying the environmental impacts provided by a product (or service) throughout its life cycle; i.e., within a domain that covers raw material extraction and processing operations, the manufacturing chain of the product, its use, recycling and final disposal, as well as the transport and distribution operations to which it is submitted to [43].
The LCA methodology comprises four structural phases: (i) Goal and Scope definition; (ii) Life Cycle Inventory; (iii) Impact Assessment, and (iv) Result Interpretation [44]. This study followed the conceptual guidelines and requirements described in the ISO 14044 standard [45], with the LCA carried out according to the attributional approach and a “cradle-to-gate” application scope. The environmental impacts that originate in each scenario were measured by a Reference Flow (RF) of: ‘to generate 1.0 MWh of electricity’, from the sources and proportions that compose the Brazilian grid for 2018 (Table 1). Figure 3 presents the elements of each model (Product System) created to describe the study situations, in a generic form.
Life Cycle Inventories (LCIs) were drawn up with the support of SimaPro - Pre-Consultants® computer software from secondary data obtained from the Ecoinvent database [46]. This database provides LCIs of average electricity generation technologies whose characteristics are representative the Brazilian electricity generation systems, and in some cases were adapted to Brazilian conditions. For hydroelectric generation, the conversion efficiency considered by the study was of ηHY = 95%, while for thermoelectric plants operating with coal and fuel oil, performances were of ηCoal = 40% and ηFO = 37%, respectively. In the case of thermonuclear and thermoelectric plants using natural gas, efficiencies were set at ηNU = 33% and ηNG = 38% respectively.The consolidated LCI for Brazilian electricity production were elaborated respectively from the following databases: (i) Hydropower: “Electricity, hydropower, at reservoir power plant/BR U”; (ii) Oil: “Electricity, oil, at power plant/CH U”, considering an average net efficiency of ηFO = 36%; (iii) Coal: “Electricity, hard coal, power plant/UCTE U”, with an average net efficiency of ηPCC = 40%; (iv) Natural Gas: “Electricity, natural gas, at power plant/UCTE U” adapted to the Brazilian natural gas supply conditions and the respective logistics of resource distribution, for an average net efficiency of ηNG = 38%; (v) Nuclear: “Electricity, nuclear, at power plant/CH U” admitting only the generation in systems with reactors type PWR; (vi) Solar: “Electricity, photovoltaic production mix, at plant/CH U” and (vii) Wind: “Electricity at wind power plant/RER U”. All these assemblies have been sufficiently modified to depict the local operating conditions of these sources. For Biomass, the LCI “Electricity, bagasse, sugarcane, at fermentation plant/BR U” used in this study was adapted from premises established by Guerra et al. [28].
For the scenarios that consider the CaLcoupled to coal- and natural gas (i.e., S2—S4) thermoelectric plants, the LCIs from the Ecoinvent database were adjusted and supplemented with data on the consumption of raw materials and inputs and emissions, which occur in those processes, obtained from the Aspen Plus® simulations (Section 2.3). Interactions with the CaCO3 processing surroundings were represented by a version adapted to the national conditions of the LCI “Limestone, milled, loose, at plant/CH U”. The electrical consumption of the ASU plant (200 kWh/t O2) and the compressor arrangement on purified CO2 (100 kWh/t CO2) were also assess [41,47].
Concerning the preparation transport LCIs for CaCO3, it was assumed that: (i) displacements occur by road in trucks with cargo capacity between 16–32 t, which represent Brazilian conditions [48]; (ii) the average distance between the extraction mine (located in Northeastern Brazil), and the coal-operated thermoelectric plant (South Brazil) was of 4408 km. For the natural gas thermoelectric plant (installed in the Southeast), displacement was of 3000 km.
The ReCiPe midpoint (H) v 1.12 [49] method was applied to quantify impact potentials in terms of global warming. In general terms, this quantification occurs multiplying the totalized amount of each GHG by its respective impact factor (IF). The Impact factors—coefficients that describe the magnitude of GHG effects in terms of global warming—adopted by ReCiPe midpoint (H) originate from scientific research and development conducted by the Intergovernmental Panel on Climate Change (IPCC). According to this approach, CO2 was defined as the reference substance for category, thus receiving IF = 1.0 kg CO2 eq/kg CO2 emitted. The coefficients for CH4 and N2O are estimated based on this standard, and for ReCiPe v1.12, they correspond respectively to 25 kg CO2 eq/kg CH4 and 298 kg CO2 eq/kg N2O.
The energy impacts of each scenario were estimated in terms of Primary Energy Demand by the Cumulative Energy Demand (CED) v1.10 method. CED describes the impacts related to depletion of the Earth’s primary energy for both non-renewable (fossil, nuclear, biomass) and renewable (biomass, wind, solar, and geothermal and water) energy resources [50]. For this, the method applies a conceptual logic similar to that used by ReCiPe for global warming, of multiplication of impact precursors by their respective IFs. In CED, the intrinsic energy content of a natural resource is used to estimate the primary energy demand associated with it, throughout the life cycle of a good (or service). This intrinsic energy refers, therefore, to the impact factor of the resource. For fossil fuels and biomass, IF is represented by the Higher Heating Value. Regarding nuclear energy this index is based on the uranium chain, considering the characteristics of the average German pressurized water reactor. For hydropower an IF = 1.00 MJ/MJ is assumed, despite the energy precursor of impact (potential, from hydropower or even from hydrogen). On the other hand, if Primary Energy Demand comes from water stored in a barrage pond, IF = 10.0 kJ/kg water. Finally, for other renewable sources (wind, solar, geothermal), CED admits that energy input equals the amount of energy converted [50].
2.5. Economic Analysis
The economic analysis is based on the Levelised Cost of Energy (LCOE) method [51]. Such an approach consists of one of the ways to instrumentalize the variables involved in the economic dimension by making different sources of electricity generation comparable. The LCOE corresponds to the specific real cost (per kilowatt-hour) relative to the construction and operation of the plant, within the time horizon—the year (t)—for which it was designed, including maintenance actions. This indicator can also be defined as the specific average revenue required, measured per unit of produced energy, so that the entrepreneur can recover operation and maintenance investments and expenses that affect the project [51]. The expression that determines the LCOE is represented in Equation (6):
indicates the total construction costs in year (t), the factor refers to operation and maintenance expenditures, () is the fuel cost and (), the carbon cost. () rate depicts decommissioning and waste management costs and () represents the discount factor.
The components used to determine LCOE include capital, fuel, operation and maintenance, and financing costs. In addition, technical aspects of the processes under analysis (i.e., plant efficiency and capacity factor) are also considered by the estimate [51].
For solar and wind technologies that dispense fuel consumption, and present discrete operating and maintenance expenses, the LCOE value is largely conditioned to the estimated cost of capital for generation capacity.
When fuel costs are high, as occurs in oil- and natural gas-operated thermoelectric plants, the LCOE value tends to vary significantly. As with any projection, uncertainties associated with the components of the estimation are noted, which are generally introduced due to geographic aspects, degree of electricity generation technology consolidation and fuel price quotations [52].
For this study, the LCOE values for each scenario (LCOEi) were determined on the basis of data and information contained in International Energy Agency (IEA) and EPE documents for an annual discount rate r = 10%, used for high-risk market investments, which was considered constant throughout the life cycle of the enterprise [52,53]. The input parameters for the LCOE calculation are presented in Table 5.
2.6. Combining Environmental, Energy and Economic Indicators
The research also sought to determine the combined effect of the analyzed dimensions on the electric generation trends from the different energy sources that constitute the Brazilian grid, with and without CCS system coupling. Thus, environmental, energy and economic performance indices were calculated by normalizing the maximum value of the results obtained in previous stages of the study. This procedure is described below by Equations (7)–(9):
where: (): environmental indicator for scenario i; (): impact in terms of Global Warming Potential for scenario i; (): the impact result for S1 in terms of Global Warming Potential; (): energy indicator for scenario i; (): impact in terms of Primary Energy Demand for scenario i; (): the impact result for S1 in terms of Primary energy Demand among all scenarios; (): economic indicator for scenario i; (): the Levelised Cost of Energy for scenario i; (): the value of Levelised Cost of Energy corresponding to S1.
A Combined Indicator () was calculated for each scenario relating the normalized indicators, as described in Equation (10):
3. Results and Discussion
According to the obtained results, in order to achieve a 90% capture efficiency of the CO2 present in the exhaust stream of a coal-fired thermoelectric plant coupled to a CaL-type CCS system, a 48.6 kg/s coal stream to supply energy to the calciner is required. In the case of the natural gas thermoelectric plant, the fuel addition rate is of 23.0 m3/s. In addition, CaCO3 consumption in the coal-fired thermoelectric was of 34.9 kg/s while the expenditure in the natural gas technology was of only 10.0 kg/s.
The thermal energy recovered from the carbonator due to the exothermic reaction and the gas streams leaving the compressor arrangement and calciner totaled 1370 MW for the coal-fired thermoelectric units and 600 MW for the natural gas power plants. The use of this energy allowed for an increase in gross power in both thermoelectric plants to, respectively, 3000 MW and 1400 MW. Of these totals, however, 175 MW and 62 MW should still be discounted, as they correspond to the CaL demands for each plant. The net efficiencies obtained for coal-fired thermoelectric and natural gas power plants were, respectively, of ηCoal = 38% and ηNG = 34%.
These values are considered acceptable due to their low variability when compared to equivalent plant indices without CCS of, respectively, 40% and 38% [46]. These performances demonstrate the technical advantages of implementing the CaL process, despite the thermoelectric plant operates with coal or natural gas. The results with this technology were even higher than those obtained by other CCS systems in similar situations, such as that using monoethanolamine solvents, for ηCoal ≈ ηNG ≈ 28% [22,54].
3.1. Environmental and Energy Analyses
Table 6 depicts the cumulative impact values for Global Warming Potential and Primary Energy Demand, as well as their main precursors for each analysis scenario. These results indicated that there was no scenario that accumulated simultaneously, the best performance of the whole series in both dimensions of analysis.
In terms of global warming, it is noted that CO2 and CH4 are the precursors displaying the major impact, and that emissions from other sources are only slightly changed as a function of the CaL coupling to thermoelectric plants. This is explained by the fact that CH4,b, CO2, LT and N2O are associated with hydroelectric sources and a biomass-driven thermoelectric plant whose operation was not affected by the presence (or not) of the carbon capture system. These tendencies can also be observed in Figure 4 depicts how the impacts for Global Warming Potential are distributed by source of the Brazilian electric grid in both relative and absolute terms.
The fact that S4 achieved the best global warming result of the whole series does not come as a surprise, considering that S2 and S3 had superior performances compared to S1. This is because S4 accumulates the effects, which, for GWP, are positive, of the implementation of the CaL process in coal-fired and natural gas power plants. However, S4 indicates a 17% reduction in the total GWP impact compared to S1. This is due to the 62% decrease in total CO2 emissions from coal and gas burning that are used in these systems. If this stage of the process contributed to about 32% of S1 impacts, the presence of CaL reduces the relative share of combustion in the coal-fired and natural gas power plants to 3.0% of the total GWP impact of S4. Conversely, impacts from CH4 emissions occurring during natural gas extraction and processing increased by 47% in the passage from S1 to S4. This is due to the increased consumption of the same fuel to meet CaL energy needs.
For S2, the incorporation of the CaL process in the coal-fired power plants avoided the emission of 30.0 kg CO2/RF, generating an 11% reduction in GWP impacts in relation to the baseline scenario. Most CO2 emissions result from natural gas burning at natural gas power plants, a stage contributing with 22% of the total impact of S2. On the other hand, CH4 losses remained unchanged in the S1 → S2 passage.
In S3, the implementation of the CaL to mitigate CO2 emissions from natural gas combustion reduced GWP impacts by 7.1%. In this context, gas extraction and processing had a significant influence on the cumulative impact, contributing with 33%. Coal burning at power plants accounted for 13% of the cumulative impact on the scenario. Finally, as discussed previously, the increase in CH4 losses significantly dampened the advantage obtained by the decreased CO2 losses accumulated by S3 in comparison to S1.
In addition to the adverse effects mentioned above, the advantages of the simultaneous installation of CaL processes for carbon capture in coal-fired power plants and natural gas power plants were also neutralized by inherent aspects of the technology itself. This is the case of CaCO3 transport being fed into the regenerator for the purpose of make-up. This operation contributed, in isolation, to 2.57 kg CO2eq/MWh for S2 and 3.03 kg CO2eq/MWh for S3, reaching a 12% of the total contributed by CO2 in S4, when the effect of the use of CaL was verified in both fronts. The impossibility of shared transport with other assets, the prevalence of the road mode for the distribution of heavy loads in Brazil, and, especially, the long distances between the CaCO3 extraction mines and the plants (from 660 to 1100 km) justify these performances.
The results obtained for Primary Energy Demand suggest a slight advantage of S1 over S2. In the baseline scenario, hydroelectricity production accounts for 54% of the total impact, followed by primary energy consumption in the form of natural gas, at 28% contribution. S2 closely follows these same trends, and the differences in contribution between the natural gas, coal and kinetic energy scenarios are tenuous. On the other hand, a 14% increase in crude oil consumption in the s1 → s2 passage as a consequence of the additional diesel consumption of to transport CaCO3 was noted, generating a 1.3% increase in the total impact to S2 compared to S1.
S3 and S4 showed quite divergent profiles in relation to S1. These findings reflect negatively on the use of CaL for the natural gas power plants. A 16% increase in S3 impacts due to additional crude oil (18%) for diesel production used in CaCO3 transport, and natural gas (51%) demands, was observed. For S4, the increase in total impact was of 17%, resulting in the worst energy performance among the evaluated options. This was, once again, due to increases in crude oil and natural gas consumption, which, in this situation, were of 32% and 52%.
3.2. Economic Analysis
Table 7 presents the Levelised Cost of Energy (LCOE) values discretized per constituent source of the BR grid and for the circumstances described in S1. The results indicate fuel oil burning as the main source of unit costs of electric generation in Brazil. The counterpart of this effect by hydroelectricity—a major participation source in the grid – allows to explain Brazil’s position in the group of countries with the lowest aggregate electricity costs among industrialized countries [52].
The LCOE value for the cases in which the CaL process is coupled to the coal-fired and natural gas power plants was based on estimates made by Mantripragada et al. [54]. The authors determined that the implantation of such a system in coal-fired power plants causes increases the LCOE in 137% in relation to a plant that does not present the same conditions. This percentage increase was applied to the LCOE values presented in Table 6 for the coal-fired and natural power plants. Table 8 presents an overview of electricity generation and costs (individualized by source) for each scenario.
It is noted that the use of a CaL-type carbon capture system in natural gas thermoelectric plants (S3) results in higher costs than if the same system were to be coupled to a coal-fired power plant (S2). This is mainly due to the price of natural gas (74.60 USD/MWh), which is about two-fold of that associated with coal [52]. The magnitude of the coal price in the international market also justifies the smoothing of the cost increase of S2 (6.6%) in relation to S1. For the reasons given above, the cost variations of S1 → S3 and S1 → S4 were of 19% and 25%, respectively.
3.3. Combined Analysis: Environmental, Energy and Economic
The fact that no prevalent scenario for all dimensions was observed emphasizes the importance of a combined analysis. Table 9 presents the results of this action. According to this metric, S2 stands out from the others when achieving the best combined indicator (). This finding indicates that the use of Calcium Looping (CaL) process in coal-operated thermoelectric plants only shows a feasible possibility by associating all the analysis dimensions.
Even with performance above S4 in environmental terms (7.8%), and of energy and economic order of S1 (1.3% and 6.5%), S2 dominates over its competitors due to the homogeneity of their indices. Conversely, S3 presented the worst combined performance, without even accumulating a lower individual result. Therefore, the application of CaL for CO2 removal from the natural gas-fired thermoelectric plant emissions is inadvisable.
The overall result achieved by S4 should also be evidenced. In this case, the setbacks to the energy and economic dimensions, when and occupy the last positions in their respective series, were counteracted by performance. Thus, the simultaneous installation of CaL in coal-fired and natural gas operated power plants is a costly and energy-intensive alternative. Conversely, the effectiveness with which this technology fulfills its purposes of capturing and storing carbon emissions—in particular CO2—is sufficiently elucidated to return it to the set of possibilities to be considered in a process decision-making process within the scope of Brazilian energy planning.
4. Conclusions
This study evaluated the effect of the implementation of Carbon Capture and Storage systems on the environmental, energy and economic performance of the Brazilian electrical matrix. Four scenarios were established considering the coupling of CaL processes to capture CO2 emitted from thermoelectric plants using coal and natural gas. S1 describes the current condition of the Brazilian grid and is, therefore, defined as the baseline scenario. S2 and S3 refer to the BR grid with CaL applied individually to coal- and gas- operated thermoelectric plants, while in S4 the CCS technology is simultaneously applied to coal-fired and natural gas power plants. The environmental variable was expressed by the global warming potential of the systems, while Primary Energy Demand was the energy indicator and Levelised Cost of Energy (LCOE) served as a parameter of economic analysis.
Global warming and Primary Energy Demand were determined by attributional Life Cycle Assessment, which were applied according to a scope ‘from cradle-to-gate’ for the generation of 1.0 MWh of electricity.
The results obtained indicated that none of the assessed scenarios accumulated the best indexes in these dimensions. CO2 and CH4 are the major global warming impact precursors. S4 totals the positive effects of the implantation of the CaL process in coal- and gas- power plants. This is due to a decrease (62%) in total CO2 emissions from coal and gas combustion. On the other hand, contributions to global warming derived from CH4 emissions have increased significantly due to the energy requirements for CaL operation. This effect greatly compromised S4 performance, besides making the use of S3 unviable. CO2 emissions from the CaCO3 transport used in the CaL process also aided in neutralizing the gains that this technology provided.
As for Primary Energy Demand, S1 and S2 performed similarly and better than S3 and S4. The setbacks associated to S3 and S4 are due to crude oil consumption for diesel generation, for CaCO3 transports, and raw natural gas, for CaL operation. This finding also undermines the application of that CCS alternative in natural gas thermoelectric plants.
The fact that the price of natural gas is twice as high as that of coal indicates that the use of CaL in natural gas power plants will result in higher costs than if the same system were coupled to coal-fired power plants.
The achievement of a combined verification of the three analysis dimensions, performed from normalized indicators, proved that S2 was the best option of the entire assessed series, due to the homogeneity of its indices. This indicates that the use of CaL in coal-fired power plants only appears as a viable alternative. The results obtained for S4 was unexpected. At the same time that their indices occupied the last positions in the energetic and economical dimensions, the simultaneous installation of CaL in coal-fired and gas thermoelectric plants was effective enough to capture and store CO2 emissions, to the point of replacing this option in the set of possibilities considered in processes of decisions that occur within the scope of Brazilian energy planning.
This study met the original expectations of what was proposed, i.e., to help equate the existing dichotomy between the need for domestic electricity supply expansion and the reduction of global warming impacts that originate from electricity generation in Brazil, without, however, raising their associated costs, or imposing efficiency losses to the system.
Author Contributions
Conceptualization, C.C.S.M. and L.K.; Methodology, C.C.S.M.; Software, C.C.S.M.; Validation, C.C.S.M. and L.K.; Formal Analysis, C.C.S.M.; Investigation, C.C.S.M.; Data Curation, C.C.S.M.; Writing-Original Draft Preparation, C.C.S.M.; Writing-Review & Editing, L.K.; Supervision, L.K.; Project Administration, L.K.
Funding
This study was financed in part by the Coordenação de Aperfeiçoamento de Pessoal de Nível Superior-Brasil (CAPES) Finance Code 001.
Conflicts of Interest
The authors declare no conflict of interest.
References
- International Panel on Climate Change (IPCC). Climate Change 2014: Mitigation of Climate Change. Contribution of Working Group III to the Fifth Assessment Report of the Intergovernmental Panel on Climate Change; Cambridge University Press: Cambridge, UK, 2014; 1435p, ISBN 978-1-107-05821-7. [Google Scholar]
- Theo, W.L.; Lim, J.S.; Hashim, H.; Mustaffa, A.A.; Ho, W.S. Review of pre-combustion capture and ionic liquid in carbon capture and storage. Appl. Energy 2016, 183, 1633–1663. [Google Scholar] [CrossRef]
- Kileber, S.; Parente, V. Diversifying the Brazilian electricity mix: Income level, the endowment effect, and governance capacity. Renew. Sustain. Energy Rev. 2015, 49, 1180–1189. [Google Scholar] [CrossRef]
- Alam, M.M.; Murad, M.W.; Noman, A.H.M.; Ozturk, I. Relationships among carbon emissions, economic growth, energy consumption and population growth: Testing Environmental Kuznets Curve hypothesis for Brazil, China, India and Indonesia. Ecol. Indic. 2016, 70, 466–479. [Google Scholar] [CrossRef]
- Turconi, R.; Boldrin, A.; Astrup, T. Life cycle assessment (LCA) of electricity generation technologies: Overview, comparability and limitations. Renew. Sustain. Energy Rev. 2013, 28, 555–565. [Google Scholar] [CrossRef] [Green Version]
- Geller, M.T.B.; Meneses, A.A.D.M. Life Cycle Assessment of a Small Hydropower Plant in the Brazilian Amazon. J. Sustain. Dev. Energy 2016, 4, 379–391. [Google Scholar] [CrossRef] [Green Version]
- Ministry of Mines and Energy (MME). Available online: http://www.mme.gov.br (accessed on 25 June 2018).
- Koornneef, J.; Ramirez, A.; Van Harmelen, T.; Van Horssen, A.; Turkenburg, W.; Faaij, A. The impact of CO2 capture in the power and heat sector on the emission of SO2, NOx, particulate matter, volatile organic compounds and NH 3 in the European Union. Atmos. Environ. 2010, 44, 1369–1385. [Google Scholar] [CrossRef]
- Cuéllar-Franca, R.M.; Azapagic, A. Carbon Capture, storage and utilization technologies: A critical analysis and comparison of their life cycle environmental impacts. J. CO2 Util. 2015, 9, 82–102. [Google Scholar] [CrossRef]
- Anwar, M.N.; Fayyaz, A.; Sohail, N.F.; Khokhar, M.F.; Baqar, M.; Khan, W.D.; Rasool, K.; Rehan, M.; Nizami, A.S. CO2 capture and storage: A way forward for sustainable environment. J. Environ. Manag. 2018, 226, 131–144. [Google Scholar] [CrossRef] [PubMed]
- Cormos, C.C.; Petrescu, L. Evaluation of calcium looping as carbon capture option for combustion and gasification power plants. Energy Procedia 2013, 51, 154–160. [Google Scholar] [CrossRef]
- Cormos, C.-C. Assessment of chemical absorption/adsorption for post-combustion CO2 capture from Natural Gas Combined Cycle (NGCC) power plants. Appl. Therm. Eng. 2015, 82, 120–128. [Google Scholar] [CrossRef]
- Blamey, J.; Anthony, E.J.; Wang, J.; Fennell, P.S. The calcium looping cycle for large-scale CO2 capture. Prog. Energy Combust. Sci. 2010, 36, 260–279. [Google Scholar] [CrossRef]
- Adanez, J.; Abad, A.; Garcia-Labiano, F.; Gayan, P.; De Diego, L.F. Progress in chemical-looping combustion and reforming technologies. Prog. Energy Combust. Sci. 2012, 38, 215–282. [Google Scholar] [CrossRef]
- Biliyok, C.; Yeung, H. Evaluation of natural gas combined cycle power plant for post-combustion CO2 capture integration. Int. J. Greenh. Gas Control 2013, 19, 396–405. [Google Scholar] [CrossRef]
- Dieter, H.; Bidwe, A.R.; Varela-Duelli, G.; Charitos, A.; Hawthorne, C.; Scheffknecht, G. Development of the calcium looping CO2 capture technology from lab to pilot scale at IFK, University of Stuttgart. Fuel 2014, 127, 23–37. [Google Scholar] [CrossRef]
- Sreedhar, I.; Vaidhiswaran, R.; Kamani, B.M.; Venugopal, A. Process and engineering trends in membrane based carbon capture. Renew. Sustain. Energy Rev. 2017, 68, 659–684. [Google Scholar] [CrossRef]
- Miccio, F.; Bendoni, R.; Piancastelli, A.; Medri, V.; Landi, E. Geopolymer composites for chemical looping combustion. Fuel 2018, 225, 436–442. [Google Scholar] [CrossRef]
- Rochedo, P.R.R.; Costa, I.V.L.; Império, M.; Hoffmann, B.S.; Merschmann, P.R.D.C.; Oliveira, C.C.N.; Szklo, A.; Schaeffer, R. Carbon capture potential and costs in Brazil. J. Clean. Prod. 2016, 131, 280–295. [Google Scholar] [CrossRef]
- Singh, B.; Strømman, A.H.; Hertwich, E. Life cycle assessment of natural gas combined cycle power plant with post-combustion carbon capture, transport and storage. Int. J. Greenh. Gas Control 2011, 5, 457–466. [Google Scholar] [CrossRef]
- Korre, A.; Nie, Z.; Durucan, S. Life cycle modelling of fossil fuel power generation with post-combustion CO2 capture. Int. J. Greenh. Gas Control 2010, 4, 289–300. [Google Scholar] [CrossRef]
- Castelo Branco, D.A.; Moura, M.C.P.; Szklo, A.; Schaeffer, R. Emissions reduction potential from CO2 capture: A life-cycle assessment of a Brazilian coal-fired power plant. Energy Policy 2013, 61, 1221–1235. [Google Scholar] [CrossRef]
- National Electric Energy Agency (ANEEL). Generation Information Database (BIG). 2018. Available online: http://www2.aneel.gov.br/aplicacoes/capacidadebrasil/capacidadebrasil.cfm (accessed on 18 October 2018).
- Barros, M.V.; Piekarski, C.M.; De Francisco, A.C. Carbon footprint of electricity generation in Brazil: An analysis of the 2016–2026 period. Energies 2018, 11, 1412. [Google Scholar] [CrossRef]
- National Operator of the Electrical System (ONS). 2018. Available online: http://www.ons.org.br (accessed on 29 June 2018).
- Energy Research Company (EPE). Thermoelectric Power: Natural Gas, Biomass, Coal, Nuclear; EPE: Rio de Janeiro, Brazil, 2016; 417p, ISBN 978-85-60025-05-3. [Google Scholar]
- Union of Sugarcane Industry (UNICA). 2017. Available online: http://www.unica.com.br (accessed on 12 November 2017).
- Guerra, J.P.; Cardoso, F.H.; Nogueira, A.; Kulay, L. Thermodynamic and environmental Analysis of Scaling up Cogeneration Units Driven by Sugarcane Biomass to Enhance Power Exports. Energies 2018, 11, 73. [Google Scholar] [CrossRef]
- Energy Research Company (EPE). Renewable Energy: Hydraulics, Biomass, Wind, Solar, Ocean; EPE: Rio de Janeiro, Brazil, 2016; 452p, ISBN 978-85-60025-06-0. [Google Scholar]
- Ministry of Mines and Energy (MME). Monthly Bulletin of Electrical Energy. 2018. Available online: http://www.mme.gov.br/web/guest/publicacoes-e-indicadores/boletins-de-energia (accessed on 10 October 2018).
- Corsten, M.; Ramírez, A.; Shen, L.; Koornneef, J.; Faaij, A. Environmental impact assessment of CCS chains—Lessons learned and limitations from LCA literature. Int. J. Greenh. Gas Control 2013, 13, 59–71. [Google Scholar] [CrossRef]
- Zhang, Z.; Huisingh, D. Carbon dioxide storage schemes: Technology, assessment and deployment. J. Clean. Prod. 2017, 142, 1055–1064. [Google Scholar] [CrossRef]
- Fransson, E.; Detert, M. Process Integration of CO2 Capture by Means of Calcium Looping Technology. Master’s Thesis, Chalmers University of Technology, Gothenburg, Sweden, 2014. [Google Scholar]
- Ruiz, M. Assessment of Calcium Looping as a Solution for CO2 Capture in the Steel Production Process. Master’s Thesis, University of Stuttgart, Stuttgart, Germany, 2015. [Google Scholar]
- Jayarathna, C.K.; Mathisen, A.; Øi, L.E.; Tokheim, L.A. Process Simulation of Calcium Looping with Indirect Calciner Heat Transfer. In Proceedings of the 56th SIMS, Linköping, Sweden, 7–9 October 2015. [Google Scholar]
- Shimizu, T.; Hirama, T.; Hosoda, H.; Kitano, K.; Inagaki, M.; Tejima, K. A twin fluid-bed reactor for removal of CO2 from combustion processes. Chem. Eng. Res. Des. 1999, 77, 62–68. [Google Scholar] [CrossRef]
- Valverde, J.M.; Sanchez-Jimenez, P.E.; Perez-Maqueda, L.A. Calcium-looping for post-combustion CO2 capture. On the adverse effect of sorbent regeneration under CO2. Appl. Energy 2014, 126, 161–171. [Google Scholar] [CrossRef]
- Energy Research Company (EPE). Brazilian Energy Balance 2018: Year 2017; EPE: Rio de Janeiro, Brazil, 2018; 292p. [Google Scholar]
- Vaz, C.E.M.; Maia, J.L.P.; Santos, W.G. Tecnologia da Indústria do Gás Natural, 1st ed.; Petrobras: Rio de Janeiro, Brazil, 2008; 440p, ISBN 9788521204213. [Google Scholar]
- Vorrias, I.; Atsonios, K.; Nikolopoulos, A.; Nikolopoulos, N.; Grammelis, P.; Kakaras, E. Calcium looping for CO2 capture from a lignite fired power plant. Fuel 2013, 113, 826–836. [Google Scholar] [CrossRef]
- Martinez, I.; Murillo, R.; Grasa, G.; Abanades, J.C. Integration of a Ca-looping system for CO2 capture in an existing power plant. Energy Procedia 2011, 4, 1699–1706. [Google Scholar] [CrossRef]
- Hu, Y.; Ahn, H. Process integration of a Calcium-looping process with a natural gas combined cycle power plant for CO2 capture and its improvement by exhaust gas recirculation. Appl. Energy 2017, 187, 480–488. [Google Scholar] [CrossRef]
- Zbicinski, I.; Stavenuiter, J.; Kozlowska, B.; van de Coevering, H. Product Design and Life Cycle Assessment; The Baltic University Press: Nina Tryckeri, Uppsala, 2006; pp. 88–89. [Google Scholar]
- International Organization for Standardization (ISO). Environmental Management-Life Cycle Assessment-Principles and Framework, 2nd ed.; ISO 14040:2006; ISO: Geneva, Switzerland, 2006. [Google Scholar]
- International Organization for Standardization (ISO). Environmental Management-Life Cycle Assessment-Requirements and Guidelines, 1st ed.; ISO 14044:2006; ISO: Geneva, Switzerland, 2006. [Google Scholar]
- Dones, R.; Bauer, C.; Röder, A. Coal Energy Chain in USA. Final Report Ecoinvent N. 6-VI; Swiss Centre for Life Cycle Inventories: Dübendorf, Switzerland, 2007. [Google Scholar]
- Vasudevan, S.; Farooq, S.; Karimi, I.A.; Saeys, M.; Quah, M.C.G.; Agrawal, R. Energy penalty estimates for CO2 capture: Comparison between fuel types and capture-combustion modes. Energy 2016, 103, 709–714. [Google Scholar] [CrossRef]
- National Confederation of Transport (CNT). Available online: http://www.cnt.org.br/Paginas/atlas-do-transporte (accessed on 20 August 2018).
- Goedkoop, M.; Heijungs, R.; Huijbregts, M.; De Schryver, A.; Struijs, J.; van Zelm, R. Description of the ReCiPe Methodology for Life Assessment Impact Assessment. 2013. Available online: http://www.lciarecipe.net (accessed on 17 May 2018).
- Frischknecht, R.; Jungbluth, N.; Althaus, H.-J.; Bauer, C.; Doka, G.; Dones, R.; Hischier, R.; Hellweg, S.; Humbert, S.; Köllner, T.; et al. Implementation of Life Cycle Impact Assessment Methods: Data v2.0. Ecoinvent report No. 3; Swiss Centre for Life Cycle Inventories: Dübendorf, Switzerland, 2007. [Google Scholar]
- Romeiro, D.L.; Almeida, E.; Losekann, L. The choice of dispatchable versus intermittent electricity generating technologies and the Brazilian case. In Proceedings of the 5th Latin American Energy Economics Meeting, Medellín, Colombia, 15–18 March 2015. [Google Scholar]
- International Energy Agency (IEA). Projected Costs of Generating Electricity; OECD Publishing: Paris, Italy, 2015; 213p. [Google Scholar]
- Energy Research Company (EPE). Ten Year Energy Expansion Plan 2026; MME/EPE: Brasília, Brazil, 2017; 271p. [Google Scholar]
- Mantripragada, H.C.; Rubin, E.S. Calcium Looping Cycle for CO2 Capture: Performance, Cost and Feasibility Analysis. Energy Procedia 2014, 63, 2199–2206. [Google Scholar] [CrossRef]
Figure 1.
Brazilian installed capacity of electricity generation in 2017: relative distribution by source.
Figure 1.
Brazilian installed capacity of electricity generation in 2017: relative distribution by source.

Figure 2.
Calcium Looping system (a) coupled to a coal-fired thermoelectric plant, and; (b) coupled to a natural gas -fired thermoelectric power unit.
Figure 2.
Calcium Looping system (a) coupled to a coal-fired thermoelectric plant, and; (b) coupled to a natural gas -fired thermoelectric power unit.


Figure 3.
Product System for the production of 1.0 MWh of electricity: (a) BR grid in its original structure, and; (b) coupled to CCS.
Figure 3.
Product System for the production of 1.0 MWh of electricity: (a) BR grid in its original structure, and; (b) coupled to CCS.

Figure 4.
Contributions for Global Warming Potential by source of the Brazilian grid: relative (%) and absolute (kg CO2eq/MWh) values.
Figure 4.
Contributions for Global Warming Potential by source of the Brazilian grid: relative (%) and absolute (kg CO2eq/MWh) values.


Table 1.
Specification of the analysis scenarios by type of electricity generation source
| Source | Domestic Electricity Supply by Source (%) | Scenario | |||
|---|---|---|---|---|---|
| S1 (Baseline) | S2 | S3 | S4 | ||
| Hydropower | 65.2 | C | C | C | C |
| Oil | 2.51 | C | C | C | C |
| Coal | 4.09 | C | CaL | C | CaL |
| Natural Gas | 10.5 | C | C | CaL | CaL |
| Biomass | 8.23 | C | C | C | C |
| Nuclear | 2.52 | C | C | C | C |
| Wind | 6.82 | C | C | C | C |
| Solar | 0.13 | C | C | C | C |
Legend: (C): Technology currently practiced for the respective generation source; (CaL): indicates coupling with the CaL process.
Table 2.
Analyses of the bituminous coal used in the simulation.
| Ultanal (%w/w) | |
| C | 72.3 |
| H | 4.11 |
| O | 5.93 |
| S | 0.58 |
| N | 1.70 |
| Cl | 0.00 |
| Ash | 15.4 |
| LHV (MJ/kg) | 22.2 |
| Proxanal (%w/w) | |
| moisture | 8.00 |
| volatiles | 24.9 |
| fixed carbon | 59.7 |
| ash | 15.4 |
| Sulfanal (%w/w) | |
| sulfate | 0.26 |
| pyritic | 0.26 |
| organic | 0.06 |
Legend: Ultanal: Ultimate analysis; Proxanal: Proximate analysis; Sulfanal: Sulfur sources analysis; LHV: Low Heat Value.
Table 3.
Average composition of natural gas.
| Component | CH4 | C2H6 | C3H8 | C4H10 | CO2 | N2 | Others |
| Molar fraction (%) | 86.1 | 8.15 | 2.14 | 0.52 | 0.72 | 1.34 | 1.03 |
Table 4.
Process parameters that specify the Calcium Looping system for each type of thermoelectric plant.
Table 4.
Process parameters that specify the Calcium Looping system for each type of thermoelectric plant.
| Parameter | Coal-Fired Thermoelectric Plant | Natural Gas Thermoelectric Plant |
|---|---|---|
| Fuel used in the calciner | Coal | Natural Gas |
| Carbonator Temperature (°C) | 650 | 600 |
| Carbonator Pressure (bar) | 1.00 | 1.00 |
| Calciner Temperature (°C) | 900 | 900 |
| Calciner Pressure (bar) | 1.00 | 1.00 |
| 90.0 | 90.0 | |
| () | 7.00 | 14.0 |
| () | 0.10 | 0.10 |
| CaO Purge | 0.10 | 0.10 |
| Fresh CaCO3 temperature (°C) | 25.0 | 25.0 |
| O2 purity degree (%v/v) | 95.0 | 95.0 |
| O2 stream temperature (°C) | 15.0 | 15.0 |
| Fuel temperature (°C) | 25.0 | 25.0 |
Table 5.
Parameters for the LCOE calculation for each energy source for a discount rate of r = 10% (USD/MWh).
Table 5.
Parameters for the LCOE calculation for each energy source for a discount rate of r = 10% (USD/MWh).
| Source | Capital Cost | O&M Cost | Fuel Cost | Carbon Cost | Decommissioning Costs |
|---|---|---|---|---|---|
| Hydropower | 50.9 | 9.00 | 0.00 | 0.00 | 0.04 |
| Oil | 40.5 | 7.56 | 149 | 23.3 | 0.03 |
| Coal | 40.5 | 7.56 | 30.8 | 23.3 | 0.03 |
| Natural Gas | 15.9 | 5.72 | 74.6 | 10.3 | 0.03 |
| Biomass | 86.6 | 17.6 | 93.2 | 0.00 | 0.08 |
| Nuclear | 74.4 | 13.1 | 10.0 | 0.00 | 0.12 |
| Wind | 94.0 | 23.0 | 0.00 | 0.00 | 0.62 |
| Solar | 140 | 27.9 | 0.00 | 0.00 | 0.00 |
For Solar energy, O&M costs include decommissioning costs. For oil-fired thermoelectric plants, it was decided that Capital, O&M, Carbon and Decommissioning costs would be the same as those of the gas-fired thermoelectric plant, assuming an oil cost twice that of natural gas.
Table 6.
Environmental and Energy Performance and main specific contribution for the of 1.0 MWh of electricity using the Brazilian grid.
Table 6.
Environmental and Energy Performance and main specific contribution for the of 1.0 MWh of electricity using the Brazilian grid.
| Impact Category | Precursor | Scenario | |||
|---|---|---|---|---|---|
| S1 | S2 | S3 | S4 | ||
| Global Warming Potential (kg CO2eq) | CO2 | 123 | 92.7 | 76.8 | 46.7 |
| CO2, LT | 73.2 | 73.2 | 73.2 | 73.3 | |
| CH4 | 55.1 | 55.2 | 81.0 | 81.1 | |
| CH4,b | 28.7 | 28.7 | 28.8 | 28.8 | |
| N2O | 3.16 | 3.02 | 3.13 | 3.01 | |
| Total | 283 | 253 | 263 | 233 | |
| Primary Energy Demand (MJ) | Crude Oil | 344 | 392 | 406 | 454 |
| Natural Gas | 1280 | 1290 | 1930 | 1940 | |
| Coal | 464 | 465 | 467 | 469 | |
| Kinetic energy (water) | 2484 | 2485 | 2488 | 2489 | |
| Total | 4572 | 4632 | 5291 | 5352 | |
Legend: CO2, LT: Carbon dioxide from land transformation; CH4,b: Methane, biogenic.
Table 7.
LCOE per source for a discount rate of 10% (USD/MWh).
| Energy Source | Hydro | Oil | Coal | Natural | Biomass | Nuclear | Wind | Solar |
| LCOE (USD/MWh) | 59.9 | 221 | 95.7 | 107 | 154 | 98.0 | 112 | 168 |
Table 8.
Electricity generation and economic performance by source and scenario.
| Energy Source | Generation MWh/y | LCOE by Source (USD/MWh) | Electric Generation Cost (Billion USD/y) | |||
|---|---|---|---|---|---|---|
| S1 | S2 | S3 | S4 | |||
| Hydro | 383 × 106 | 59.90 | 22.9 | 22.9 | 22.9 | 22.9 |
| Oil | 14.7 × 10⁶ | 221 | 3.25 | 3.25 | 3.25 | 3.25 |
| Coal | 24.1 × 10⁶ | 95.7 | 2.31 | -- | 2.31 | -- |
| Coal + CaL | 24.1 × 10⁶ | 227 | -- | 5.46 | -- | 5.46 |
| Natural Gas | 61.7 × 10⁶ | 107 | 6.60 | 6.60 | -- | -- |
| Natural Gas + CaL | 61.7 × 10⁶ | 254 | -- | -- | 15.7 | 15.7 |
| Biomass | 48.2 × 10⁶ | 154 | 7.42 | 7.42 | 7.42 | 7.42 |
| Nuclear | 14.7 × 10⁶ | 98.0 | 1.44 | 1.44 | 1.44 | 1.44 |
| Wind | 40.0 × 10⁶ | 112 | 4.48 | 4.48 | 4.48 | 4.48 |
| Solar | 7.64 × 10⁶ | 168 | 0.13 | 0.13 | 0.13 | 0.13 |
| Total | 588 × 106 | – | 48.5 | 51.7 | 57.6 | 60.8 |
Table 9.
Normalized Indicators and combined results for scenarios S1–S4.
| Indicator | Scenario | |||
|---|---|---|---|---|
| S1 | S2 | S3 | S4 | |
| 1.000 | 0.894 | 0.929 | 0.823 | |
| 1.000 | 1.011 | 1.139 | 1.151 | |
| 1.000 | 1.066 | 1.188 | 1.254 | |
| 1.000 | 0.963 | 1.257 | 1.188 | |
© 2019 by the authors. Licensee MDPI, Basel, Switzerland. This article is an open access article distributed under the terms and conditions of the Creative Commons Attribution (CC BY) license (http://creativecommons.org/licenses/by/4.0/).
Share and Cite
MDPI and ACS Style
Sanchez Moore, C.C.; Kulay, L. Effect of the Implementation of Carbon Capture Systems on the Environmental, Energy and Economic Performance of the Brazilian Electricity Matrix. Energies 2019, 12, 331. https://doi.org/10.3390/en12020331
AMA Style
Sanchez Moore CC, Kulay L. Effect of the Implementation of Carbon Capture Systems on the Environmental, Energy and Economic Performance of the Brazilian Electricity Matrix. Energies. 2019; 12(2):331. https://doi.org/10.3390/en12020331
Chicago/Turabian StyleSanchez Moore, Claudia Cristina, and Luiz Kulay. 2019. "Effect of the Implementation of Carbon Capture Systems on the Environmental, Energy and Economic Performance of the Brazilian Electricity Matrix" Energies 12, no. 2: 331. https://doi.org/10.3390/en12020331
Note that from the first issue of 2016, this journal uses article numbers instead of page numbers. See further details here.