Article

Comparison of Technologies for CO2 Capture from Cement Production—Part 2: Cost Analysis

1
SINTEF Energy Research, Department of Gas Technology, NO-7465 Trondheim, Norway
2
Politecnico di Milano, Department of Energy, 20156 Milan, Italy
3
Institute of Process Engineering, Department of Mechanical and Process Engineering, ETH Zurich, 8092 Zurich, Switzerland
4
Copernicus Institute of Sustainable Development, Energy and Resources, Utrecht University, 3584 CB Utrecht, The Netherlands
5
Italcementi Heidelberg Group, 24126 Bergamo, Italy
*
Author to whom correspondence should be addressed.
Energies 2019, 12(3), 542; https://doi.org/10.3390/en12030542
Submission received: 5 December 2018 / Revised: 11 January 2019 / Accepted: 30 January 2019 / Published: 10 February 2019
(This article belongs to the Special Issue Carbon Capture and Storage)

Abstract

:
This paper presents an assessment of the cost performance of CO2 capture technologies when retrofitted to a cement plant: MEA-based absorption, oxyfuel, chilled ammonia-based absorption (Chilled Ammonia Process), membrane-assisted CO2 liquefaction, and calcium looping. While the technical basis for this study is presented in Part 1 of this paper series, this work presents a comprehensive techno-economic analysis of these CO2 capture technologies based on a capital and operating costs evaluation for retrofit in a cement plant. The cost of the cement plant product, clinker, is shown to increase with 49 to 92% compared to the cost of clinker without capture. The cost of CO2 avoided is between 42 €/tCO2 (for the oxyfuel-based capture process) and 84 €/tCO2 (for the membrane-based assisted liquefaction capture process), while the reference MEA-based absorption capture technology has a cost of 80 €/tCO2. Notably, the cost figures depend strongly on factors such as steam source, electricity mix, electricity price, fuel price and plant-specific characteristics. Hence, this confirms the conclusion of the technical evaluation in Part 1 that for final selection of CO2 capture technology at a specific plant, a plant-specific techno-economic evaluation should be performed, also considering more practical considerations.

1. Introduction

Production of cement is estimated to account for about 7% of anthropogenic CO2 emissions, thus contributing significantly to climate change [1]. Approximately 2/3rd of the CO2 emissions are process related, originating from the conversion of limestone, CaCO3 to CaO and CO2, while the remaining 1/3rd comes from the combustion of fuels in the rotary kiln of the cement plant. A recent technology roadmap published by the International Energy Agency and the Cement Sustainability Initiative, a global consortium of 24 major cement producers, identified several main carbon mitigation options for the cement industry [1]. These include e.g., reduction of clinker to cement ratio, fuel switching and implementation of CO2 capture and storage (CCS). Implementation of CCS was found to have the largest CO2 emission reduction potential of the mitigation options due to its ability to drastically reduce both process and fuel related emissions from cement kilns. Combining CCS with CO2 utilization (CCUS) is also being discussed as an alternative emission mitigation option and a business case although recent studies suggest that less than 10% of the captured CO2 in a cement plant could be economically converted to added-value products [2].
Although cement plants are moderately large emission sources compared to large-scale fossil-fueled power plants, they possess several characteristics favorable for CO2 capture, such a relatively high CO2 concentration in their flue gases, few emission points, stable operation and, in some specific cases, available waste heat. The cement industry has been showing increased interest in CO2 capture technologies in recent years, especially in Europe where the European Cement Research Academy (ECRA) has actively carried out CCS research since 2007 [3]. CCS applied to cement production has gained further interest after testing at the Norcem Brevik plant in Norway, which has been selected as one of the two potential sites for CO2 capture in the in the Norwegian full-scale CCS project. On-site pilot testing included three CO2 capture technologies: amine absorption, amine-impregnated adsorption and fixed-site carrier membranes [4,5,6,7]. Presently, a front-end engineering design (FEED)-study for the Norcem Brevik plant is being carried out to prepare for a final investment decision by the Norwegian Parliament in 2020/2021 [8].
The increasing interest in CCS from the cement industry has resulted in the publication of several studies investigating techno-economic performance of different CO2 capture technologies integrated in cement plants. Most of the studies have focused on retrofitting amine-based CO2 capture processes [9,10,11,12,13,14,15], while few studies have also considered a case of new construction [10,11]. The supply of heat to the capture process also varies between the studies, e.g., Liang and Li [9] considered investment in a small coal-fired combined heat and power (CHP) plant for steam and electricity supply while IEAGHG [10] considered steam generation from waste heat together with supply from either a natural gas boiler or a CHP plant with export of surplus electricity. Furthermore, in their plant-specific study, Jakobsen et al. [13] considered cases where only available waste heat was used for partial-scale capture as well as a case with waste heat and additional steam production from a natural gas boiler for full-scale capture.
Calcium-based looping systems have been studied in several configurations with different strategies for waste heat utilization. Studies on indirect calcination configuration with a relatively low CO2 avoidance rate have either considered all electricity to be imported (Ozcan [11]) or included investments in waste heat recovery systems for electricity generation (Rodríguez et al. [16] and Diego et al. [17]). Calcium looping in tail-end like configurations with waste heat steam generation and high CO2 avoidance rate have also been investigated by Ozcan [11] and Rodríguez et al. [16], and yet another configuration, double calcium looping with waste heat recovery, was proposed by Diego et al. [17].
Oxyfuel combustion with CO2 capture was investigated by the IEAGHG [10] in partial and full capture configurations, and more recently by Gerbelová, van der Spek and Schakel [14] for full capture. In both studies, electricity was imported from the grid. Both studies also highlighted the potential for significant cost-reduction with oxyfuel compared with MEA-based amine capture but emphasized the large modifications required in the core cement process for implementing the oxyfuel technology and the uncertain impacts on product quality.
A few studies have also investigated the techno-economics of membrane-based technologies for application in cement plants. Lindqvist et al. [18] investigated multi-stage dense polymeric membrane and facilitated transport membrane, Ozcan [11] evaluated a dual-stage polymeric membrane and Jakobsen et al. [13] investigated multi-stage polymeric membrane and a fixed site carrier membrane in their plant-specific study. These studies highlighted the potential for a relatively low-cost membrane system compared with MEA-based amine capture. However, Jakobsen, et al. emphasized the need for further technology demonstration to reduce uncertainties.
Overall, a wide range in CO2 avoidance costs was observed for the different capture technologies. The level of detail of the techno-economic evaluations, the methodologies and the assumptions used varies considerably. It is therefore difficult to make a direct comparison of techno-economic performance of different CO2 capture technologies applied in cement plants from literature sources in order to identify the best CO2 capture options.
In this paper, the economic performance of CO2 capture technologies retrofitted in a Best-Available-Technologies (BAT) cement plant are assessed in the context of a coherent techno-economic framework [19]. The investigated capture technologies are MEA-based absorption as reference technology, chilled ammonia process (CAP), membrane-assisted CO2 liquefaction, oxyfuel technology and two different configurations of calcium looping technology (tail-end and integrated). Besides highlighting the value of the consistent application of the above-mentioned common framework in a comparative investigation of a broad set of CO2 capture technologies, it is worth noting that for several of these technologies this work represents the first detailed costs analysis for a cement application.
This work has been carried out within the Horizon2020-funded project CEMCAP, which has as overall objective to prepare the ground for large-scale implementation of CO2 capture in the European cement industry [20]. An essential element in responding to this objective has been to perform a comprehensive techno-economic comparative assessment of CO2 capture. With this paper we aim at providing an assessment that can be used as a decision basis for future evaluations of CO2 capture implementation at cement plants. An extraction of this work is presented as this paper series, where the technical evaluation is in Part 1, and the economic analysis is in Part 2.

2. Reference Cement Plant and CO2 Capture Technologies

The reference cement plant is a BAT plant defined by ECRA. It is based on a dry kiln process, and consists of a five-stage cyclone preheater, calciner with tertiary duct, rotary kiln and clinker cooler. Flue gas is emitted from a single stack with CO2 emissions originating from combustion of fuel in the calciner and the rotary kiln, as well as from the calcination of the raw material itself (CaCO3 → CaO + CO2). Some waste heat can be recovered in the cement plant from the clinker cooler exhaust air. Compared to ECRA reference, here a selective non-catalytic reduction (SNCR) system for deNOx removal is considered.
The plant has a representative size for a European cement plant with a capacity of 3000 tons of clinker per day. This corresponds to a capacity of about 1 Mt clinker per year, with a run time of >330 days per year. The specific CO2 emissions and the electric power consumption of the plant amount to 850 kgCO2/tclk (18–22 vol% CO2 in flue gas, on wet basis) and 132 kWh/tclk, respectively. The clinker burning line of the reference cement plant is shown in Figure 1. A more detailed description of the reference cement plant can be found in Part 1 of this study and in the CEMCAP framework [19]. The utility and material consumption of the reference cement plant (based on the process modelling presented in Part 1) are summarized in Table 1.
The investigated CO2 capture technologies are fundamentally different, both in terms of the capture concepts themselves, but also when it comes to the inputs required (coal, heat, electric power), whether electric power is consumed or generated, and the way the capture technologies are integrated into the kiln (ranging from purely end-of-pipe to considerable modification of the process at the cement kiln). A schematic overview of the integration of the capture technologies to the reference kiln is given in Figure 2, followed by a brief description of each technology. More detailed descriptions of the technologies can be found in Part 1 of the paper series.
The reference technology MEA is an end-of-pipe technology based on absorption. The MEA process requires a considerable amount of heat for solvent regeneration, and power is required for fans and pumps in the core process as well as for compression and dehydration of the captured CO2. The flue gas from the cement plant is treated in the capture system right before it reaches the stack, and waste heat from the cement plant is used to cover a part of the heat demand.
In the oxyfuel process, combustion is performed with an oxidizer consisting mainly of oxygen mixed with recycled CO2, to produce a CO2 rich flue gas which allows a relatively easy purification with a CO2 purification unit (CPU). As opposed to the MEA technology, the cement kiln process is modified when the oxyfuel process is integrated into a kiln system. Additional power is needed for an air separation unit (ASU) and for the CPU, but some of this power demand can be covered by an organic Rankine cycle (ORC) generating power from waste heat.
The chilled ammonia process (CAP) is also an end-of-pipe technology based on absorption, where CO2 is removed from flue gas using aqueous ammonia as solvent. Heat is required for solvent regeneration and for an ammonia recovery system and power is required for chilling, pumping and compression. Waste heat from the cement plant can be utilized to cover a part of the heat demand.
In the membrane-assisted CO2 liquefaction (MAL) concept, polymeric membrane technology and a CO2 liquefaction process are combined since CO2 liquefaction is generally more suitable than membranes for second-stage CO2 purification [21]. Polymeric membranes are first utilized for bulk separation of CO2 resulting in moderate product purity. This CO2-rich product is sent to the CO2 liquefaction process, where CO2 is liquefied, and the more volatile impurity components are removed, resulting in a high purity CO2 product. The technology is an end-of-pipe retrofit technology with no additional integration or feedback to the cement plant, and only electric power is required as input to the process.
The calcium looping (CaL) technology is based on the reversible carbonation reaction, which is exploited to separate the carbon dioxide from the flue gas. The technology can be applied to a cement plant as a tail-end/end-of-pipe technology (CaL tail-end, Figure 2e) or it can be integrated with the calcination process taking place in the cement kiln (CaL integrated, Figure 2f). In the tail-end configuration the flue gas from the cement kiln is sent to the CaL system for purification, and a CaO-rich purge from the CaL system is sent to the cement kiln and added to the raw meal. In the integrated concept, the calciner and the preheater of the cement kiln are modified (the cement kiln calciner and the CaL calciner are combined), and the CO2 capture is performed as a part of the process. The CaL processes require supply of limestone and coal. Oxygen is required for oxyfuel combustion in the calciner. Power is required for an ASU for oxygen supply to the core CaL process and for a CPU. A steam cycle recovers high temperature waste heat and produces power that can cover demand of the process and/or be exported.
The cost analysis of the CO2 capture retrofit considers 90% CO2 captured from the flue gas at the stack in the reference cement plant as a baseline scenario. Furthermore, the captured CO2 is compressed and conditioned for transport by pipeline. The required CO2 pressure is 110 bar and the temperature is around 30 °C. Further details on requirements for CO2 purity and maximum impurity concentrations are outlined in the CEMCAP framework [19]. For the capture technologies that require steam in their operation, available waste heat from the cement plant is used to cover as much of the steam demand as possible while the rest of the steam required (the major part) is generated by a natural gas boiler (see Part 1 for details).
Utility and material consumption of the CO2 capture technologies as well as equivalent specific CO2 avoided for all technologies, based on process simulations presented in Part 1, are summarized in Table 2. It should be mentioned that the oxyfuel and CaL technologies are closely integrated with the cement kiln, while the other technologies are only connected to the kiln by the flue gas entering the system and heat integration. Due to the close process integration, the two CEMCAP partners simulating the oxyfuel and CaL technologies, VDZ and PoliMi, have established their own simulations of the reference cement kiln. Other technologies are simulated using the flue gas from the VDZ simulation of the reference kiln as feed.

3. Methodology

The economic assessment of retrofitting CO2 capture technologies in a BAT cement plant is based on the results from the detailed technical process evaluations for each of the technologies described in Part 1. The technical process evaluations are based on process simulations with input from experimental work carried out in the CEMCAP project, on the oxyfuel technology [22,23], membrane-assisted CO2 liquefaction [24], the chilled ammonia process [25,26] and calcium looping [27,28,29,30]. Economic key performance indicators (KPIs) are finally calculated and used to compare the techno-economic performance of the technologies.

3.1. Cost Estimation

The cost estimation is performed on the basis of earnings before interest, taxes, depreciation and amortization. The estimation consists of two main parts: estimation of (i) the capital costs (CAPEX) which is expressed in terms of total plant cost (TPC), and (ii) the operating costs (OPEX). All cost figures are expressed in €2014. The main assumptions and descriptions of cost elements that make up the CAPEX and OPEX are summarized in this section. For further details the reader is referred to the CEMCAP framework [19]. Furthermore, a spreadsheet with the model developed in this work for the cost estimation is available for open use [31].

3.1.1. Capital Costs

A bottom-up approach is used for estimation of TPC for the CO2 capture technologies [32]. The cost estimates of all the CO2 capture technologies are performed for “Nth of a kind” plants, i.e., for commercial plants built after successful development and commercial adoption of the technology. A breakdown of the costing approach is illustrated in Figure 3.
Estimation of total equipment costs (TEC) and installation costs are based on equipment lists compiled for each of the investigated CO2 capture technologies (see Supplementary Material for detailed equipment lists). Estimation of equipment costs (EC) and installation costs (IC) for most standard process equipment is done using Aspen Process Economic Analyzer® and the Thermoflex® software. The estimation is based on key characteristics of each equipment from process simulations and design criteria, such as pressure, temperature, flows and materials. Estimates for other, non-standard components are based on information provided by the CEMCAP industry partners and literature. This includes e.g., several pieces of non-commercial process equipment in the oxyfuel and CaL systems, membrane packages and multi-stream plate and fin heat exchangers used in CO2 purification units (CPU). More details on design criteria for standard process equipment and cost estimation methodologies for non-standard equipment can be found in CEMCAP report D4.4 “Cost of critical components in CO2 capture processes” [33].
Estimation of TEC and installation costs for the CAP technology is performed by the project partner Baker Hughes, a GE company, (BHGE, Frankfurt am Main, Germany) using their proprietary tool QFACT which is based on an extensive database of executed projects. The unit costs are lumped into equipment costs and installation costs as to not disclose BHGE confidential information about cost structure and/or pricing strategy.
Process contingencies are based on the maturity or status of the technology, in line with the American Association of Cost Engineers (AACE) guidelines for process contingency [34] and are adjusted to also account for the estimated level of detail of the equipment lists for each technology. The resulting process contingency factors for each of the capture technologies and miscellaneous subsystems are listed in Table 3.
Indirect costs are set to 14% of the total direct costs (TDC) for all technologies and include cost elements such as yard improvement, service facilities, engineering and consultancy cost as well as building and sundries [32].
Owner’s costs and project contingencies for Nth of a kind cost estimates are set to 7% and 15% of the TDC, respectively, following the AACE cost estimates guidelines.
The accuracy of the cost estimate is expected to be +35%/−15% (AACE Class 4), except for the CAP technology, where the estimation of TEC and installation cost is performed by BHGE with expected accuracy of ±30% (also AACE Class 4).

3.1.2. Operating Costs

Fixed OPEX, which include maintenance, insurance and labour costs are based on assumptions for material replacement and factor approach [32]. The annual maintenance cost is taken as 2.5% of the TPC and includes cost of preventive and corrective maintenance as well as maintenance labour cost. Maintenance labour cost corresponds to 40% of the total annual maintenance cost. The annual insurance and location taxes, including overhead and miscellaneous regulatory fees are set to 2% of TPC. Labour costs include costs for operating, administrative and support labour. Costs for operating labour are calculated from assumptions on number of employees, 100 persons in the cement plant and 20 persons in the CO2 capture plant, with an annual fully-burdened cost per employee of 60 k€/person. Costs for administrative and support labour are assumed to be 30% of the operating and maintenance labour cost.
Variable OPEX, which include fuel and raw material costs, utilities and other consumables, are primarily based on process simulations. No carbon tax is considered in the calculation of variable OPEX. The unit cost of all materials and utilities considered in the cost analysis are listed in Table 4.

3.2. Economic Key Performance Indicators

The cost performance of the capture technology is evaluated by the cost of clinker and the cost of CO2 avoided. In calculating the KPIs, the economic boundaries and financial parameters listed in Table 5 are used.
The cost of clinker ( C O C ) is evaluated by summing the contributions of the annualized CAPEX C cap , of the fuel cost C fuel , of the raw material costs C RM , of the electricity cost C el , and of the other operating and maintenance cost C O & M , all expressed per ton of clinker produced (i.e., as €/tclk). In case the cement plant has a net power export, revenues for electricity export to the grid are considered and C el becomes negative:
C O C = C cap + C fuel + C RM + C el + C O & M
The cost of CO2 avoided ( C A C ), in €/tCO2, is evaluated based on the cost of clinker and the equivalent specific emissions of the cement plant with and without CO2 capture as shown in Equation (2) [36],
C A C = C O C C O C ref e clk , eq , ref e clk , eq
where e clk , eq , ref is specific equivalent emissions from the reference cement plant, in tCO2/tclk, and e clk , eq is the specific equivalent emission from the cement plant with capture.
Equivalent emissions are defined as the sum of direct eclk and indirect e el , clk emissions:
e clk , eq = e clk + e el , clk
Indirect emissions can be calculated using the following equation:
e el , clk = e el · P el , clk
where P el , clk is the specific power consumption, which is positive when power is consumed and negative when it is generated, and e el is the CO2 emissions associated with each unit of electric power consumed. This value depends largely on the electricity mix considered.
The equivalent CO2 avoided takes all direct and indirect emissions into account. It gives the best indication on the overall reduction in CO2 emissions of the cement plant when a certain capture technology is implemented and allows a fair comparison of different technologies.

3.3. Economic Data of the Reference Cement Plant

The TDC of the reference cement plant is based on estimations from the IEAGHG [10] for a BAT cement plant with the same clinker capacity as the CEMCAP reference plant and amounts to 149.8 M€2014. This includes the added costs of a DeNOx system, based on standard SNCR process, assumed to be installed in the reference cement plant. The SNCR system uses ammonia solution as a reduction agent and has an average reduction rate of 60%. The TDC for the SNCR system is assumed to be 1.01 M€2014. The TPC for the reference cement plant are consequently calculated according to the bottom-up approach described in Figure 3.

4. Results and Discussion

4.1. Comparative Analysis of Key Performance Indicators

The KPIs employed to evaluate the economic performance of the cement plant with CO2 capture are the cost of clinker and the cost of CO2 avoided. The economic KPIs, as well as the total plant costs and annual OPEX for all the capture technologies and the reference cement plant without CO2 capture are presented in Table 6. Detailed equipment lists with estimated equipment costs and direct costs on component basis are provided as Supplementary Material.
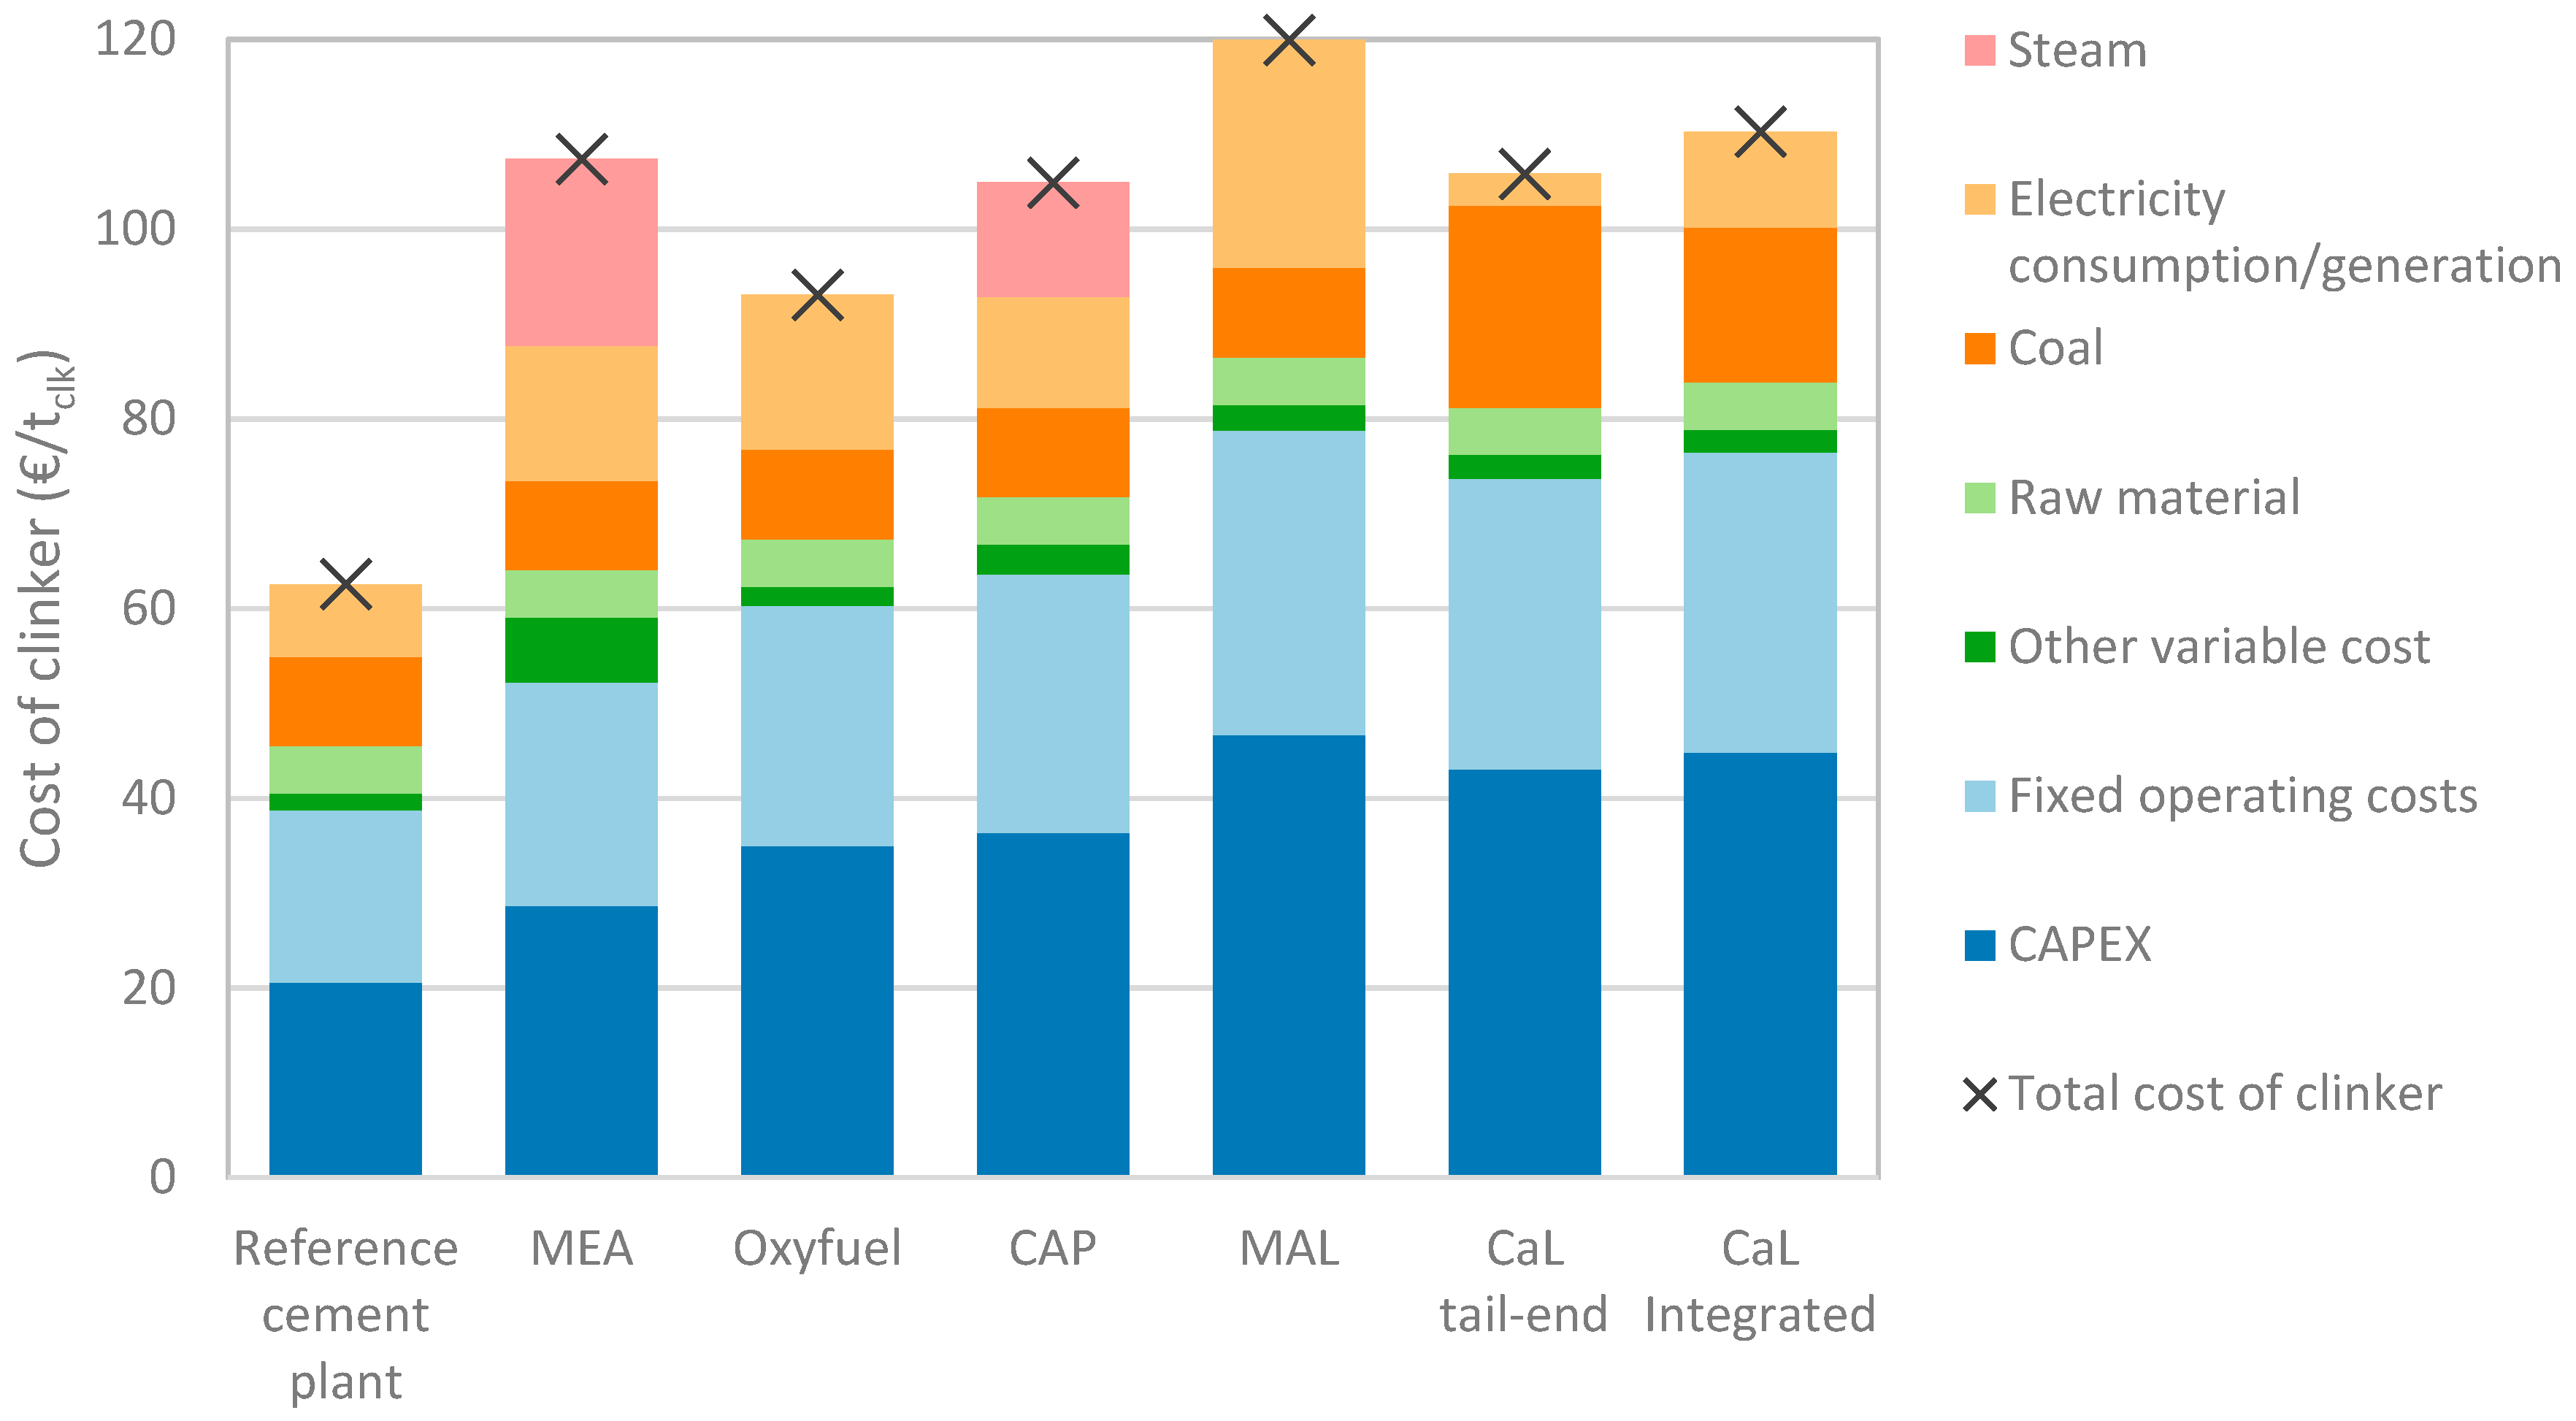
The cost evaluation shows that the reference capture technology, MEA, has the lowest total plant cost but also the highest annual OPEX. The MAL technology has the highest total plant cost, roughly three times higher the MEA technology. The oxyfuel and both CaL technologies have relatively low OPEX. In general, the cost of clinker increases with 49–92% from the 62.6 €/tclk in the reference cement plant when the investigated CO2 capture technologies are implemented. The cost of CO2 avoided ranges from 42 €/tCO2 for the oxyfuel technology to 84 €/tCO2 for the MAL technology, which is on a similar level as the CO2 avoidance cost for the MEA reference technology.
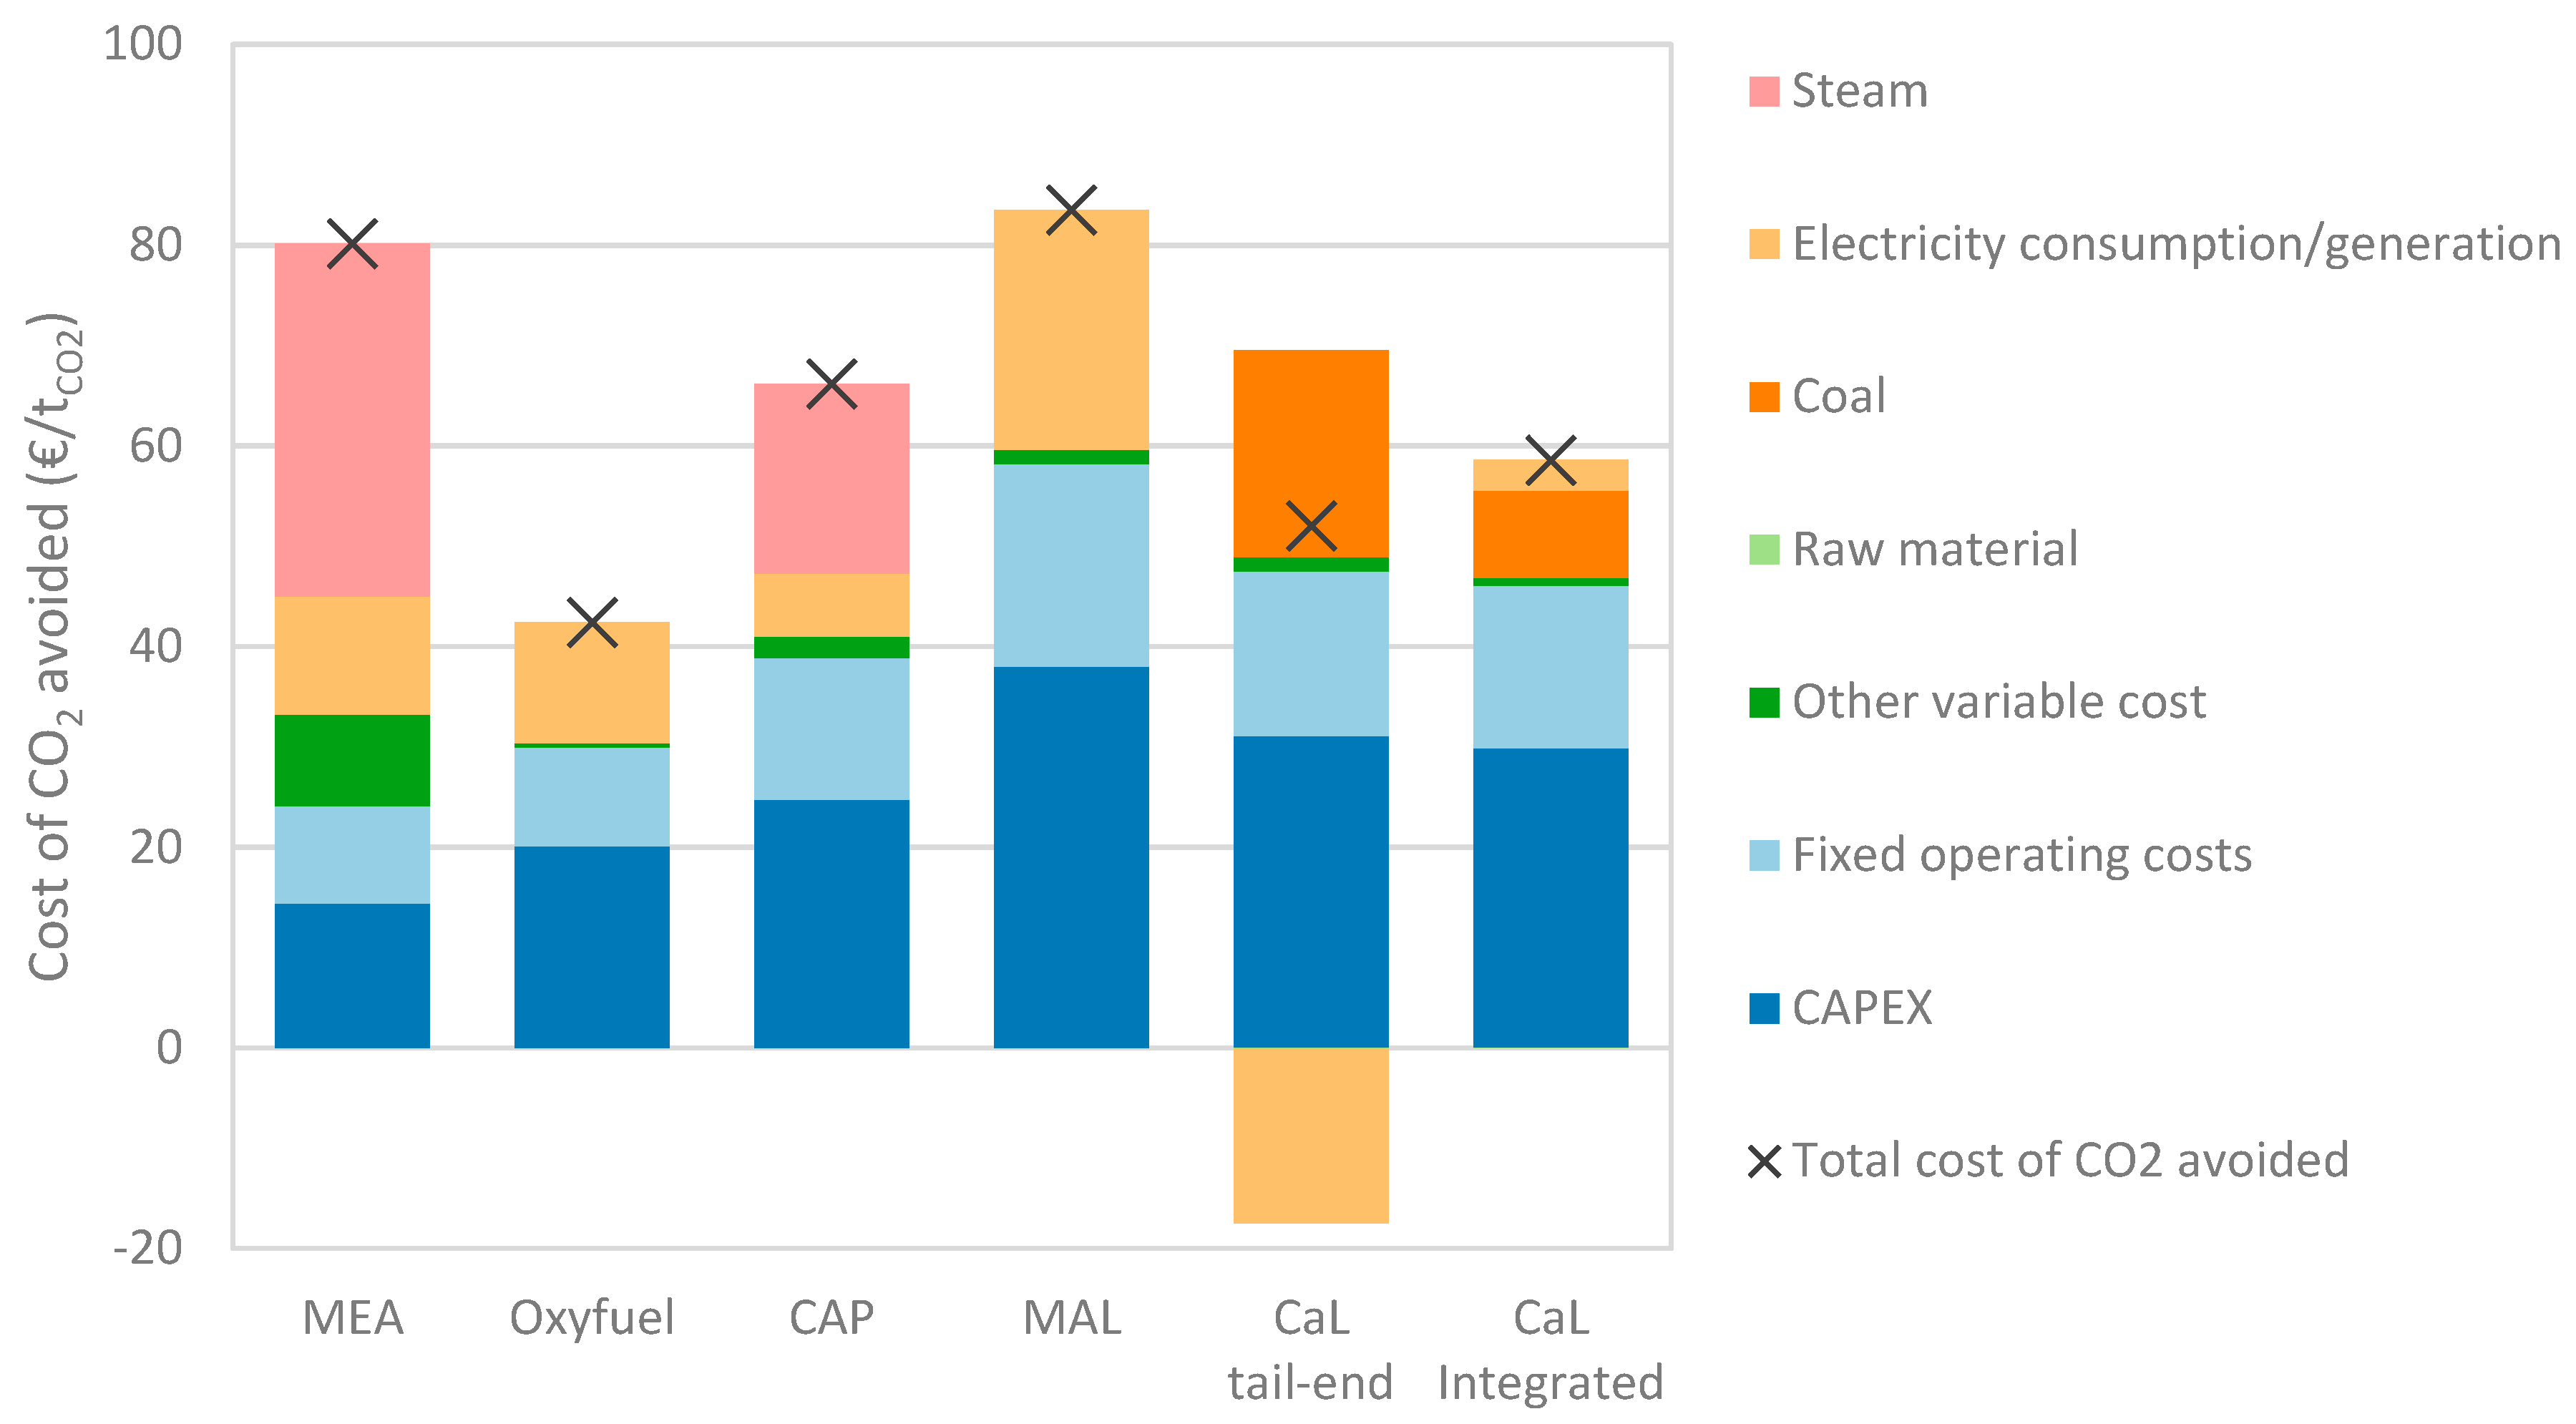
Figure 4 and Figure 5 show the breakdown of the cost of clinker and of CO2 avoided into the main cost factors. The oxyfuel technology shows the lowest cost of clinker compared to the other CO2 capture technologies, both due to lower variable OPEX and lower CAPEX. The absorption-based technologies MEA and CAP as well as both CaL technologies have similar clinker costs, in the range of 105–110 €/tclk. The CaL tail-end technology produces a significant amount of electricity which covers the electricity demand of the CO2 capture process as well as a part of the cement plant’s demand. As a result, this technology shows a lower electricity cost per ton clinker than the reference cement plant. The MAL technology shows the highest cost of clinker, with CAPEX and fixed OPEX (directly related to the CAPEX) being the largest cost factors.
The most important contributions to the cost of CO2 avoided differ among the capture technologies and illustrate the fundamental differences between most of the technologies. In the case of the reference technology MEA, steam contributes most to the cost of CO2 avoided. The consumption of steam is responsible for a large increase in the cost of clinker compared to the reference cement plant. Additionally, it has a negative effect on the equivalent specific CO2 avoided due to the emissions from the natural gas boiler. For practical reasons, the boiler flue gas is not treated in the capture plant according to the common framework, as mixing it with the cement flue gas has detrimental effects on the CO2 concentration. Compared with the other capture technologies, the MEA-based capture has the lowest equivalent specific CO2 avoided, as can be seen in Table 2.
The oxyfuel technology has by far the lowest cost of CO2 avoided. It is mainly the CAPEX, and associated fixed OPEX, together with electricity consumption in the capture process that contribute to the CO2 avoided cost. The increase in electricity consumption contributes not only to an increase in the cost of clinker compared to the reference cement plant but also to a decrease in the equivalent specific CO2 avoided due to associated CO2 emissions.
In the case of the CAP, the cost of steam, as well as the CAPEX and fixed OPEX, are the most important factors. Compared to MEA, the cost of steam is significantly lower for the CAP due to its relatively low specific heat requirement. Hence, the equivalent specific CO2 avoided of the CAP technology is about 15% higher than for MEA (cf. Table 2). This contributes to the lower CO2 avoidance cost observed for the CAP technology compared to the MEA reference technology.
For MAL, high CAPEX and associated fixed OPEX contribute the most to the cost of CO2 avoided. A significant share of the cost can also be attributed to the considerable electricity consumption of the capture process and the associated indirect CO2 emissions which consequently have a negative effect on the equivalent specific CO2 avoided.
For both calcium looping technologies, the increase in coal consumption compared with the reference cement plant contributes significantly to the cost of CO2 avoided, together with the increase in CAPEX. Both CaL technologies generate a significant amount of electric power, with the generation in the tail-end case even covering the demand of the capture process and a part of the cement plant’s demand. As a result, the cost of electricity per ton clinker is lower in the CaL tail-end case compared with the reference cement plant. This in turn leads to negative CO2 avoidance costs associated with electricity consumption, as shown in Figure 5. For an extensive discussion on the economic analysis of the CaL cement plants, the reader is referred to the study of De Lena et al. [37].
Several studies on economic assessments of CO2 capture from cement have been published in the literature and recently gathered in a review by the IEAGHG [38]. The results presented here are in line with the literature, although a direct comparison of cost estimates is challenging, due to variations in the level of detail, in the methodology and in the assumptions applied by the different studies. Most cost analyses have been carried out for MEA-based CO2 capture, where various process configurations and assumptions have been considered. Therefore, a large range of CO2 avoidance cost is reported for this technology, from around 75–170 €/tCO2 [38].
Fewer studies have analysed the cost of the oxyfuel technology. The IEAGHG [10] reported lower CAPEX than in this work (around 14% lower in €/tclk), with the main difference being a lower cost estimated for the ASU and the CPU. On the other hand, the study reported around 8% higher CO2 avoidance cost than in this work. Gerbelová, van der Spek and Schakel [14] estimated the CAPEX to be around 2% lower than estimated in this work, but they did not report on the CO2 avoidance cost.
Ozcan [11] reported on CAPEX for a calcium looping tail-end process, although the process configuration is slightly different from what is presented in this paper, with the flue-gas to be treated extracted between two preheating stages and not downstream of the preheater. The difference in CAPEX, in €/tclk, ranges from −5% to 11%, depending on the amount of CaO-rich purge from the calcium looping process that is added to the raw meal in the cement plant.
Considering membrane-based technologies, literature cost estimates for cement applications are difficult to compare with the results presented here, as they are based on different process concepts than considered in this work. For the CAP and integrated calcium looping technologies, detailed cost analyses comparable with the work presented here are not available in the literature.
Through the conduction of the current techno-economic analysis, several possibilities for improved cost performance or to reduce uncertainties in cost estimates have been identified.
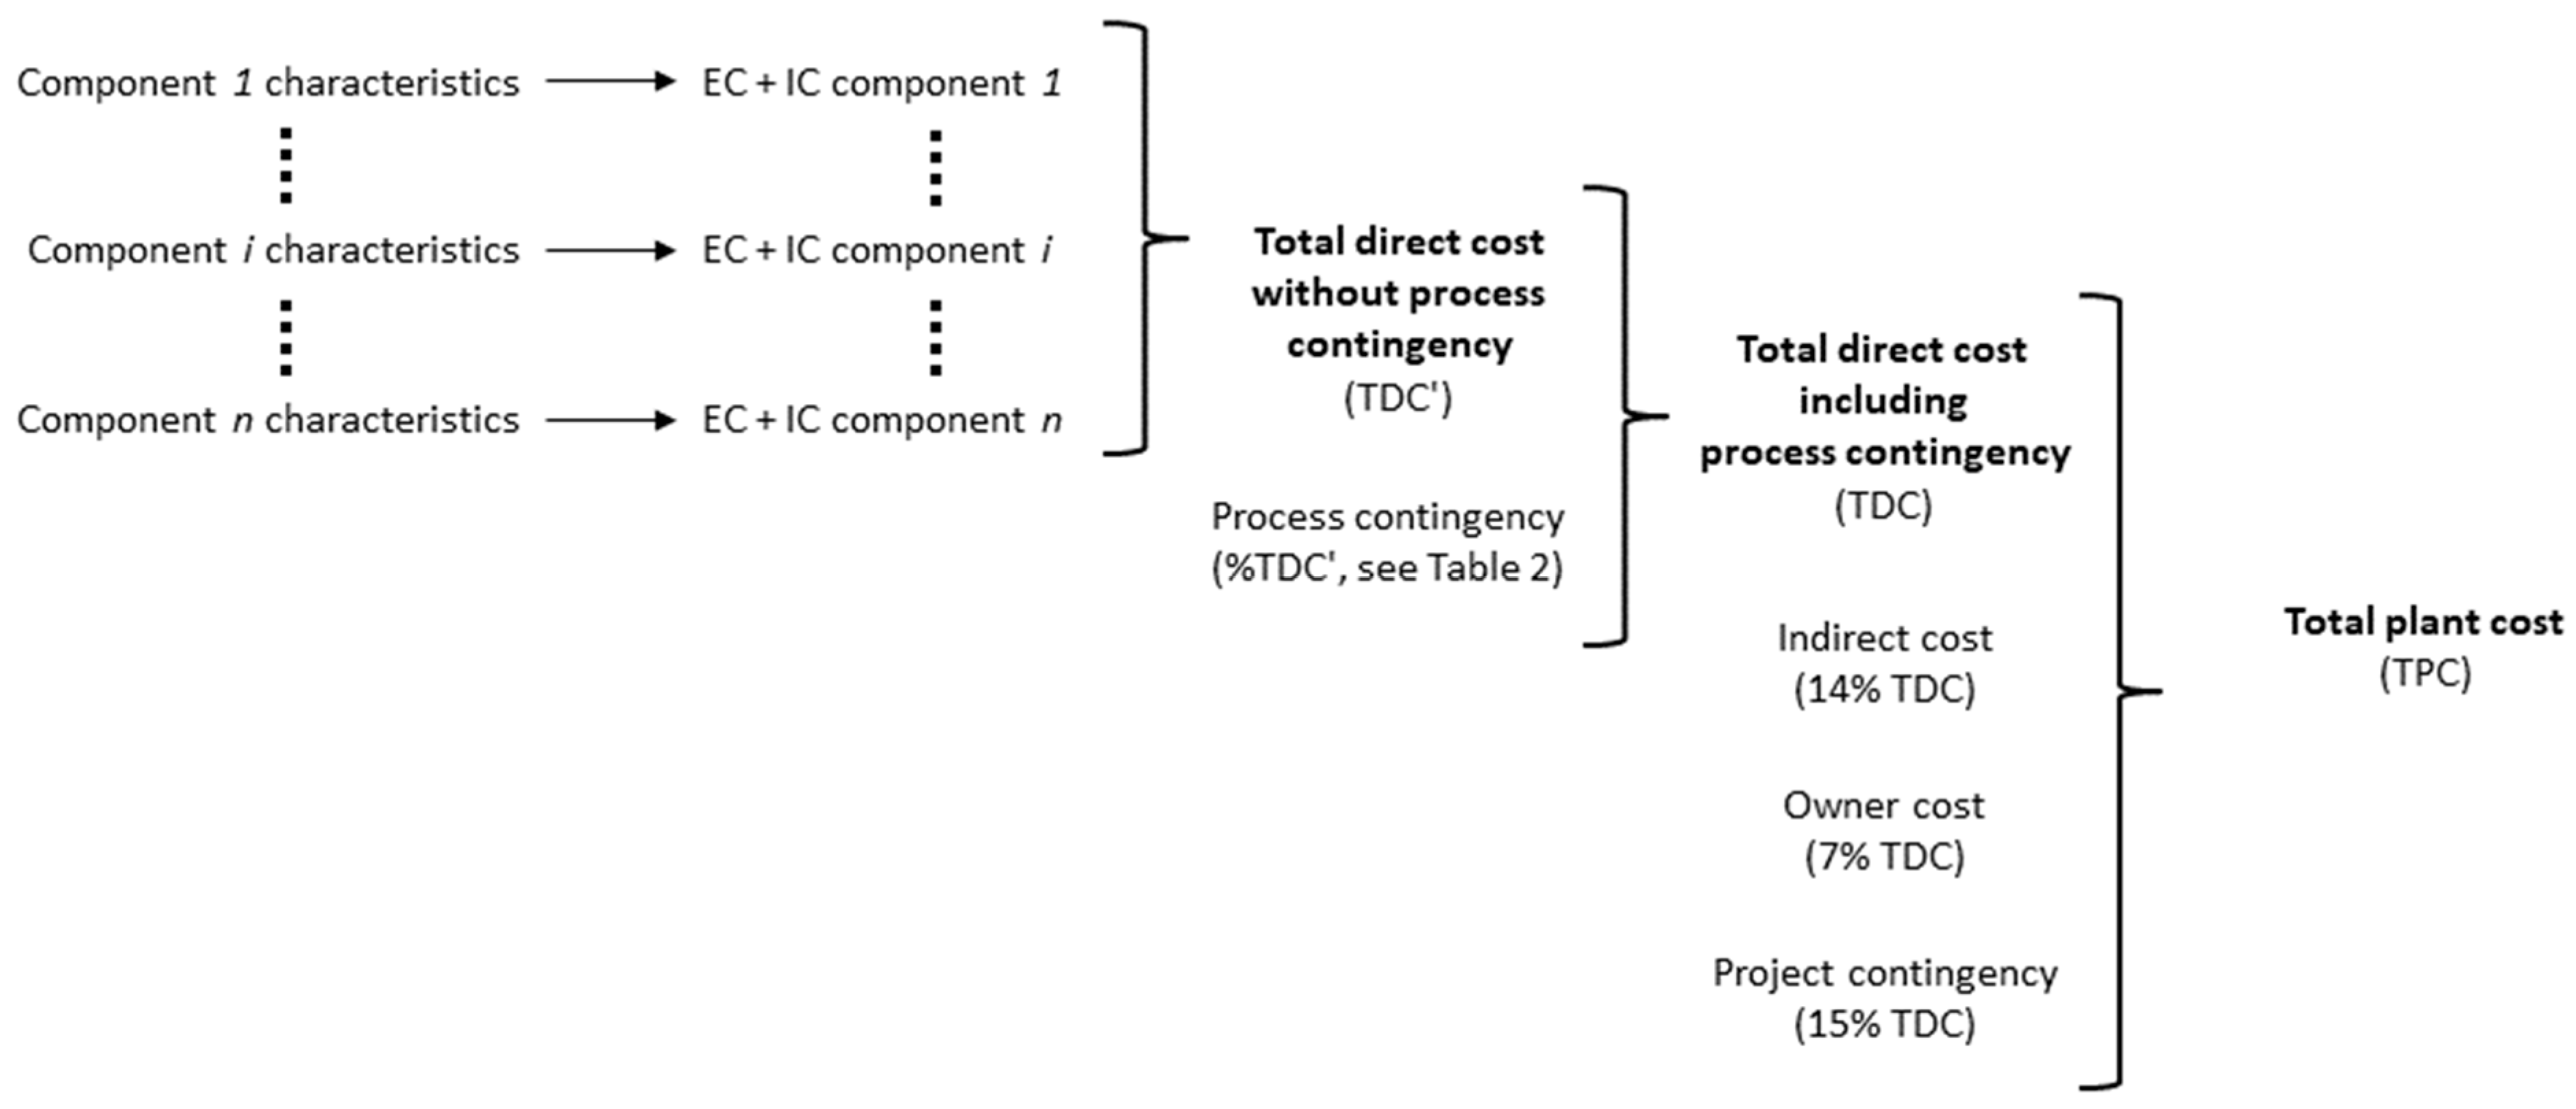
For several technologies, it was observed that process contingencies contributed heavily to the CAPEX. The process contingencies account for costs that are unknown, and the relative amount of unknown costs are assumed to be higher for technologies with lower maturity (cf. Table 3). The process contingencies are particularly high for the oxyfuel, the MAL and the integrated CaL technologies, where they directly account for about 22%, 30% and 20% of the TDC for these technologies, respectively. In addition, elements of the fixed OPEX are calculated as a factor of the CAPEX, such that the process contingencies overall account for 14%, 20% and 15% of the CO2 avoidance cost for the oxyfuel, MAL and the integrated CaL technologies. Increasing technology maturity by further development and demonstration of the technologies for cement applications would reduce the uncertainty of the costs, and possibly lower the overall cost estimates of the technologies.
The technical evaluation reported on in Part 1 showed that steam generation in a NG boiler contributed to a significant share of equivalent specific CO2 emissions for the solvent technologies MEA and CAP. To reduce these emissions and potentially decrease the cost of CO2 avoided, it could be considered to mix the flue gas from the NG boiler with those from the cement plant and thereby capture the CO2 from the NG boiler in the post-combustion process. Furthermore, in cement plants which use raw material with low moisture content, a larger amount of waste heat would be available for steam generation at lower cost and lower associated CO2 emissions compared to the NG boiler steam generation. This is for instance the case for the previously mentioned Norcem cement plant in Brevik, where it has been found that use of the plant waste heat for solvent regeneration can cover the heat demand for capturing ~40% of the emitted CO2 [13]. Thus, the solvent based technologies will have a better techno-economic performance when retrofitted to such plants.
The oxyfuel technology is shown to have the lowest cost of CO2 avoided, and has both relatively low OPEX and CAPEX, even though maturity related process contingencies do contribute significantly to the CAPEX. It should however be noted that there are several important aspects regarding retrofitability of the technology with the cement plant which could affect the cost process performance, such as potential impacts on the reliability of cement production due to substantial modifications of the core production process, that have not been considered in calculation of the economic KPIs.
For the MAL technology, CAPEX is the single largest cost factor. In this context, the membrane performance is essential as it strongly influences the energy performance of the whole process and consequently the size and cost of several of the most capital-intensive process equipment. The MAL process design was restricted to the specific membrane type that was tested within CEMCAP. A screening of different membranes, preferably with testing in real conditions at a cement plant to increase technology maturity and reduce uncertainties, in addition to further optimization of the system could result in better technical performance and lower costs than observed here.
For the calcium looping technologies, CAPEX and the consumption of coal are the largest cost factors, although in the tail-end configuration, the large coal consumption is effectively counterbalanced by the consequent production of electricity and the associated negative CO2 avoidance costs (cf. Figure 5). In the integrated configuration, the CAPEX together with the capital-related fixed OPEX account for nearly 80% of the cost of CO2 avoided. Further development of this technology on a larger scale is therefore essential to increase maturity, reduce uncertainties and potentially bring about cost reductions.

4.2. Sensitivity Analysis

Various assumptions on cost parameters are essentially dependent on the geographic location of the cement plant and the time at which the cost analysis is performed. The effect of this variability on the economic KPIs was investigated by varying the following parameters in the suggested ranges:
  • Coal price: +/− 50% of the reference cost
  • Steam supply: +/− 50% of the reference cost
  • Electricity price: +/− 50% of the reference cost
  • CAPEX of CO2 capture technologies: +35/−15%
  • Carbon tax: 0–100 €/tCO2
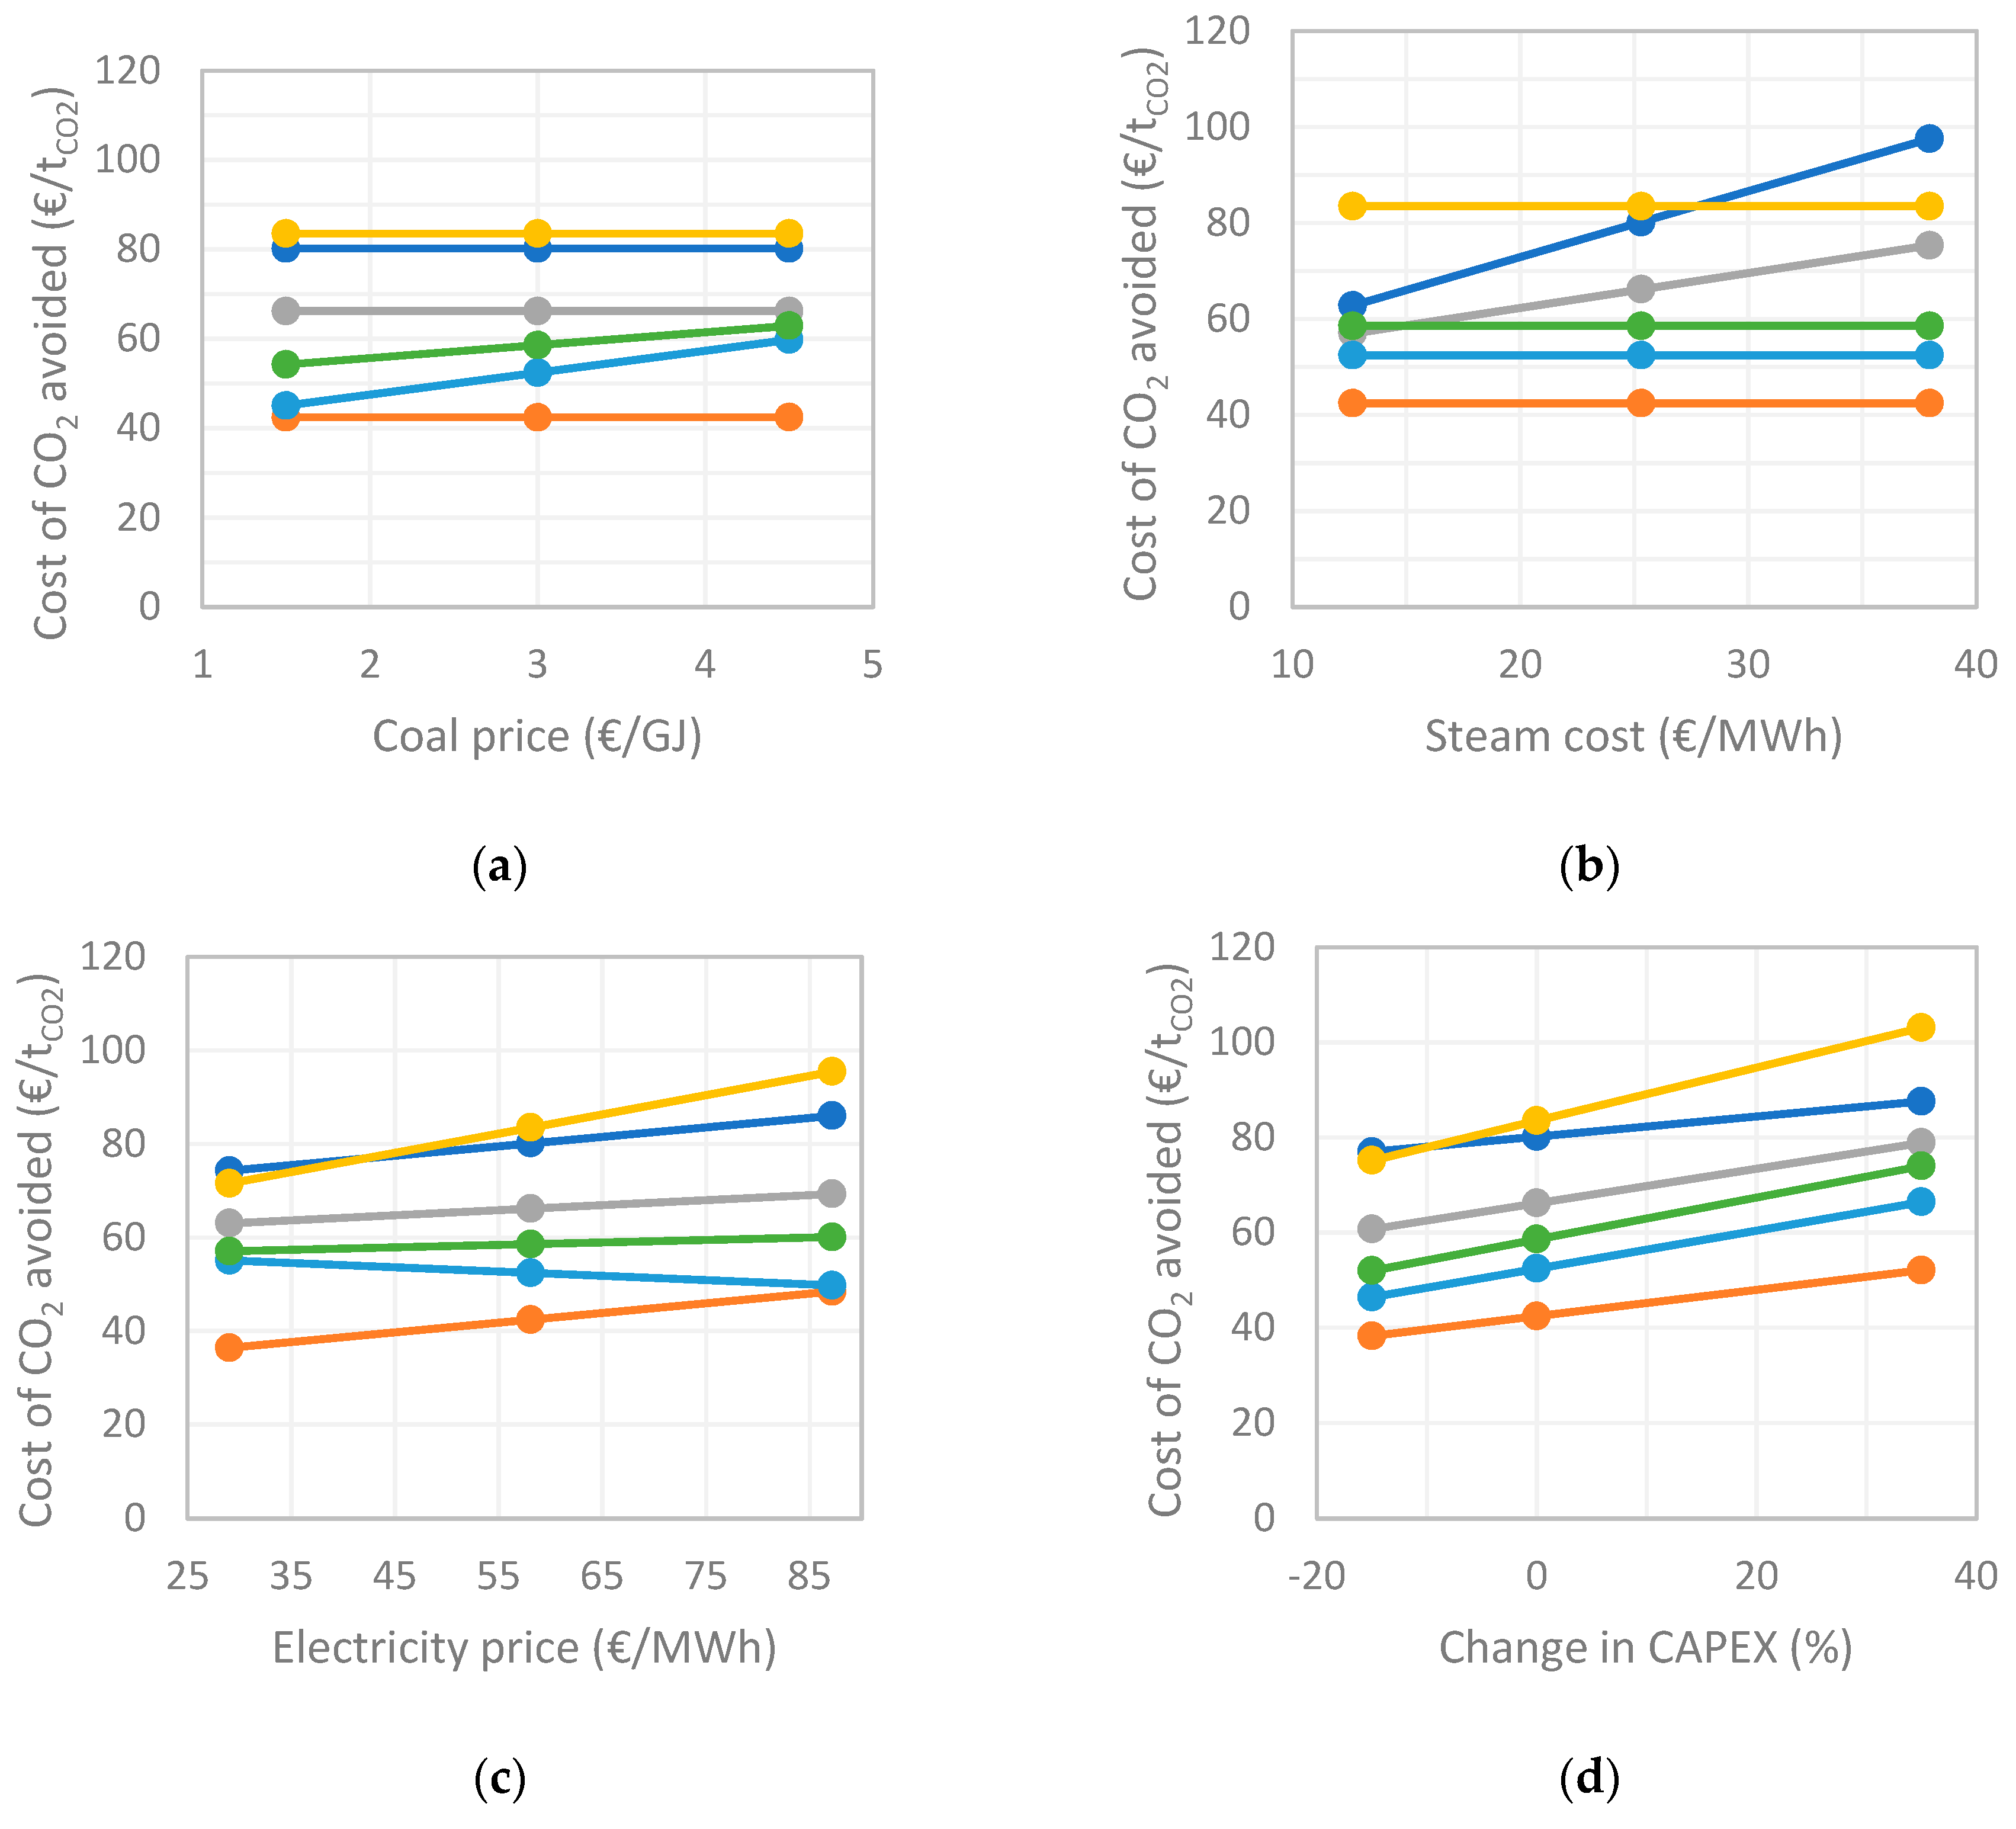
The sensitivity of the cost of CO2 avoided to the coal price, steam cost, electricity price and a change in CAPEX are shown in Figure 6 as well as the sensitivity of the cost of clinker to a carbon tax. The cost of coal affects the CaL processes, due to the significant increase in fuel consumption associated with the CaL technology. The MEA, CAP and MAL technologies are unaffected by the cost of coal since these technologies do not require additional coal consumption.
The cost of steam naturally only affects the absorption-based MEA and CAP technologies, especially the MEA technology due to its relatively high steam requirement. At the lower end of the steam cost range, the cost of CO2 avoided with MEA, CAP, and integrated CaL are almost the same.
Electricity intensive technologies, such as oxyfuel and MAL, are naturally the most sensitive to the price of electricity. The increase in electricity price decreases the cost of CO2 avoided for the CaL tail-end technology, in contrast to all the other technologies. This is because the electricity generated in the CaL process covers a part of the cement plant’s demand and therefore the CO2 avoidance cost associated with electricity is negative for the CaL tail-end technology.
The most capital-intensive technologies, MAL and both CaL processes, are most sensitive to a change in the CAPEX estimate. The oxyfuel and CAP technologies are also significantly affected while the smallest effect is seen for MEA, which has the lowest CAPEX. It should be noted that the estimated fixed OPEX are also affected by a change in the CAPEX.
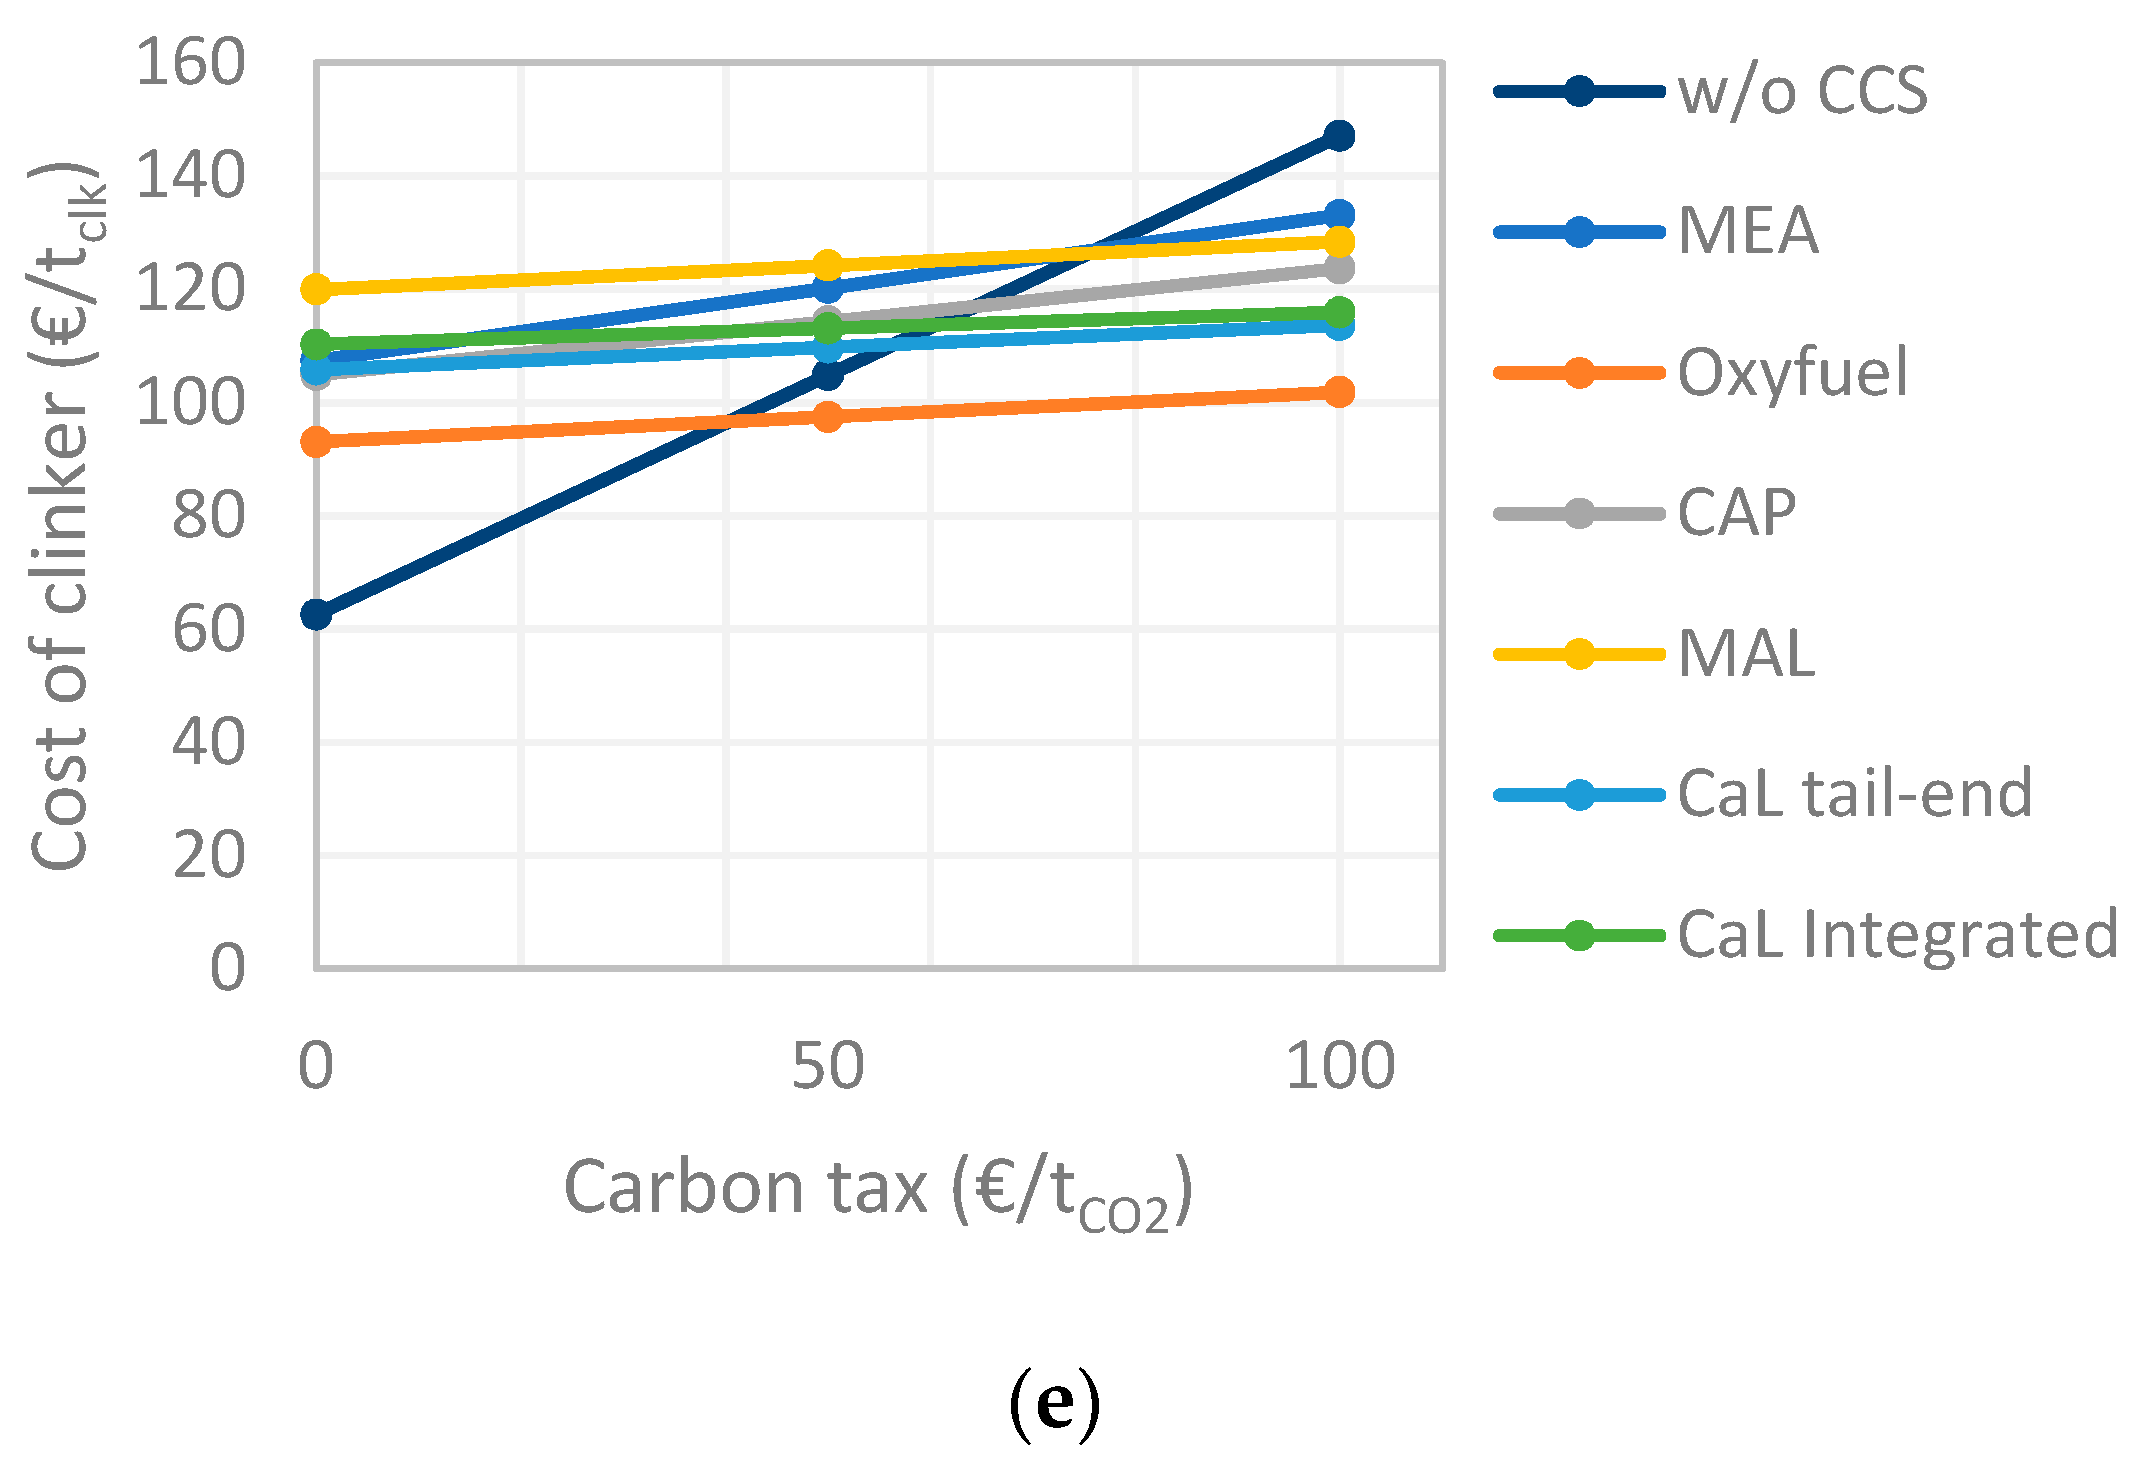
If a carbon tax is implemented on the direct CO2 emissions from the cement plant, the cost of clinker for the reference cement kiln will increase. At a tax level of around 40 €/tCO2, the cost of clinker (excluding costs for CO2 transport and storage) with oxyfuel technology becomes lower than in the reference cement kiln, and at roughly 60 €/tCO2 the CAP and both CaL technologies will have a lower cost of clinker compared with the cement kiln without CO2 capture. For MEA and MAL, a carbon tax of around 75 €/tCO2 would be required for a clinker cost lower than that of the reference cement kiln. Due to the direct CO2 emissions from on-site steam generation for CO2 capture with MEA and CAP, and therefore higher direct CO2 emissions, these technologies are more sensitive to a carbon tax than the other CO2 capture technologies.

4.3. Alternative Scenarios for CO2 Capture

The results presented for the baseline scenario consider 90% CO2 avoided from the cement plant flue gases, CO2 transport by pipeline and, when required, steam being provided by a natural gas fired boiler. However, other scenarios for CO2 capture have also been investigated within the CEMCAP project. This includes scenarios with higher CO2 content in the flue gas, partial-scale capture, ship transport, different characteristics of the power generation system, steam import for solvent-based technologies, variations in air leakage in the oxyfuel cement plant and variations in the amount of sorbent purge used as raw material in the calcium looping tail-end configuration. Selected technology-specific scenarios which showed a significantly different composition or a change in the cost of CO2 avoided are highlighted here, while the complete analysis of all scenarios can be found in the CEMCAP report by Voldsund et al. [
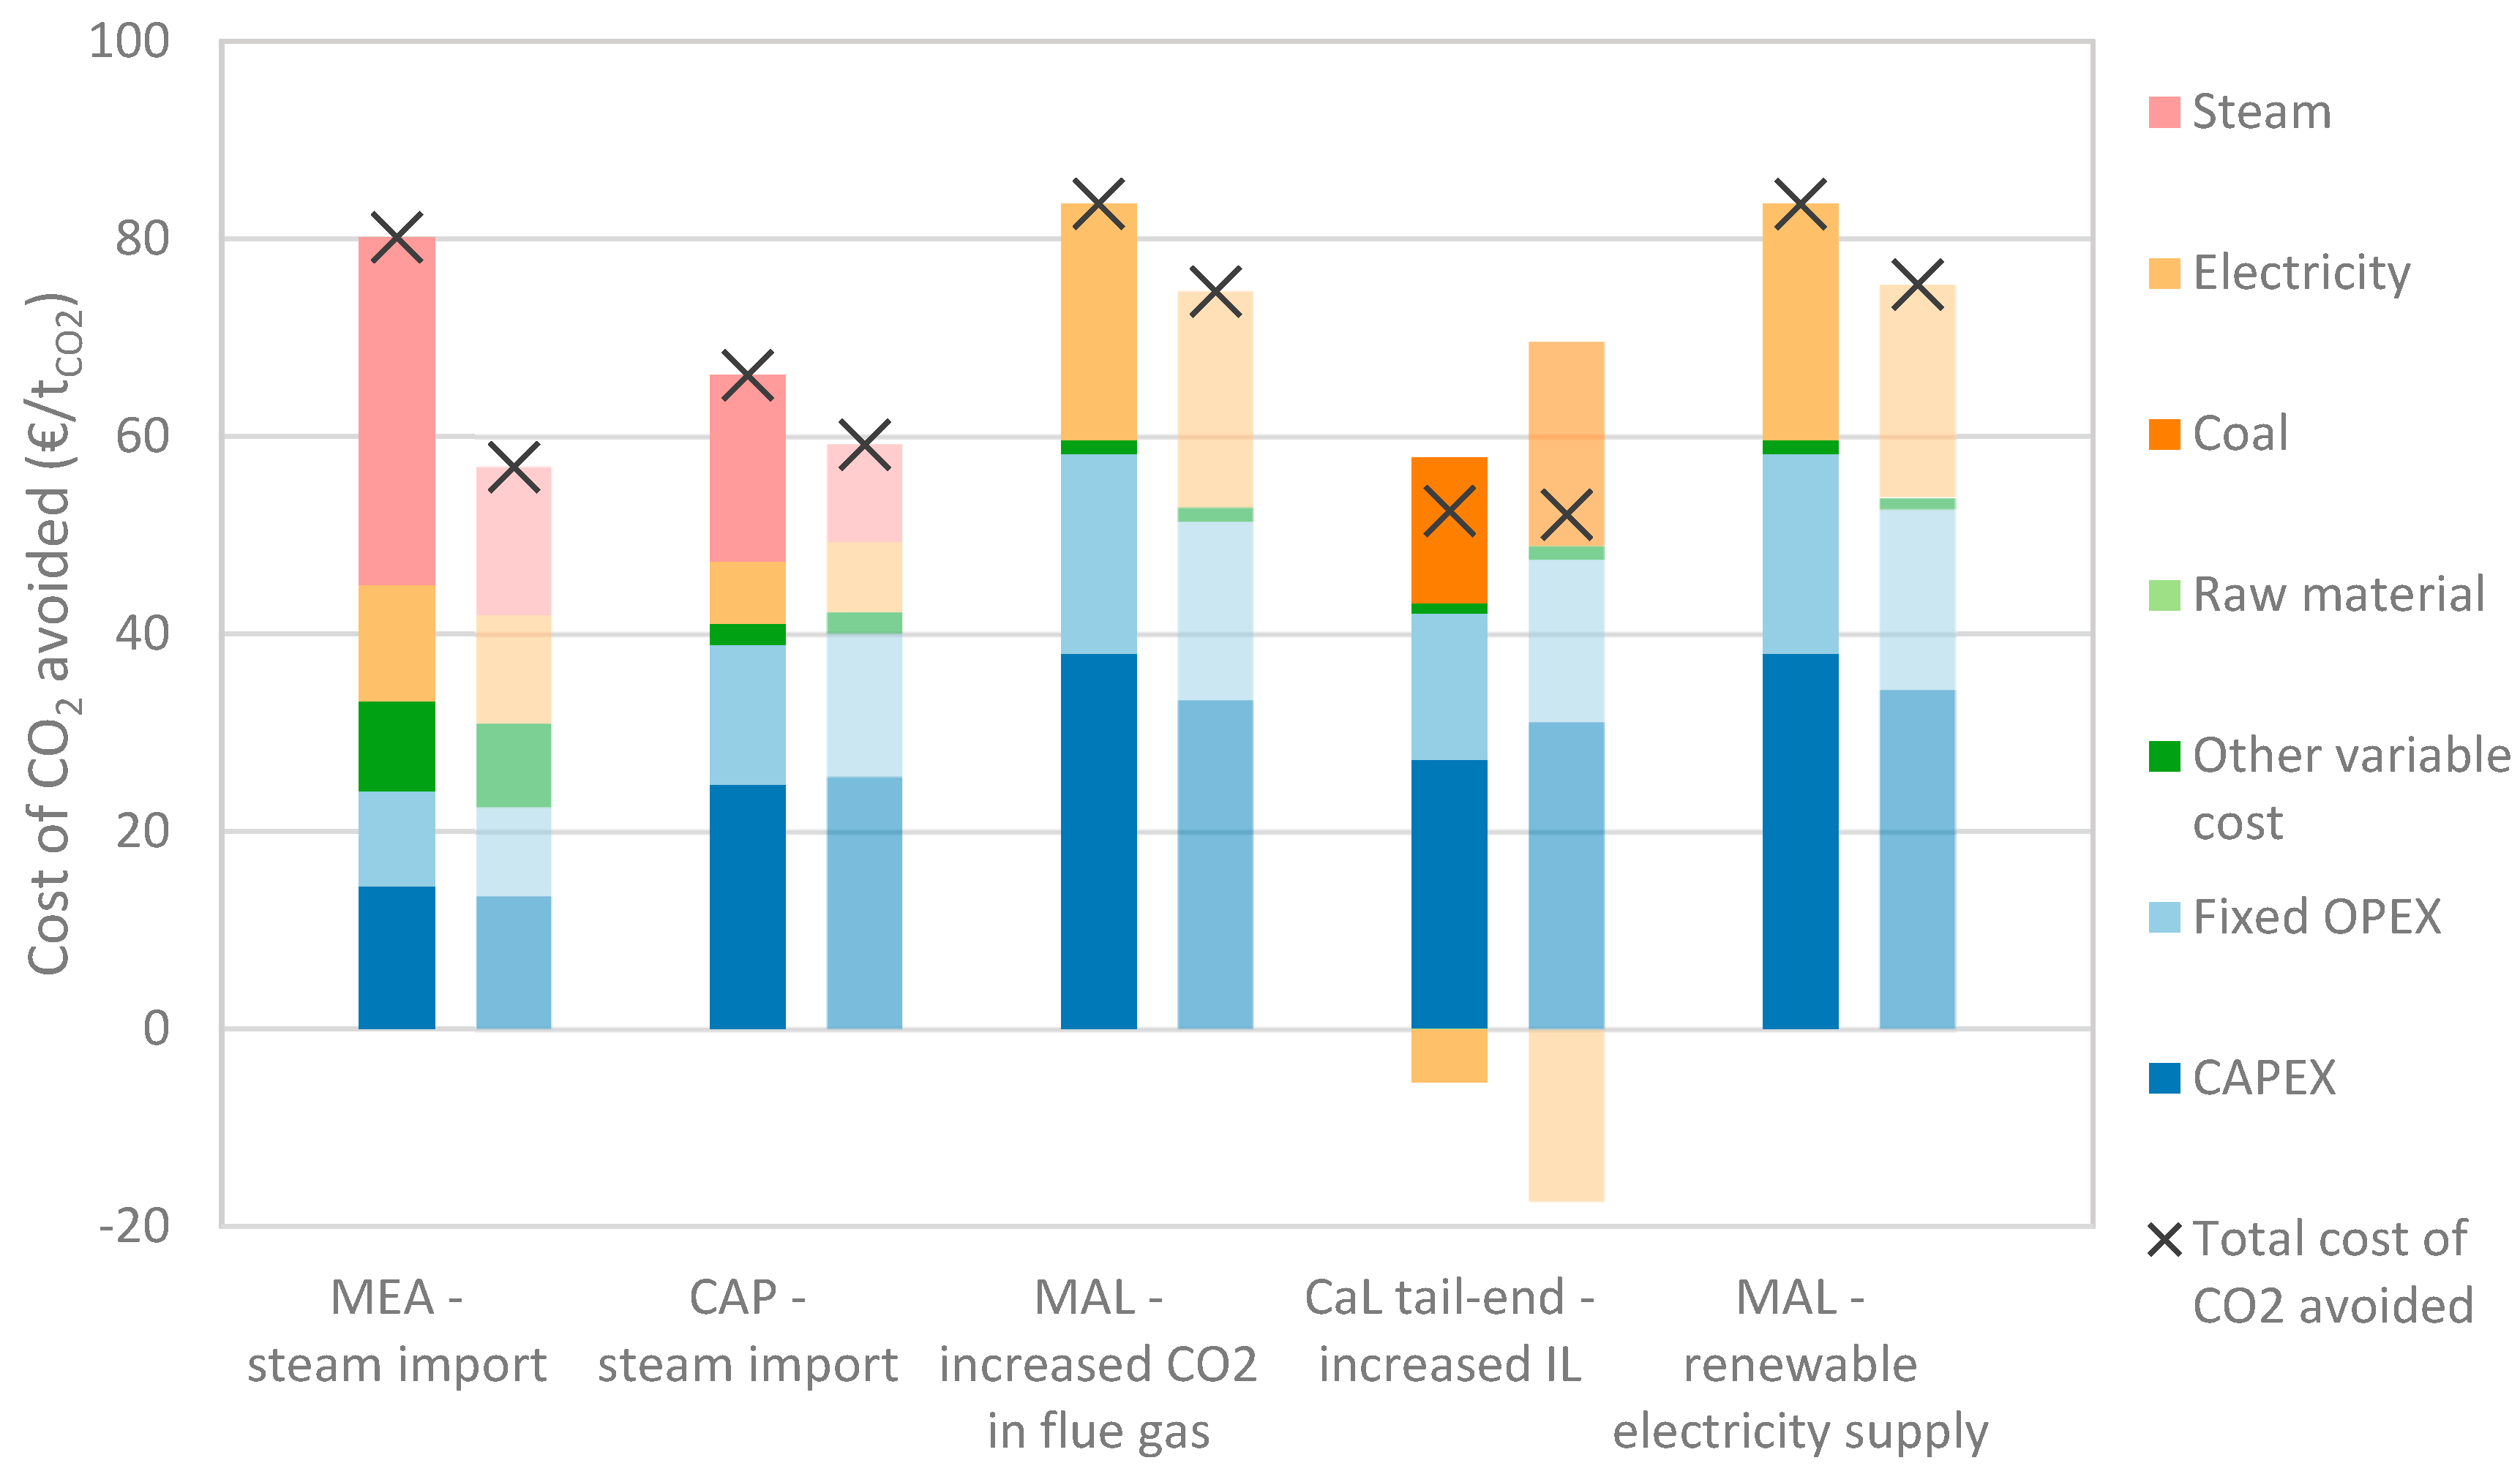
39]. The cost of CO2 avoided for the highlighted scenarios are presented in Figure 7 together with the cost of CO2 avoided calculated for the baseline scenario for comparison (presented previously in Figure 5).
For certain cement plants, it might be possible to import steam from an external coal-fired combined heat and power plant, instead of on-site generation from natural gas, to supply the MEA and CAP technologies. By doing so, the cost of steam could be reduced substantially [15] and consequently the cost of CO2 avoided, as illustrated in the sensitivity analysis in Figure 6. Furthermore, depending on the power plant efficiency, the equivalent CO2 avoided could be increased, leading to a further reduction of the specific cost of CO2 avoided. The cost of CO2 avoided for MEA and CAP when importing steam from a coal-fired CHP at a roughly 50% reduced cost and with around 20% lower CO2 emissions per MWhth compared to steam from NG boiler [15] is shown in Figure 7. This results in 20% reduction in CO2 avoided cost for MEA and 10% for CAP. The lower cost reduction for CAP compared with MEA is explained by CAPs significantly lower steam requirement. However, it should be mentioned that fewer than 10% of the existing cement plants in Europe are in close proximity to CHP plants.
An increased CO2 content in the flue gas, which could be possible in a cement plant with e.g., increased maintenance to reduce air leak in the clinker burning line, was shown to benefit the CO2 capture performance, and in particular the MAL technology. An increase in flue gas CO2 content from the baseline scenario with an average of 20 mol% to a scenario with 22 mol% improves the process performance. In particular, the electricity requirement is reduced and the more efficient process results in reduced design capacity for most of the process equipment. As a result, the cost of CO2 avoided is about 10% lower for the higher flue gas CO2 content, 74.7 compared to 83.5 €/tCO2 for the lower CO2 content, as shown in Figure 7. Under these conditions, the MAL technology was found to outperform the reference technology MEA, which is not as strongly affected by the applied increase in CO2 content of the flue gas (the cost of CO2 avoided for MEA was found to decrease with <1%).
In the CaL tail-end configuration, the solid CaO-rich purge from the capture process is added to the raw meal in the cement kiln. The amount of Ca fed to the cement kiln from the sorbent purge to the total amount of Ca fed to the kiln is defined as the integration level (IL) between the tail-end calcium looping system and the kiln. The process presented in this paper has an IL of 50%. Designing for a lower IL will result in a larger potential for power generation from waste heat and could result in the cement plant being a net electricity producer with revenues for electricity export. The cost of CO2 avoided for the Cal tail-end configuration when designed for 20% IL is shown in Figure 7. With this design, the CaL system requires significantly more fuel compared with the 50% IL design, but is also a net producer of electricity. This could be an important feature for a plant located in a region with high electricity prices and/or where the produced electricity substitutes generation with significantly higher specific CO2 emissions. However, under the conditions applied in the cost analysis a similar balancing effect between the fuel consumption and electricity generation is seen in both designs and the cost of CO2 avoided is calculated to be about the same, 52 €/tCO2.
The characteristics of the power generation system in terms of efficiency and specific CO2 emissions will depend on the geographical location of the cement plant and have an impact of the cost of CO2 avoided, especially for electricity intensive technologies such as the MAL technology. The cost of CO2 avoided for the MAL technology when electricity is generated solely from renewables, and with the same selling price is shown in Figure 7. The resulting CO2 avoidance cost of 75.4 €/tCO2 is around 10% lower than calculated for the baseline scenario.
The investigation of alternative scenarios for CO2 capture illustrates that the selection of a capture technology will depend strongly on plant-specific and local area characteristics, such as flue gas composition, vicinity to a potential steam exporter and electricity market conditions.

5. Conclusions

This paper presents a comparative cost assessment of CO2 capture processes applied to a cement plant: MEA-based absorption as reference technology, chilled ammonia process, membrane-assisted CO2 liquefaction, oxyfuel technology and calcium looping in a tail-end and an integrated configuration. Cost of clinker and cost of CO2 avoided have been calculated based on detailed process simulations with input from experimental work and compilation of detailed equipment lists for each of the CO2 capture technologies.
The cost analysis shows that the cost of clinker for the chilled ammonia and the calcium looping technologies is in the range of 105–110 €/tclk, which is on the same level as the reference technology MEA. The oxyfuel technology has the lowest cost of clinker, 93 €/tclk, and the membrane-assisted CO2 liquefaction has the highest cost of clinker of 120 €/tclk. Overall, the cost of clinker is shown to increase with 49–92% when CO2 capture is retrofitted to the cement plant. The cost of CO2 avoided lies between 42 €/tCO2 (oxyfuel process), which is approximately halved compared to MEA, and 84 €/tCO2 (membrane-assisted CO2 liquefaction), which is on the same level as MEA.
The calculation of the economic KPIs relies on a number of assumptions related to important cost parameters which are dependent on location and time, such as cost of steam, electricity price and carbon tax. A sensitivity analysis showed the importance of such variables on the cost performance of the technologies. Further, the evaluation presented here is performed for application to a BAT reference cement kiln with steam generation primarily from natural gas. It should be noted that cement plants in general vary significantly from each other, for instance when it comes to CO2 concentration in the flue gas, availability of waste heat or possibilities for importing steam from an external producer. The variability in these conditions was shown to have a strong impact on the economic performance of the CO2 capture technologies, which indicates that the best CO2 capture option in one cement plant might not be the best in another.
Part 1 of this paper series also showed that the characteristics of the power generation system, and the steam generation strategy, in terms of efficiency and specific CO2 emissions, have a strong impact on the specific primary energy consumption and the equivalent CO2 avoided. Furthermore, it was emphasized that several other aspects are important for evaluation and practical implementation of retrofitting technologies for CO2 capture in a cement plant, such as technology maturity, integration with the clinker burning process and possible effects on product quality (and therefore risk), space requirement and the need for utilities, such as electric power or natural gas. It was found that the post-combustion technologies, MEA, chilled ammonia, membrane-assisted CO2 liquefaction and calcium looping tail-end configuration are easier to retrofit than the more integrated technologies, oxyfuel and calcium looping integrated configuration.
The technologies investigated within CEMCAP are fundamentally different from each other and provide a portfolio of technologies with different properties, suitable for application in a wide variety of conditions in cement plants. No single technology has been found to stand out as a clear winner-each has its strengths and weaknesses. For the final selection of a CO2 capture, a plant-specific techno-economic evaluation should be performed. In addition, plant-specific evaluation of more practical properties such as available space, capacity in local power grid and options for steam supply should also be carried out.

Supplementary Materials

The following are available online at https://www.mdpi.com/1996-1073/12/3/542/s1, Tables S1–S15: Equipment lists for CO2 capture technologies.

Author Contributions

S.O.G. calculated the economic key performance indicators, and together with S.R. performed cost estimates for the MEA, MAL and oxyfuel technologies; E.D.L. and M.R. performed cost estimates, sizing and compilation of equipment lists for the CaL technologies; S.O.G., E.D.L., M.R., S.R. and M.V. contributed to defining the methodology, assembling cost data for non-standard process equipment and to the overall cost analysis; J.-F.P.-C., D.S., M.G. and M.M. contributed to sizing of equipment and compiling equipment lists for the CAP technology; D.B. contributed to sizing of equipment and compiling equipment lists for the MAL technology; C.F. contributed to sizing of equipment and compiling equipment lists for the MEA technology; R.A. contributed to sizing of equipment and compiling equipment lists for the oxyfuel technology; G.C. contributed to assembling cost data for non-standard process equipment and compiling equipment lists for the oxyfuel and CaL technologies; All authors contributed to reviewing and editing of the paper and this was coordinated by S.O.G. and M.V. S.O.G. wrote the paper.

Funding

This project has received funding from the European Union´s Horizon 2020 Research and Innovation Programme under Grant Agreement No. 641185, and the Swiss State Secretariat for Education, Research and Innovation (SERI) under contract number 15.0160.

Acknowledgments

The authors wish to thank Mr. Olaf Stallmann of Baker Hughes, a GE company for his contribution in direct cost estimation of the chilled ammonia process. Furthermore, the authors wish to thank Armin Jamali (VDZ), Helmut Hoppe (VDZ) and Kristin Jordal (SINTEF Energy Research) for their essential contribution to the technical analysis presented in Part 1 of this paper series.

Conflicts of Interest

The authors declare no conflict of interest.

Abbreviations

AACEAmerican Association of Cost Engineers
BATBest-Available Technologies
BHGEBaker Hughes, a GE company
CACcost of CO2 avoided
CaLcalcium looping
CAPchilled ammonia process
CAPEXcapital costs
CHPcombined heat and power
COCcost of clinker
CPUCO2 purification unit
CCScarbon capture and storage
ECequipment cost
ECRAEuropean Cement Research Academy
FEEDfront-end engineering design
ICinstallation cost
KPIkey performance indicator
MALmembrane-assisted CO2 liquefaction
MEAmonoethanolamine
OPEXoperating costs
ORCorganic rankine cycle
SNCRselective non-catalytic reduction
TDCtotal direct cost
TECtotal equipment cost
TPCtotal plant cost

References

  1. IEA; CSI. Technology Roadmap—Low-Carbon Transition in the Cement Industry. 2018. Available online: https://www.iea.org/publications/freepublications/publication/TechnologyRoadmapLowCarbonTransitionintheCementIndustry.pdf (accessed on 8 January 2019).
  2. Garcia Moretz-Sohn Monteiro, J.; Goetheer, E.; Schols, E.; van Os, P.; Pérez-Calvo, J.F.; Hoppe, H.; Subrahmaniam Bharadwaj, H.; Roussanaly, S.; Khakharia, P.; Feenstra, M.; et al. Post-Capture CO2 Management: Options for the Cement Industry (D5.1). 2018. Available online: https://www.sintef.no/globalassets/project/cemcap/presentasjoner/d5.1-final_rev1.pdf (accessed on 8 January 2019).
  3. ECRA. CCS—Carbon Capture and Storage. Available online: https://ecra-online.org/research/ccs/ (accessed on 8 January 2019).
  4. Bjerge, L.M.; Brevik, P. CO2 capture in the cement industry, Norcem CO2 capture project (Norway). Energy Procedia 2014, 63, 6455–6463. [Google Scholar] [CrossRef]
  5. Knudsen, J.N.; Bade, O.M.; Askestad, I.; Gorset, O.; Mejdell, T. Pilot plant demonstration of CO2 capture from cement plant with advanced amine technology. Energy Procedia 2014, 63, 6464–6475. [Google Scholar] [CrossRef]
  6. Nelson, T.O.; Coleman, L.J.I.; Mobley, P.; Kataria, A.; Tanthana, J.; Lesemann, M.; Bjerge, L.M. Solid sorbent CO2 capture technology evaluation and demonstration at Norcem’s cement plant in Brevik, Norway. Energy Procedia 2014, 63, 6504–6516. [Google Scholar] [CrossRef]
  7. Hägg, M.B.; Lindbråthen, A.; He, X.; Nodeland, S.G.; Cantero, T. Pilot Demonstration-reporting on CO2 Capture from a Cement Plant Using Hollow Fiber Process. Energy Procedia 2017, 114, 6150–6165. [Google Scholar] [CrossRef]
  8. Gassnova. CCS in Norway Entering a New Phase. 2018. Available online: https://www.gassnova.no/en/ccs-in-norway-entering-a-new-phase (accessed on 8 January 2019).
  9. Liang, X.; Li, J. Assessing the value of retrofitting cement plants for carbon capture: A case study of a cement plant in Guangdong, China. Energy Convers. Manag. 2012, 64, 454–465. [Google Scholar] [CrossRef]
  10. IEAGHG. Deployment of CCS in the Cement Industry; 2013/19. 2013. Available online: https://ieaghg.org/docs/General_Docs/Reports/2013-19.pdf (accessed on 8 January 2019).
  11. Ozcan, D.C. Techno-Economic Study for the Calcium Looping Process for CO2 Capture from Cement and Biomass Power Plants. Ph.D. Thesis, University of Edinburgh, Edinburgh, UK, 2014. [Google Scholar]
  12. National Energy Technology Laboratory (NETL). Cost of Capturing CO2 from Industrial Sources; DOE/NETL-2013/1602. 2014. Available online: https://www.netl.doe.gov/research/energy-analysis/search-publications/vuedetails?id=1836 (accessed on 20 November 2018).
  13. Jakobsen, J.; Roussanaly, S.; Anantharaman, R. A techno-economic case study of CO2 capture, transport and storage chain from a cement plant in Norway. J. Clean. Prod. 2017, 144, 523–539. [Google Scholar] [CrossRef]
  14. Gerbelová, H.; van der Spek, M.; Schakel, W. Feasibility Assessment of CO2 Capture Retrofitted to an Existing Cement Plant: Post-combustion vs. Oxy-fuel Combustion Technology. Energy Procedia 2017, 114, 6141–6149. [Google Scholar] [CrossRef]
  15. Roussanaly, S.; Fu, C.; Voldsund, M.; Anantharaman, R.; Spinelli, M.; Romano, M. Techno-economic Analysis of MEA CO2 Capture from a Cement Kiln—Impact of Steam Supply Scenario. Energy Procedia 2017, 114, 6229–6239. [Google Scholar] [CrossRef]
  16. Rodríguez, N.; Murillo, R.; Abanades, J.C. CO2 Capture from Cement Plants Using Oxyfired Precalcination and/or Calcium Looping. Environ. Sci. Technol. 2012, 46, 2460–2466. [Google Scholar] [CrossRef]
  17. Diego, M.E.; Arias, B.; Abanades, J.C. Analysis of a double calcium loop process configuration for CO2 capture in cement plants. J. Clean. Prod. 2016, 117, 110–121. [Google Scholar] [CrossRef]
  18. Lindqvist, K.; Roussanaly, S.; Anantharaman, R. Multi-stage Membrane Processes for CO2 Capture from Cement Industry. Energy Procedia 2014, 63, 6476–6483. [Google Scholar] [CrossRef]
  19. Voldsund, M.; Anantharaman, R.; Berstad, D.; Cinti, G.; De Lena, E.; Gatti, M.; Gazzani, M.; Hoppe, H.; Martínez, I.; Monteiro, J.G.M.-S.; et al. 2018 CEMCAP Framework for Comparative Techno-Economic Analysis of CO2 Capture from Cement Plants (D3.2). Available online: https://www.zenodo.org/record/1257112#.W8hidapPpaR (accessed on 8 January 2019). [CrossRef]
  20. Jordal, K.; Voldsund, M.; Størset, S.; Fleiger, K.; Ruppert, J.; Spörl, R.; Hornberger, M.; Cinti, G. CEMCAP—Making CO2 Capture Retrofittable to Cement Plants. Energy Procedia 2017, 114, 6175–6180. [Google Scholar] [CrossRef]
  21. Anantharaman, R.; Berstad, D. Membrane and Membrane Assisted Liquefaction Processes for CO2 Capture from Cement Plants. In Proceedings of the 14th International Conference on Greenhouse Gas Control Technologies, Melbourne, Australia, 21–25 October 2018. [Google Scholar]
  22. Carrasco, F.; Grathwohl, S.; Maier, J.; Ruppert, J.; Scheffknecht, G. Experimental investigations of oxyfuel burner for cement production application. Fuel 2019, 236, 608–614. [Google Scholar] [CrossRef]
  23. Jamali, A.; Fleiger, K.; Ruppert, J.; Hoenig, V.; Anantharaman, R. Optimised Operation of an Oxyfuel Cement Plant (D6.1). 2018. Available online: https://www.sintef.no/globalassets/project/cemcap/presentasjoner/d6.1-final_rev_1.pdf (accessed on 8 January 2019).
  24. Trædal, S.; Berstad, D. Experimental Investigation of CO2 Liquefaction for CO2 Capture from Cement Plants (D11.2). 2018. Available online: https://www.sintef.no/globalassets/project/cemcap/2018-11-14-deliverables/d11.2-experimental-co2-liquefaction.pdf (accessed on 8 January 2019).
  25. Pérez-Calvo, J.F.; Sutter, D.; Gazzani, M.; Mazzotti, M. Pilot tests and rate-based modelling of CO2 capture in cement plants using an aqueous ammonia solution. Chem. Eng. Trans. 2018, 69, 145–150. [Google Scholar]
  26. Pérez-Calvo, J.F.; Sutter, D.; Gazzani, M.; Mazzotti, M. Chilled Ammonia Process (CAP) Optimization and Comparison with Pilot Plant Tests (D10.3). 2018. Available online: https://www.sintef.no/globalassets/project/cemcap/2018-11-14-deliverables/d10.3_cap-optimization.pdf (accessed on 8 January 2019).
  27. Alonso, M.; Álvarez Criado, Y.; Fernández, J.R.; Abanades, C. CO2 Carrying Capacities of Cement Raw Meals in Calcium Looping Systems. Energy Fuels 2017, 31, 13955–13962. [Google Scholar] [CrossRef]
  28. Arias, B.; Alonso, M.; Abanades, C. CO2 Capture by Calcium Looping at Relevant Conditions for Cement Plants: Experimental Testing in a 30 kWth Pilot Plant. Ind. Eng. Chem. Res. 2017, 56, 2634–2640. [Google Scholar] [CrossRef]
  29. Turrado, S.; Arias, B.; Fernández, J.R.; Abanades, J.C. Carbonation of Fine CaO Particles in a Drop Tube Reactor. Ind. Eng. Chem. Res. 2018, 57, 13372–13380. [Google Scholar] [CrossRef]
  30. Hornberger, M.; Spörl, R.; Scheffknecht, G. Calcium Looping for CO2 Capture in Cement Plants—Pilot Scale Test. Energy Procedia 2017, 114, 6171–6174. [Google Scholar] [CrossRef]
  31. De Lena, E.; Spinelli, M.; Romano, M.; Gardarsdottir, S.O.; Roussanaly, S.; Voldsund, M. CEMCAP Economic Model Spreadsheet. 2018. Available online: https://zenodo.org/record/1446522 (accessed on 8 January 2019).
  32. Anantharaman, R.; Bolland, O.; Booth, N.; van Dorst, E.; Ekstrom, C.; Fernandes, E.S.; Franco, F.; Macchi, E.; Manzolini, G.; Nikolic, D.; et al. European Best Practise Guidelines for Assesment of CO2 Capture Technologies. D1.4.3 in DECARBit Project. 2011. Available online: https://www.sintef.no/globalassets/project/decarbit/d-1-4-3_euro_bp_guid_for_ass_co2_cap_tech_280211.pdf (accessed on 8 January 2019).
  33. Cinti, G.; Anantharaman, R.; De Lena, E.; Fu, C.; Gardarsdottir, S.O.; Hoppe, H.; Jamali, A.; Romano, M.; Roussanaly, S.; Spinelli, M.; et al. Cost of Critical Components in CO2 Capture Processes (D4.4). 2018. Available online: https://www.sintef.no/globalassets/project/cemcap/2018-11-14-deliverables/d4.4-cost-of-critical-components-in-co2-capture-processes.pdf (accessed on 8 January 2019).
  34. NETL. Quality Guidelines for Energy System Studies: Cost Estimation Methodology for NETL Assessments of Power Plant Performance. 2011. Available online: https://www.netl.doe.gov/File%20Library/research/energy%20analysis/publications/QGESSNETLCostEstMethod.pdf (accessed on 20 November 2018).
  35. Deng, H.; Roussanaly, S.; Skaugen, G. Techno-economic analyses of CO2 liquefaction: Impact of product pressure and impurities. Int. J. Refrig. 2018. submitted for publication. [Google Scholar]
  36. Roussanaly, S. Calculating CO2 avoidance costs of carbon capture and storage from industry. Carbon Manag. 2018. [Google Scholar] [CrossRef]
  37. De Lena, E.; Spinelli, M.; Gatti, M.; Scaccabarozzi, S.; Consonni, S.; Cinti, G.; Romano, M. Techno-economic analysis of Calclium Looping processes for low CO2 emission cement plants. Int. J. Greenh. Gas Control 2019, 82, 244–260. [Google Scholar] [CrossRef]
  38. IEAGHG. Cost of CO2 Capture in the Industrial Sector: Cement and Iron and Steel Industries. 2018-TR03. 2018. Available online: http://documents.ieaghg.org/index.php/s/YKm6B7zikUpPgGA?path=%2F2018%2FTechnical%20Reviews (accessed on 8 January 2019).
  39. Voldsund, M.; Anantharaman, R.; Berstad, D.; De Lena, E.; Fu, C.; Gardarsdottir, S.O.; Jamali, A.; Pérez-Calvo, J.F.; Romano, M.; Roussanaly, S.; et al. CEMCAP Comparative Techno-Economic Analysis of CO2 Capture in Cement Plants (D4.6). 2018. Available online: https://www.sintef.no/globalassets/project/cemcap/2018-11-14-deliverables/d4.6-cemcap-comparative-techno-economic-analysis-of-co2-capture-in-cement-plants.pdf (accessed on 8 January 2019).
Figure 1. The clinker burning line of the CEMCAP reference cement plant.
Energies 12 00542 g001
Figure 2. Schematic overview over investigated technologies (pink) and their integration into the reference kiln (white). (a) Reference technology: MEA; (b) Oxyfuel; (c) Chilled ammonia process; (d) Membrane-assisted CO2 liquefaction; (e) Calcium looping-tail-end; (f) Calcium looping integrated.
Energies 12 00542 g002
Figure 3. Break-down of cost elements in the bottom-up approach for estimation of total plant costs [35].
Energies 12 00542 g003
Figure 4. Break-down of cost of clinker for the reference cement plant and all the investigated CO2 capture technologies.
Energies 12 00542 g004
Figure 5. Break-down of cost of CO2 avoided for all the investigated CO2 capture technologies.
Energies 12 00542 g005
Figure 6. Sensitivity of the cost of CO2 avoided to the (a) coal price, (b) cost of steam, (c) cost of electricity and (d) a change in CAPEX, and (e) sensitivity of the cost of clinker to a carbon tax.
Energies 12 00542 g006aEnergies 12 00542 g006b
Figure 7. Cost of CO2 avoided for alternative scenarios for CO2 capture. The left-hand column shows the cost of CO2 avoided calculated for the baseline scenario while the right-hand column shows the cost for the following technology-specific scenarios: MEA-steam import; CAP-steam import; MAL-increased CO2 content in flue gases; CaL tail-end-reduced integration level.
Energies 12 00542 g007
Table 1. Utilities and consumables for the reference cement plant without CO2 capture.
Utility and ConsumableValue
Clinker production (t/h)120.65
Coal (t/h)13.93
Electric power (MW)15.88
Ammonia solution for NOx reduction (t/h)0.60
Table 2. Utilities, consumables and CO2 avoided for the cement plant with CO2 capture.
MEAOxyfuelCAPMALCaL-Tail-EndCaL-Integrated
Clinker production (t/h)120.7125.0120.7120.7117.7117.4
Coal (t/h)13.914.513.913.930.823.5
Electric power (MW)29.535.124.250.06.820.4
Steam from waste heat (MW)3.7-4.7---
Steam from NG boiler (MW)92.7-56.1---
Cooling water make-up (t/h)208.2104.5185.785.3256.3263.5
MEA make-up (t/h)0.1-----
Process water make-up (t/h)46.0-1.1---
NaOH solution for DeSOx (t/h)0.1--0.1--
Ammonia solution for SNCR (t/h)0.60.60.60.60.60.6
Ammonia solvent make-up (t/h)--0.2---
Sulfuric acid for ammonia recovery (t/h)--0.1---
Membrane material replacement (m2/year)---50,160--
Equivalent specific CO2 avoided (kgCO2/tclk)559719640687806797
Table 3. Process contingency factors for core CO2 capture technologies and miscellaneous subsystems.
TechnologyProcess Contingency—Maturity (% of TDC’)Process Contingency—Detail Level of Equipment List (% of TDC’)
MEA153
Oxyfuel3012
CAP200
MAL4012
CaL tail-end2012
CaL integrated6012
ASU50
Cooling systems50
Refrigeration systems5Same as CO2 capture technology
CO2 purification units20Same as CO2 capture technology
Table 4. Unit cost of materials and utilities used in the cost analysis.
Variable OPEX ItemUnit Cost
Raw meal price (€/tclk)5
Coal price (€/GJLHV)3
Natural gas price (€/GJLHV)6
Price of electricity (€/MWh)58.1
Cost of the steam produced from a natural gas boiler (€/MWh)25.3
Cost of the steam produced from the cement plant waste heat (€/MWh)8.5
Cooling water cost (€/m3)0.39
Process water cost (€/m3)6.65
Ammonia solution price for NOx removal (€/t)130
MEA solvent (€/t)1450
Ammonia solvent (€/t)406
Sulfuric acid (€/t)46
Sodium hydroxide for flue gas desulfurization (€/t)370
Membrane material replacement (€/m2)7.87
Miscellaneous variable O&M (€/tclk)1.1
Table 5. Economic boundaries and financial parameters used in calculating economic KPIs.
Capacity factor (%)91.3
Economic life (years)25
Construction time, cement plant (years)2
Allocation of cement plant construction costs by year (%)50/50
Construction time—CO2 capture (years)3
Allocation of CO2 capture construction costs by year 1 (%)40/30/30
Discount rate (%)8
1 For certain CO2 capture technologies, like the oxyfuel and integrated CaL technologies, a significant downtime might be required to modify the existing cement plant for deep integration with the CO2 capture plant. Although this could impact the cost performance of these technologies, this is not considered here due to the lack of publicly available knowledge and highly site-specific nature of this issue.
Table 6. Summary of total plant costs and economic KPIs for the reference cement plant and the CO2 capture technologies.
Ref. Cement PlantMEAOxyfuelCAPMALCaL-Tail-EndCaL-Integrated
TPC, cement plant + CO2 capture plant (M€)204280332353450406424
TPC, CO2 capture plant (M€)-76128149247202220
Annual OPEX (M€)41765866715961
Cost of clinker (€/tclk) 62.6107.493.0104.9120.0105.8110.3
Cost of CO2 avoided (€/tCO2)N/A80.242.466.283.552.458.6

