Characterization of a Practical-Based Ohmic Series Resistance Model under Life-Cycle Changes for a Lithium-Ion Battery


1
Department of Electrical Engineering, Rajamangala University of Technology Thanyaburi, 39 Klongluang, Patumthani 12110, Thailand
2
Department of Electrical Engineering, Faculty of Engineering, Kasetsart University, 50 Chatuchak, Bangkok 10900, Thailand
*
Authors to whom correspondence should be addressed.
Energies 2019, 12(20), 3888; https://doi.org/10.3390/en12203888
Submission received: 31 August 2019
/
Revised: 7 October 2019
/
Accepted: 9 October 2019
/
Published: 14 October 2019
(This article belongs to the Special Issue Smart Power & Internet Energy Systems)
Abstract
:Understanding battery characteristic behaviors is indispensable in designing and managing large-scale battery-based energy storage systems in high-power applications. This paper presents a practical-based characterization method to model the ohmic series resistance of lithium-ion batteries under life-cycle consideration. Aging cells were prepared in a controlled environment, and the testing information was automatically characterized using a developed computer-based battery test system. An experimental methodology based on the cycling of pulse tests is applied for modeling the ohmic series resistance. Several aspects of the testing parameters during the cycling operations, such as the characteristic changes of the ohmic series resistance, amplitudes of the periodic test current, cell capacity, state of charge, and the rate of change of the resistance increment, are also investigated and analyzed so as to fulfill the resistance model. The accuracy of the proposed model is verified by comparing the testing information, showing a satisfactory result.
1. Introduction
Nowadays, lithium-ion batteries (LIBs) are promising energy storage devices being used in many applications, such as portable devices, personal electric vehicles, public transportation, and renewable energy storage and grid supporting systems. In high-power and high-voltage applications with smart grid technologies, a battery-based energy storage system (BESS) is an important part to maintain the grid stability and flexibility of the system. Large-scale BESSs require an accurate battery management system (BMS) for controlling large batteries safely. Hence, studying the battery behavior from an efficient electrical equivalent circuit model (EECM) is a key to obtain the most significant performance from those batteries. The EECMs for the BESS can be widely classified and sorted, in order from simple to complicated structures, as follows: the internal resistance model, one-time constant model, and two-time constant model [1]. There are two main categories of techniques used to gain the EECM parameters, depending on the purpose of usage. One is the direct current (DC) pulse test, which is generally used for the simple parameter identification of LIBs. The other is an electrochemical impedance spectroscopy (EIS), which is a complicated alternating current (AC) impedance-based measurement in the frequency domain [2,3]. Rahimi-Eichi et al. [4] applied a piecewise linear approximation technique and the DC pulse method with a one-time constant EECM to estimate the online parameters and state of charge (SOC) of the LIB. Rahmoun et al. [5] demonstrated the methodology to determine the battery SOC and parameter characterization based on an extended Kalman filter (EKF) with the different types of equivalent circuit model, by considering the parameters to be estimated in a subinterval of time, while Zhang et al. [6] used a single cell EECM based on a two-time constant model implemented with the model of self-discharge and available capacity to be a multi-cell model for studying the discharge behaviors. The benefits of the EECM for the battery parameter estimation are not only limited to LIBs, they can also be applied to other types of the battery. Chen et al. [7] introduced an accurate methodology based on predicting the runtime and current–voltage performance electrical modeling, validated with the experimental data of the nickel–metal hydride (NiMH) and lithium polymer batteries that are currently popularly used for various kinds of LIB. Even in the lithium titanate oxide (LTO) batteries that are used in modern electric vehicles and electric-grid BESSs, Stroe et al. [8] succeeded in applying a two-time constant EECM with an extended characterization procedure, which used both of the DC pulse test and the EIS method to estimate the LTO parameters and to model the performance behaviors of the battery. A new technique of parameter estimation was proposed by Guo et al. [9]; the second order RC equivalent circuit-based EECM was used as a circuit model to estimate the SOC using the least square method and adaptive unscented Kalman filter (AUKF), showing a high precision and convergence of the initial error for a new cell of LIBs. However, those research methods only focus on the battery modeling at the initial state of the cell life, without considering the aging or health conditions of the battery. A prediction of the lifetime and state of health (SOH) of the batteries can be implied from the life cycles. In order to develop a precise BMS for the large-scale BESSs, the variety of algorithms to control the aging batteries, and understanding the battery behaviors for life-cycles are especially needed. One essential part of the EECM is the accurate value of the ohmic series resistance (OSR), because this parameter can lead to battery lifetime determination.
In this paper, we propose the modeling of OSR extracted by the developed battery test system, based on the experiments of the DC pulse tests, in order to investigate the cell at the beginning of life and the resistance rise after performing the cycle tests. The testing cell used in this paper is a rechargeable lithium manganese oxide battery (LMO), which has dominant features and is widely used in electric vehicles and in many energy storage applications. This cell type has one of the highest voltage per cell, and a durability of overcharge/discharge with a high thermal stability because of the stability of its spinel-crystal structure [10,11]. Details of the cell specification will be shown in Section 3.
The aim of this paper is to propose methodology for modeling the OSR characteristic, considering the life cycle changes, to understand and estimate the nonlinear behaviors of the LIB during long cycling operation, and to prepare essential knowledge for engineers who develop model-based algorithms for BMS implementation. The remainder of this paper is structured as follows: Section 2 introduces an electrical equivalent circuit model of the LIB with life-cycle consideration, and gives a brief overview of the OSR determination. Section 3 describes a developed battery test system with sequential control algorithms and the procedure of OSR characterization. Section 4 proposes a methodology for modeling the OSR under life-cycle changes. The OSR model is verified and discussed in Section 5. Finally, conclusions are given in Section 6.
2. Equivalent Circuit Modeling of LIBs and OSR Extraction
The EECM has different structures, depending on the application point of view, the scope of the study, the accuracy of the model, and various types of battery chemistry [12,13,14,15]. The EECM generally comprises of three main parts, as follows: (1) an equivalent voltage source called open circuit voltage (OCV), which has a nonlinear potential characteristic, depending on the property of electrode materials and the SOC of the battery; (2) a bulk equivalent resistance called an ohmic series resistance (OSR), representing the resistance of the electrodes, an electrolyte, separator, and connecting wires inside the battery, which mainly affects the changes of the resistance values in the battery; and (3) a pair of equivalent RC-transient elements, which reflects the resistances during the process of charge transfer and charge diffusion (R1 and R2, respectively), and the capacitances of the double-layer structure and diffusion process of the battery (C1 and C2, respectively). For the scope of this study, the model of the OSR will only be investigated in the case of life-cycle changes. However, the details of the OCVs and RC-transient elements have also been introduced in previous works [16,17].
In this paper, a combination of the EECM with the OSRs and additional resistances due to life-cycle changes for the LIB is proposed, as shown in the dot–line block of Figure 1. The OSR under life-cycle effects (OSRcy) comprises of OSRs at the beginning of the cell life for the charge and discharge (OSR0_chg and OSR0_dis, respectively), and life cycle resistances for the charge and discharge (Rcy_chg and Rcy_dis, respectively). The OSR characteristic of the LIB can be derived from the DC pulse experiments, based on the galvanostatic intermittent titration technique, which was used to characterize the kinetic parameters of the chemical batteries [18].
The OSR is determined by the ratio of the measuring voltage and current, based on Ohm’s law, during the immediate step changes of the respective pulse tests, without the effects of transient elements [19]. The OSRs are usually indicated in a function of the SOC between 0% and 100%, separately, for the charge and discharge. The OSR can be calculated as shown in Equation (1), while the SOC is calculated based on the coulomb counting method, as shown in Equation (2).
where OSR is the ohmic series resistance of the cell (mΩ); IB represents the difference of the immediate step change of the battery pulse current measured before and after applying the pulse tests (mA); VOSR represents the difference in immediate measured OSR voltage in the immediate step change of the pulse currents; SOC is the state of charge at the immediate step change of the pulse test (%); SOC0 is the initial SOC before the tests; IB is positive for discharge and negative for charge; T0 and TF are the initial and final time of testing, respectively, that is limited within the operating voltage range of the cell; and QB is a battery capacity (Ah).
Figure 2 illustrates a voltage–current behavior of the LIBs during the DC pulse tests for OSR determination.
In order to determine the OSRs during the charge period, the cell voltage was set at the discharge cut voltage (DCV), then the constant pulse charge current was applied until the cell voltage reached the charge threshold voltage (CTV) of the cell. On the contrary, the determination of OSRs during the discharge period started from setting up the cell voltage at the CTV value, then the constant pulse discharge current was applied until the cell voltage dropped down to the DCV limit of the cell. The ranges of the OCV were between the DCV and CTV values (0% to 100% of SOC) for the charge, and between the CTV and DCV values (100% to 0% of SOC) for the discharge, respectively. The details of the related voltage values of the testing cell will be shown in the next section.
3. Characterization of OSR with the Developed Test System
Before studying the effects of the life-cycles and modeling the OSR, the essential battery test system needs to be developed in order to cope with the variation of testing conditions for the various types of battery. The developed test system for the OSR characterization is shown in Figure 3.
A computer-based control system is used to connect the testing devices via a general purposed interface bus (GPIB) controlled in a LabVIEW environment. A 3500 mAh pouch-cell LMO was used for testing. The cell specification is shown in Table 1.
The testing cell was connected in parallel with a programmable charger, which was used to control the constant pulse of the charging current (CC-mode), between 0 and 3500 mA (1C-rate), and to control a constant charging voltage (CV-mode) at 4.20 V. A programmable discharger was also parallel to the cell in order to control the constant pulse of the discharging current between 0 and 17,500 mA (5C-rate). The OSRs were extracted within the recommended voltage ranges of the cell, from 3.00 V to 4.20 V (0 to 100% of SOC), and from 4.20 V to 3.00 V (100% to 0% of SOC) for the charge and discharge, respectively.
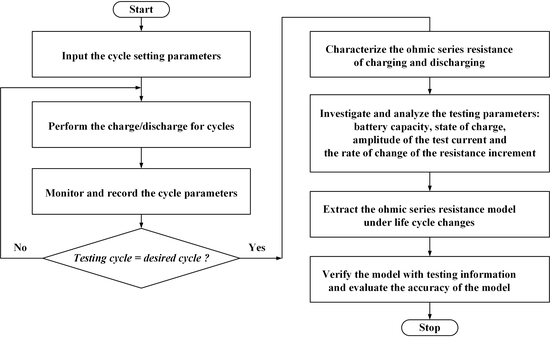
The testing procedures are proposed in Figure 4, for performing the cycle tests and characterizing the OSRs on both the charge and discharge processes. The developed algorithms were designed with the sequential flow to control the cycle tests, charge, and discharge, respectively. In the cycle testing process, the aging cell were prepared with safety at the desired life cycle. The desired cycles were set to 0, 400, 1200, and 2400 cycles, to represent the information of the new cell and the different aging cells. The testing information was recorded with 10 milliseconds per sampling, which was enough to observe the slow response of the electrochemical changes. During the process of the cycle test, a continuous operation mode was automatically selected. The test system was designed to support the immediate transferring of operations between the continuous test and the pulse test. For each pulse test, the step-size of the pulse current was applied for 1% SOC, and rested its equilibrium condition for 60 min. The total length of the current pulse during both charging and discharging was 200 pulses for each test. The step size was shifted until the cell voltage reached its limitation. At each designed cycle, the OSRs were characterized with the DC pulse test technique during the processes of charge and discharge. In addition, the OSR was computed at 0.5 s after applying the current pulse to stabilize the current signal before the calculation.
In this paper, we only limited the condition of the aging tests on the variation of the current rates (C-rates) within the operating range of the cell, in order to create the OSR model. The cell was tested in a chamber, which was maintained at a constant temperature of 20 °C, in order to avoid the effects of temperature changes during the OSR characterization. The characterization results for the OSRs will be discussed in the next section.
4. Modeling of OSR
This section proposes a methodology for modeling the OSR under life-cycle changes. The OSR characteristics of the cell at different testing conditions will be investigated in order to determine the accurate OSR mathematical model.
4.1. OSR Characteristic of the Cell
The OSR of the new cell, and the different values of the aging cell were compared at different desired current rates (C-rates) of C/4, C/2, and 1C under a constant temperature of 20 °C. A comparison of the results of the charge and discharge tests for the new cell and at desired life-cycles of 400, 1200, and 2400 cycles are shown in Figure 5a–d, respectively. The results show that the OSR characteristics of all of the cycles have a similar pattern and no obvious change during the C-rate variation. This means that the operations under different amplitudes of the pulse current have no influence on the pattern of the ohmic series resistance, even in the aging condition. However, the extracted results reveal that the OSR values have a slight difference along the SOCs between 15%–95%, and the OSR value was lifted when the operating cycle increased. The characteristic explanation of the OSR will be discussed later in the next section. The average OSRs along the 15%–95% SOCs of the new cell and at desired life cycles of 400, 1200, and 2400 cycles are 20.570, 20.890, 22.453, and 23.868 mΩ, respectively. From the measurement, the data set of C/4 current rate was used in order to create the OSR model considering the cycle changes.
4.2. OSR Model under Life-Cycle Consideration
The life cycles that affected the OSR can be established with the life-cycle resistance model (Rcy), using the experimental relationship of the resistance changes by comparing the cell at the beginning of life with the desired life cycles of 400, 1200, and 2400 cycles. In order to study only the effect of the life cycles, the effect of temperatures will be ignored. The Rcy model will be examined in the function of the operating cycle and SOC under a constant temperature (20 °C), as shown in Equation (3).
where N is the cycle number of the charge and discharge, and SOC is the state of charge during the tests.
The mathematical model of the life-cycle resistance can be extracted from the experimental relationship between the increasing resistances of the OSR and cycles of the tested cell. The SOCs extracted from the test system, as described in Section 3, are separated into 2%, 5%, 10%, 30%, 50%, 70%, 90%, and 99%, to easily observe the increasing resistances due to cycle changes. The OSR characteristics for the cycles at different SOCs during the charge and discharge are shown in Figure 6a,b, respectively. The figures show that the trend of resistance increases with the increasing cycle number. These trends are slightly different for each SOC. The rate of change of the resistance increment for each SOC can be obtained in terms of the slope of the OSR function, by fitting with a linear approximation using MATLAB, as shown by the dotted lines.
From Figure 6, it can be seen that the rate of change of the resistance increment for each SOC at 30%, 50%, and 70% has a similar slope pattern due to the flat characteristic of the resistance along the 30%–70% range of the SOC, as illustrated in Figure 5. We then assumed the midrange of the SOC (50%), as shown with the black triangle, to be the reference point, in order to observe the variations of the resistance as a result of the cycle changes. In Figure 6, the differences of OSR at the beginning of the cell life and at the end of the tested cycles for 50% SOC are 18.38% and 15.08% during the charge and discharge, respectively. The relationship between the initial OSR and the resistance increases due to the cycle changes are illustrated in Equations (4) and (5), respectively.
where OSRcy is the OSR of the LIB considering the cycle effect (mΩ), OSR0 is the OSR at the beginning of cell life (mΩ), Rcy is the life cycle resistance (mΩ), N is the cycle number of charge and discharge, Z is the exponent of the cycle (Z equals to 1 for the OSR linear relationship), and kcy is the rate of change of the resistance increment due to the life-cycle changes (μΩ·cycle−1).
Table 2 shows the fitting values of the rate of change of the resistance increment (kcy) of each SOC, the OSR at the beginning of cell life (OSR0), and the sum of square of residual errors (SSR) during charge and discharge tests. At a low SOC, the rate of change of the resistance increment is high for both of charge and discharge. The rate has been reduced and slightly changed along the SOC, corresponding to the trend of the OSR characteristic for each cycle. The model equation of the rate of change of the resistance increment, in a function of the SOC with respect to the number of cycles, is proposed in Equation (6).
where kcy is the rate of change of the resistance increment due to the life-cycle changes (μΩ·cycle−1), k1 is a pre-logarithm factor of the cycle effect (cycle·mΩ−1%−1), k2 is a constant factor due to the cycle effect (cycle·mΩ−1), and SOC is a state of charge of the cell (%).
The extracted parameters for charge and discharge can be obtained by fitting with a nonlinear least square estimation technique using MATLAB, as shown in Table 3.
A comparison between the rate of change of the resistance increment due to the life cycles fitted from the experiments and the proposed kcy model, with the extracted parameters in Table 3, is shown in Figure 7. The comparison shows the concordance along the SOCs between the experiment and model, with the sum of square of residual errors (SSR) for charge and discharge of only 7.1380 × 10⁻² mΩ2·cycle and 7.0575 × 10⁻² mΩ2·cycle, respectively.
From Equation (5), the life-cycle resistance model (Rcy) as a function of SOC can be completed by substituting Equation (6) into Equation (5). Therefore, the OSR model considering the cycle effect (OSRcy) by extending the Equation (4) can be obtained in Equation (7).
where OSRcy is the OSR of the LIB considering the cycle effect (mΩ), OSR0 is the OSR at the beginning of cell life (mΩ), N is the cycle number of charge and discharge, Z is the exponent of cycle (Z equals to 1 for the OSR linear relationship), k1 is a pre-logarithm factor of the cycle effect (cycle·mΩ−1%−1), k2 is a constant factor due to the cycle effect (cycle·mΩ−1), and SOC is a state of charge of the cell (%).
5. Model Verification and Discussion
This section shows a verification of the proposed OSR model under the life-cycle consideration. The model in Equation (7) is used for plotting the OSR characteristics. The model only needs the testing information of a new cell in order to observe the life cycle effects of the aging battery. The model is verified with a different set of testing information. The OSR models are calculated based on the new cell information at a 1 C-rate, and compared with the measured data for all of the cycles.
Figure 8 shows a comparison of the OSRs from the measurement and model for charge and discharge along the SOCs at different operating cycles. Figure 9 shows the combined plots of the estimated OSR from the 1C-rate model, with respect to the measured OSR values for all of the cycles of the charge and discharge.
From Figure 9, the black diagonal axis represents a reference trend, where the estimated OSR equals to the measured value. In the combined plot, each swarming of the resistances is classified by the different colors for the different aging cycles. In this plot, it is easy to observe that the ohmic series resistance of the cell is increased with the increasing cycles. The OSR combined plots show the fitting results of the model. The maximum and minimum estimation error of the model for all of the cycles is 5.797% and −4.675%, respectively.
In addition, the characteristic changes of the OSR can be explained by referring to the processes of intercalation and de-intercalation in the LIB, which is the insertion and the extraction of lithium at the spinel electrode during the charge and discharge operations, respectively. For long cycles, the spinel crystal structure of the electrode is distorted during the phase transitions. This distortion can cause stress and electromechanical grinding on the spinel particles. Moreover, the cycleable lithium has been lost over the time of the charge and discharge, by growing a coated solid electrolyte interface on the surface of the negative electrode, that affects a reduction of the intercalation and de-intercalation abilities during the operation. These phenomena are reflected by the increment of the OSR between the electrodes and the fading of capacity in the LIB under the long cycling operation [20,21].
6. Conclusions
In this paper, we focus on the modeling of the ohmic series resistance (OSR) of the lithium-ion battery to understand the resistance characteristic behaviors on the changing of life cycles. The computer-based battery test system was developed to prepare the aging cell, and to characterize the OSRs in a function of the state of charge (SOC) under the desired life cycle. From the study, the increment of cycle-life caused to increase the ohmic series resistance of the cell can be concluded. When compared to the cell at the beginning of life at 50% SOC, the OSRs of the highest testing cycle as 2400 cycles increased by 18.38% and 15.08% during the charge and discharge, respectively. In addition, it was found that the different pulse current rates (C-rates) of the testing have no effect on the pattern of the OSR, even in the aging cells. The methodology for OSR modeling was proposed based on the information on the resistance increment during the cycle changes. The extracted OSR model was compared with the different set of measured values, that show a certified result for all of the different testing cycles. The estimation errors of the model are within ±6% of all testing cycles. The contribution and novelty of this study are the developed algorithms and proposed procedures for OSR modeling that can be applied for any LIBs. However, the developed model should be modified and implemented with the BMS, which will be our next steps in the future. The accurate model can be further used as one of the indexes in the BMSs in order to estimate the state of health and cycling degradation of the battery.
Author Contributions
Conceptualization, N.S. and A.P.; methodology and software development, N.S.; resources, A.P.; data curation, A.P.; formal analysis, N.S.; validation, N.S. and A.P.; writing (review and editing), N.S. and A.P.
Funding
This research received no external funding.
Acknowledgments
The authors would like to thank Rajamangala University of Technology Thanyaburi and Kasetsart University for supporting the research equipment and the dissemination of this work. The authors would also like to thank the anonymous reviewers for providing useful suggestions and valuable comments that resulted in the improved quality of the paper.
Conflicts of Interest
The authors declare no conflict of interest.
References
- Madani, S.S.; Schaltz, E.; Kaer, S.K. A Review of Different Electric Equivalent Circuit Models and Parameter Identification Methods of Lithium-Ion Batteries. ECS Trans. 2018, 87, 23–37. [Google Scholar] [CrossRef]
- Idaho National Laboratory. Battery Test Manual for Plug-In Hybrid Electric Vehicles; INL/EXT-07-12536 Rev.1; U.S. DOE.: Idaho Falls, ID, USA, 2010; pp. 1–56.
- Huanga, J.; Zhanga, J.; Li, Z.; Song, S.; Wu, N. Exploring Differences between Charge and Discharge of LiMn2O4/Li Half-cell with Dynamic Electrochemical Impedance Spectroscopy. Electrochim. Acta 2014, 131, 228–235. [Google Scholar] [CrossRef]
- Rahimi-Eichi, H.; Baronti, F.; Chow, M.Y. Online Adaptive Parameter Identification and State-of-Charge Coestimation for Lithium-Polymer Battery Cells. IEEE Trans. Ind. Electron. 2014, 61, 2053–2061. [Google Scholar] [CrossRef]
- Rahmoun, A.; Biechl, H. Modelling of Li-ion batteries using equivalent circuit diagrams. Electr. Review ISSN 2012, 88, 152–156. [Google Scholar]
- Zhang, J.; Ci, S.; Sharif, H.; Alahmad, M. Modeling Discharge Behavior of Multicell Battery. IEEE Trans. Energy Conv. 2010, 25, 1133–1141. [Google Scholar] [CrossRef]
- Chen, M.; Rincon-Mora, G.A. Accurate electrical battery model capable of predicting runtime and I-V performance. IEEE Trans. Energy Convers. 2006, 21, 504–511. [Google Scholar] [CrossRef]
- Stroe, A.; Swierczynski, M.; Stroe, D.; Teodorescu, R. Performance Model for High-power Lithium Titanate Oxide Batteries based on Extended Characterization Tests. In Proceedings of the 2015 IEEE Energy Conversion Congress and Exposition (ECCE), Montreal, QC, Canada, 20–24 September 2015; pp. 6191–6198. [Google Scholar]
- Guo, X.; Kang, L.; Yao, Y.; Huang, Z.; Li, W. Joint estimation of the electric vehicle power battery state of charge based on the least squares method and the kalman filter algorithm. Energies 2016, 9, 100. [Google Scholar] [CrossRef]
- Kim, D.K.; Muralidharan, P.; Lee, H.W.; Ruffo, R.; Yang, Y.; Chan, C.K.; Peng, H.; Huggins, R.A.; Cui, Y. Spinel LiMn2O4 nanorods as Lithium ion battery cathodes. Nano Lett. 2008, 8, 3948–3952. [Google Scholar] [CrossRef] [PubMed]
- Patil, A.; Patil, V.; Shin, D.W.; Choi, J.W.; Paik, D.S.; Yoon, S.J. Review issue and challenges facing rechargeable thin film Lithium batteries. Mater. Res. 2008, 43, 1913–1942. [Google Scholar]
- Rivera-Barrera, J.P.; Munoz-Galeano, N.; Sarmiento-Maldonado, H.O. SoC estimation for lithium-ion batteries: Review and future challenges. Electronics 2017, 6, 102. [Google Scholar] [CrossRef]
- Yuan, H.F.; Dung, L.R. Offline State-of-Health Estimation for High-Power Lithium-Ion Batteries Using Three-Point Impedance Extraction Method. IEEE Trans. Veh. Technol. 2017, 66, 2019–2032. [Google Scholar] [CrossRef]
- Stroe, D.; Swierczynski, M.; Stroe, A.; Kaer, S.K. Generalized characterization methodology for performance modelling of lithium-ion batteries. Batteries 2016, 2, 37. [Google Scholar] [CrossRef]
- Dai, H.; Jiang, B.; Wei, X. Impedance characterization and modeling of lithium-ion batteries considering the internal temperature gradient. Energies 2018, 11, 220. [Google Scholar] [CrossRef]
- Somakettarin, N.; Funaki, T. Study on factors for accurate open circuit voltage characterizations in Mn-type Li-ion batteries. Batteries 2017, 3, 8. [Google Scholar] [CrossRef]
- Somakettarin, N.; Funaki, T. Parameter extraction and characteristics study for manganese-type lithium-ion battery. Int. J. Renew. Energy Res. 2015, 5, 464–475. [Google Scholar]
- Weppner, W.; Huggins, R.A. Determination of the kinetic parameters of mixed-conducting electrodes and application to the system Li3Sb. J. Electrochem. Soc. 1977, 124, 1569–1578. [Google Scholar] [CrossRef]
- Schweiger, H.; Obeidi, O.; Komesker, O.; Raschke, A.; Schiemann, M.; Zehner, C.; Gehnen, M.; Keller, M.; Birk, P. Comparison of several methods for determining the internal resistance of lithium ion cells. Sensors 2010, 10, 5604–5625. [Google Scholar] [CrossRef] [PubMed]
- Somakettarin, N.; Sugihara, H.; Funaki, T. Open-circuit-voltage characterization system design for studies of phase-transition mechanism and deterioration in Mn-type Li-ion batteries. IEICE Electron. Express 2017, 14, 20170690. [Google Scholar] [CrossRef]
- Dubarry, M.; Liaw, B.Y. Identify capacity fading mechanism in a commercial LiFePO4 cell. J. Power Sources 2009, 194, 541–549. [Google Scholar] [CrossRef]
Figure 1.
Proposed lithium-ion battery (LIB) model with ohmic series resistance (OSR) under life-cycle consideration.
Figure 1.
Proposed lithium-ion battery (LIB) model with ohmic series resistance (OSR) under life-cycle consideration.

Figure 2.
Current and voltage waveforms during the pulse tests for OSR characterization.

Figure 3.
A test system for OSR characterization.

Figure 4.
A proposed testing procedure for OSR characterization.

Figure 5.
Effect of life cycles on the OSR characteristic at different C-rates of charge and discharge: (a) new cell; (b) aging cell at 400 cycles; (c) aging cell at 1200 cycles; (d) aging cell at 2400 cycles.
Figure 5.
Effect of life cycles on the OSR characteristic at different C-rates of charge and discharge: (a) new cell; (b) aging cell at 400 cycles; (c) aging cell at 1200 cycles; (d) aging cell at 2400 cycles.

Figure 6.
OSR characteristics due to the cycle changes at different SOCs, namely: (a) charge operation and (b) discharge operation.
Figure 6.
OSR characteristics due to the cycle changes at different SOCs, namely: (a) charge operation and (b) discharge operation.

Figure 7.
Comparison between the rate of change of the resistance increment fitted from the experiments and the proposed model, namely: (a) charge operation and (b) discharge operation.
Figure 7.
Comparison between the rate of change of the resistance increment fitted from the experiments and the proposed model, namely: (a) charge operation and (b) discharge operation.

Figure 8.
Verification of the proposed OSR model under life-cycle consideration, compared with the OSRs from the experiment, namely: (a) charge operation and (b) discharge operation.
Figure 8.
Verification of the proposed OSR model under life-cycle consideration, compared with the OSRs from the experiment, namely: (a) charge operation and (b) discharge operation.

Figure 9.
A comparison of the combined OSRs plotted between the measured and modeled values with the reference diagonal axis.
Figure 9.
A comparison of the combined OSRs plotted between the measured and modeled values with the reference diagonal axis.


Table 1.
Specification of the cell under test.
| Description | Specification |
|---|---|
| Cell type | Lithium manganese oxide (LMO) |
| Nominal voltage and capacity | 3.8 V, 3500 mAh |
| Minimum voltage and maximum voltage | 2.90 V–4.25 V |
| Recommended discharge cut voltage (DCV) | 3.00 V |
| Recommended charge threshold voltage (CTV) | 4.20 V |
| Maximum continuous charging current (C-rate) | 1 C (3500 mA) |
| Maximum continuous discharging current (C-rate) | 5.7 C (20,000 mA) |
| Peak discharge current (C-rate) | 7 C (25,000 mA) |
Table 2.
Rate of change of the resistance increment due to life cycles for SOCs during charge and discharge.
Table 2.
Rate of change of the resistance increment due to life cycles for SOCs during charge and discharge.
| SOC (%) | Charge | Discharge | ||||
|---|---|---|---|---|---|---|
| OSR0 (mΩ) | kcy (μΩ·cycle−1) | SSR (mΩ2) | OSR0 (mΩ) | kcy (μΩ·cycle−1) | SSR (mΩ2) | |
| 2 | 23.14 | 2.349 | 0.209 | 23.00 | 2.429 | 0.196 |
| 5 | 21.71 | 2.185 | 0.184 | 21.90 | 2.123 | 0.031 |
| 10 | 20.64 | 1.744 | 0.452 | 20.76 | 1.779 | 0.119 |
| 30 | 20.41 | 1.669 | 0.339 | 20.49 | 1.371 | 0.129 |
| 50 | 20.38 | 1.663 | 0.179 | 20.48 | 1.387 | 0.151 |
| 70 | 20.34 | 1.671 | 0.124 | 20.32 | 1.458 | 0.010 |
| 90 | 20.85 | 1.393 | 0.053 | 20.41 | 1.431 | 0.035 |
| 99 | 20.99 | 1.488 | 0.114 | 20.93 | 1.461 | 0.040 |
Table 3.
Extracted parameters for the equation of the rate of change of the resistance increment due to life cycles.
Table 3.
Extracted parameters for the equation of the rate of change of the resistance increment due to life cycles.
| Operation Test | k1 (cycle·mΩ−1% −1) | k2 (cycle·mΩ−1) | SSR (mΩ2·cycle) |
|---|---|---|---|
| Charge | 6.3045 × 10⁻² | 3.8016 × 10⁻¹ | 7.1380 × 10⁻² |
| Discharge | 8.4867 × 10⁻² | 3.5265 × 10⁻¹ | 7.0575 × 10⁻² |
© 2019 by the authors. Licensee MDPI, Basel, Switzerland. This article is an open access article distributed under the terms and conditions of the Creative Commons Attribution (CC BY) license (http://creativecommons.org/licenses/by/4.0/).
Share and Cite
MDPI and ACS Style
Somakettarin, N.; Pichetjamroen, A. Characterization of a Practical-Based Ohmic Series Resistance Model under Life-Cycle Changes for a Lithium-Ion Battery. Energies 2019, 12, 3888. https://doi.org/10.3390/en12203888
AMA Style
Somakettarin N, Pichetjamroen A. Characterization of a Practical-Based Ohmic Series Resistance Model under Life-Cycle Changes for a Lithium-Ion Battery. Energies. 2019; 12(20):3888. https://doi.org/10.3390/en12203888
Chicago/Turabian StyleSomakettarin, Natthawuth, and Achara Pichetjamroen. 2019. "Characterization of a Practical-Based Ohmic Series Resistance Model under Life-Cycle Changes for a Lithium-Ion Battery" Energies 12, no. 20: 3888. https://doi.org/10.3390/en12203888
Note that from the first issue of 2016, this journal uses article numbers instead of page numbers. See further details here.