The Acceptable Alternative Vehicle Fuel Price


1
Institute of Technical Science, University of Opole, 45-040 Opole, Poland
2
Department of Tractors and Agricultural Machines, Operating and Maintenance, Mykolayiv National Agrarian University, 54020 Mykolayiv, Ukraine
3
Department of higher and applied mathematics, Mykolayiv National Agrarian University, 54020 Mykolayiv, Ukraine
*
Author to whom correspondence should be addressed.
Energies 2019, 12(20), 3889; https://doi.org/10.3390/en12203889
Submission received: 7 September 2019
/
Revised: 8 October 2019
/
Accepted: 10 October 2019
/
Published: 15 October 2019
(This article belongs to the Special Issue Economics of Bioenergy 2019)
Abstract
:Historically, petroleum fuels have been the dominant fuel used for land transport. However, the growing need for sustainable national economics has urged us to incorporate more economical and ecological alternative vehicle fuels. The advantages and disadvantages of them complicate the decision-making process and compel us to develop adequate mathematical methods. Alternative fuel (compressed natural gas, liquefied petroleum gas, and ethanol fuel mixtures), the standard prices and their ratios were investigated. A mathematical model to determine a critical ratio between alternative and conventional fuel prices had already been developed. The results of this were investigated. The results showed that the critical ratio is not a linear function on annual conventional fuel consumption costs. According to our simulation gaseous fuels were economically more attractive. Whereas, the use of bioethanol blends had more risk.
1. Introduction
Energy is a key element in sustaining the social and economic development of society. Energy use is the basis of the quality of life and the driver for its enhancement [1]. The combustion of fossil fuels results in the release of harmful emissions into the atmosphere. It will lead to an inevitable increase in the concentration of carbon dioxide, greenhouse gases, and other toxic compounds (nitrogen oxides, carbon monoxide, sulfur oxide, non-methane organic gas, soot, etc.) which are hazardous to human health [2,3]. Therefore, the usage of hydrocarbon energy resources negatively effects climate change [4].
Improvements in living standard have resulted in an increase of fossil fuel consumption, especially in transportation [5,6]. That is why they are currently playing a dominant role despite the ecological effects [4]. Petroleum fuels are still dominant for all kinds of transport (air, marine, and land) because of their relatively high economic efficiency. Reserves of crude oil (feedstock for the conventional fuel production) are limited and exhaustible, and there has been a rise in the world crude oil price.
A total of 22% of global air pollution comes from transportation [7]. It has been proven that there is a relationship between energy consumption, harmful emission, and economic growth [8]. Ecological issues may slow down economic growth [9].
To improve the current situation in the energy sector and ecology, 195 countries in 2015 agreed to targets directed at reducing greenhouse gas emissions [10,11,12]. The increase in the price of crude oil, an increase in the demand for energy resources, and harmful emission has forced us to develop alternative fuels that can both reduce harmful emission and strengthen national energy security [5,13]. Therefore, the utilization of alternative fuels, including renewable ones, is relevant. Their usage has a lot of benefits: a reduction in greenhouse emissions; the diversification of energy resources; an increase in energy security; the creation of new jobs; and the development of business [14,15].
Therefore, sustainable economic development of our civilization requires energy saving technologies, logistics optimization, alternative energy resources and fuels. Some alternative technologies are capable of delivering a sustainable land transport system: the battery electric vehicle (BEV); the hydrogen fuel cell electric vehicle (FCEV); biofuels; and gaseous fuels. Electricity and hydrogen can be produced from renewable energy or nuclear energy. In this case BEV and FCEV are transport systems with zero-carbon emissions. However, since the focus of this study is internal combustion engine vehicles, electric vehicles are not considered.
Alternative fuels may be both renewable and nonrenewable. Liquid and gaseous biofuels (ethanol, biodiesel, biogas, etc.) positively influence sustainable economic growth [16]. Nonrenewable alternative fuels (compressed natural gas, liquefied petroleum gas, etc.) improve economical, environmental, and social areas of a sustainable economy [17]. There are various drawbacks to the use of alternative fuels: technical, infrastructural, and economic. In choosing an alternative fuel, the price is the most important criteria in addition to user acceptance, reducing hazardous substances, improvement of life quality, vehicle life, etc. [18].
Consumers should have a simple method to evaluate the attractiveness of a certain vehicle fuel. The decision should be made easily based on the absolute value of the prices of different types of fuels. To predict the optimal vehicle fuel simulation models have been developed. The simulation took into account the fuel price differentials (difference between the prices of conventional and of alternative fuels) [19]. The fuel price differentials and the ratio of fuel prices were used in a number of studies [20,21,22]. However, the fuel price differential is an absolute value. This indicator cannot identify the optimal fuel because it depends on absolute prices. The alternative/conventional fuel price ratio is a relative indicator and gives more reliable information about preferable fuel. Abundant research discussions on alternative vehicle fuels have applied an alternative to conventional fuel price ratio: the LPG to gasoline price ratio was used to analyze the LPG market in Poland [23]; the same indicator was used for techno-economic Analysis of Liquid Petroleum Gas Fueled Vehicles for Public Transportation in Indonesia [24]; the compressed natural gas (CNG)/petroleum and LPG/diesel price ratios were used to study the development of natural gas vehicles in China [25] and to study sustainability between CNG vehicle innovative ecosystem and other vehicle innovative ecosystem [26]; the ratio of ethanol and gasoline prices was used as an indicator of ethanol blending economics [27,28,29,30]; the LNG/HFO price ratio was used to study low emission engine technologies for future legislation [31]; and the biodiesel to petroleum diesel fuel price ratio was used to study the efficiency of biodiesel utilization [32]. However, to make an optimal decision, it is necessary to take into account a number of factors: lifetime of the vehicle, fuel prices, fuel properties, investment costs, salvage income, etc. Therefore, consumers need a model that takes the above factors into account.
The aim of this study was to give information to decision-makers in order to utilize alternative fuels. The alternative fuel economics are complicated and require a sophisticated mathematical model for an analysis. To obtain this, a new mathematical model was developed to determine a maximum relative alternative fuel price when its application is feasible. The model is based on the following: a conventional fuel price, the investment costs, the discount rate, fuel properties, annual conventional fuel consumption, share of conventional fuel in dual fuel mode, and total lifetime of investment project.
2. Materials and Methods
The methodological basis of the study was relevant literature, information resources, and statistical data. Economic and mathematical modeling was employed to determine the effectiveness of fuels used.
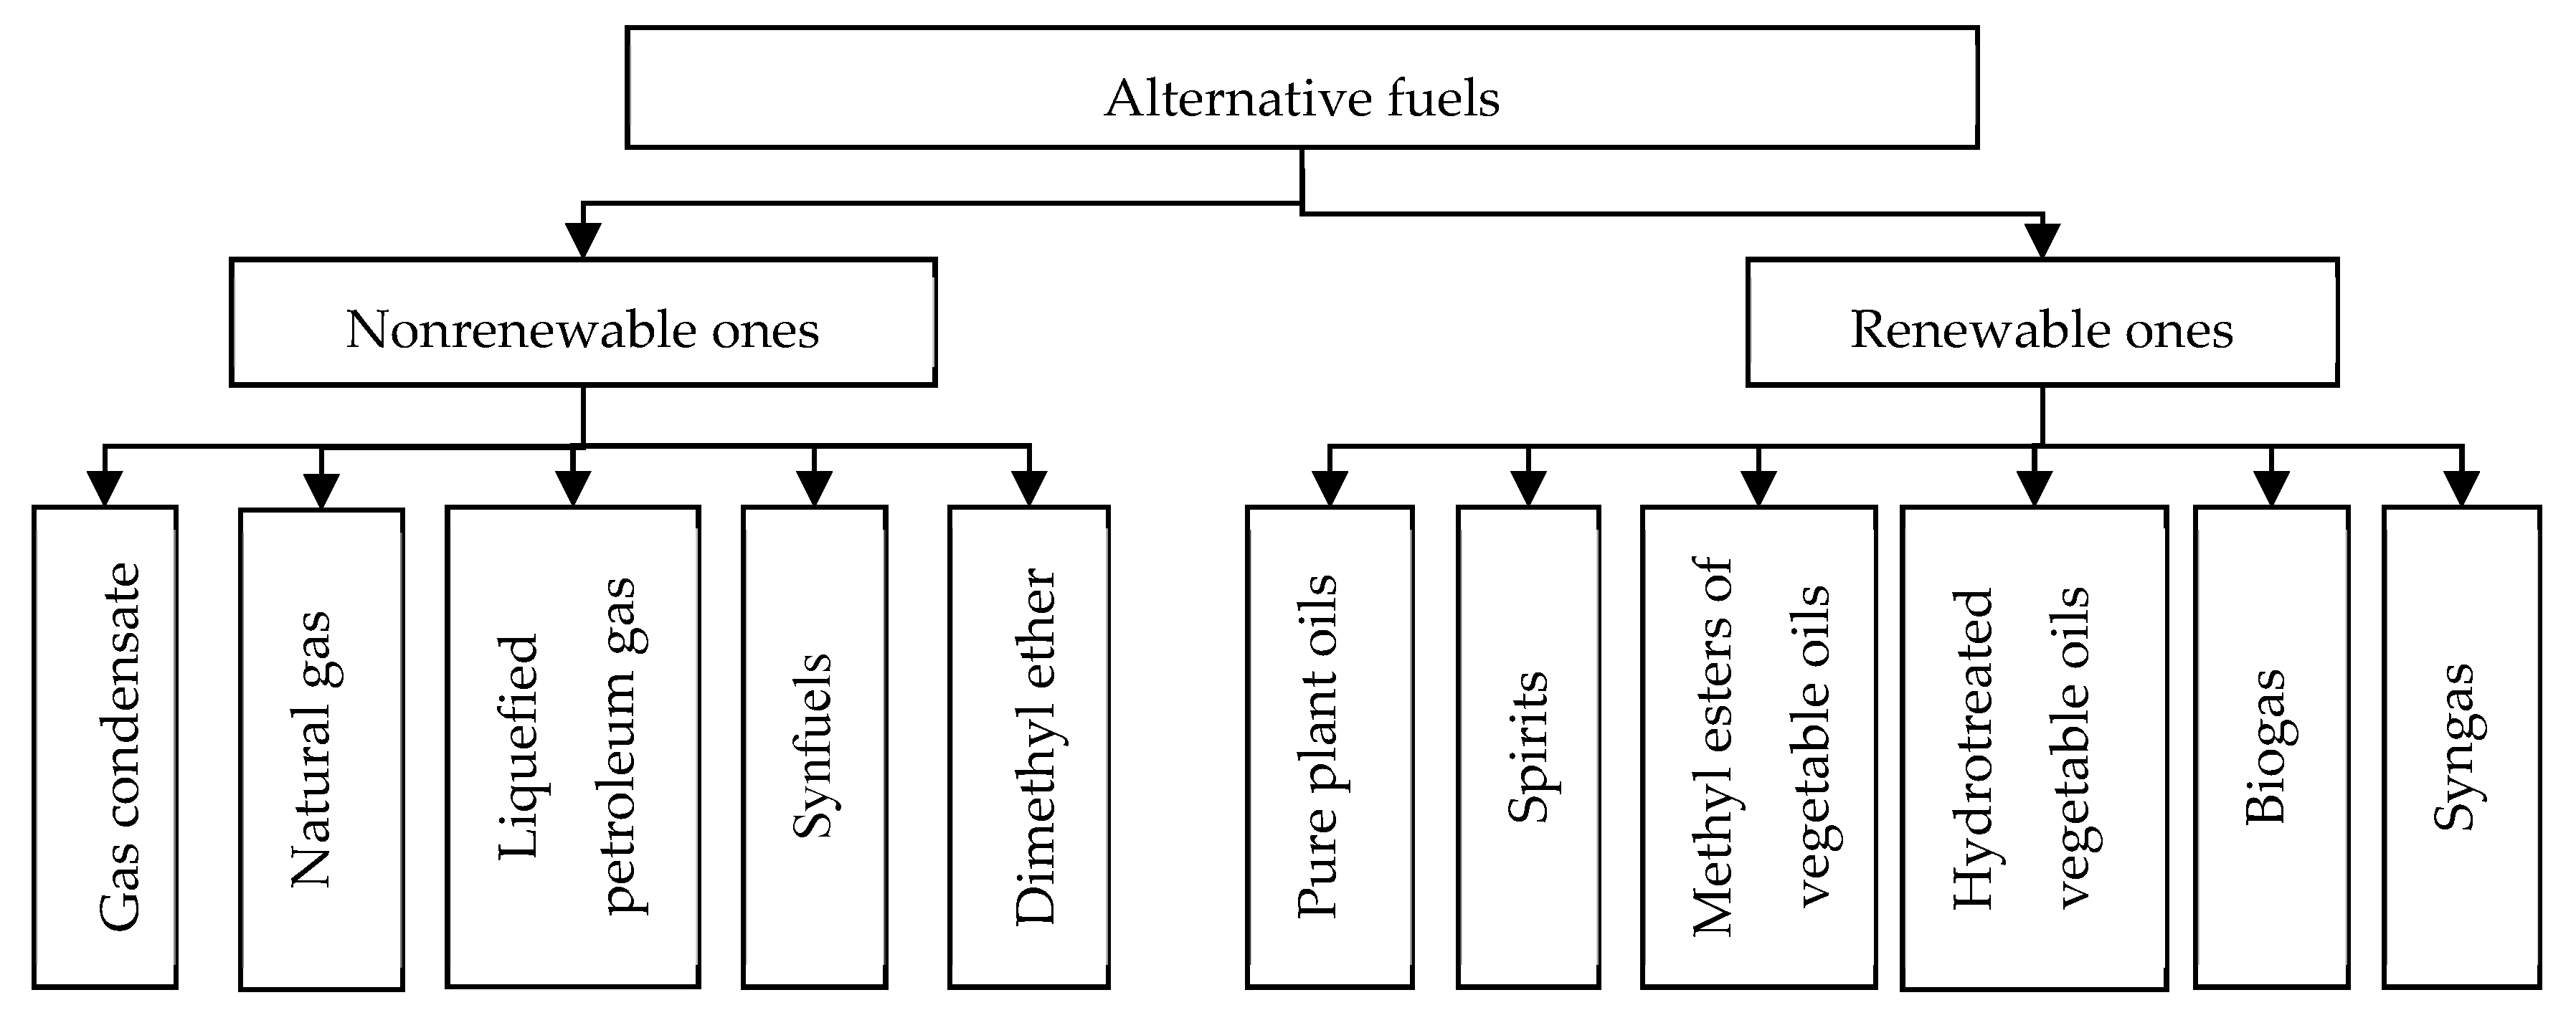
Most land transport vehicles are designed to be operated on petroleum derived fuels (gasoline and diesel fuel). Conventional fuels are fuels derived from petroleum. Alternative fuels are not petroleum fuels and can be produced from fossil energy resources (compressed natural gas, liquefied natural gas, liquefied petroleum gas, etc.) or biomass [33]. In practice, both pure and blended biofuels are used. Compressed natural gas competes with petroleum fuels in the vehicle fuel market and it is expected to be a growing vehicle fuel in the world in the next decade [34]. The classification of fuels was considered in previous investigations [35,36]. Alternative vehicle fuels can be divided into renewable and nonrenewable ones (Figure 1).
The main physical and chemical properties of biofuels and conventional petroleum fuels are different. Hydrotreated vegetable oil is an exception [37]. This fact complicates their utilization and compels us to use blended fuels which contain both petroleum and non-petroleum components. It makes alternative fuel properties closer to conventional fuels. Diesel fuel and pure plant oils; diesel fuel and vegetable oil methyl esters; gasoline and bioethanol are popular blends.
The determination of alternative vehicle fuel economic viability, Net Present Value (NPV), and Profitability Index (PI) analysis were applied. The mathematical model includes the following variables: Alternative and conventional fuel prices; Investment costs; Remaining salvage value; Operating lifetime; Discount rate; Ecological charges, etc.
In the study retail prices for each fuel were used. Major alternative fuels currently in widespread use (liquefied petroleum gas or propane, natural gas, biomethane, biodiesel blends, bioethanol blends, and a special kind of energy—electricity) were analyzed.
Hydrogen fuel cell vehicles have been demonstrated in Australia, Canada, China, the European Union, Japan, the USA, etc. However, the drawback of the above projects was high capital costs and the lack of hydrogen delivery infrastructure. It resulted in termination of some programs [38]. Therefore, this technology is currently developing but still not widespread. That is why hydrogen was not considered in this paper.
In the study research such indicators as energy cost, ratio of fuel prices, etc., have been used. In order to make a decision on the use of a certain fuel, it is necessary to know the energy cost (EC). It can be determined as follows [14]:
where Fpr is the fuel price, EUR/m3; Q is the lower heating value of the fuel, MJ/kg; ρ is the fuel density, t/m3.
Energy cost of blended fuels is calculated as follows [14]:
where Fpri is the price of the ith component of fuel, EUR/m3; Qi is the lower heating value of the ith component of fuel, MJ/kg; ρi is the density of the ith component of fuel, t/m3; n is the number of components; ci is the volume fraction of the ith component of fuel.
The efficiency of an internal combustion engine depends on a number of factors, including the type of fuel used. Therefore, the energy cost for useful work (ECU) is equal to [14]
where η is the efficiency of an engine.
We examined the ratio of alternative fuel and conventional fuel prices as an indicator of alternative fuel economics. We also assumed that alternative fuel prices do not need to be adjusted to their lower heating value (petroleum gasoline and diesel fuel have different lower heating values).
Penetration of alternative fuels and alternative fuel vehicles depends on the fuel retail infrastructure and the price of vehicles that can use these fuels [39]. Therefore, investment costs of fueling stations and conversion kit costs were taken into account. In the study the following countries were selected:
- The USA is the world biggest consumer of alternative vehicle fuels, including renewable ones;
- Germany and Sweden hold leading positions in renewable fuels consumption (biofuels and biomethane);
- Ukraine has a large CNG and LPG fleet.
3. Results
3.1. Modeling Procedure
Fuel price differentials depend on the absolute value of conventional fuel prices. The linear correlation coefficient r measures the strength of the linear relationship between two variables: price differentials and conventional fuel prices (Figure 2 and Figure 3). The linear correlation coefficients were calculated by authors:
- the differential between gasoline and E85 prices in the USA is equal to 0.81;
- the differential between gasoline and LPG prices in Ukraine is equal to 0.84.
The above means that there is strong correlation between price differentials and conventional fuel prices. Therefore, it is reasonable to use a ratio between alternative and conventional fuel prices.
If ACFC is the annual costs of conventional fuel and AAFC is the annual costs of alternative fuel, the return of alternative fuel utilization can be found as their difference
where M is the annual consumption of conventional fuel, t; DFpr is the price of conventional fuel, EUR/L; ρ is the density of conventional fuel, kg/L; ρA is the density of alternative fuel, kg/L; ECC is the annual ecological charges for the conventional fuel, EUR; ECA is the annual ecological charges for the alternative fuel, EUR; AFpr is the price of the alternative fuel, EUR/L; φ is the conventional fuel energy share in fuel blends or for a dual fuel mode; Q is the lower heating value of the conventional fuel, MJ/kg; QA is the lower heating value of the alternative fuel, MJ/kg; ηC is the efficiency of vehicle which runs on the conventional fuel; ηA is the efficiency of vehicle which runs on the alternative fuel.
Alternative fuel vehicles can use single and multiple fuel sources. Dual fuel vehicles use two types of fuel at the same time with a different fuel tank, for example, CNG and diesel fuel. The share of conventional fuel in fuel blends (φ) ranges from 0 to 1.
After transformation, the above equation will have the form
Denoted by γ the ratio of alternative fuel price to conventional fuel price γ = AFpr/DFpr, then the Equation (5) will have the following form
For electric vehicles, a mathematical expression for return is different. Annual consumption of electricity by vehicle is equal to
where ηE is the efficiency of vehicle which runs on electricity.
Then, return for electric vehicles is determined as following
where EEpr is the price of electricity, EUR/kWh; ECE is the annual ecological charges for electricity.
After transformation, the return for electric vehicles utilization is
Net Present Value (NPV) and Profitability Index (PI) were considered as criteria for investment projects. If NPV is a criterion of an investment project, then for a regular cash flow its value is
where g is the discount rate; I is the investment costs, EUR; n is the lifetime of a certain investment project, year.
For consumers, it is important to know a break-even point of a certain alternative fuel project. In this point total costs and revenue are equal. It means that the Net Present Value is equal to zero. A critical value on the return can be found from an equation
where R* is the critical value of the return, EUR.
From the above equation the critical value of the return is equal to
It should be equated with the right parts of Equations (6) and (12)
where γ* is the critical value of the relative price for the alternative fuel.
Further
The critical value of γ* can be found from Equation (14). Therefore
Denoted by ACFC the annual conventional fuel consumption cost
Then Equation (15) takes the form
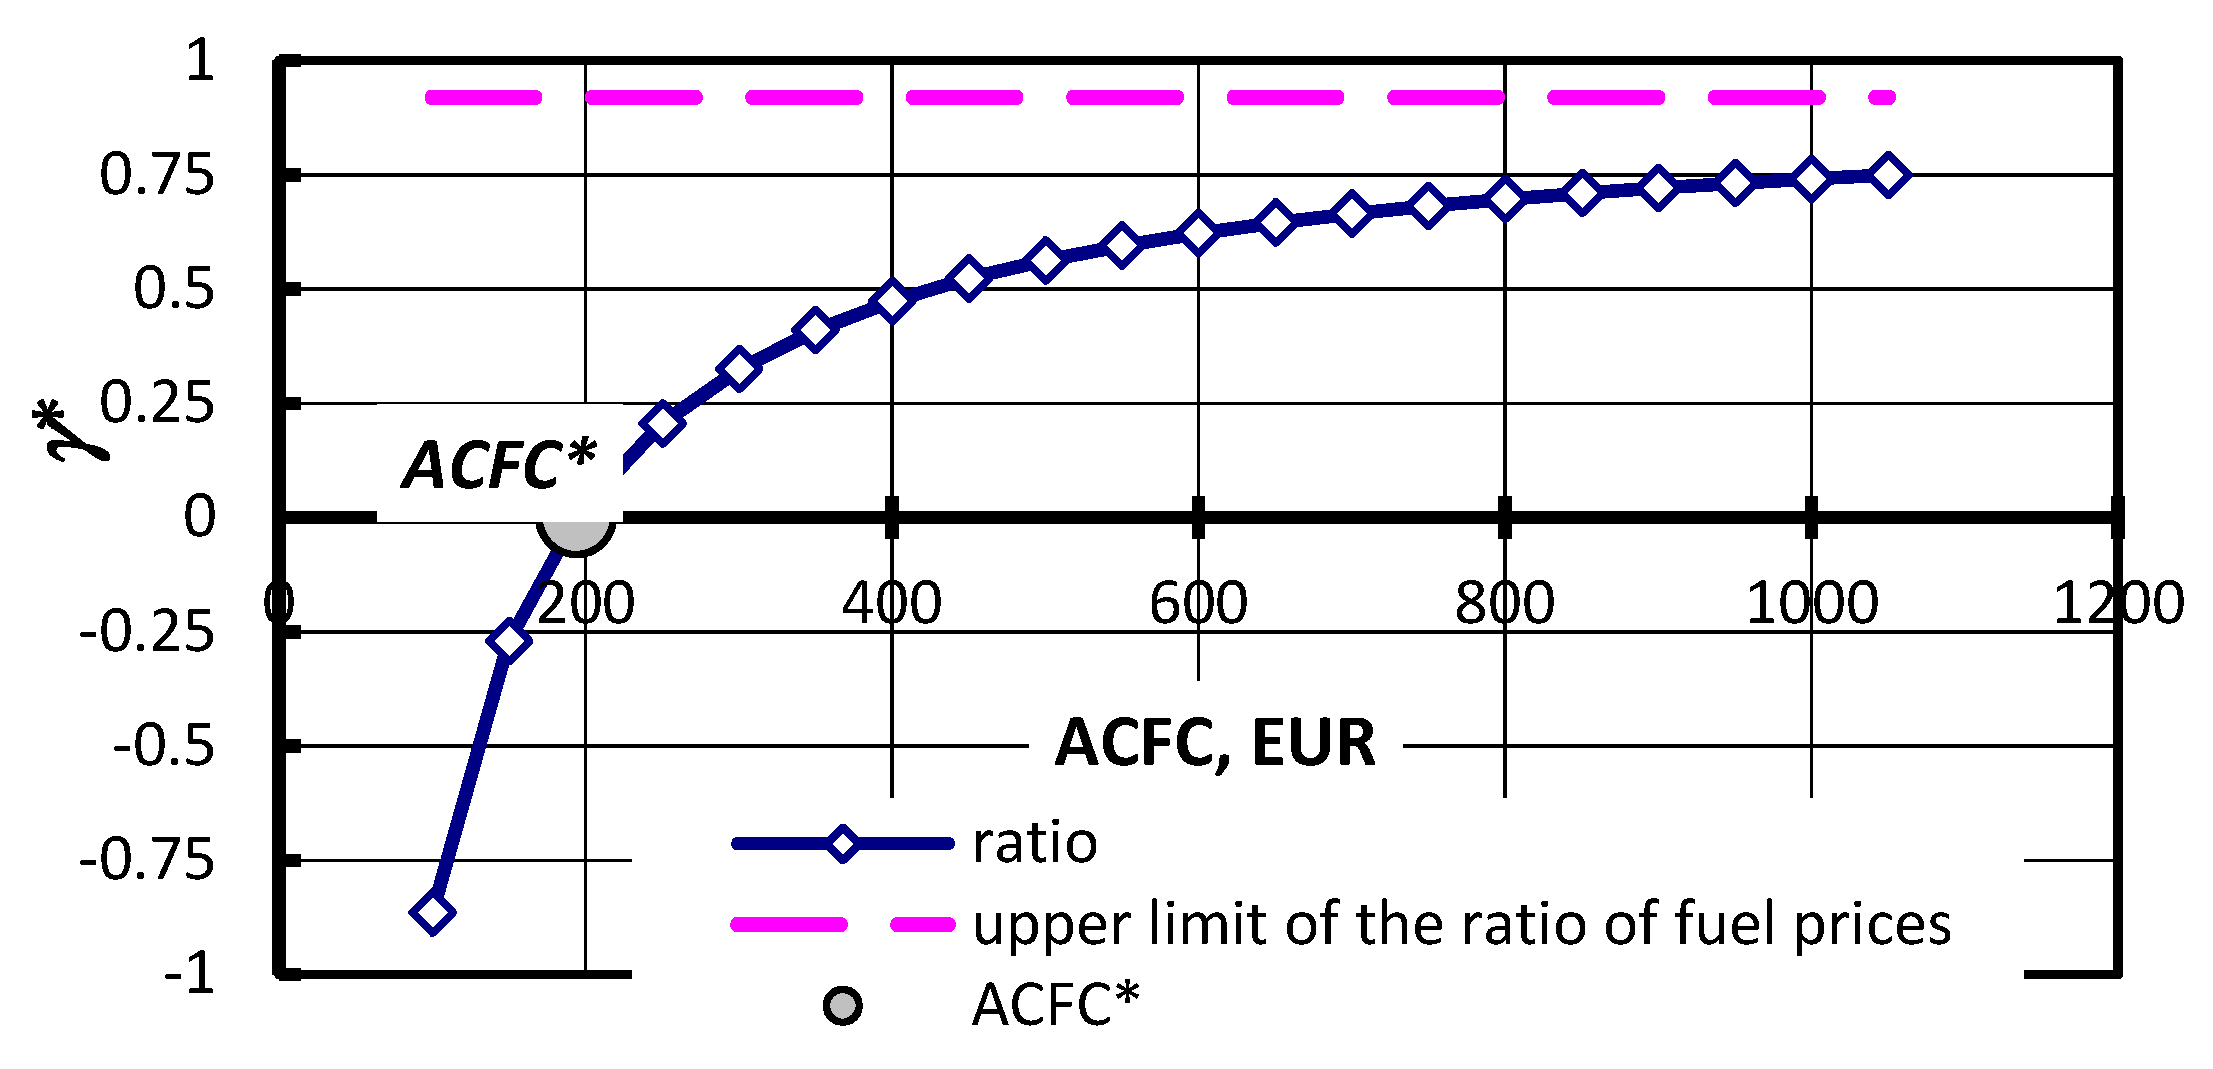
From the above equation the critical ratio of fuel prices can be found. If actual ratio of fuel prices γ is less than the critical one γ*, then an investment project is expedient. The above ratio can be used for the sensitive analysis procedure of investment projects [40,41,42]. Let us explore the above function in Equation (15).
If DFpf = 0, then γ* = −∞. It means that the alternative fuel price must be less than 0. This statement does not make sense (Figure 4).
If DFpf = ∞, then γ* → QA·ρA·Q−1·ρ−1.
Let us find a critical value of the annual conventional fuel consumption cost ACFC* from Equation (14)
Therefore
Therefore, the cost of the conventional fuel cost consumed is equal to (Figure 4)
To ensure the sustainable development of any organization, the profitability index of the investment project must be at least 1.2. If the profitability index is used as a criterion on an investment project, the critical value of the return will be
In this case critical value of γ* can be found from an equation
Then
From the Equation (23) the critical value of γ* is equal to
In this case the function obtained gives the result which is somewhat less than a function according to Equation (14) (Figure 5).
3.2. Initial Data for Modeling
To evaluate the efficiency of an alternative fuel vehicle compared to a conventional one, initial data should be found. The most important initial information is lifetime, fuel prices, fuel properties, discount rate, investment costs, salvage income, etc.
3.2.1. Lifetime of a Project
Firstly, tractors were considered. The lifetime of any project cannot exceed the economic life for a certain agricultural tractor. The economic life (EL) is a function of a service life and average annual utilization.
where SL is the service life, h; AAU is the average annual utilization, h/year.
For agricultural tractors a service life is around 10,000–12,000 h [43,44]. According to the recommendation of experts, the economic life must not exceed 15 years [45,46].
As for automobiles, there has been an increase in the average vehicle lifetime. According to statistical data, the expected median lifetime is, in years: car—16.9; light truck—15.5; heavy truck—28.0 [47]. In 2016 the average age of the USA automobiles was 11.6 years. Estimated annual vehicle mileage of travel depends on the type of vehicle. It is 9721 miles for cars and 10,353 miles for light trucks [48].
3.2.2. Fuel Prices and Their Ratio
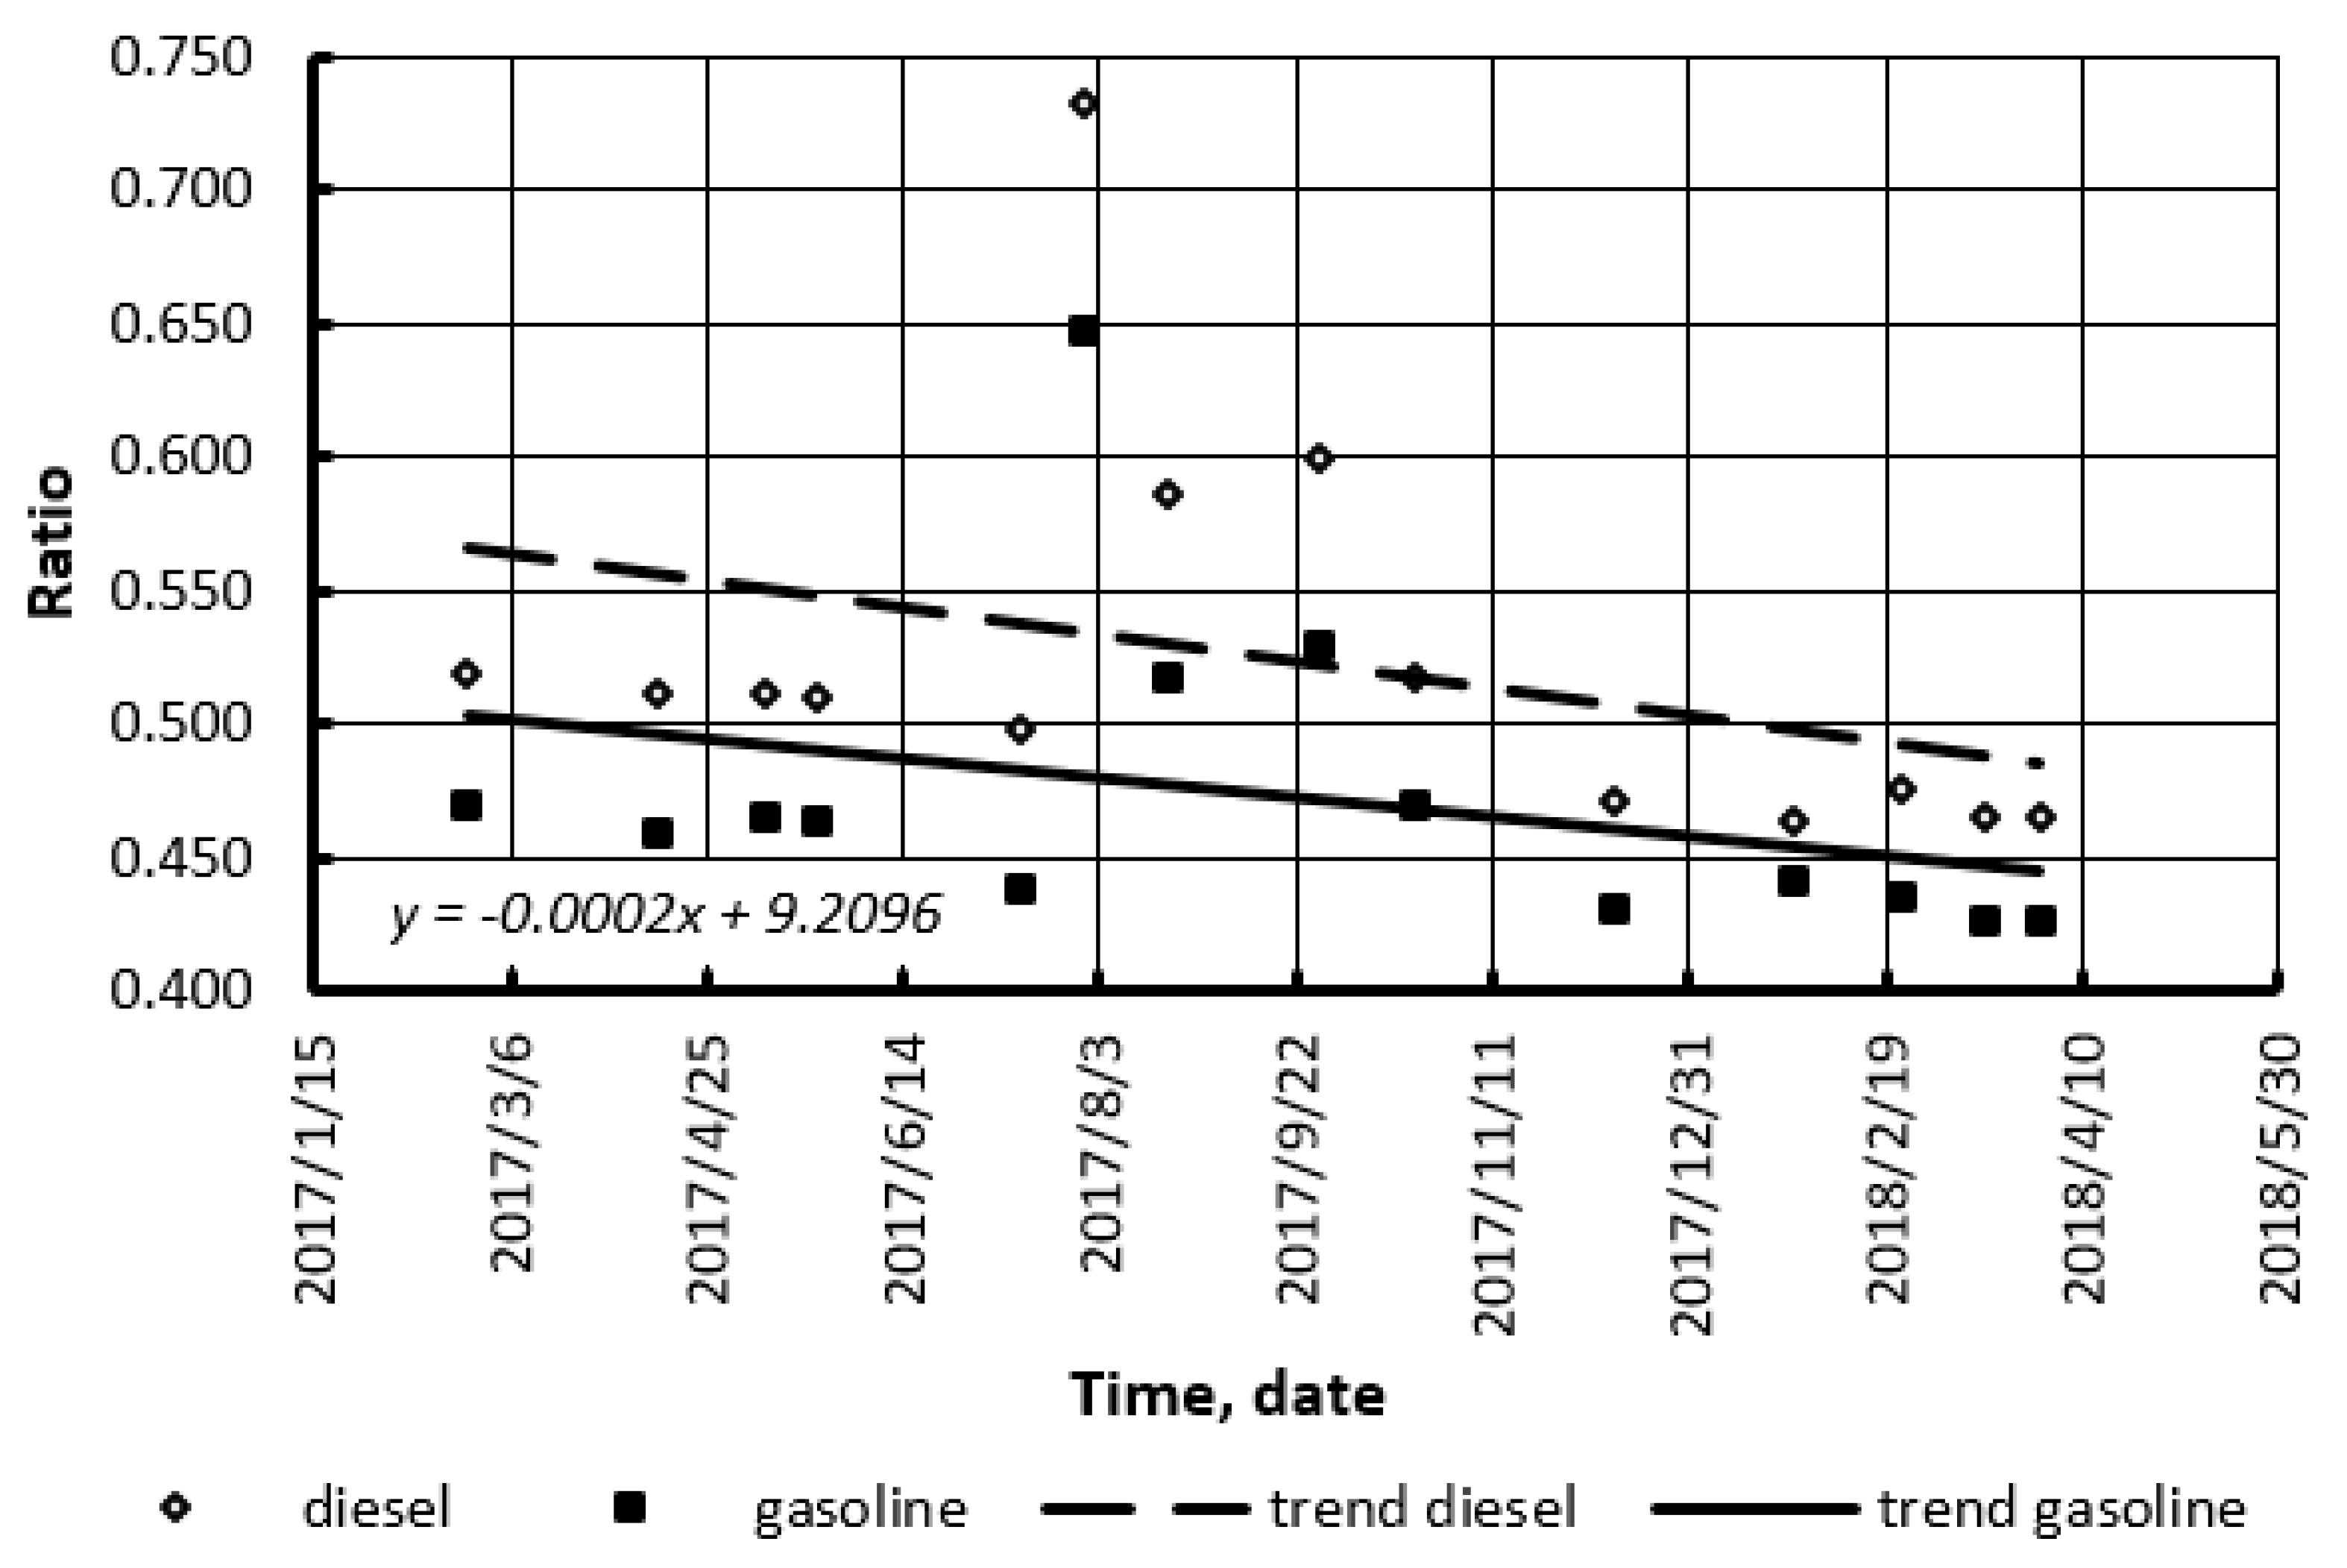
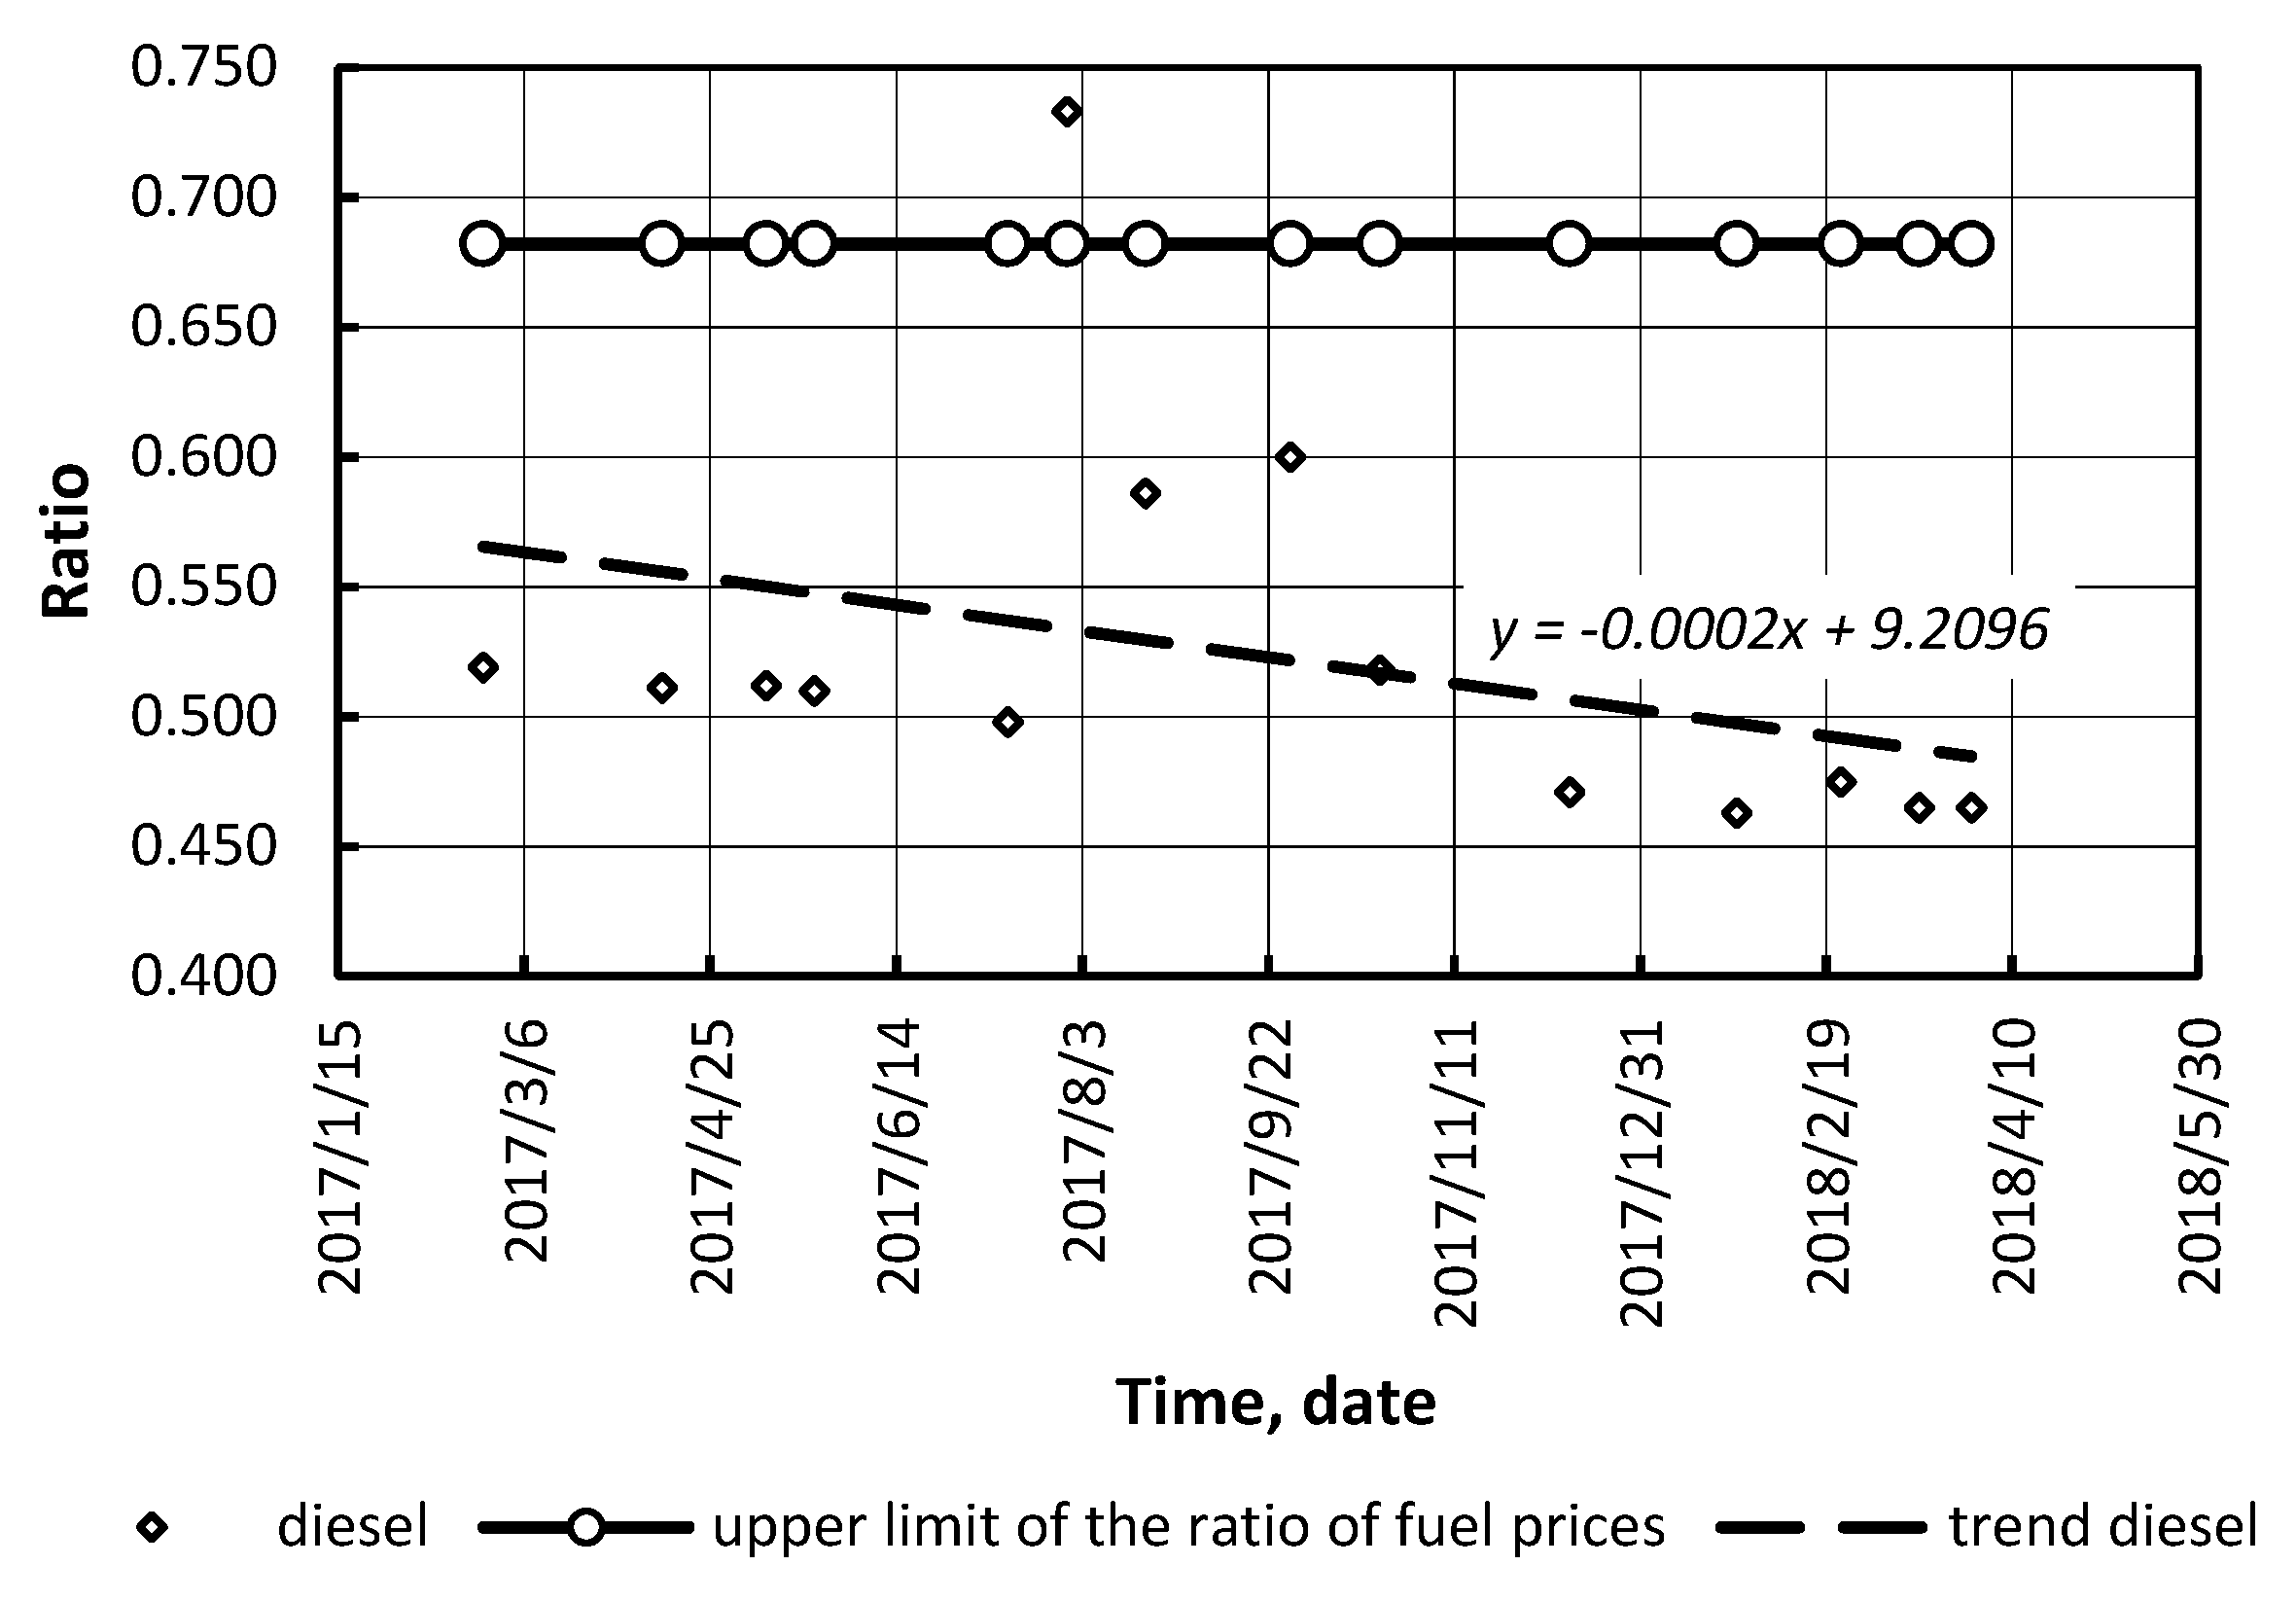
The most widespread fuels were considered: gasoline, conventional diesel fuel, compressed natural gas (CNG) (compressed biomethane), liquefied petroleum gas, biodiesel, and bioethanol blends. Our calculations (for conditions of Ukraine, the USA, and Germany) showed that the ratio of alternative/conventional fuel prices is not stable (Figure 6, Figure 7, Figure 8, Figure 9, Figure 10 and Figure 11). As it can be seen, in Ukraine there was a drop in the ratio. Therefore, alternative fuels (LPG and CNG) may compete with conventional (petroleum) fuels.
The same method was applied to the fuel markets of different countries: the USA and Germany. The above ratio was determined for bioethanol blends in the USA (Figure 12 and Figure 13), and LPG in Germany (Figure 14 and Figure 17). Figure 12, Figure 13, Figure 14, Figure 15, Figure 16 and Figure 17 present the following:
- The actual alternative to conventional fuel price ratios;
If the actual ratio is less than the optimal ratio then the use of the alternative fuel may be profitable.
The analysis carried out shows the following. The actual ratios for E10 fuel range from 0.84 to 1.0. These values are from 84.8% to 101% of the optimal ratio. The actual ratios for E85 fuel varied from 0.61 to 0.755. These values are 79.2%–98.7% of the optimal ratio for this alternative fuel. Therefore, the prices of E85 were more competitive than the prices of E10.
The ratios of CNG/diesel and CNG/gasoline prices in Germany are stable (Figure 16 and Figure 17) [50,51]. Additionally, the use of LPG and CNG can guarantee profitability of transport.
For Sweden, ratios of Alternative/Conventional fuel prices are presented in Figure 18. The calculations were made using data from the website [52]. As can be seen, those alternative fuels have attractive prices. For estimation of the cost parameters in the future periods of time, forecast models can be used [53,54].
3.2.3. Investment Costs
Investment costs include two components: conversion kit price and infrastructure costs. E85 conversion kit ranges from USD139 to USD800. CNG conversion kit costs much more especially for tractor diesel engines. Its value depends on vehicle type and origin of equipment. Therefore, its cost for an agricultural tractor MTZ-1221.2 is USD1600 [55]. Omnitek Engineering, Corp develops diesel-to-natural gas engine conversion kits. For engines without turbocharger, the conversion kit may cost from USD7000 (gas tanks and installation are extra) [56].
3.2.4. Fuel Economy
High octane bioethanol blends enable to improve energy efficiency and, as a result, vehicle energy economy [58,59]. Fuel economy impacts on decision-making. The use of bioethanol blends changes the fuel economy of vehicles (Table 1) [60]. The average ratio of E85 consumption per 100 km to gasoline consumption per 100 km is 1.367. According to our calculation, the coefficient of variation is 0.0458. If the above ratio is lower than ratio between gasoline price and E85 price, then the alternative fuel is appropriate.
From September 2017, in the USA E85 is economically justified. From April 2017 to April 2018 in the USA the average ratio gasoline price/E85 price is 1.45 (Figure 13). In March 2018 in Sweden the above ratio ranges from 1.42 to 1.466 [52].
The dual-fuel mode engine (diesel fuel and CNG) population is rising in the world. They have better ecological features and energetic performance. Their efficiency depends on load and speed. They are more economical on the conventional diesel mode with lower loads. The increase of load results in an improvement in dual-fuel mode engine efficiency [61]. The effective efficiency increases when a diesel engine is fueled with LPG too. For compressed ignition engines, the substitute ratio of diesel fuel with LPG is up to 30% [62].
The energy share of diesel fuel depends on a fuel supply system and operational load. Common rail diesels have better of the above. It ranges from 5% to 17% [20,63]. If a diesel engine is fueled with an in-line high pressure pump, the energy share can be calculated as
where P0 is the operational power, kW; Pr is the rated power, kW; φ0 is the energy share of diesel fuel on the rated power, φ0 = 0.25–0.3.
4. Results of Modeling
In this section results of modeling for gaseous fuel and liquid biofuel are presented. CNG and E85 were selected as widespread fuels. CNG was examined for a dual fuel diesel engine. The results are acceptable both for tractors and diesel-powered trucks. Biethanol blend was examined for spark ignition engine vehicles.
The Agricultural CNG-powered tractor MTZ-122.1 [54] in Ukraine was examined. A municipal fleet runs the tractors (no investment in their own CNG fueling station). Figure 20 shows the maximum acceptable values of the ratio of CNG/diesel fuel prices versus the annual diesel fuel consumption costs for two types of fuel systems: an in-line high-pressure fuel pump and a common rail system. The actual ratios of the studied fuels are also shown here: the upper value and the lower value (actual market price ratios).
According to our calculations, CNG-powered tractor utilization is feasible if annual conventional fuel (diesel fuel) consumption is at least EUR9500. It corresponds to 600 h of annual utilization. If common rail is used instead of an in-line high pressure pump, the efficiency increases. To cover expenses in tractor conversion, it is enough to have EUR6200 annual conventional fuel consumption or 400 operating hours (Figure 20).
Figure 21 shows the acceptable E85/gasoline price ratio versus annual gasoline consumption cost. The actual ratios of E85 and gasoline prices are also shown here: upper value, lower value, and average value (actual market price ratios). As can be seen, at the maximum market prices for E85, this type of fuel is not competitive. Although, the average value of its price ensures the profitability if a vehicle is used intensively.
The economic efficiency of an E85 vehicle is lower than CNG utilization (Figure 21). Therefore, if there are not any incentives that bioethanol blend utilization undertakes risks.
5. Conclusions
Efforts to reduce climate change and find the answer to the world crude oil crisis have resulted in the production and use of alternative vehicle fuels. In conditions of a market economy, fuel producers and consumers make decisions which depend on economic efficiency. Therefore, the price of fuel is the most important criterion.
To evaluate the feasibility of alternative fuels, a mathematical model was developed. The ratio between of alternative fuel price and conventional fuel price proved to be an optimal criterion for the model. It took into account fuel properties, vehicle performance whilst running on different fuels, and financial indicators. If the calculated ratio is higher than actual one, then the use of alternative fuel is rational.
According to calculations made, a more preferable alternative fuel is natural gas. The efficiency of its utilization depends primarily on the annual conventional fuel consumption, lifetime of a project, and the current ratio of alternative to conventional fuel prices.
Moreover, the above model may be used for the sensitivity analysis of investment projects.
Separate issues remain outside of this study. The use of electric vehicles is a multifaceted problem. In the above mathematical model cost of the infrastructure for electric vehicles (BEV and FCEV) should be incorporated. For a sustainable transport system, power generation and hydrogen production must be coupled with renewable energy sources. This should be factored in. Moreover, electric trucks and buses are starting to be produced and they must be the subject of further research.
Author Contributions
Data curation, A.K. and V.H.; Formal analysis, I.A.; Methodology, A.K. and V.H.; Project administration, A.K.; Resources, V.H. and I.A.; Writing—original draft, A.K. and V.H.; Writing—review & editing, I.A.
Funding
This research received no external funding.
Conflicts of Interest
The authors declare no conflict of interest.
Nomenclature
| AAU | the average annual utilization, h/year |
| ACFC | the annual conventional fuel consumption cost, EUR |
| AFpr | the price of the alternative fuel, EUR/L |
| BEV | the battery electric vehicle |
| ci | the volume fraction of the ith component of fuel |
| DFpr | the price of conventional fuel, EUR/L |
| ECA | the annual ecological charges for the alternative fuel, EUR |
| ECC | the annual ecological charges for the conventional fuel, EUR |
| ECE | the annual ecological charges for electricity, EUR |
| EEpr | the price of electricity, EUR/kWh |
| EL | the economic life, year |
| FCEV | the hydrogen fuel cell electric vehicle |
| Fpr | the fuel price, EUR/m3 |
| Fpri | the price of the ith component of fuel, EUR/m3 |
| g | the discount rate |
| I | the investment costs, EUR |
| M | the annual consumption of conventional fuel, t |
| n | the lifetime of a certain investment project, year |
| NPV | Net Present Value |
| P0 | the operational power, kW |
| Pr | the rated power, kW |
| PI | Profitability Index |
| Q | the lower heating value of the fuel, MJ/kg |
| QA | the lower heating value of the alternative fuel, MJ/kg |
| Qi | the lower heating value of the ith component of fuel, MJ/kg |
| R* | the critical value of the return, EUR |
| SL | the service life, hours |
| ρ | the fuel density, t/m3 |
| ρi | the density of the ith component of fuel, t/m3 |
| ρA | the density of alternative fuel, kg/L |
| η | the efficiency of an engine |
| ηA | the efficiency of vehicle which runs on the alternative fuel |
| ηC | the efficiency of vehicle which runs on the conventional fuel |
| ηE | the efficiency of vehicle which runs on electricity |
| φ | the conventional fuel energy share in fuel blends or for a dual fuel mode |
| φ0 | the energy share of diesel fuel on the rated power |
| γ | the ratio of alternative fuel price to conventional fuel price |
| γ* | the critical value of the relative price for the alternative fuel |
References
- Yilmaz, I.; Ilbas, M. An experimental study on hydrogen–methane mixtured fuels. Int. Commun. Heat Mass Transf. 2008, 35, 178–187. [Google Scholar] [CrossRef]
- Sinyak, Y.V.; Kolpakov, A.Y. Economic efficiency of synthetic motor fuels from natural gas. Stud. Russ. Econ. Dev. 2012, 23, 27–36. [Google Scholar] [CrossRef]
- Rosa, R.N. The Role of Synthetic Fuels for a Carbon Neutral Economy. J. Carbon Res. 2017, 3, 11. [Google Scholar] [CrossRef]
- Gaigalis, V.; Markevicius, A.; Skema, R.; Savickas, J. Energy strategy of Lithuanian Ignalina Nuclear Power Plant region for 2012–2035 as a chance for regional development. Renew. Sustain. Energy Rev. 2015, 51, 1680–1696. [Google Scholar] [CrossRef]
- Lanjewar, B.P.; Rao, V.R.; Kale, V.A. Assessment of alternative fuels for transportation using a hybrid graph theory and analytic hierarchy process method. Fuel 2015, 154, 9–16. [Google Scholar] [CrossRef]
- Speth, L.R.; Rojo, C.; Malina, R.; Barrett, R.H.S. Black carbon emissions reductions from combustion of alternative jet fuels. Atmos. Environ. 2015, 105, 37–42. [Google Scholar] [CrossRef]
- IEA. Statistics: CO2 Emissions from Fuel Combustion. 2017. Paris. Report. Available online: https://www.iea.org/publications/freepublications/publication/CO2EmissionsfromFuelCombustionHighlights2017.pdf (accessed on 4 September 2018).
- Antonakakis, N.; Chatziantoniou, I.; Filis, G. Energy consumption, CO2 emissions, and economic growth: An ethical dilemma. Renew. Sustain. Energy Rev. 2017, 68, 808–824. [Google Scholar] [CrossRef]
- Ozokcu, S.; Ozdemir, O. Economic growth, energy, and environmental Kuznets curve. Renew. Sustain. Energy Rev. 2017, 72, 639–647. [Google Scholar] [CrossRef]
- Fragkos, P.; Tasios, N.; Paroussos, L.; Capros, P.; Tsani, S. Energy system impacts and policy implications of the European intended nationally determined contribution and low-carbon pathway to 2050. Energy Policy 2017, 100, 216–226. [Google Scholar] [CrossRef]
- European Commission. Climate Action—Paris Agreement. 2015. Available online: https://ec.Europa.Eu/clima/policies/international/negotiations/paris_en (accessed on 15 May 2017).
- Rogelj, J.; Elzen, M.; Höhne, N.; Fransen, T.; Fekete, H.; Winkler, H.; Schaeffer, R.; Sha, F.; Riahi, K.; Meinshausen, M. Paris agreement climate proposals need a boost to keep warming well below 2 °C. Nature 2016, 534, 631–639. [Google Scholar] [CrossRef]
- Rahman, A.; Rasul, G.M.; Khan, M.M.M.; Sharma, S. Recent development on the uses of alternative fuels in cement manufacturing process. Fuel 2015, 145, 84–99. [Google Scholar] [CrossRef]
- Goncharuk, A.G.; Havrysh, V.I.; Nitsenko, V.S. National features for alternative motor fuels market. Int. J. Energy Econ. Policy 2018, 2, 226–249. [Google Scholar] [CrossRef]
- Cucchiella, F.; Adamo, I.; Gastaldi, M. Biomethane: A renewable resource as vehicle fuel. Resources 2017, 6, 58. [Google Scholar] [CrossRef]
- Armeanu, D.S.; Vintila, G.; Gherghina, S.C. Does renewable energy drive sustainable economic growth? Multivariate panel data evidence for EU-28 Countries. Energies 2017, 10, 381. [Google Scholar] [CrossRef]
- Moldan, B.; Janouskova, S.; Hak, T. How to understand and measure environmental sustainability: Indicators and targets. Ecol. Indic. 2012, 17, 4–13. [Google Scholar] [CrossRef]
- Chang, D.; Chen, S.; Hsu, C.; Hu, A.H.; Tzeng, G. Evaluation framework for alternative fuel vehicles: Sustainable development perspective. Sustainability 2015, 7, 11570–11594. [Google Scholar] [CrossRef]
- Soltani-Sobh, A.; Heaslip, K.; Bosworth, R.C.; Barnes, R. Compressed Natural Gas Vehicles: Financially Viable Option? Transp. Res. Rec. 2016, 2572, 28–36. [Google Scholar] [CrossRef] [Green Version]
- Heaslip, K.; Bosworth, R.; Barnes, R.; Sobh, A.S.; Thomas, M.; Song, Z. Effects of Natural Gas Vehicles and Fuel Prices on Key Transportation Economic Metrics; Final Res. Rep.; Washington State Department of Transportation: Olympia, DC, USA, 2014. Available online: https://www.wsdot.wa.gov/research/reports/fullreports/829.1.pdf (accessed on 4 September 2018).
- Pessoa, J.P.; Rezende, L.; Assunção, J. Flex Cars and Competition in Ethanol and Gasoline Retail Markets; CEP Discussion Papers dp1251; Centre for Economic Performance: London, UK, 2013; Available online: http://www.economia.puc-rio.br/lrezende/FlexCars.pdf (accessed on 5 September 2018).
- Pouliot, S. Arbitrage between ethanol and gasoline: Evidence from motor fuel consumption in Brazil. In Proceedings of the Economics Present., Post. and Proc. AAEA&CAES Ann. Meeting, Washington, DC, USA, 4–6 August 2013; Available online: https://lib.dr.iastate.edu/cgi/viewcontent.cgi?article=1007&context=econ_las_conf (accessed on 10 August 2019).
- Buczaj, M.; Sumorek, A. Analysis of the market of LPG as an alternative vehicle fuel in Poland in 2005–2016. ECONTECHMOD Int. Q. J. 2017, 6, 47–54. [Google Scholar]
- Setiyo, M.; Soeparman, S.; Hamidi, N.; Wahyudi, S. Techno-economic analysis of liquid petroleum gas fueled vehicles as public transportation in Indonesia. Int. J. Energy Econ. Policy 2016, 6, 495–500. [Google Scholar]
- Hao, H.; Liu, Z.; Zhao, F.; Li, W. Natural gas as vehicle fuel in China: A review. Renew. Sustain. Energy Rev. 2016, 62, 521–533. [Google Scholar] [CrossRef]
- Ding, L.; Wu, J. Innovation ecosystem of CNG vehicles: A case study of its cultivation and characteristics in Sichuan, China. Sustainability 2018, 10, 39. [Google Scholar] [CrossRef]
- Salvo, A.; Huse, C. Is arbitrage tying the price of ethanol to that of gasoline? Evidence from the uptake of flexible-fuel technology. Energy J. 2011, 32, 119–148. [Google Scholar] [CrossRef]
- Montasser, G.E.; Gupta, R.; Martins, A.L.; Wanke, P. Are there multiple bubbles in the ethanol–gasoline priceratio of Brazil? Renew. Sustain. Energy Rev. 2015, 52, 19–23. [Google Scholar] [CrossRef]
- Bentivoglio, D.; Finco, A.; Bacchi, M.R.P. Interdependencies between biofuel, fuel and food prices: The case of the Brazilian ethanol market. Energies 2016, 9, 464. [Google Scholar] [CrossRef]
- Laurini, M.P. The spatio-temporal dynamics of ethanol/gasoline price ratio in Brazil. Renew. Sustain. Energy Rev. 2017, 70, 1–12. [Google Scholar] [CrossRef]
- Wik, C.; Niemi, S. Low emission engine technologies for future tier 3 legislations-options and case studies. J. Shipp. Trade 2016, 1, 3. [Google Scholar] [CrossRef]
- Tareen, I.Y.; Wetzstein, M.E.; Duffield, J.A. Biodiesel as a substitute for petroleum diesel in a stochastic environment. J. Agric. Appl. Econ. 2000, 32, 373–381. [Google Scholar] [CrossRef]
- Dincer, I.; Zamfirescu, C. Fossil fuels and alternative fuels. In Advanced Power Generation Systems; Elsevier: Amsterdam, The Netherlands, 2014; pp. 95–141. [Google Scholar] [CrossRef]
- Annual Energy Outlook. With Projections to 2035. U.S. Energy Information Administration, U.S. Department of Energy. Available online: https://www.eia.gov/outlooks/aeo/pdf/0383.pdf (accessed on 7 August 2019).
- Zorpas, A.A.; Pociovalisteanu, D.M.; Georgiadou, L.; Voukkali, I. Environmental and technical evaluation of the use of alternative fuels through multi-criteria analysis model. Prog. Ind. Ecol. Int. J. 2016, 10, 3–15. [Google Scholar] [CrossRef]
- Havrysh, V.; Nitsenko, V. Current state of world alternative fuels market. Actual Probl. Econ. 2016, 7, 41–52. [Google Scholar]
- Aatola, H.; Larmi, M.; Sarjovaara, T.; Mikkonen, S. Hydrotreated vegetable oil (HVO) as a renewable diesel fuel: Trade-off between NOx, particulate emission, and fuel consumption of a heavy duty engine. SAE Int. J. Engines 2008, 1, 1251–1262. [Google Scholar] [CrossRef]
- Liu, Z.; Kendall, K.; Yan, X. China Progress on Renewable Energy Vehicles: Fuel Cells, Hydrogen and Battery Hybrid Vehicles. Energies 2019, 12, 54. [Google Scholar] [CrossRef]
- Leiby, P.; Rubin, J. Effectiveness and efficiency of policies to promote alternative fuel vehicles. Transp. Res. Rec. 2001, 1750, 84–91. [Google Scholar] [CrossRef]
- Kalinichenko, A.; Havrysh, V. Environmentally friendly fuel usage: Economic margin of feasibility. Ecol. Chem. Eng. S 2019, 26, 241–254. [Google Scholar] [CrossRef]
- Kalinichenko, A.; Havrysh, V.; Hruban, V. Heat recovery systems for agricultural vehicles: Utilization ways and their efficiency. Agriculture 2018, 8, 199. [Google Scholar] [CrossRef]
- Kalinichenko, A.; Havrysh, V.; Perebyynis, V. Sensitivity analysis in investment project of biogas plant. Appl. Ecol. Environ. Res. 2017, 15, 969–985. [Google Scholar] [CrossRef]
- Gazzarin, C. Maschinenkosten Agroscope Transfer 142. 2016. Available online: https://www.agroscope.admin.ch/agroscope/de/home/themen/wirtschaft-technik/betriebswirtschaft/maschinenkosten/_jcr_content/par/columncontrols/items/1/column/externalcontent_1062703409.external.exturl.pdf/aHR0cHM6Ly9pcmEuYWdyb3Njb3BlLmNoL2RlLUNIL0VpbnplbH/B1Ymxpa2F0aW9uL0Rvd25sb2FkP2VpbnplbHB1Ymxpa2F0aW9u/SWQ9MzY3OTI=.pdf (accessed on 4 September 2018).
- Lubbe, P.A.; Archer, C.G. Guide to Machinery Costs Department of Agriculture, Forestry and Fisheries, Pretoria. 2014/2015. Available online: http://www.daff.gov.za/Daffweb3/Portals/0/Statistics%20and%20Economic%20Analysis/Economic%20Analysis/Guide%20to%20machinery%20costs%202014-15.pdf (accessed on 1 September 2018).
- Lips, M. Length of Operational Life and Its Impact on Life-Cycle Costs of a Tractor in Switzerland. Agriculture 2017, 7, 68. [Google Scholar] [CrossRef]
- Edwards, W. Machinery Management. Estimating Farm Machinery Costs. Iowa State University, University Extension. 2015. Available online: https://www.extension.iastate.edu/AGDm/crops/html/a3-29.html (accessed on 4 September 2018).
- Davis, S.C.; Diegel, S.W.; Boundy, R.G. Transportation Energy Data Book: Edition 31, Center for Transportation Analysis. Energy and Transportation Science Division, 2012. Available online: https://tedb.ornl.gov/wp-content/uploads/2019/03/Edition31_Full_Doc.pdf (accessed on 10 August 2019).
- Davis, S.C.; Williams, S.E.; Boundy, R.G. Transportation Energy Data Book: Edition 36, Center for Transportation Analysis. Energy and Transportation Science Division, 2017. Available online: https://tedb.ornl.gov/wp-content/uploads/2019/03/Edition31_Full_Doc.pdf (accessed on 10 August 2019).
- E85Prices. 4430 Stations Selling E85 across 2462 Cities in USA. 2018. Available online: https://e85prices.com/ (accessed on 7 August 2019).
- MyLPG.UA. Chart of Fuel Prices in Germany. Available online: https://www.mylpg.eu/stations/germany/prices (accessed on 4 September 2018).
- FUELO, CNG. 2018. Available online: https://de.fuelo.net/fuel/type/methane/year?lang=en (accessed on 4 September 2018).
- Sweden Tips. Travel Guide and Booking Portal. Fuel Prices in Sweden: Petrol/Gasoline and Diesel. Available online: http://www.swedentips.se/fuel-prices/ (accessed on 5 September 2018).
- Atamanyuk, I.P. Polynomial algorithm of optimal extrapolation of stochastic system parameters. J. Upravlyayushchie Sistemy i Mashiny 2002, 1, 16–19. [Google Scholar] [CrossRef]
- Atamanyuk, I.P. Algorithm of extrapolation of a nonlinear random process on the basis of its canonical decomposition. J. Kibernetika i Sistemnyj Analiz 2005, 2, 131–138. [Google Scholar] [CrossRef]
- DAIZEN. Wheeled CNG-Powered Tractor MTZ-1221.2 Belarus. 2018. Available online: http://www.xn--80ahehj0a.xn--p1ai/goods/61479722-kolesny_traktor_mtz_1221_2_belarus_s_gazobalonnym_oborudovaniyem (accessed on 7 August 2019).
- Omnitek Develops Diesel-to-Natural Gas Engine Conversion Kits for Mercedes OM904/OM906. Green Car Congress, 2012. Available online: https://www.greencarcongress.com/2012/04/omnitek-20120419.html (accessed on 27 January 2019).
- Smith, M.; Gonzales, J. Costs Associated with Compressed Natural Gas Vehicle Fueling Infrastructure. September US Department of Energy, 2014. Available online: https://www.afdc.energy.gov/uploads/publication/cng_infrastructure_costs.pdf (accessed on 10 August 2019).
- Jung, H.; Leone, T.; Shelby, M.; Anderson, J.; Collings, T. Fuel Economy and CO2 Emissions of Ethanol-Gasoline Blends in a Turbocharged DI Engine. SAE Int. J. Engines 2013, 6, 422–434. [Google Scholar] [CrossRef]
- Leone, T.; Olin, E.; Anderson, J.; Jung, H.; Shelby, M.; Stein, R. Effects of Fuel Octane Rating and Ethanol Content on Knock, Fuel Economy, and CO2 for a Turbocharged DI Engine. SAE Int. J. Fuels Lubr. 2014, 7, 9–28. [Google Scholar] [CrossRef]
- US Department of Energy, New Flex-Fuel Vehicles. Available online: https://www.fueleconomy.gov/feg/PowerSearch.do?action=alts&path=3&year1=2017&year2=2018&vtype=E85&srchtyp=newAfv (accessed on 5 September 2018).
- Jadhav, A.; Hulwan, D.B. Experimentation & Simulation of Dual Fuel (Diesel-CNG) Engine of Off Road Vehicle. Eur. J. Adv. Eng. Tech. 2017, 4, 629–636. [Google Scholar]
- Mirica, I.; Pana, C.; Negurescu, N.; Cernat, A.; Nutu, N.C. Dual fuel diesel engine operation using LPG. In IOP Conference Series: Materials Science and Engineering; IOP Publishing: Bristol, UK, 2016; Volume 147, p. 12122. [Google Scholar] [CrossRef]
- Valtra Dual Fuel Tractors—The Natural Choice. Available online: http://www.valtra.com.au/dual-fuel.aspx (accessed on 5 September 2018).
Figure 1.
Classification of alternative vehicle fuels.

Figure 2.
Fuel price differentials (the difference between gasoline and LPG prices) in Ukraine.

Figure 3.
Fuel price differentials (the difference between gasoline and E85 prices) in the USA.

Figure 4.
The dependence on the ratio of alternative fuel price to conventional fuel price on the annual conventional fuel consumption cost (criterion—NPV).
Figure 4.
The dependence on the ratio of alternative fuel price to conventional fuel price on the annual conventional fuel consumption cost (criterion—NPV).

Figure 5.
The dependence of the ratio of alternative fuel price to conventional fuel price on the annual conventional fuel consumption cost (criterion—PI).
Figure 5.
The dependence of the ratio of alternative fuel price to conventional fuel price on the annual conventional fuel consumption cost (criterion—PI).

Figure 6.
LPG/conventional fuel prices ratio in Ukraine.

Figure 7.
LPG/diesel prices ratio in Ukraine.

Figure 8.
LPG/gasoline prices ratio in Ukraine.

Figure 9.
Compressed natural gas (CNG)/conventional fuel prices ratio in Ukraine.

Figure 10.
CNG/diesel prices ratio in Ukraine.

Figure 11.
CNG/gasoline prices ratio in Ukraine.

Figure 12.
E10/gasoline prices ratio in the USA [49].
Figure 12.
E10/gasoline prices ratio in the USA [49].

Figure 13.
E85/gasoline prices ratio in the USA [49].
Figure 13.
E85/gasoline prices ratio in the USA [49].

Figure 14.
LPG/diesel prices ratio in Germany.

Figure 15.
LPG/gasoline prices ratio in Germany.

Figure 16.
CNG/diesel prices ratio in Germany.

Figure 17.
CNG/diesel prices ratio in Germany.

Figure 18.
Ratios of Alternative/Conventional fuel prices in Sweden.

Figure 19.
CNG fueling station cost [56].
Figure 19.
CNG fueling station cost [56].

Figure 20.
The dependence of the ratio of CNG/diesel fuel prices on the cost of the annual conventional fuel (no CNG fueling station).
Figure 20.
The dependence of the ratio of CNG/diesel fuel prices on the cost of the annual conventional fuel (no CNG fueling station).

Figure 21.
The dependence of the ratio of E85/gasoline prices on the annual conventional fuel cost (the USA).
Figure 21.
The dependence of the ratio of E85/gasoline prices on the annual conventional fuel cost (the USA).


Table 1.
Fuel economy (adapted from [59]).
Table 1.
Fuel economy (adapted from [59]).
| Make | Fuel Economy, gal/100 miles | E85/Gasoline Ratio | |
|---|---|---|---|
| Gasoline | E85 | ||
| Ford Focus FWD FFV, Automatic (AM6) | 3.2 | 4.3 | 1.344 |
| Ford Focus FWD FFV, Manual 5-spd | 3.6 | 4.8 | 1.333 |
| Mercedes-Benz CLA250 4matic | 3.7 | 5.15 | 1.392 |
| Chrysler 200 | 3.7 | 5 | 1.351 |
| Audi A5 quattro | 4 | 5.6 | 1.400 |
| Jeep Renegade 2WD | 4 | 5.3 | 1.325 |
| Chevrolet Equinox FWD | 4 | 5.9 | 1.475 |
| GMC Terrain FWD | 4 | 5.9 | 1.475 |
| Jeep Cherokee FWD | 4 | 5.6 | 1.400 |
| Audi A5 Cabriolet quattro | 4.2 | 5.9 | 1.405 |
| Ford Escape FWD FFV | 4.2 | 5.6 | 1.333 |
| Jeep Cherokee 4WD | 4.3 | 5.9 | 1.372 |
| Chevrolet Equinox AWD | 4.3 | 5.9 | 1.372 |
| Ford Transit Connect Van FFV | 4.3 | 5.9 | 1.372 |
| Chysler 200 | 4.3 | 5.9 | 1.372 |
| Dodge Charger | 4.3 | 5.9 | 1.372 |
| Audi Q5 | 4.5 | 5.2 | 1.156 |
| Ford F150 Pickup 2WD FFV | 4.5 | 6.2 | 1.378 |
| Ford F150 2WD FFV BASE PAYLOAD LT TIRE | 4.8 | 6.2 | 1.292 |
| Chevrolet Silverado C15 2WD | 5 | 7.1 | 1.420 |
| GMC Sierra C15 2WD | 5 | 7.1 | 1.420 |
| Ford Explorer 2WD FFV | 5 | 6.7 | 1.340 |
| Mercedes-Benz GLE350 4matic | 5.3 | 7.1 | 1.340 |
© 2019 by the authors. Licensee MDPI, Basel, Switzerland. This article is an open access article distributed under the terms and conditions of the Creative Commons Attribution (CC BY) license (http://creativecommons.org/licenses/by/4.0/).
Share and Cite
MDPI and ACS Style
Kalinichenko, A.; Havrysh, V.; Atamanyuk, I. The Acceptable Alternative Vehicle Fuel Price. Energies 2019, 12, 3889. https://doi.org/10.3390/en12203889
AMA Style
Kalinichenko A, Havrysh V, Atamanyuk I. The Acceptable Alternative Vehicle Fuel Price. Energies. 2019; 12(20):3889. https://doi.org/10.3390/en12203889
Chicago/Turabian StyleKalinichenko, Antonina, Valerii Havrysh, and Igor Atamanyuk. 2019. "The Acceptable Alternative Vehicle Fuel Price" Energies 12, no. 20: 3889. https://doi.org/10.3390/en12203889
Note that from the first issue of 2016, this journal uses article numbers instead of page numbers. See further details here.