Article

Optimum Band Gap Energy of ((Ag),Cu)(InGa)Se2 Materials for Combination with NiMo–NiO Catalysts for Thermally Integrated Solar-Driven Water Splitting Applications

1
Department of Engineering Sciences, Solid State Physics, Uppsala University, Box 534, SE-75121 Uppsala, Sweden
2
Department of Engineering Sciences, Solid State Electronics, Uppsala University, Box 534, SE-75121 Uppsala, Sweden
3
Solibro Research AB, Vallvägen 5, SE-75651 Uppsala, Sweden
*
Author to whom correspondence should be addressed.
Energies 2019, 12(21), 4064; https://doi.org/10.3390/en12214064
Submission received: 27 September 2019 / Revised: 18 October 2019 / Accepted: 22 October 2019 / Published: 24 October 2019
(This article belongs to the Special Issue Materials and Devices for Solar to Hydrogen Energy Conversion)

Abstract

:
Solar-driven water splitting is considered one of the promising future routes to generate fuel in a sustainable way. A carbon-free solar fuel, molecular hydrogen, can here be produced along two different but intimately related routes, photoelectrochemical (PEC) water splitting or photovoltaic electrolysis (PV-electrolysis), where the latter builds on well-established solar cell and electrolysis materials with high efficiency. The PV-electrolysis approach is also possible to construct from an integrated PEC/PV-system avoiding dc–dc converters and enabling heat exchange between the PV and electrolyzer part, to a conventionally wired PV-electrolysis system. In either case, the operating voltage at a certain current needs to be matched with the catalyst system in the electrolysis part. Here, we investigate ((Ag),Cu)(In,Ga)Se2 ((A)CIGS)-materials with varying Ga-content modules for combination with NiMo–NiO catalysts in alkaline water splitting. The use of (A)CIGS is attractive because of the low cost-to-performance ratio and the possibility to optimize the performance of the system by tuning the band gap of (A)CIGS in contrast to Si technology. The band gap tuning is possible by changing the Ga/(Ga + In) ratio. Optoelectronic properties of the (A)CIGS materials with Ga/(Ga + In) ratios between 0.23 and 0.47 and the voltage and power output from the resulting water splitting modules are reported. Electrolysis is quantified at temperatures between 25 and 60 °C, an interval obtainable by varying the thermal heat exchange form a 1-sun illuminated PV module and an electrolyte system. The band gaps of the (A)CIGS thin films were between 1.08 to 1.25 eV and the three-cell module power conversion efficiencies (PCE) ranged from 16.44% with 1.08 eV band gap and 19.04% with 1.17 eV band gap. The highest solar-to-hydrogen (STH) efficiency was 13.33% for the (A)CIGS–NiMo–NiO system with 17.97% module efficiency and electrolysis at 60 °C compared to a STH efficiency of 12.98% at 25 °C. The increase in STH efficiency with increasing temperature was more notable for lower band gaps as these are closer to the overpotential threshold for performing efficient solar-driven catalysis, while only a modest improvement can be obtained by utilizing thermal exchange for a band gap matched PV-catalysts system. The results show that usage of cost-effective and stable thin film PV materials and earth abundant catalysts can provide STH efficiencies beyond 13% even with PV modules with modest efficiency.

Graphical Abstract

1. Introduction

The prospects of using hydrogen as an energy carrier has long been considered a promising future approach to a sustainable and clean society. The economy of a society largely relying on hydrogen in a sustainable way for the energy demand can be denoted hydrogen economy where molecular hydrogen can be used in everything from a reduction agent in steel industry and other chemical processes, as a fuel for combustion-based heating, or electricity on demand in vehicles or stationary applications, where one will only obtain water as the end product. Electrolysis of water was shown already in 1789 by Deiman and van Troostwijk using a Leyden jar [1] and subsequently in 1800 by Nicholson and Carlisle in their experiments on electrolytic splitting of water using photovoltaic (PV) piles. Following the electrification of society, over 400 industrial water electrolyzers were in use in 1902 [2] while the strong interest in light driven electrolysis did not start until the seminal paper by Fujishima and Honda in 1972 [3] using TiO2 as a photoanode and platinum as a cathode. The latter was not a fully unassisted water splitting as there was a slight voltage bias from the different electrolyte concentrations used in the separated cells. Solar driven water electrolysis can, in principle, be performed with either a photoelectrochemical (PEC) or a PV-electrolysis approach with different intermediate designs [4] as illustrated in Figure 1a. In a PEC design, the system relies on the charge separation over the Helmholtz layer or even the intramolecular or intraparticle charge separation in molecular- or nanoparticle-based approaches, while PV-electrolysis approaches largely rely on charge separation at charge selective contacts or over a p–n-homo/heterojunction in the PV part for subsequent coupling to an electrolyzer module with or without thermal coupling (Figure 1b and Figure 2b).
In the electrolysis process, irrespectively of whether the electrons and holes are created locally or supplied via wires to the catalysts, water is decomposed into oxygen and hydrogen gas due to an electric current with sufficient electrochemical potential at the anodic and cathodic electrodes. The band states in the semiconducting material will also depend on the Fermi level of the contact material, either the electrolyte or another solid-state material in a designed p–n-junction as illustrated in Figure 2a,b.
The outer Helmholtz layer (OHL) and inner Helmholtz layer (IHL) provide a charge compensating field where this function instead is provided by immobile dopants in the n-type material in the solid-state p–n-junction (Figure 2a). In this study, we use the approach with a buried junction (Figure 2b) using materials with different bandgaps forming a p–n-heterojunction with an n-type material of ZnO:Al and a variation in valence and conduction band in the ((Ag),Cu)(InGa)Se2 ((A)CIGS) material by varying Ga content (Figure 2c). In order to obtain optimum device performance, one should consider processes of charge carrier generation, as well as their separation, transport, and transfer in the PV–electrolysis [5]. The efficiency of the full-device depends on the efficiencies of all these processes where the PV part of the solar water splitting system plays a critical role for the generation of the charge carriers with high and retained electrochemical potential. In approaches using nanoparticle semiconductors, surface or surface-induced defects are here detrimental by lowering/increasing the electrochemical potential of the electron/hole at the surface. In high-quality thin-film PV materials, this is less of a concern where one instead should find an optimum operation current-potential point of the system, which in turn depend on which catalyst system that is employed. For a high generation of charge carriers with the required potential, the semiconductor must have a band gap energy ( E g ) that is suitable to accomplish the required reaction but still harvest a fair amount of photons in the solar spectrum. As many of the nanoparticle semiconductors lose some of their internal photovoltage, relatively high band gap materials are usually used for single-band gap PEC water splitting such as TiO2 ( E g = 3.2 eV), WO3 ( E g = 2.6 eV), BiVO4 ( E g = 2.4 eV) [6,7,8].
Close to half of the energy in the solar spectrum resides in the infrared part and results in a mismatch between the energetic requirements for performing the full water splitting reaction and the solar energy distribution available for generating charge carriers in a single band gap material. Very moderate water splitting efficiencies have so far been achieved in single-band gap devices, while devices with multiple-band gaps instead have been utilized for the absorption of infrared photons, improved photovoltage, and providing highly efficient solar-driven water splitting. Large-scale applications of tandem approaches, however, are limited by the manufacturing complexity and have the same difficulties with cost-per-performance as the tandem approach in the conventional PV industry [9]. Utilization of buried junctions and employment of serial interconnected photo-absorber is an alternative and cost-effective solution to the spectral mismatch problem. Taking losses due to charge carrier separation and overpotential for catalysis into account, the maximum solar-to-hydrogen (STH) efficiency using the optical limit for a series interconnected device is 24.6%, compared to 32.0% for an optimum double-junction tandem solar water splitting device at 1 sun (Air Mass 1.5, 1000 W/m2) [10].
Recent progressions in PV technologies allow the use of a variety of PV modules such as crystalline– and thin-film–silicon, perovskites, and (A)CIGS [5,11,12]. (A)CIGS solar cells are attractive for applications within direct catalysis because of their direct band gap and adjustable band gap that enable high efficiency ( η ) thin-film PV material with a variation of voltages. The effect of the Ga content in (A)CIGS solar cells has been investigated in recent years [13,14,15] where the band gap of the (A)CIGS cells can be changed by changing the Ga/(Ga + In) ratio. A schematic illustration for the band gap changes with Ga gradient is shown in Figure 2c. The shift of energy levels with changed Ga content and the subsequent increase in the band gap of an absorber layer is frequently followed by an increase in open circuit voltage (VOC) and the operating voltage at the maximum power point up to a certain Ga-content. However, it also results in a decrease in the generated current due to the lower amount of photons harvested in the solar spectrum. All these parameters, as well as the overpotentials for the chosen catalyst system, effect the operation point of a PV-electrolyzer system. Therefore, the optimization of band gap of the (A)CIGS absorber layer of the solar cell, together with consideration of the intended catalysts, are prerequisites to find out an optimum condition for a highly efficient solar water splitting system. In addition, a heat exchange from the PV part to the electrolyzing part is beneficial for lowering the overpotentials of the water splitting reaction. In our laboratory, measurements with solar cells and electrolyzers connected closely to the electrolyte compartment, as shown in configuration vi in Figure 1, of temperature exchange could vary from no thermal exchange up to a heating of the electrolyte to 56 °C at steady state using standard air mass 1.5 global (AM1.5G) solar irradiation onto the PV part. The amount of thermal exchange relevant for the system would thus be heating up to about 60 °C and would, in the final device design, depend on both the thickness and material type of the solar absorber and the substrate, as well as on the geometry and amount of electrolyte in direct contact with the backside of the PV.
The present work investigates the optimal Ga gradient and band gap for a PV-electrolysis system that is a combination of (A)CIGS solar cell modules and a NiMo–NiO-based alkaline electrolyzer. Ga/(Ga + In) ratios between 0.23 and 0.47 were studied. The effect of thermal exchange was considered and the effect of tuning the band gap on STH efficiency was investigated at temperatures between 25 and 60 °C. The influence of basic parameters of the (A)CIGS material and charge separation on STH was discussed for different electrolyzer temperatures.

2. Theory

The theoretical value for the energy needed to split water into hydrogen and oxygen is 1.23 eV. The STH efficiency of the overall process for hydrogen production from solar energy via water can be calculated from
S T H = 1.23   ( V )   J ( m A / c m 2 ) I 0 ( m W / c m 2 ) η F
where J is the current density, I 0 is the irradiance, and η F the Faradic efficiency. If the current density–potential (J–V) characteristics of PV modules and electrolyzers are known, STH can be estimated from the intersection of the J–V curves for the same area of PV modules and the electrodes of electrolyzers or be extracted from the operating current in the combined system.
Water splitting requires more energy than the theoretical value of the lower heating value of hydrogen (1.23 eV) due to several losses. Efficiency of hydrogen production from solar energy via water depends on many steps, such as (i) the absorption of the light, (ii) the charge separation, (iii) the charge transport mechanisms, and (iv) the catalytic activities, and can be described via external quantum efficiency (EQE) [5]
E Q E ( λ ) = L H E ( λ ) ϕ s e p ( λ ) ϕ t r a n s η c a t
where L H E is the light harvesting efficiency, λ is the wavelength, ϕ s e p is the charge separation efficiency, ϕ t r a n s is the charge transport efficiency, and η c a t is the quantum efficiency of catalytic charge transfer. A calculation to find upper theoretical limits for the losses due to the charge separation ( η s e p ) was done by Shockley-Queisser [16] and can be written as [10,17]
q V O C = E g η s e p = E g k B T   ln [ 8 Π ( k B T ) 2 n 2 E g c 2 h 3 j g e n α ϕ r e c L ]
by considering the non-radiative losses where q is the charge, k B is the Boltzmann’s constant, T is the temperature, n is the refractive index, c is the speed of the light in vacuum, h is the Plank’s constant, j g e n is the rate of photon absorption in the AM1.5 spectra, α is the absorption coefficient, ϕ r e c is the ratio between the non-radiative and radiative recombination rates, and L denotes the minority carrier diffusion length and can be replaced with the material thickness, d , if d is smaller than L.

3. Materials and Methods

3.1. PV Preparation

The (A)CIGS material and subsequent solar cell modules were fabricated on soda-lime glass substrates cut to 5 × 5 cm2 samples. The sample structure can be seen in Figure 3a and consists of a stack of thin layers, starting with a back contact of molybdenum (Mo). The Mo layer was fabricated by dc magnetron sputtering to a thickness of 3–400 nm. Then, a 10 nm NaF layer was deposited by evaporation before the (A)CIGS absorber layer was deposited, which is further detailed below, and a buffer layer of CdS followed. The CdS layer was deposited by wet chemical bath deposition, using 1.2 M ammonia, 3.2 mM cadmium acetate, and 0.1 M Thiourea, where the samples were immersed in a beaker with 175 mL solution, which was heated in a 60 °C water bath for 10 min, of which the first 6 min were without Thiourea. After the process, the samples were rinsed and dried with nitrogen. A double layer of undoped ZnO (70 nm) and a layer of aluminum-doped ZnO (210 nm) was deposited as a transparent conducting layer by rf magnetron sputtering. A Ni–Al–Ni grid was evaporated through a shadow mask by electron gun evaporation (about 2.5% area coverage), as the top electrode and separation of cells were obtained by mechanical scribing. A cross-section image of the sample was obtained using a Zeiss 1550 scanning electron microscopy (SEM) instrument equipped with an in-lens detector at 5 kV. A cross-section SEM picture of the stack is shown in Figure 3b, while SEM energy dispersive spectroscopy (EDS), STEM EDS, XPS, as well as depth profiling chemical analysis have been performed previously for the same (A)CIGS procedure and can be found in a previous publication [18].
The (A)CIGS layer was deposited by vacuum co-evaporation using a process dedicated to give high-quality material and with an in-depth grading of the Ga/(Ga + In) ratio through the film thickness obtained by using a high Ga/(Ga + In) evaporation rate in the beginning of the process and a lower rate in the rest of the evaporation. Two samples were fabricated without Ag and the rest with a Ag/(Ag + Cu) ratio of 0.2. This average Ag/(Ag + Cu) ratio was obtained by keeping a constant ratio during the evaporation. The final step of the (A)CIGS deposition was the deposition of 5–10 nm of KF at a substrate temperature of 350 °C.
The Ga/(Ga + In) ratio is the most important factor for changing the E g of the A(CIGS) material and for this paper, a range of average Ga/(Ga + In) ratios from about 0.2 to above 0.5 was used. This gave a variation of the E g from 1.08 to 1.25 as calculated from the absorption edge in E Q E measurements. The Ga/(Ga + In) ratio is calculated from X-ray fluorescence spectroscopy, using a sample with known composition as a reference, which gives an average through the 2-µm-thick film. However, the optical band gap as calculated from the E Q E will be more important for the absorption and will mainly be determined from the top 1 µm. Therefore, the band gap will be used throughout the paper. The Ga/(Ga + In) ratio and E g of the samples are listed in Table 1.

3.2. Catalyst Preparation

NiMo and NiO films were deposited on 1.6-mm-thick Ni foam (350 g/m2 surface density and sheet resistance of 0.1 Ω/sq) by reactive dc magnetron sputtering (Balzers UTT 400). As targets, two 5-cm-diameter metallic Ni (99.99% purity, Plasmaterials) and Mo (99.99% purity, Plasmaterials) discs were used. The target-to-substrate distance was 13 cm and the substrate holder was rotated at 3 rpm for the homogeneity of the films. Pre-sputtering was performed for 5 min to clean the surface of the targets. NiMo films with 30 at.% Ni and 70 at.% Mo were prepared by co-sputtering at 30 mTorr pressures, with 50 mL/min Ar flow, and using a power of 80 and 180 W for Ni and Mo, respectively. NiO films were deposited in an Ar/O2 atmosphere with an O2/Ar ratio of 10% at 30 mTorr pressure and at 200 W. The film thicknesses determined by a Veeco Dektak 150 surface profilometry instrument were 165 ± 10 nm.

3.3. Characterisation Techniques

The J–V characteristics of the cells were recorded under simulated AM1.5G sunlight in a setup with a halogen lamp (ELH). The cells were kept at 25 °C during measurement.
EQE measurements were conducted for each sample in lab-built equipment where Jsc were integrated from the EQE and AM1.5G standard spectra and used to correct the Jsc measured in the J–V setup. The correction was small (<5% relative) for the cells measured.
J–V characterization of the electrolyzer with NiMo (cathode)–NiO (anode) catalysts was obtained from linear sweep voltammetry (LSV) measurements performed using a CH Instrument model 760C workstation from 0 to 2 V with a scan rate of 5 mV s−1. The electrolyte was 1 M KOH (pH = 14), which were purged by nitrogen flow for 10 min before the measurements. The LSV measurements were performed between the temperatures of 25 and 60 °C.

4. Results

Figure 4a shows EQE spectra of the (A)CIGS cells for different Ga ratios between 0.23 and 0.47 with respect to Ga + In. The main difference is seen at higher wavelengths with an onset of photocurrents shifted from 1200 to 1000 nm with increasing Ga gradient, consistent with an increase in the band gap of (A)CIGS with Ga content. The band gap energies were calculated from the EQE spectra using
E Q E ( E ( λ ) ) E E g
where E is the energy.
The band gap of the (A)CIGS varied from 1.08 to 1.25 eV with different Ga contents, and the relation between the extracted band gap energy and the Ga content is shown in Figure 4b. The band gap energy increased monotonically with increased Ga/(Ga + In) ratio except the deviation at the Ga/(Ga + In) ratio of 0.4. To provide a sufficient photovoltage for the water splitting reaction, modules with three series-connected cells were considered. The photocurrent per area (Jph) for the module, as a whole, decreases with the number of sub-cells, whereas the photovoltage increased with
J p h = 1 n 0 h c / E g E ( λ ) E Q E ( λ ) d λ
V p h o t o = n ( V p h o t o , s i n g l e )
where the total area efficiency (JphVphoto) thereby is kept close to constant, with only an area loss from the scribing in creating the module. The effect of band gap variation of the (A)CIGS modules on the PV electrolyzer was examined for NiMo–NiO electrolyzer at different temperatures. Potential dependence of current densities of three-cell (A)CIGS modules with different band gap energies and the NiMo–NiO electrolyzer at different temperatures are shown in Figure 5. Higher current densities were obtained at higher temperatures for the electrolyzer, and the effect of band gap changes is seen in the J–V characteristics of the (A)CIGS module. Figure 5 shows the basic J–V parameters of the (A)CIGS modules with respect to different band gaps of the sub-cells.
The open circuit potential of the three-cell modules naturally follows the increased voltage of each sub-cell with V O C , increasing from 1.83 to 2.45 V with increasing band gap (Figure 6a). The short-circuit current density ( J s c ) of the (A)CIGS modules (Figure 6b) decreased from 11.8 to 9.6 mA cm−2 with increasing band gap. The efficiency ( η ) of the (A)CIGS modules (Figure 6c) varied between 16.44% and 19.04% for the studied band gap range. There is a trend between the efficiency and band gap showing a maximum for mid-band gap and successive lowering with increasing and decreasing band gaps. The lowest efficiency was obtained for the module with the lowest band gap energy and the highest efficiency could be obtained for the module with a moderate band gap energy, which was 1.17 eV. There was no clear trend between the fill factor ( F F ) and band gap (Figure 6d), varying between 0.76 for 1.16 eV and 0.80 for 1.24 eV.
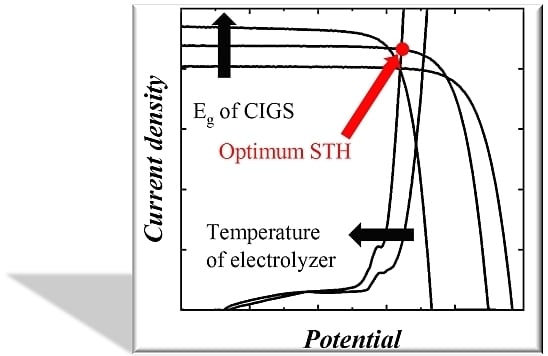
Designing the system with the PV module and catalyst system having the same area, the STH efficiency of the (A)CIGS–NiMo–NiO PV electrolyzers can be calculated from operational catalytic current density and thus the intersection points of the J–V curves shown in Figure 5 using Equation (1). Dependence of the STH efficiency with the temperature of the electrolyzer is shown in Figure 7. At high temperatures, the highest STH efficiencies are observed for relatively low band gap (A)CIGS, 1.15 to 1.19 eV from a catalytic current closer to the maximum power point of the PV part, while the STH efficiency falls off at lower temperatures since the voltage is lower than the one required by the catalyst system to retain a high rate for the water splitting reaction. With the chosen catalysts system, the modules with 1.17 and 1.19 eV band gap cells have the best STH efficiency, overall.
Figure 8a shows the STH efficiency of the (A)CIGS–NiMo–NiO electrolyzer versus VOC of three-cell (A)CIGS modules with a maximum STH efficiency for the module with a VOC of 2.1 V and decreased for the lower and higher VOCs. A drastic decrease of the STH efficiency is seen for the system with lowest VOC (1.8 V), stemming from the fact that the intersection potential of the combined J–V curve of PV and catalytic load is not in the plateau region. Figure 8b shows the STH efficiency versus Jsc of the (A)CIGS modules. One can observe that the STH efficiency generally increases with increasing Jsc, however it is not maximum for the highest Jsc of ~12 mA cm−2 for the three-cell module system with the lowest band gaps (1.08 eV). This decrease is more drastic at room temperature as the catalyst load curve is then shifted towards higher potentials for a given photocatalytic current, while on par with the other modules at more elevated temperatures. Figure 8c shows the STH efficiency versus the module efficiency η . Except for the electrolyzer temperature of 60 °C, the highest and the lowest STH efficiencies were obtained with the (A)CIGS modules with the highest and the lowest efficiencies, respectively. An interesting point when analyzing the STH and module efficiency relation is that at high temperatures, of 60 °C, maximum STH was 13.33% using the module with the efficiency of 17.97%, which was not the highest PV efficiency. This corresponds to an electricity-to-fuel efficiency of slightly more than 74%.
The variation of STH efficiency with respect to E g is shown in Figure 8d for the (A)CIGS modules with different Ga composition and the electrolyzer at different temperatures. Maximum STH efficiencies were seen at mid-band gap values of the (A)CIGS modules at every temperature. The results showed that variation of the STH efficiency with E g was higher, about 4.5% unit variation, at lower temperatures while it was much lower, about 1.6% unit variation, at higher temperatures. The increase of STH efficiency for the lower E g system with temperature was, naturally, also more drastic as these are closer to the required overpotentials for the chosen catalyst system (NiMo–NiO). For the (A)CIGS with the lowest E g of 1.08 eV, STH efficiency increased from 8.44% to 12.27% with increasing temperature of the electrolyzer from 25 to 60 °C. STH efficiency for the (A)CIGS with the highest E g of 1.25 eV varied from 11.7% to 12%. There was no clear dependence of STH efficiency on the free energy loss from E g to VOC (Figure 8e), as calculated from Equation (3).
Table 2 summarizes the highest and the lowest STH efficiency and corresponding configuration of the module and electrolyzer in terms of E g of the module and temperature of the electrolyzer. The highest STH efficiency was 13.33% for the combination of (A)CIGS module with band gap energy of 1.15 eV and NiMo–NiO electrolyzer at 60 °C. As seen, while the lowest STH efficiencies were obtained with the module with the lowest E g of 1.08 eV, the highest STHs were obtained with the modules with a moderate E g of 1.17 eV for the electrolyzer temperatures of 25, 35, and 45 °C. For the electrolysis at 60 °C, the module with 1.25 eV gave the lowest STH efficiency.

5. Conclusions

In this study, optimal band gap and Ga content of (A)CIGS materials and the subsequently created modules were examined for solar water splitting systems with NiMo and NiO used as a cathode and anode catalysts, respectively. (A)CIGS modules consisting of three sub-cells, and Ga/(Ga + In) ratios were varied between 0.23 and 0.47. Water electrolysis was performed using NiMo–NiO as catalysts at different temperatures between 25 and 60 °C, a temperature range that would be available by thermal exchange between the PV and electrolyzer parts. The magnitude of the thermal exchange would depend on the precise device design and choice between natural of pumped flow of heat exchange. The band gap of the sub-cells of the (A)GIGS modules varied from 1.08 to 1.25 eV with different Ga ratios. The efficiencies of the (A)CIGS modules were between 16.44% for the lowest band gap and 19.04% for 1.17 eV. The highest STH was 13.33% for the combination of the (A)CIGS module with band gap energy of 1.15 eV and NiMo–NiO electrolyzer at 60 °C. STH efficiency increased with increasing temperature and it was more remarkable for the lower band gap (A)CIGS as these were closest in photovoltage to the chosen catalyst system. The results show that the improved performance for a thermally coupled system is relatively small (12.98% STH at 25 °C to 13.33% STH at 60 °C) if suitable bandgap matching is performed with respect to the catalyst system, while a larger temperature effect is seen for systems with operating voltages closer to the minimum requirements of the catalysts (8.44% STH at 25 °C to 12.27% STH at 60 °C). In general, the results show that usage of cost-effective and stable thin-film PV materials and earth-abundant catalysts can provide STH efficiencies beyond 13%, even with PV modules with modest efficiency.

Author Contributions

Conceptualization, T.E.; methodology, T.E.; investigation T.E., İ.B.P., L.S., and M.E.; data analysis: T.E. and İ.B.P.; writing—original draft preparation, T.E. and İ.B.P.; writing—review and editing, T.E., İ.B.P., L.S. and M.E.; funding acquisition, T.E., L.S. and M.E.; resources, T.E., L.S. and M.E.

Funding

We gratefully acknowledge financial support for the "PECSYS" project which has received funding from the Fuel Cells and Hydrogen 2 Joint Undertaking under grant agreement No 735218, supported by the European Union (Horizon 2020), Hydrogen Europe and N. ERGHY. We also acknowledge the Swedish energy agency and the Swedish research council (grant No 2015-03814) for financing support.

Conflicts of Interest

The authors declare no conflict of interest.

References

  1. Deiman, J.R.; van Troostwijk, A.P. Lettre à M. de la Mètherie, sur une manière de dècompose l’eau en air inflammable et en air vital. J. Phys. Chim. L’hist. Nat. 1789, 35, 369–378. [Google Scholar]
  2. Kreuter, W.; Hofmann, H. Electrolysis: The important energy transformer in a world of sustainable energy. Int. J. Hydrogen Energy 1998, 23, 661–666. [Google Scholar] [CrossRef]
  3. Fujishima, A.; Honda, K. Electrochemical Photolysis of Water at a Semiconductor Electrode. Nature 1972, 238, 37–38. [Google Scholar] [CrossRef] [PubMed]
  4. Jacobsson, T.J.; Fjällström, V.; Edoff, M.; Edvinsson, T. Sustainable solar hydrogen production: From photoelectrochemical cells to PV-electrolyzers and back again. Environ. Sci. 2014, 7, 2056–2070. [Google Scholar] [CrossRef]
  5. Jacobsson, T.J.; Platzer-Bjorkman, C.; Edoff, M.; Edvinsson, T. CuInxGa1−xSe2 as an efficient photocathode for solar hydrogen generation. Int. J. Hydrogen Energy 2013, 38, 15027–15035. [Google Scholar] [CrossRef]
  6. González-Borrero, P.P.; Sato, F.; Medina, A.N.; Baesso, M.L.; Bento, A.C.; Baldissera, G.; Persson, C.; Niklasson, G.A.; Granqvist, C.G.; da Silva, A.F. Optical band-gap determination of nanostructured WO3 film. Appl. Phys. Lett. 2010, 96, 061909. [Google Scholar] [CrossRef]
  7. Zhao, Z.; Li, Z.; Zou, Z. Electronic structure and optical properties of monoclinic clinobisvanite BiVO4. Phys. Chem. Chem. Phys. 2011, 13, 4746–4753. [Google Scholar] [CrossRef] [PubMed]
  8. Dette, C.; Pérez-Osorio, M.A.; Kley, C.S.; Punke, P.; Patrick, C.E.; Jacobson, P.; Giustino, F.; Jung Jung, S.; Kern, K. TiO2 Anatase with a Bandgap in the Visible Region. Nano Lett. 2014, 14, 6533–6538. [Google Scholar] [CrossRef] [PubMed]
  9. Edvinsson, T. A concentrated effort. Nat. Energy 2019, 4, 354–355. [Google Scholar] [CrossRef]
  10. Jacobsson, T.J.; Fjällström, V.; Edoff, M.; Edvinsson, T. A theoretical analysis of optical absorption limits and performance of tandem devices and series interconnected architectures for solar hydrogen production. Sol. Energy Mater. Sol. Cells 2015, 138, 85–95. [Google Scholar] [CrossRef]
  11. Luo, J.; Im, J.H.; Mayer, M.T.; Schreier, M.; Nazeeruddin, M.K.; Park, N.G.; Tilley, S.D.; Fan, H.J.; Graetzel, M. Water Photolysis at 12.3% Efficiency via Perovskite Photovoltaics and Earth-Abundant Catalysts. Science 2014, 345, 1593–1596. [Google Scholar] [CrossRef] [PubMed]
  12. Cox, C.R.; Lee, J.Z.; Nocera, D.G.; Buonassisi, T. Ten-percent solar-to-fuel conversion with nonprecious materials. Proc. Natl. Acad. Sci. USA 2014, 111, 14057–14061. [Google Scholar] [CrossRef] [PubMed] [Green Version]
  13. Lundberg, O.; Edoff, M.; Stolt, L. The effect of Ga-grading in CIGS thin film solar cells. Thin Solid Film 2005, 480–481, 520–525. [Google Scholar] [CrossRef]
  14. Edoff, M.; Jarmar, T.; Nilsson, N.S.; Wallin, E.; Hogstrom, D.; Stolt, O.; Lundberg, O.; Shafarman, W.; Stolt, L. High Voc in (Cu,Ag)(In,Ga)Se2 Solar Cells. IEEE J. Photovolt. 2017, 7, 1789–1794. [Google Scholar] [CrossRef]
  15. Larsson, F.; Nilsson, N.S.; Keller, J.; Frisk, C.; Kosyak, V.; Edoff, M.; Törndahl, T. Record 1.0 V open-circuit voltage in wide band gap chalcopyrite solar cells. Prog. Photovolt. Res. Appl. 2017, 25, 755–763. [Google Scholar] [CrossRef] [Green Version]
  16. Shockley, W.; Queisser, H.J. Detailed balance limit of efficiency of p–n junction solar cells. J. Appl. Phys. 1961, 32, 510–519. [Google Scholar] [CrossRef]
  17. Weber, M.F.; Dignam, M.J. Efficiency of splitting water with semiconducting photoelectrodes. J. Electrochem. Soc. 1984, 131, 1258–1265. [Google Scholar] [CrossRef]
  18. Donzel-Gargand, O.; Larsson, F.; Törndahl, T.; Stolt, L.; Edoff, M. Secondary phase formation and surface modification from a high dose KF-post deposition treatment of (Ag,Cu)(In,Ga)Se2 solar cell absorbers. Prog. Photovolt. Res. Appl. 2019, 27, 220–228. [Google Scholar] [CrossRef]
Figure 1. (a) General scheme for the relation between photoelectrochemical (PEC) and photovoltaic (PV)-electrolysis, where designs from i to vi can be utilized for thermally integrated approaches while vii requires an externally driven flow system. Adapted with permission from [4], The Royal Society of Chemistry, 2014. (b) A schematic illustration of integrated solar driven electrolysis using normal or concentrated solar light and thermally coupled functions in layer D and F.
Energies 12 04064 g001
Figure 2. Schematic picture of band bending of (a) p-type semiconductor material in contact with an alkaline electrolyte, (b) band bending in a solid-state p–n-homojunction, and (c) valence band (VB) and conduction band (CB) edge energies of CuInGaSe2 (CIGS) with the different Ga/Ga + In ratios used in this study (without contact material).
Energies 12 04064 g002
Figure 3. (a) Schematic picture of the ((Ag),Cu)(In,Ga)Se2 ((A)CIGS) p–n-heterojunction with ZnO:Al using a CdS buffer layer (layers not in relative scale) and (b) cross-section SEM picture of the stack.
Energies 12 04064 g003
Figure 4. (a) External quantum efficiency (EQE) for the (A)CIGS with different Ga/(Ga + In) ratios, (b) E g versus Ga/(Ga + In).
Energies 12 04064 g004
Figure 5. Current density versus potential for three-cell (A)CIGS modules with different band gap energies of the sub-cells and the load curve for the NiMo–NiO electrolyzer at different temperatures.
Energies 12 04064 g005
Figure 6. E g dependence of (a) V O C , (b) J S C , (c) η , and (d) F F for three-cell (A)CIGS modules.
Energies 12 04064 g006
Figure 7. Solar-to-hydrogen (STH) variation with the temperature of the NiMo–NiO electrolyzer for different E g of the (A)CIGS module.
Energies 12 04064 g007
Figure 8. STH efficiency of the (A)CIGS–NiMo–NiO PV electrolyzer versus (a) V O C , (b) j s c , (c) η , (d) E g , and (e) η s e p of the PV modules at different temperatures of the electrolyzer.
Energies 12 04064 g008
Table 1. Ga/(Ga + In) ratio and E g of (A)CIGS.
SampleGa/(Ga + In) E g   ( eV )
CIGS0.231.08
ACIGS0.291.15
ACIGS0.321.17
ACIGS0.361.19
CIGS0.401.16
ACIGS0.421.22
ACIGS0.441.24
ACIGS0.471.25
Table 2. The highest and the lowest STH efficiencies for (A)CIGS–NiMo–NiO solar water splitting systems together with corresponding E g of (A)CIGS modules for different temperature of the NiMo–NiO electrolyzer.
Temperature (°C) S T H m a x   ( % ) E g (eV) S T H m i n (%) E g (eV)
2512.981.178.441.08
3513.221.1711.061.08
4513.251.1711.641.08
6013.331.1511.661.25

