1. Introduction
In an effort to mitigate the adverse effects of global climate change, international climate goals were defined in the Paris Agreement of 2015. These goals aim to keep the increase in the global average temperature below 2 °C and aim for no more than 1.5 °C above pre-industrial levels [
1]. To accomplish this tremendous task, it is essential that the global energy system transitions from its dependence on fossil fuels like oil, coal, and natural gas to a basis in renewable energy (RE) sources like solar, wind, or hydropower. The electrification of the power sector—which contributes about 25% of climate change-inducing greenhouse gas (GHG) emissions [
2]—and the transportation sector (14%) [
2] is regarded as a key approach to meeting national GHG reduction goals. Accordingly, RE-based electricity generation must be considerably increased so as to ultimately replace chemical energy carriers. For example, by 2030, up to 50% of electricity production in the European Union (EU) will need to come from RE in order to meet the climate goal of reducing GHG emissions to 55% of 1990 levels by that time [
3].
While the global potential of hydropower has already been largely exploited, continuous growth is expected in wind turbine and photovoltaic system installations [
3]. In 2018, electricity production from PV was able to provide 7.6% of the overall electricity demand in Germany, while globally only about 3% was provided by this technology [
4]. The European Commission determines that an increase in installed PV capacity in the EU from 94.7 GW
p in 2015 to 320.5 GW
p in 2030, and ranging from 492.6 to 1029.8 GW
p in 2050 (subject to various scenarios) is essential if climate goals are to be met [
5].
The intermittent and difficult to predict nature of RE power generation necessitates the deployment of (large-scale) energy storage, as neither the availability nor the demand for energy would otherwise be controllable. Energy storage makes grid load management possible, and the baseload capacity of conventional power plants can be substituted in energy systems with high RE shares. Flexibility of energy storage technology is vital because of the typical variable power inputs of solar and wind.
In this paper, an optimized technique for directly coupling electrolyzers to PV panels is described, which allows for the off-grid production of storable hydrogen and does not require additional electric infrastructure, thus reducing conversion and transport losses.
As can be seen in
Table 1, the demonstration projects built in the 1990s mainly used alkaline electrolysis (AEL), while, more recently, polymer electrolyte membrane (PEM) systems were more frequently tested. The main arguments for alkaline electrolysis are its use of precious metal-free electro catalysts and lower overall system costs compared to PEM electrolysis technology. For this reason, the fact that that the hazardous alkaline media is not easy to handle because of its corrosive and toxic nature it is often ignored. However, when electrolysis is integrated into the PV panel or close to it, this must be considered due to complex piping systems and the high risk of leakages in the numerous connections. Furthermore, only a low amount of precious metals is necessary in PEM electrolysis systems due to their higher power density, making the economic advantage small, in our opinion. For this reason, we focus our development efforts on PEM electrolysis for coupling electrolyzers to PV panels.
Today, three techniques for combining PV with electrolysis are available [
3,
23,
24,
25]. The first is to couple PV panels via DC/DC or DC/AC and AC/DC power electronics to the electrolysis system. The second is to dimension the electrolysis configuration in such a way that no additional electronic converters are necessary and the voltage and current values are matched to the PV panel. The latter will be discussed in this paper. The third concept is to adapt PV and electrolysis in terms of voltage and current and to integrate both devices into the PV panel’s housing. These integrated systems will need to deal with the challenge of reliably sealing the system for long periods of time. Pressurized operation is very difficult to achieve because of the use of brittle glass plates. Furthermore, the setup can be destroyed if the water inside the modules is at low a temperature, for example, during winter, and turns into ice. Thus, the development of these integrated systems is one of the topics within the technology demonstration project of large scale photo-electrochemical system for solar hydrogen production (PECSYS). When it is possible to deploy a reliable system within a PV panel, this approach has the best chance for use in low-cost, solar electric hydrogen converters. However, in terms of reliability, these systems indicate further need for development.
Due to the difficulties with fully integrated systems, it is also interesting to analyze the direct coupling of two separate devices and to study their behavior in operation. In this paper, we show how the dimensioning affects the performance and efficiency, and which boundary conditions must be considered (e.g., temperature of the cell). To validate the theoretical dimensioning, a special PEM electrolysis setup was developed that features a media supplied only by the cathode and low catalyst loading to reduce the investment costs. All components were tested in a sun simulator under typical conditions of outdoor photovoltaic-electrolysis (PV-EC) systems in mid-Europe.
2. System Setup and Dimensioning
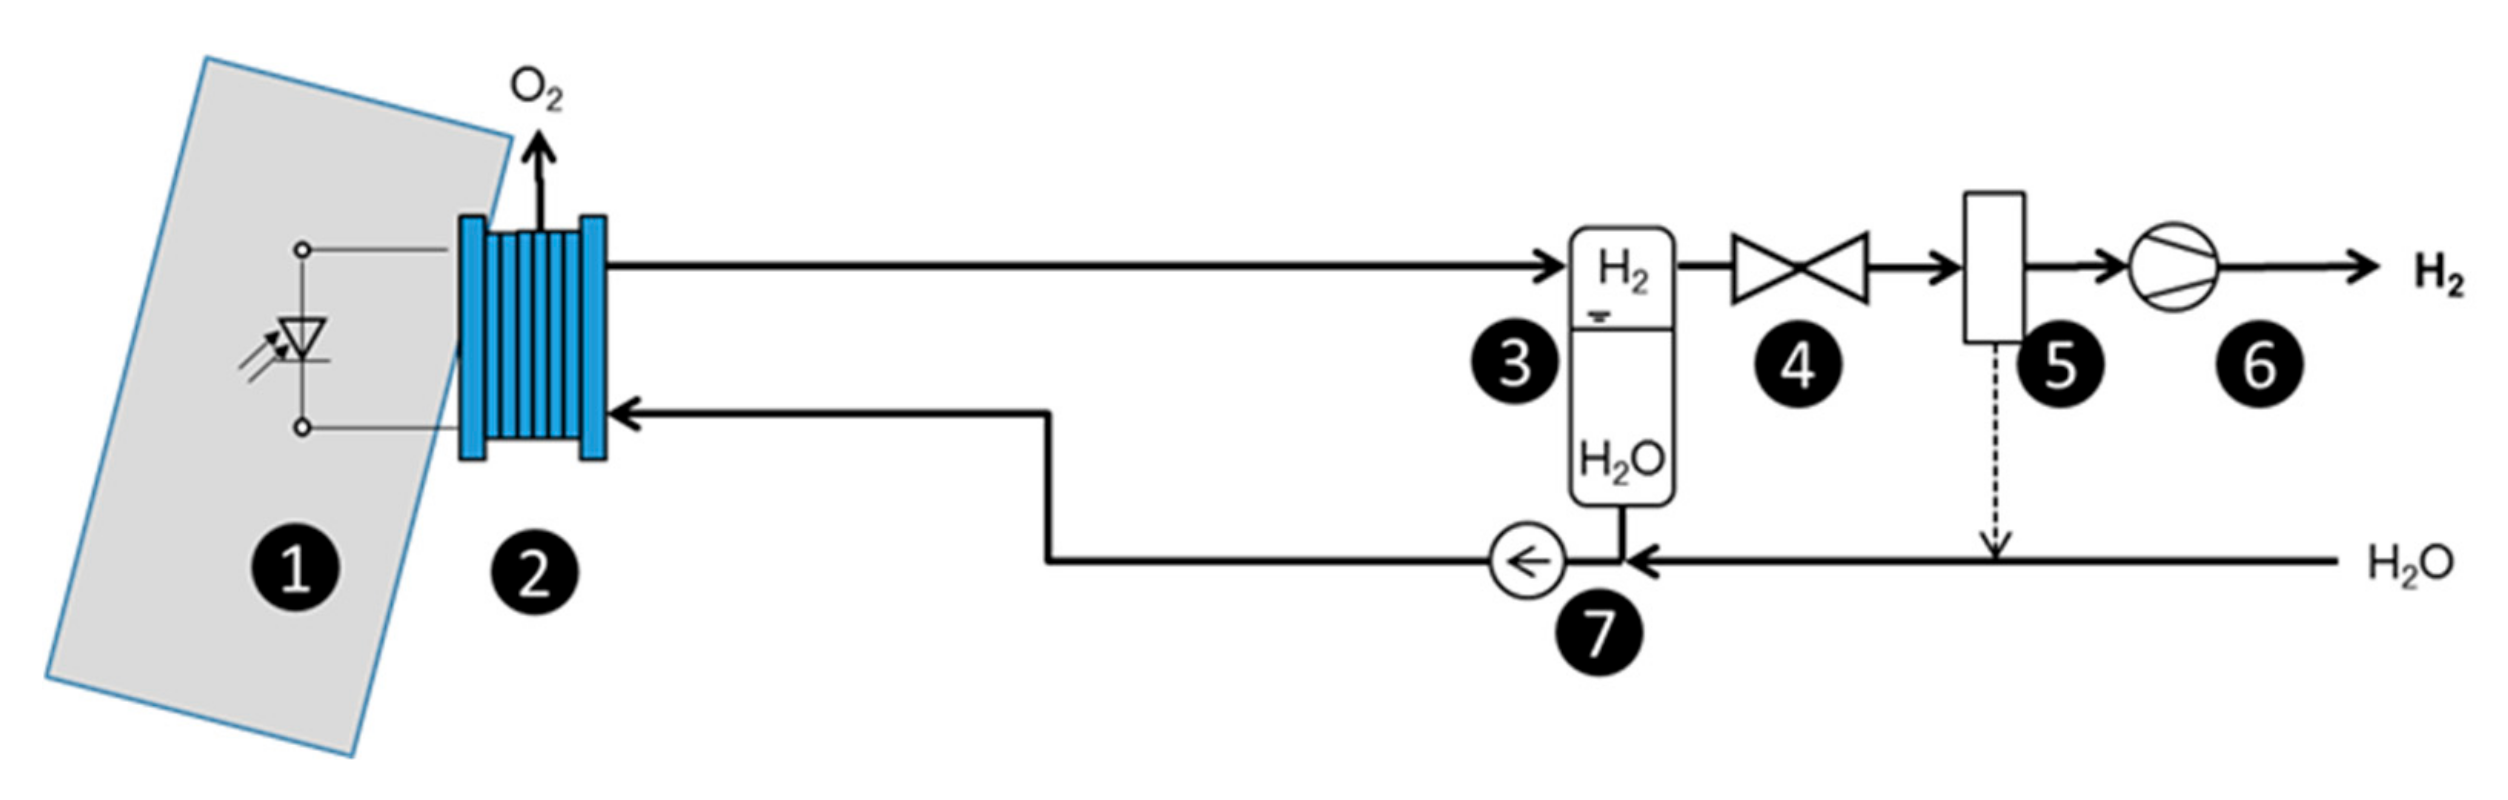
In conventional electrolyzers, both sides (anode and cathode) are supplied with water. This means that, in addition to the pumps, tubes, gas separators, and vessels are also necessary for each gas evolution. However, such a setup is highly complex if several of these systems are combined. Therefore, the goal is to reduce the complexity by simplifying the system. An alternative setup has been developed in order to optimize the water supply in the cell and reduce electrolysis system costs [
26]. With this optimization, only the cathode side is fed with water; the water for supplying the anode side is provided by the diffusion of water through the membrane from the cathode. The principle of the entire setup is shown in
Figure 1.
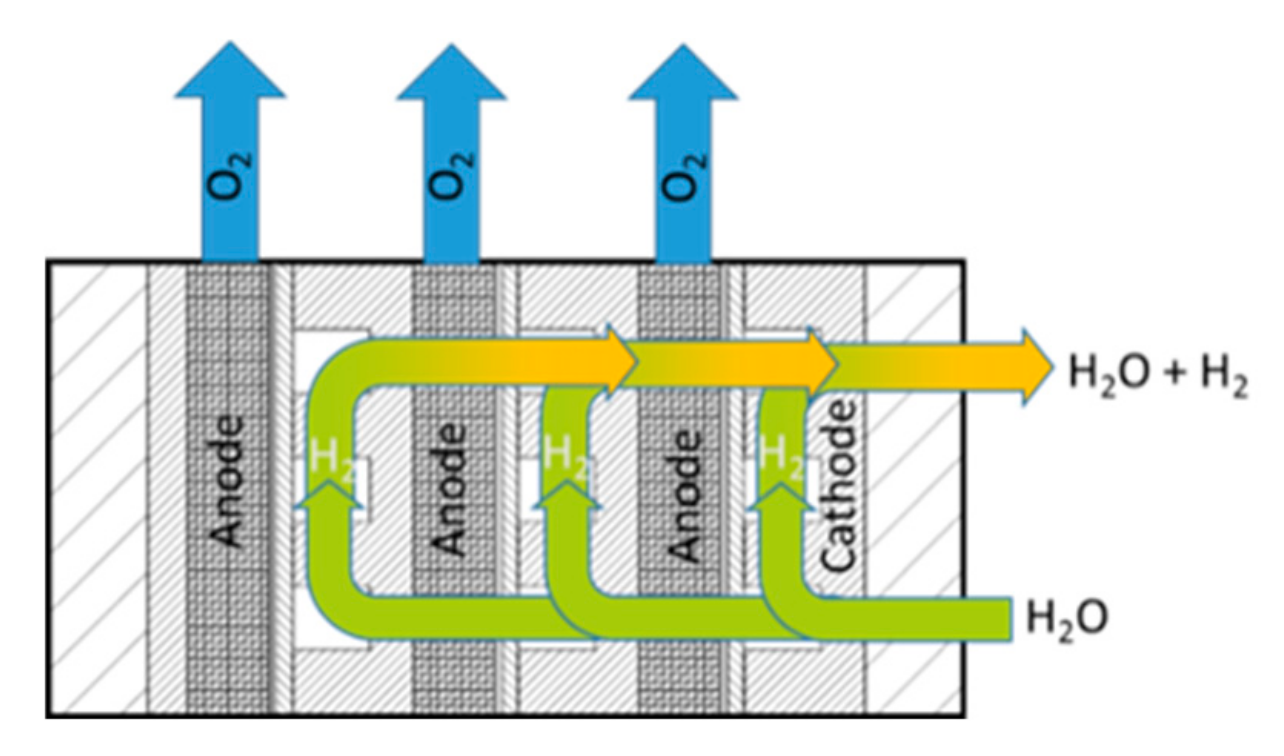
In the optimized setup, only one pump is needed to supply the system with the necessary water. A further benefit of the advanced setup is the easier way to produce pressurized hydrogen it offers by means of the electrochemical conversion. The higher differential pressure increases the crossover of hydrogen in the membrane, and this can lead to explosive hydrogen and oxygen mixtures at the anode of conventional systems. When the generated oxygen is directly released from the cell into the environment, no dangerous mixtures of oxygen and hydrogen can accumulate, and the system also remains secure under pressurized operation. This is a considerable advantage, as in this case, the safety treatment for gas crossover is negligible. For this approach, the easiest way to release the oxygen is over the edges of the anodic cell diffusion layer, as shown in
Figure 2. The blue arrows indicate how the generated oxygen can directly leave the cell over the edges of the expanded mesh.
The closer the electrolysis stack is located to the PV panel, the more the electrolysis must operate under the temperature conditions of an outdoor location or in a PV panel if no thermal insulation is used. High temperatures are not critical for electrolysis (the higher the temperature, the better the performance), but electrolysis must be stable at low temperatures. This is especially important when it comes to the phase transition of liquid water into ice, when the density decreases, leading to additional forces in the setup. In planning a 10 m2 setup in Jülich, Germany, we checked the local temperature extrema. Over the past 60 years, the minimum was an average of −20 °C in Jülich (coordinates: 50°55′ N, 6°21′ E), which is a good reference value for locations in central Europe. Thus, the system must withstand temperatures as low as minus twenty degrees.
On the other hand, the maximum temperature that will be achieved in the PV panel during the summer is another important factor that has an influence on its performance and efficiency. Therefore, it is necessary to know the temperature in the PV panel during periods of high radiation and high ambient temperatures. The temperature in the cell can be estimated by the following equation that was introduced by Ross [
27]:
is the solar cell and is the ambient temperature in °C, while is the nominal operation cell temperature at 20 °C ambient temperature, an irradiance of 800 W/m2, a wind velocity of 1 m/s, and an open backside of the panel. is the solar irradiance in W/m2.
The NOCT factor is given in the data sheet of the PV panel we plan to use (Solibro Cu(In,Ga)Se
2 (Copper indium gallium selenide (CIGS))) with
NOCT:= 51 °C +/−2 °C. The daily average temperature values for the month of July were derived from Sprenger [
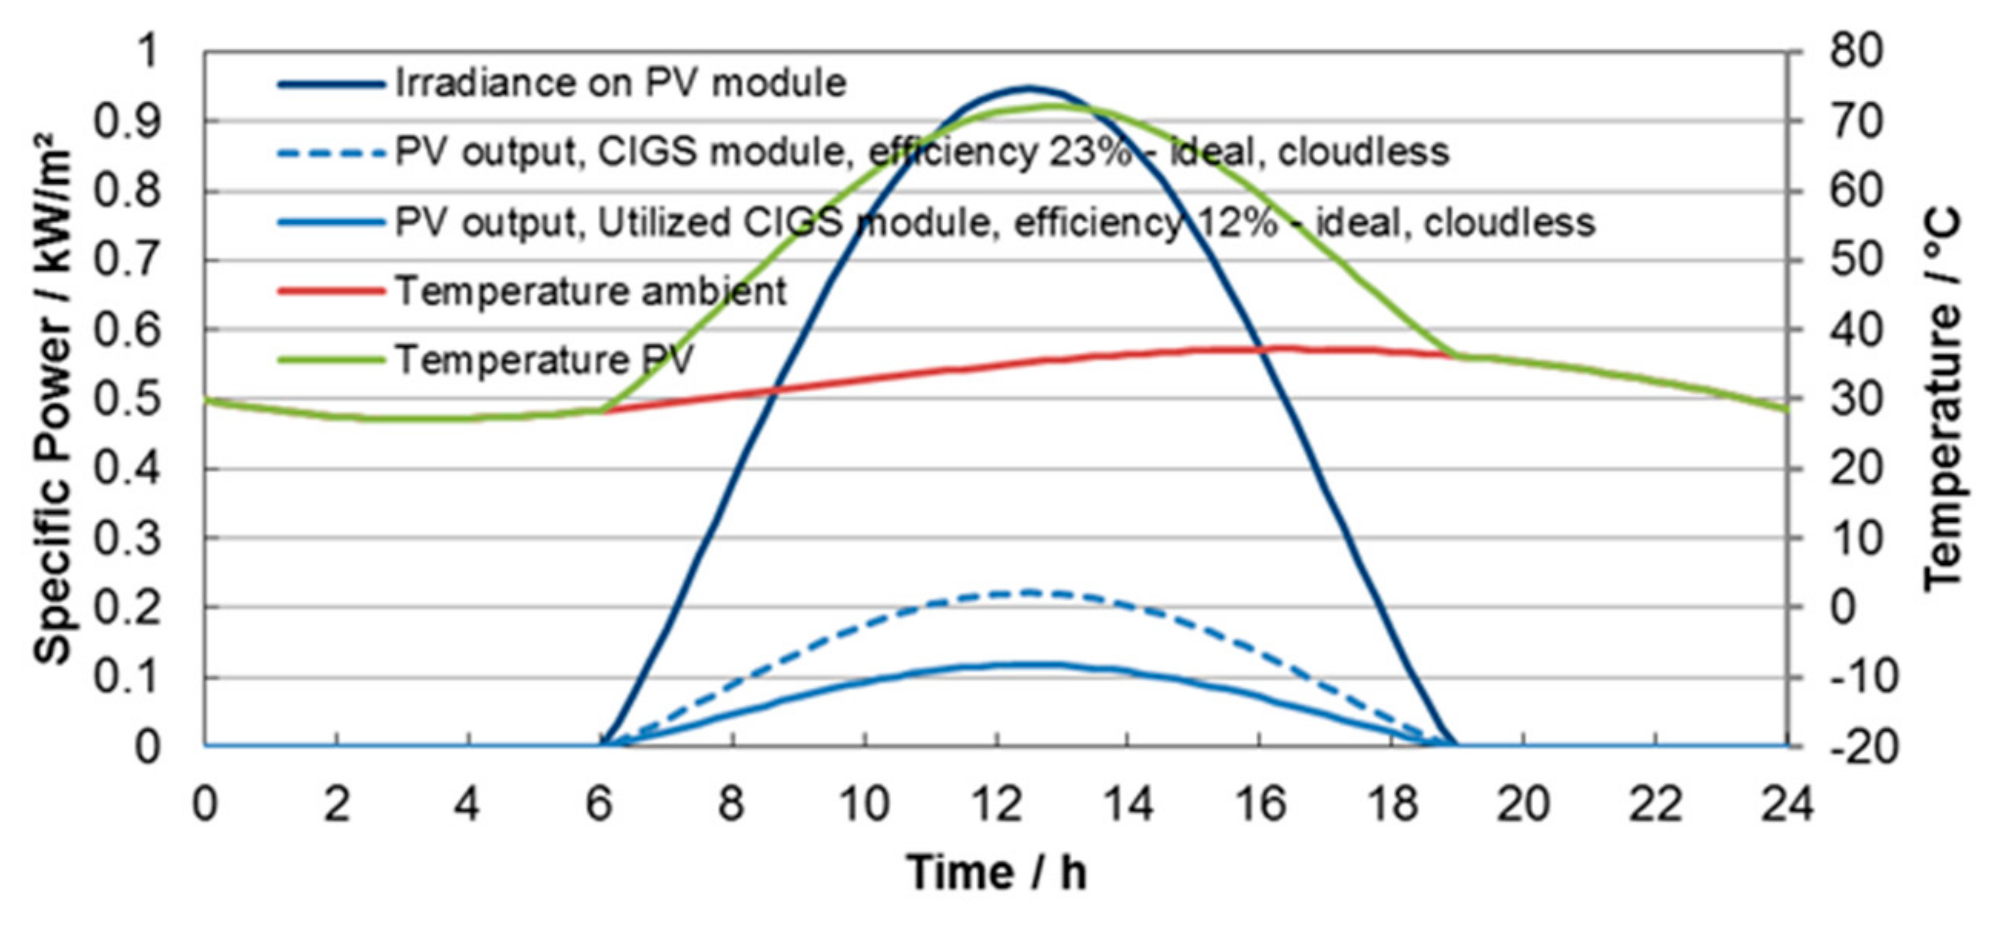
28], and the temperature in the PV panel was calculated with the Ross equation. All data are collected and presented in
Figure 3. Here, we consider irradiation in a PV panel that is oriented in a southerly direction and with a tilt angel of 35°. Both electrical output curves consider a constant efficiency that is not affected by the temperature.
For the experimental part, we can extract from these curves typical radiation values as well as the expected temperatures in the PV panel and electrolysis cell. Average temperatures in the PV panel are up to 60 °C in July and, if we assume a very hot day with a 37 °C maximum temperature (see
Figure 3), temperatures in the panel will be in the range of 72 °C.
3. Experimental
The performances of the utilized PV module and electrolyzer were evaluated individually in different tests. Following these single tests, the components were coupled and tested together.
3.1. Performance of Photovoltaics
For performance testing, a sun simulation device was used—the SolarConstant 4000/2500 system (ATLAS Material Testing Solutions, Linsengericht-Altenhaßlau, Germany). The irradiance was in the range of 1000 W/m2 and the test surface was 2 spotlights 2000 × 1000 mm2 (designed with 8 spotlights: 2000 × 2000 mm2). The spectral radiation distribution was similar to global radiation according to the global standard spectrum (AM1.5G), with a homogeneity of irradiance on the test surface of +/−3%.
The temporal stability of irradiance with regard to mains fluctuations and lamp characteristics was +/−1%. The intensity control of the lamps was 50–100%, while the control of the lamp field was performed manually. With this device, the performance of the PV cell could be monitored under reproducible conditions. Also, the thermal behavior was absolutely reproducible and controllable.
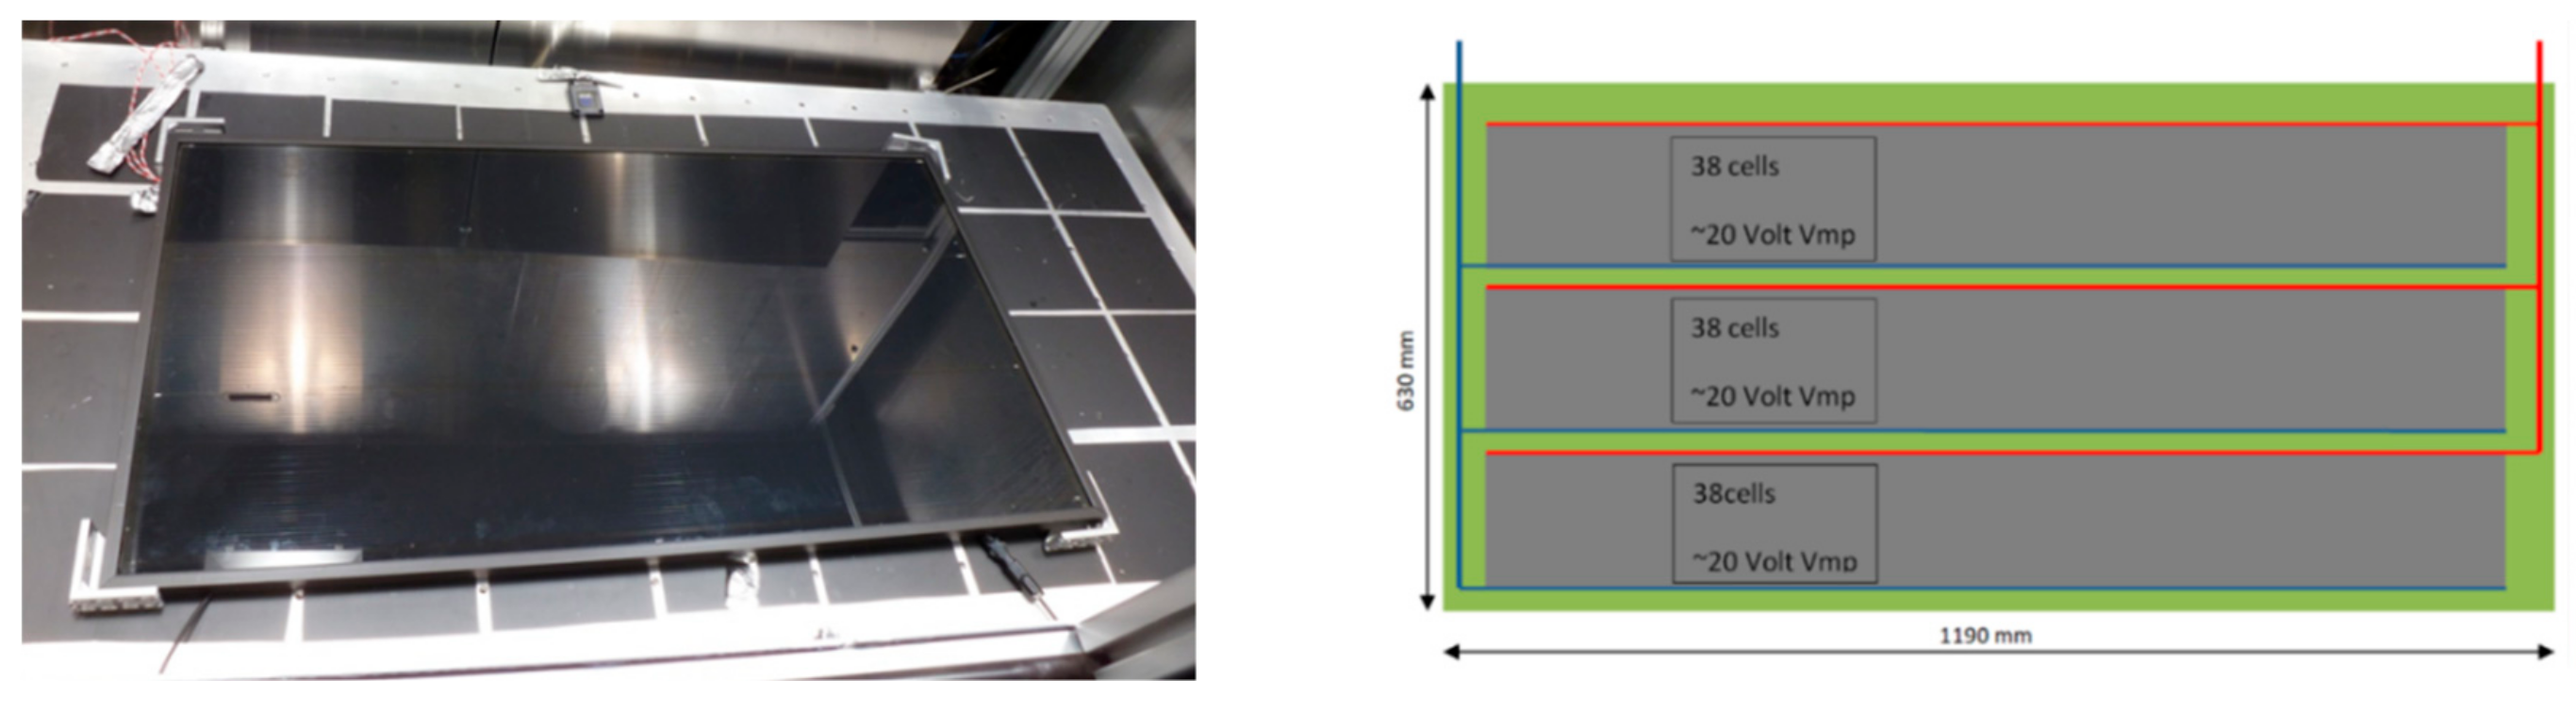
A specially configured PV panel with an active area of 0.74 m
2, made by Solibro Research AB, was also utilized in this study. The Solibro CIGS PV module (Solibro Research AB, Uppsala, Sweden) has a new electrical connection that is optimized for supplying electricity to a PEM electrolyzer for generating hydrogen from pure water. In this configuration, 38 cells were connected in series in three strands so that the panel had an effective voltage of around 20 volts, the conventional panels had a higher voltage of around 80 volts and a lower current.
Figure 4 shows the PV panel mounted in the sun simulator (left) and the electrical serial connection of 38 cells in three parallel strands (right).
3.2. Performance of PEM Electrolysis
The performance of electrolysis is affected by the catalyst material and the catalyst loading of the electrodes. At the anode, an iridium-based catalyst is used, while at the cathode, platinum-based catalysts are used. Furthermore, the Ohmic losses within the electrolyte dominate the performance. To keep these losses low, it is advantageous to use thin membranes. However, the operating conditions, especially the operating temperature, considerably influence the performance.
To evaluate the performance and reduce the amount of precious metals used, new catalyst-coated membranes with low catalyst loading and low proton transport resistance have been developed. On the cathode side, a carbon paper from Toray was used as the diffusion medium. The catalyst-coated membrane (CCM) was a Nafion 212 membrane (Chemours Company, Fayetteville, USA) with a thickness of 50 µm. The amount of catalyst was reduced from the standard loading of 2 mg/cm2 iridium oxide on the anode side and 0.7 mg/cm2 platinum on the cathode side to the values of 0.38 mg/cm2 for iridium oxide and 0.13 mg/cm2 for platinum.
These CCMs, with an active area of 42 × 42 mm2, were tested in a test cell, with stainless steel end plates and titanium flow structures. The cell was heated with two heating tubes and the temperature was measured by thermocouples. To ensure a precise measurement of the cell voltage, the cables were located separately from the power supply cables. For the water supply and the removal of the evolved gases, a meander followed the inlet connectors with a channel depth and width of 1.5 mm, respectively. The cells were operated at different temperatures while the cell voltage for given currents was monitored.
Within the same setup, the influence of subzero temperatures on the electrolyzer’s performance was analyzed. Therefore, the cell was stored for a defined period at freezing temperatures and, after this, the cell was characterized using the conventional electrochemical test stations.
For the planed 10 m
2 demonstration system, the cell setup introduced in [
26] was further modified for the direct coupling of PV and EC. In
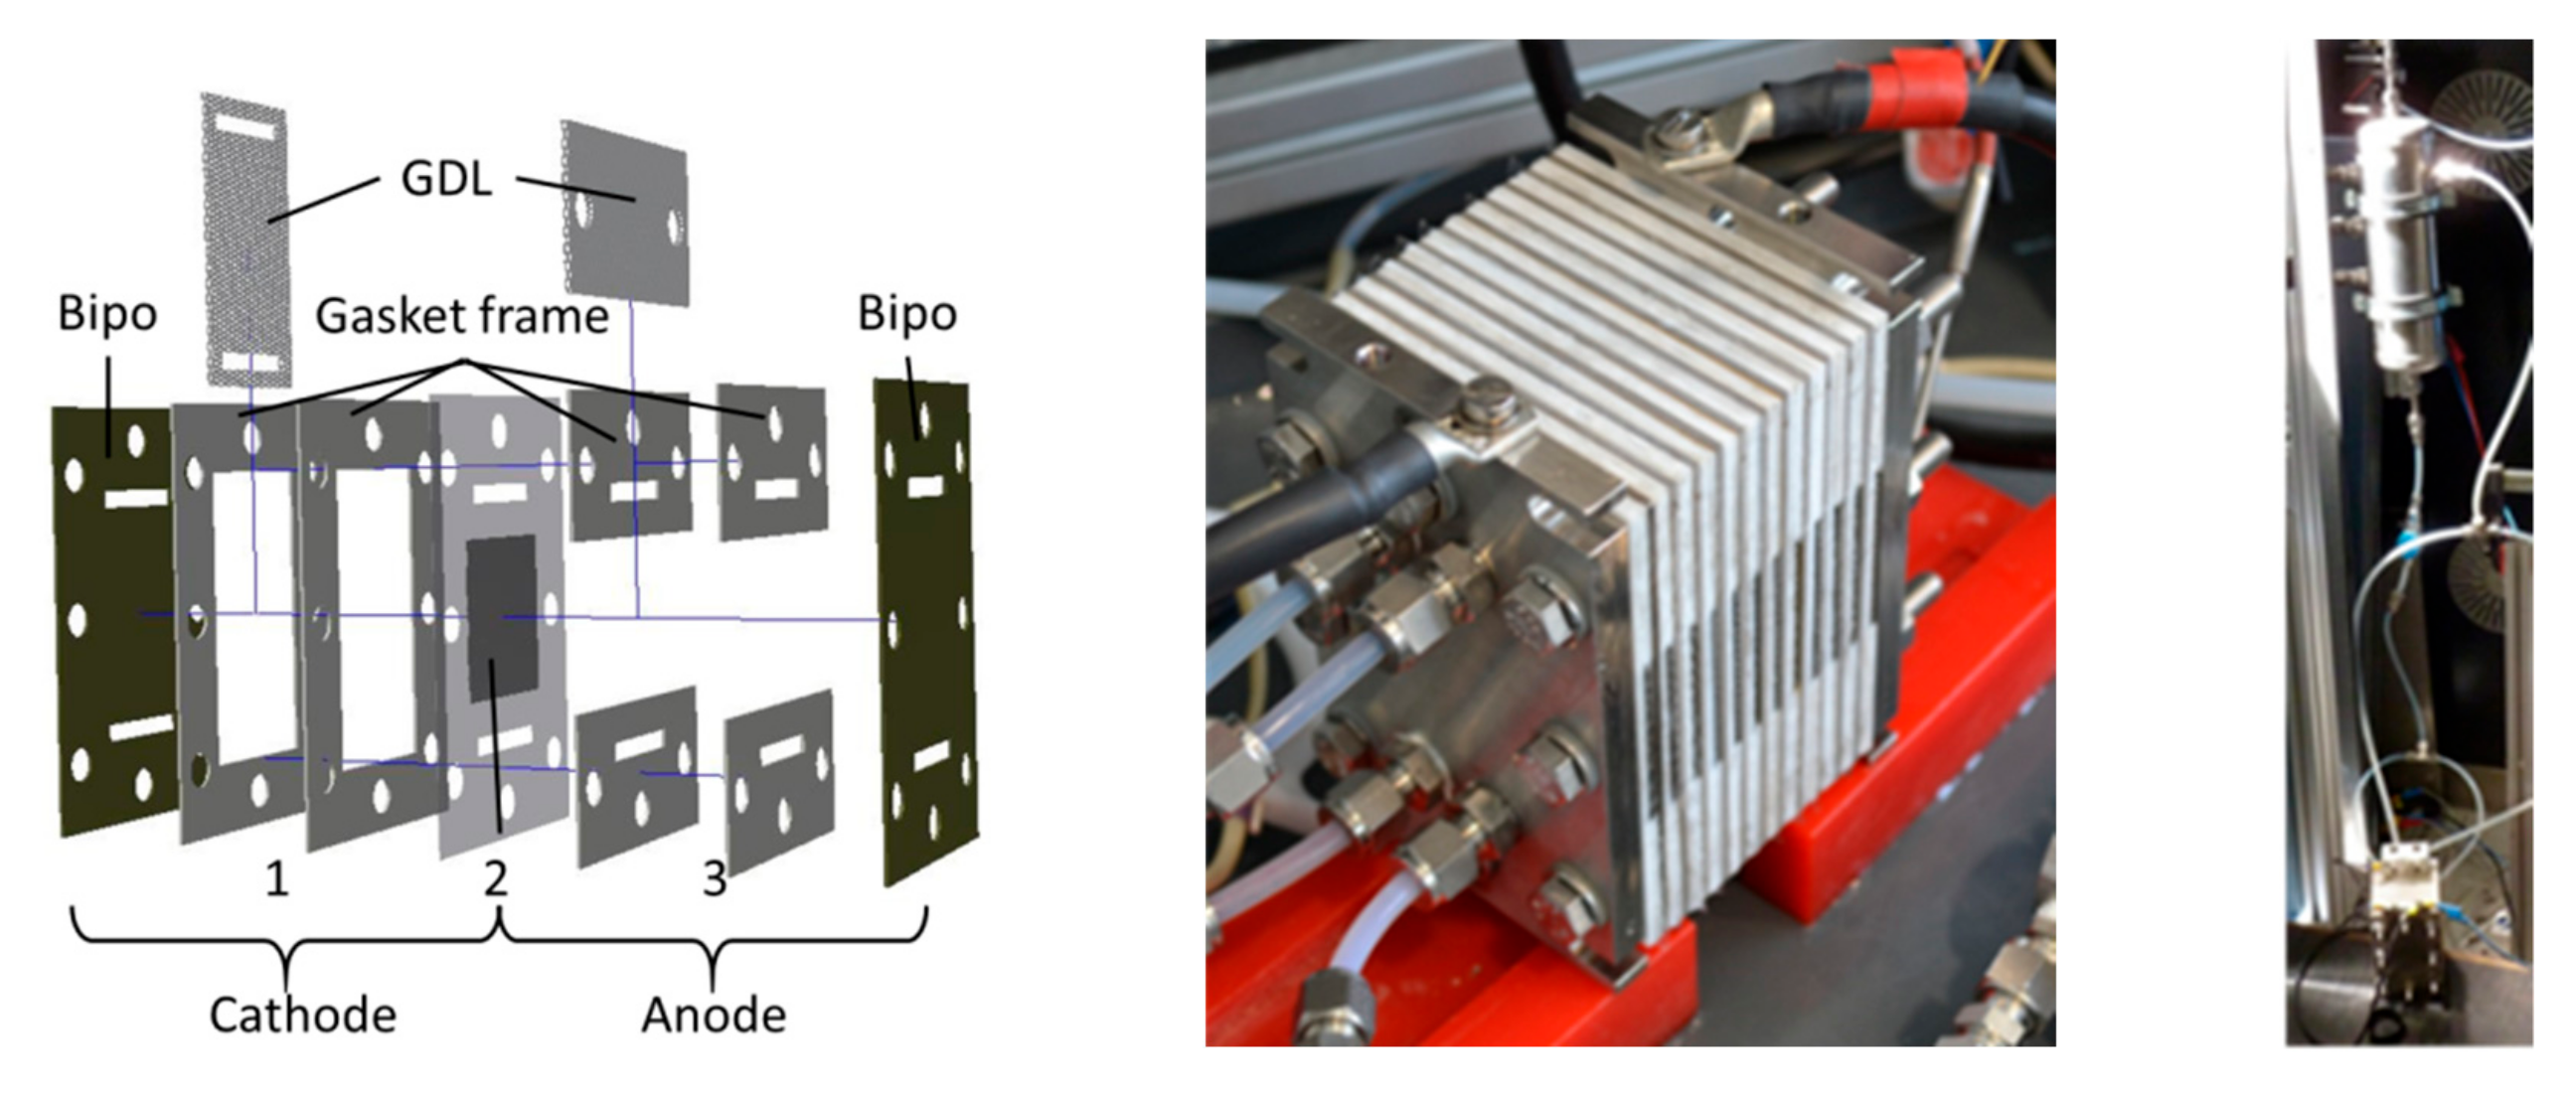
Figure 5, both the cell (left) and stack (right) setups are presented. The left part shows the cathodic media supply components (1), followed by the CCM (2) and the anodic flow structure (3) for removing the oxygen generated. The gas diffusion layers (GDLs) are porous gas and water distributers and they are also important for the electrical connection of the CCM. To be corrosion resistant they are made of expanded titanium sheets. The gaskets used in the stack are made of Polytetrafluoroethylene (PTFE), and the bipolar plate (Bipo) is made of titanium too.
The stack setup can be adapted to the PV panel by adding or removing cells. The active area of each cell in the stack is, at ~17.64 cm2, relatively low. By operating two stacks in parallel or by connecting two of the PV panels in parallel, the devices (PV-EC) can be adapted.
3.3. Characterization of Coupled Devices
The Solibro CIGS PV module is used for supplying electricity to an electrolyzer for hydrogen generation from pure water. For electrolysis, a cassette design stack, shown in
Figure 5, is used. Both devices feature direct electrical coupling, with the operational performance determined in the sun simulator.
The PV was coupled to a 12-cell electrolysis cassette and operated without a water circulation pump. Thus, the water supply and gas separation were both enabled by gravity; this is possible if the connecting tubes show a steady monotonous gradient and the gas separator is located above the electrolysis cassette. In this configuration, no active media supply was needed, and the amount of hydrogen produced gave a direct measure of the system’s efficiency.
4. Results
4.1. Performance of Photovoltaics
The PV panel is characterized in the sun simulator with a radiation of 1000 W/m
2. The polarization plot is given in
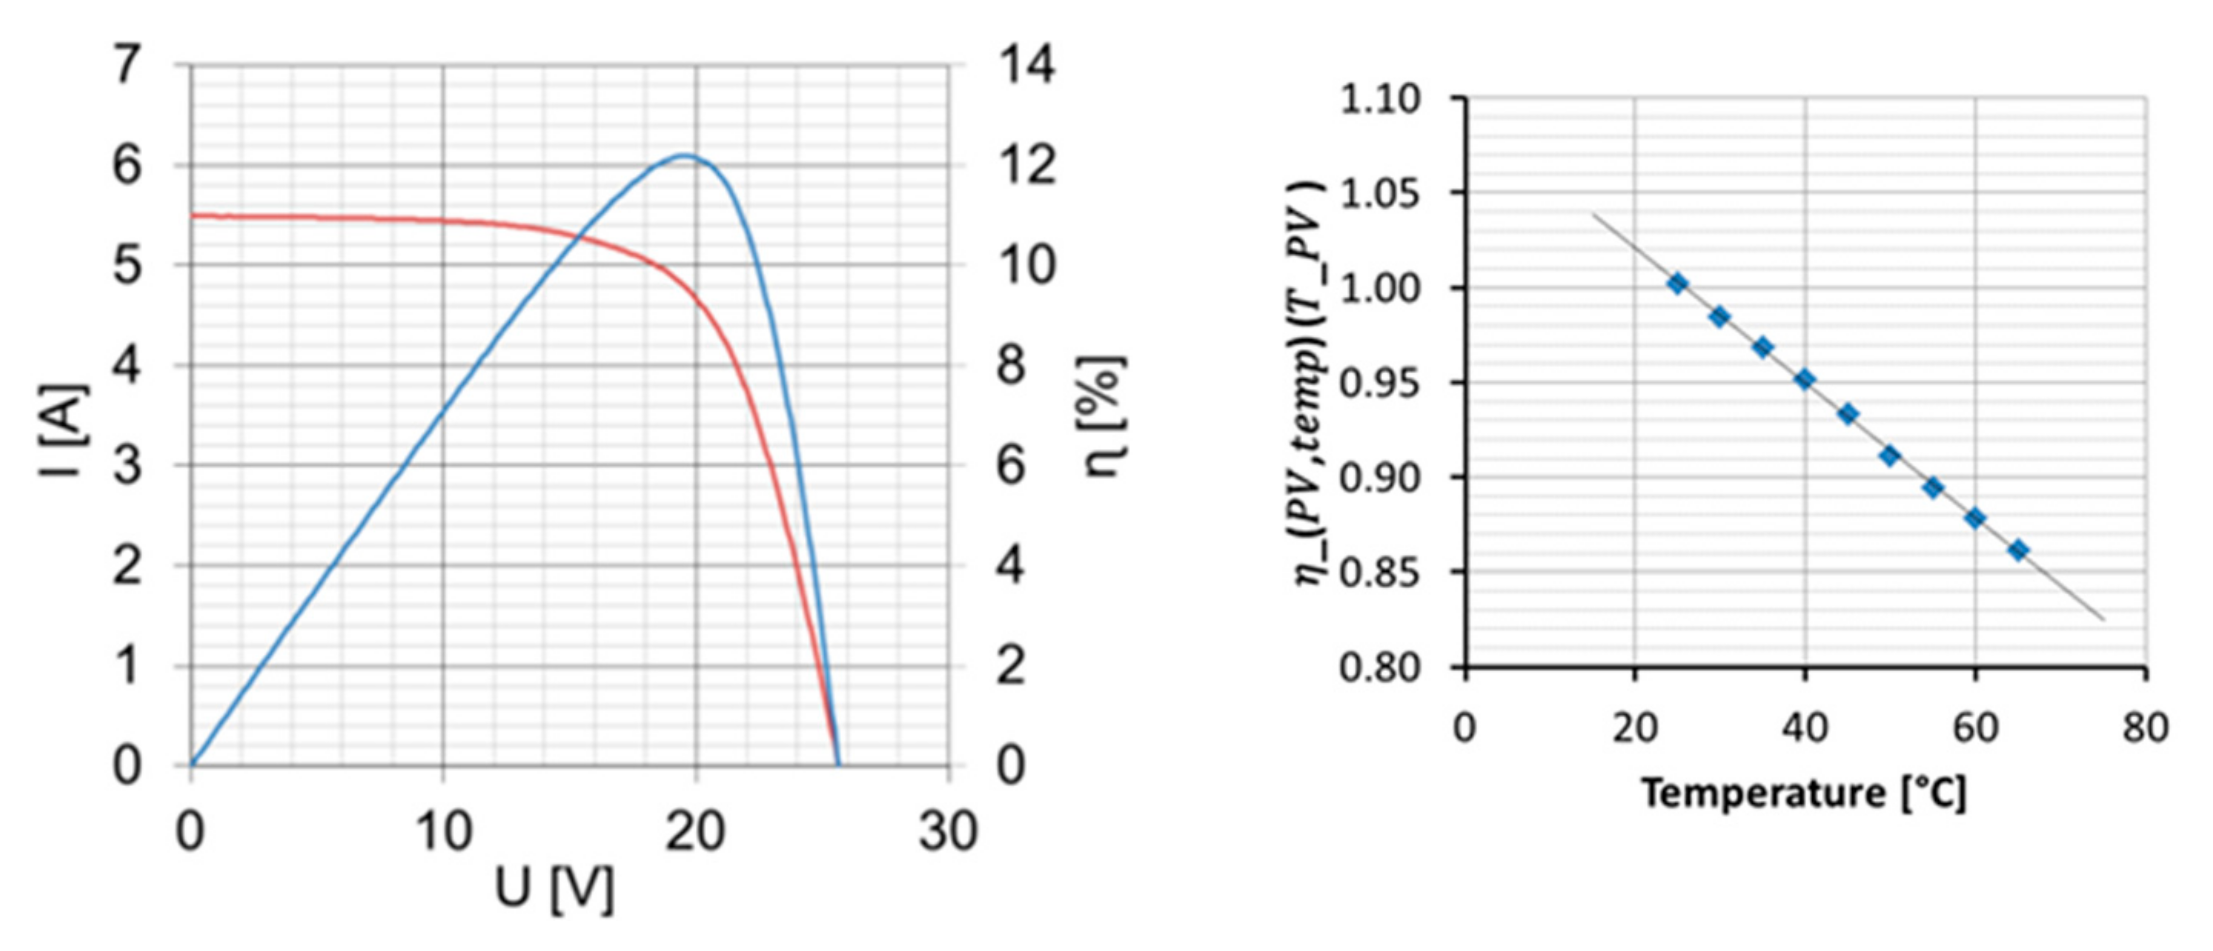
Figure 6 (left, red line). This figure also shows the efficiency that can be achieved over the cell voltage (blue line). The highest efficiency is achieved at the maximum power point (MPP).
These tests were repeated at different temperatures from 25 to 65 °C (see
Table 1). With these results, it is possible to determine a correction factor for transferring the efficiency measured under standard conditions into efficiency at a certain operating temperature.
The characterized PV panel shows a linear behavior over the temperature illustrated in
Figure 6 (right) and can be approximated by the following equation:
These equations are important for the identification of the optimal operating configuration. All of the results we measured in the sun simulator are summarized in the following table (see
Table 2), including the maximum efficiency of 12.4% at 25 °C.
At constant radiation, the PV current is hardly affected by the operating temperature. Both the current and voltage are important parameters for direct coupling with other devices. Nonetheless, when considering different irradiations at a constant temperature, the voltage at MPP remains nearly constant (18.9 V), while the current changes. This can be approximated by the following equation:
4.2. Performance of PEM Electrolysis with Low Catalyst Loading
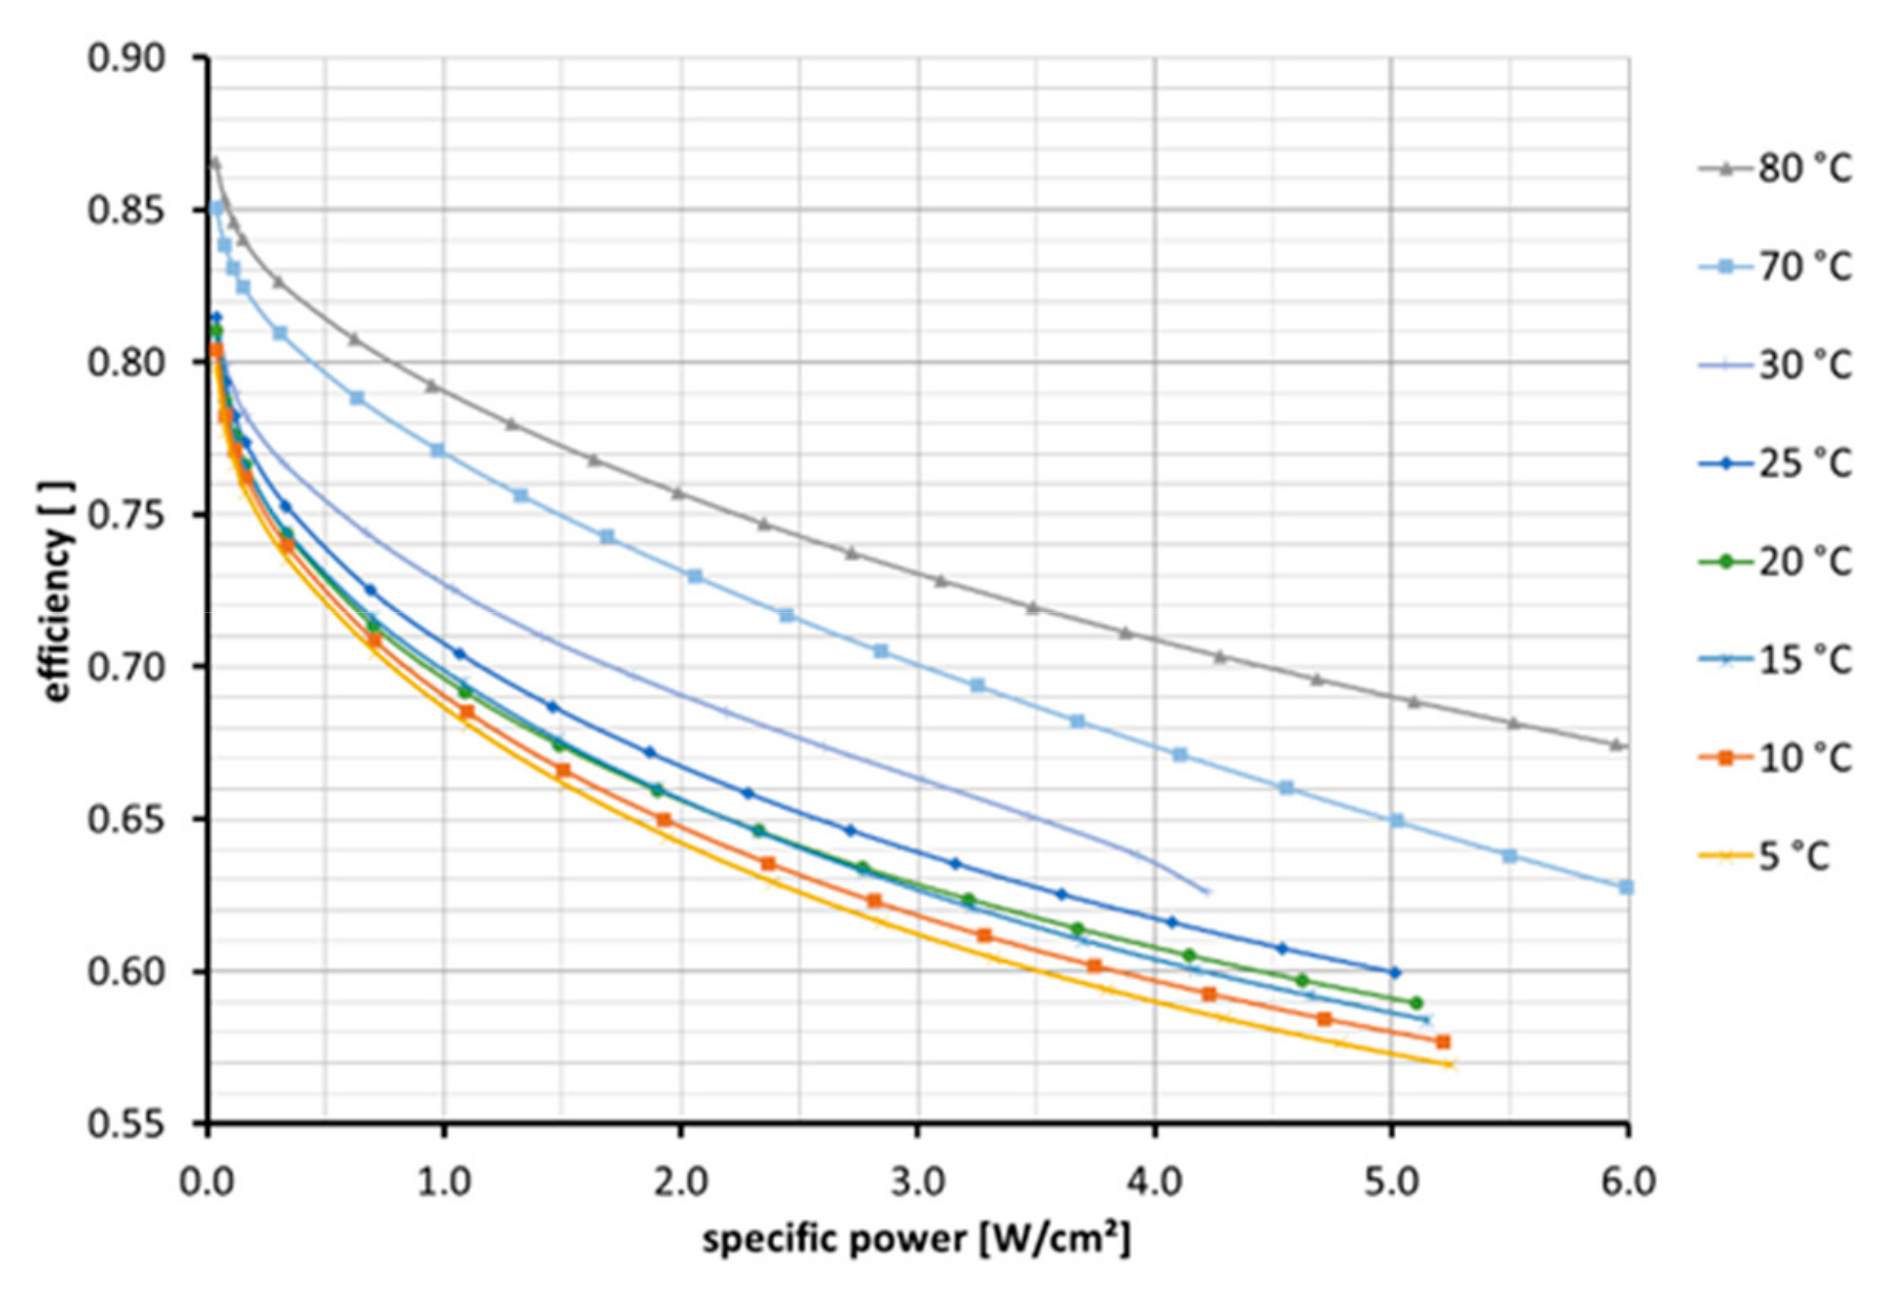
In the temperature range from 5 to 80 °C, an efficiency over the specific power (see
Figure 7) is achieved. Specific power and efficiency are derived from the classic polarization plot with voltage over current. Additionally, it is necessary to determine the influence of temperature on efficiency. The efficiency is calculated by using the lower heating value (3.00 kWh/Nm
3, 1.253 V) of hydrogen as a reference.
Considering the efficiency of a specific defined performance, we found a linear correlation of efficiency and temperature,
TEL in °C; see the following equation:
with
These measurements were also used to determine the parameters of a linear cell model for electrolysis, taking operating temperature and current density into account. The efficiency model can be used to check different configurations with regard to the cell number and the active cell area in the discussion of the different results. This is important because the voltage and current are the most important coupling parameters, as mentioned above. In the model, the temperature’s dependence on the given boundaries can be derived from the parameters
and
by the following equation:
The parameters are given in
Table 3 (reference).
4.3. Effect of Subzero Temperature on Cell Behavior
When considering the ambient temperatures during the winter months in Jülich, it is clear that the cell must cope with temperatures at which the water in the electrolysis process changes its aggregate state from liquid to solid. To cope with this, it could be an option to employ additives that shift this effect to lower temperatures. The other option would be to check what would happen when the cell is at freezing temperatures. Under these conditions, no electrolysis operation is possible, but usually the low temperatures occur in winter during the night or in the early morning hours when there is no solar radiation; therefore, this will not be problematic for the operation in this case.
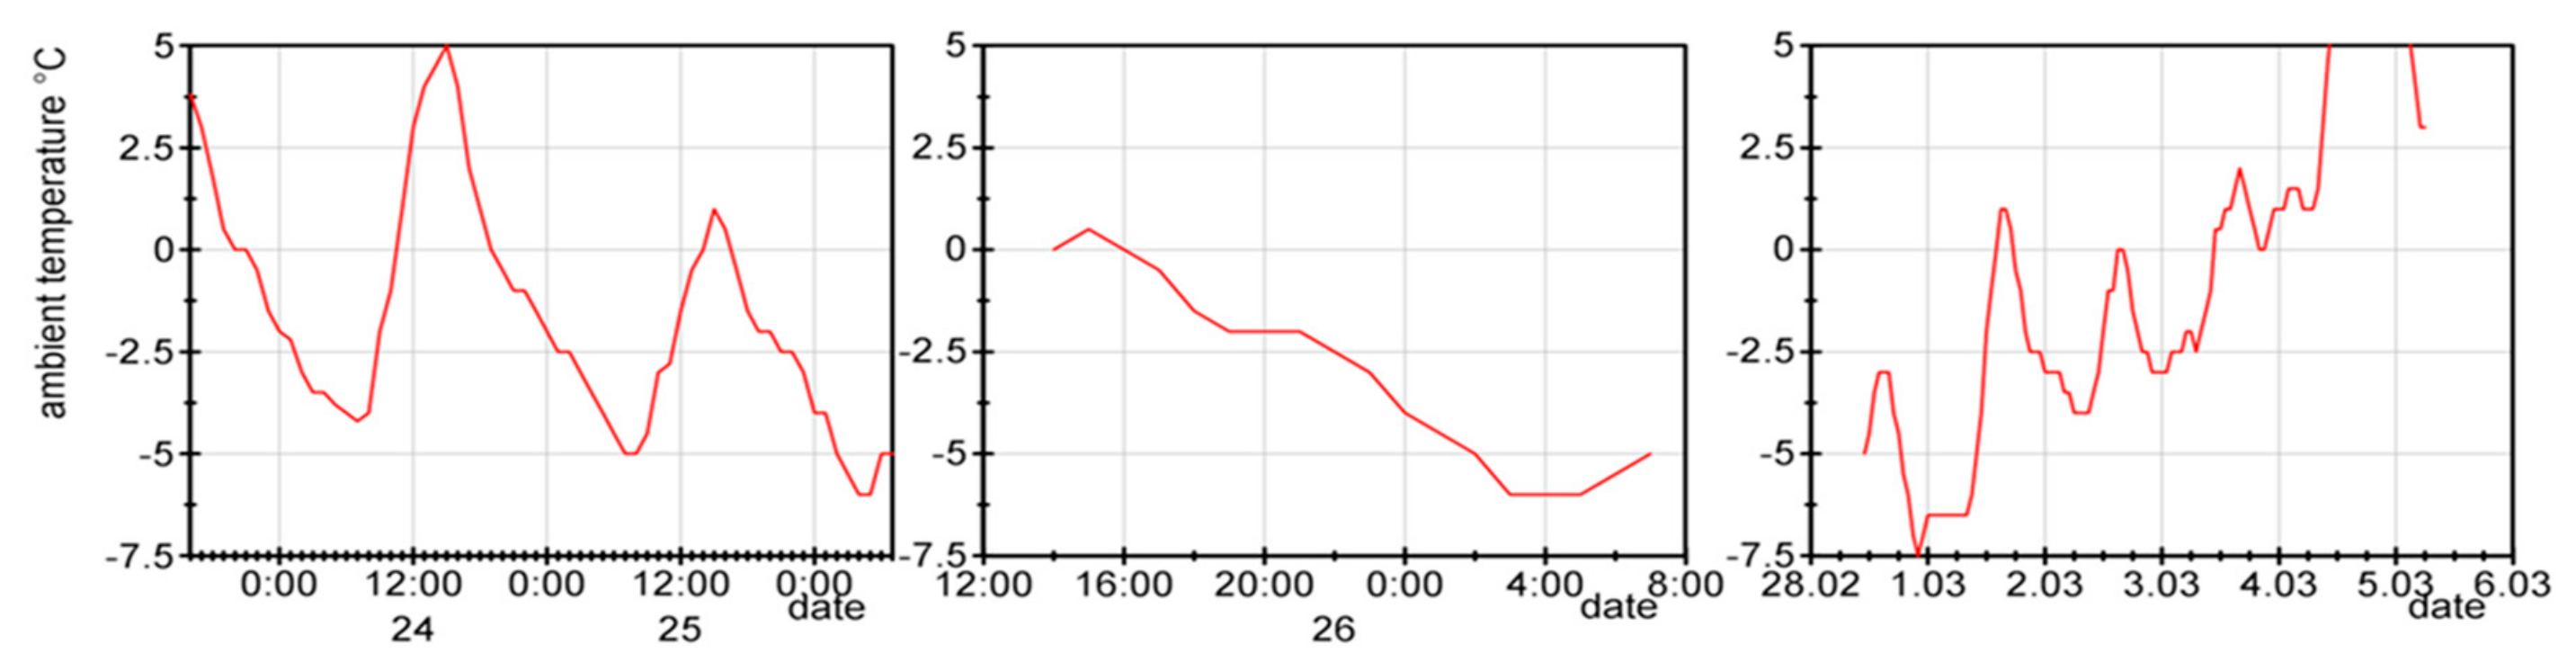
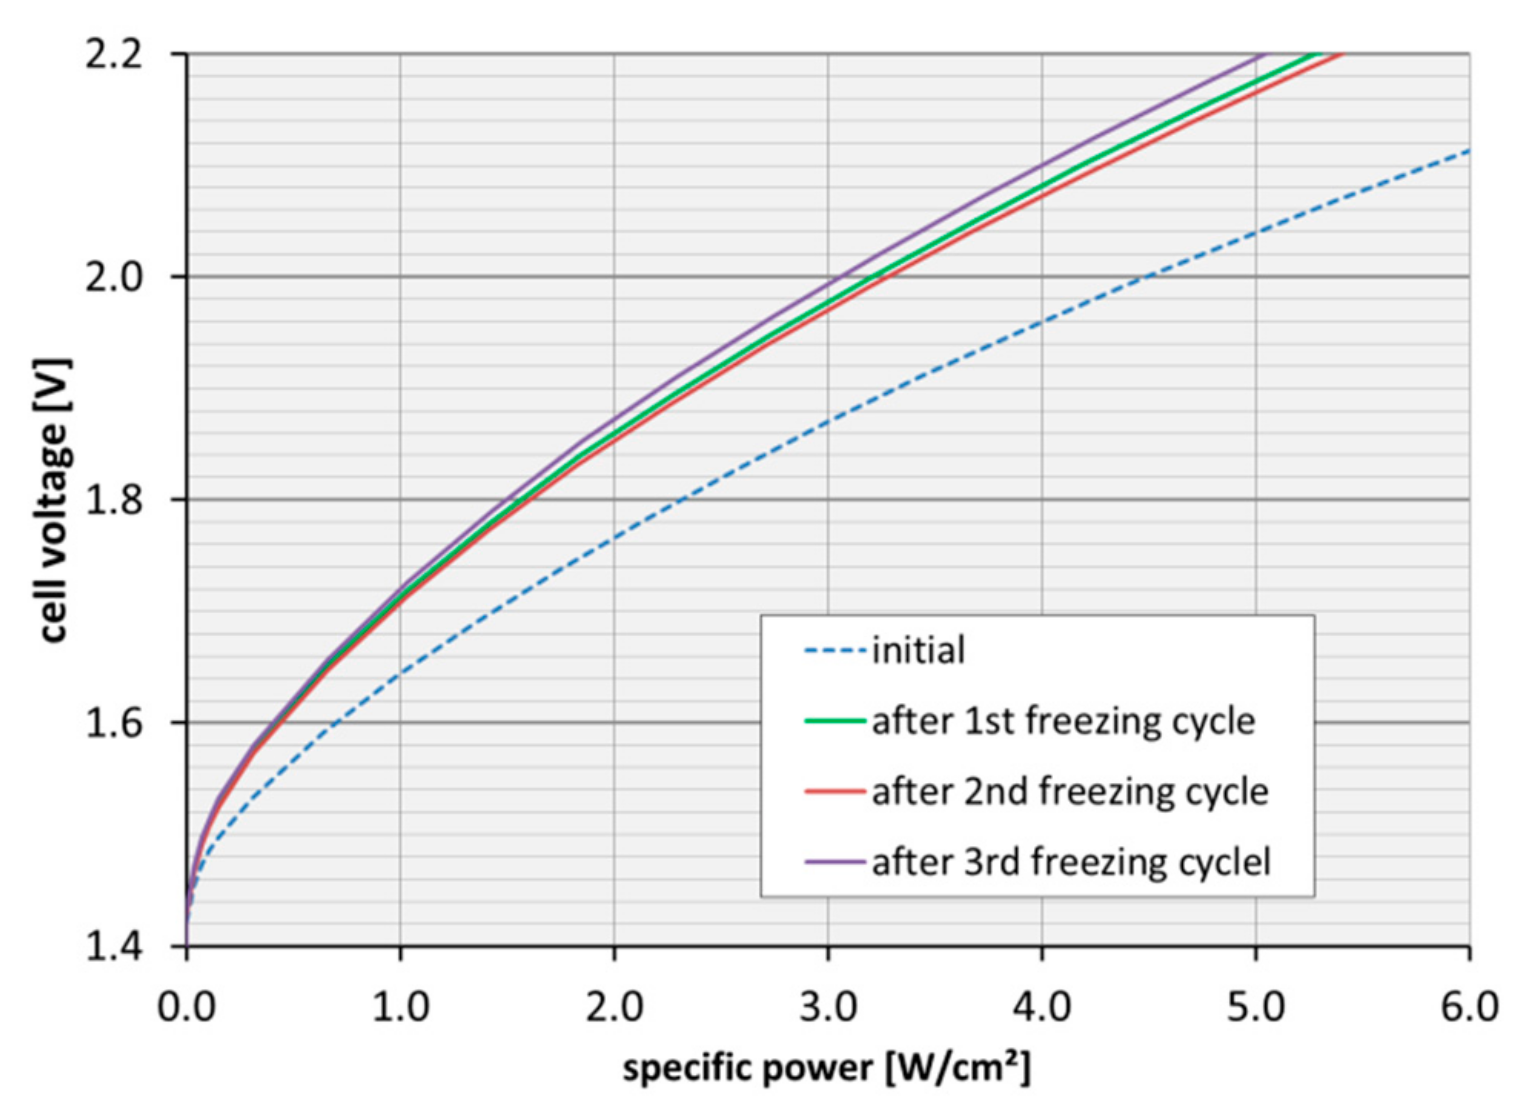
Initially, the test cells were characterized at 80 °C in the standard test stations. Then, they were stored outdoors in January with the temperature profile shown in
Figure 8. After two days with temperature fluctuations between +5 and −7 °C, the cell was characterized again and then the outdoor test was repeated with temperatures down to −7 °C. The cell was characterized again and, after a third outdoor cycle, we measured the cell again. The monitored performance loss (see
Figure 9) was affected by the phase transition in the test cell during freezing.
The results of the electrochemical measurements are given in
Figure 9. We found that we lost performance; however, this performance loss was only after the first freezing cycle. It is possible that some damage in the electrode or porous transport layer had occurred, and that had led to lower performance. This finding will be the subject of more in-depth analyses, which will not be discussed here. When the cell froze again, performance remained at the same level and no further degradation could be detected. Thus, the efficiency loss due to freezing can be considered a constant factor in the initial voltage against the voltage following the second freezing cycle. In the measured temperature range, this factor is ~0.95, meaning that performance and efficiency remain stable:
4.4. Performance of Directly Coupled Devices
In this paper, we focus on the direct coupling of electrolysis to PV; in doing so, alterations in performance due to the real operating point in relation to the ideal operating point under the given boundary conditions must be considered.
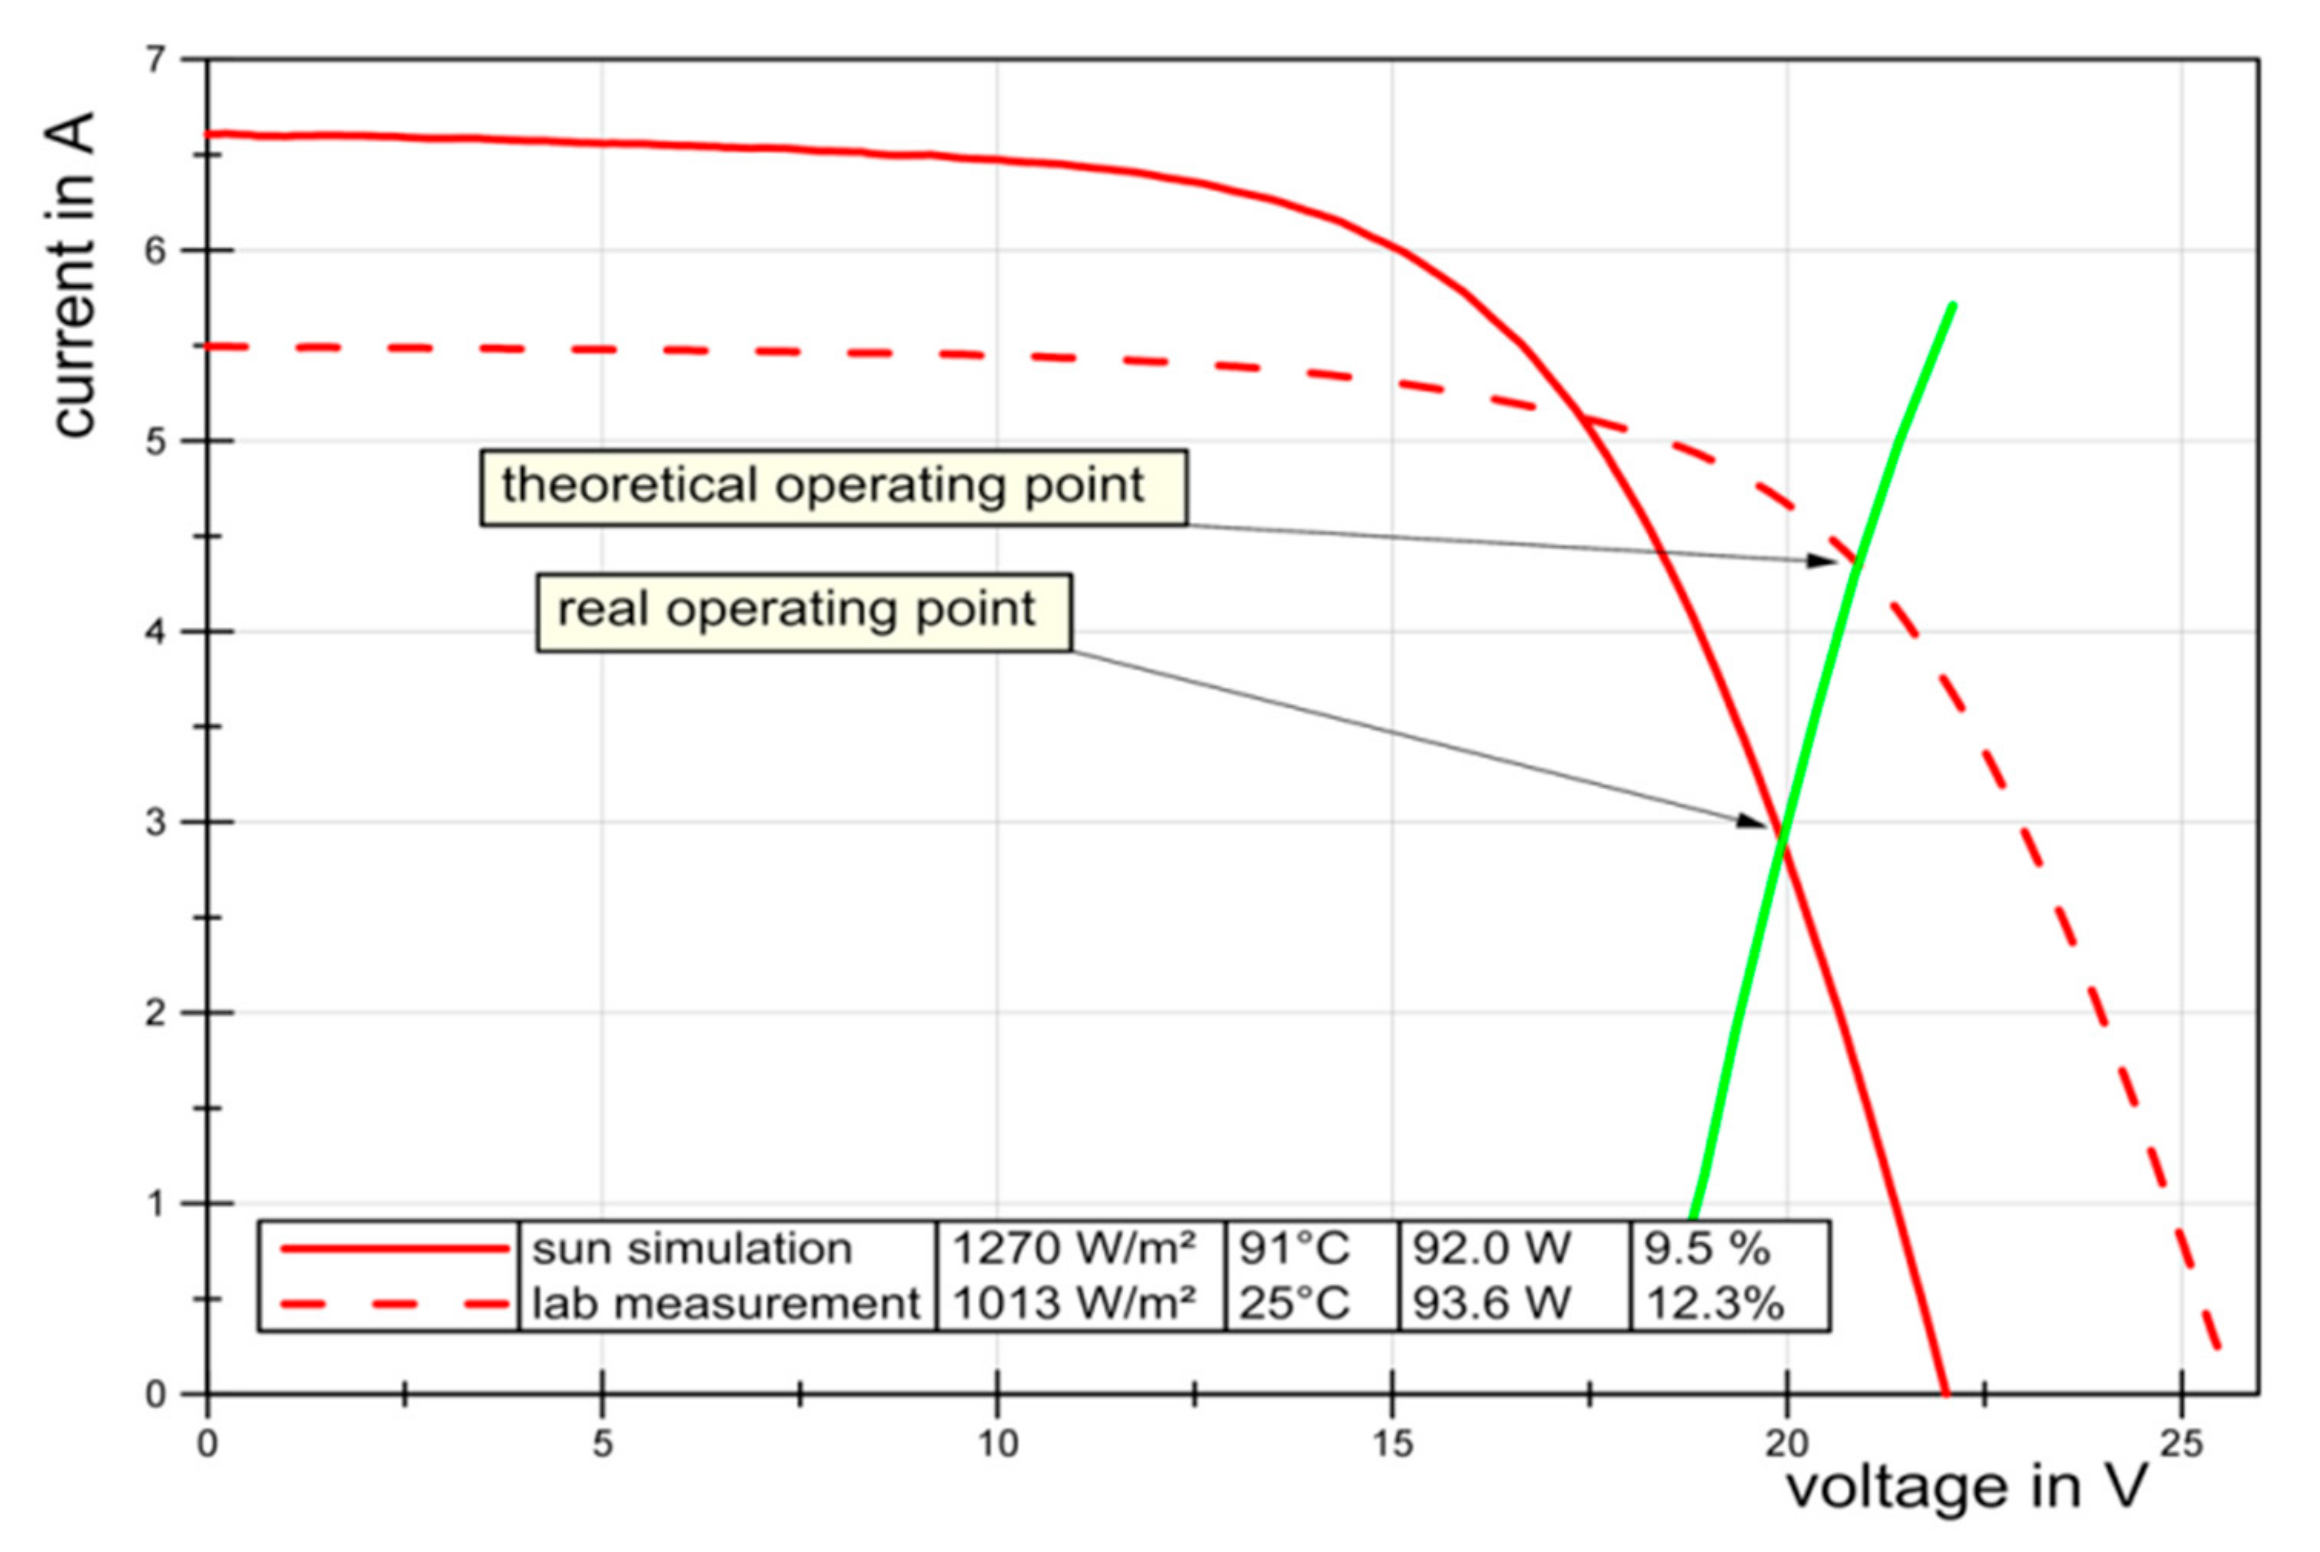
Figure 10 illustrates the performance change of the PV due to a higher operating temperature, as measured in the sun simulator. This means that we lose performance because the “new” operating point of the coupled devices is far from the maximum power point of the PV panel.
At first, the PV was tested at 25 °C with 1013 W/m
2 solar radiation. The current-voltage dataset obtained under these conditions is presented in
Figure 10 as the red dashed line. The polarization curve of the 12-cell electrolysis cassette is also included as a green line, with its intersection with the PV module’s current-voltage curve corresponding to the operating point of the combined device.
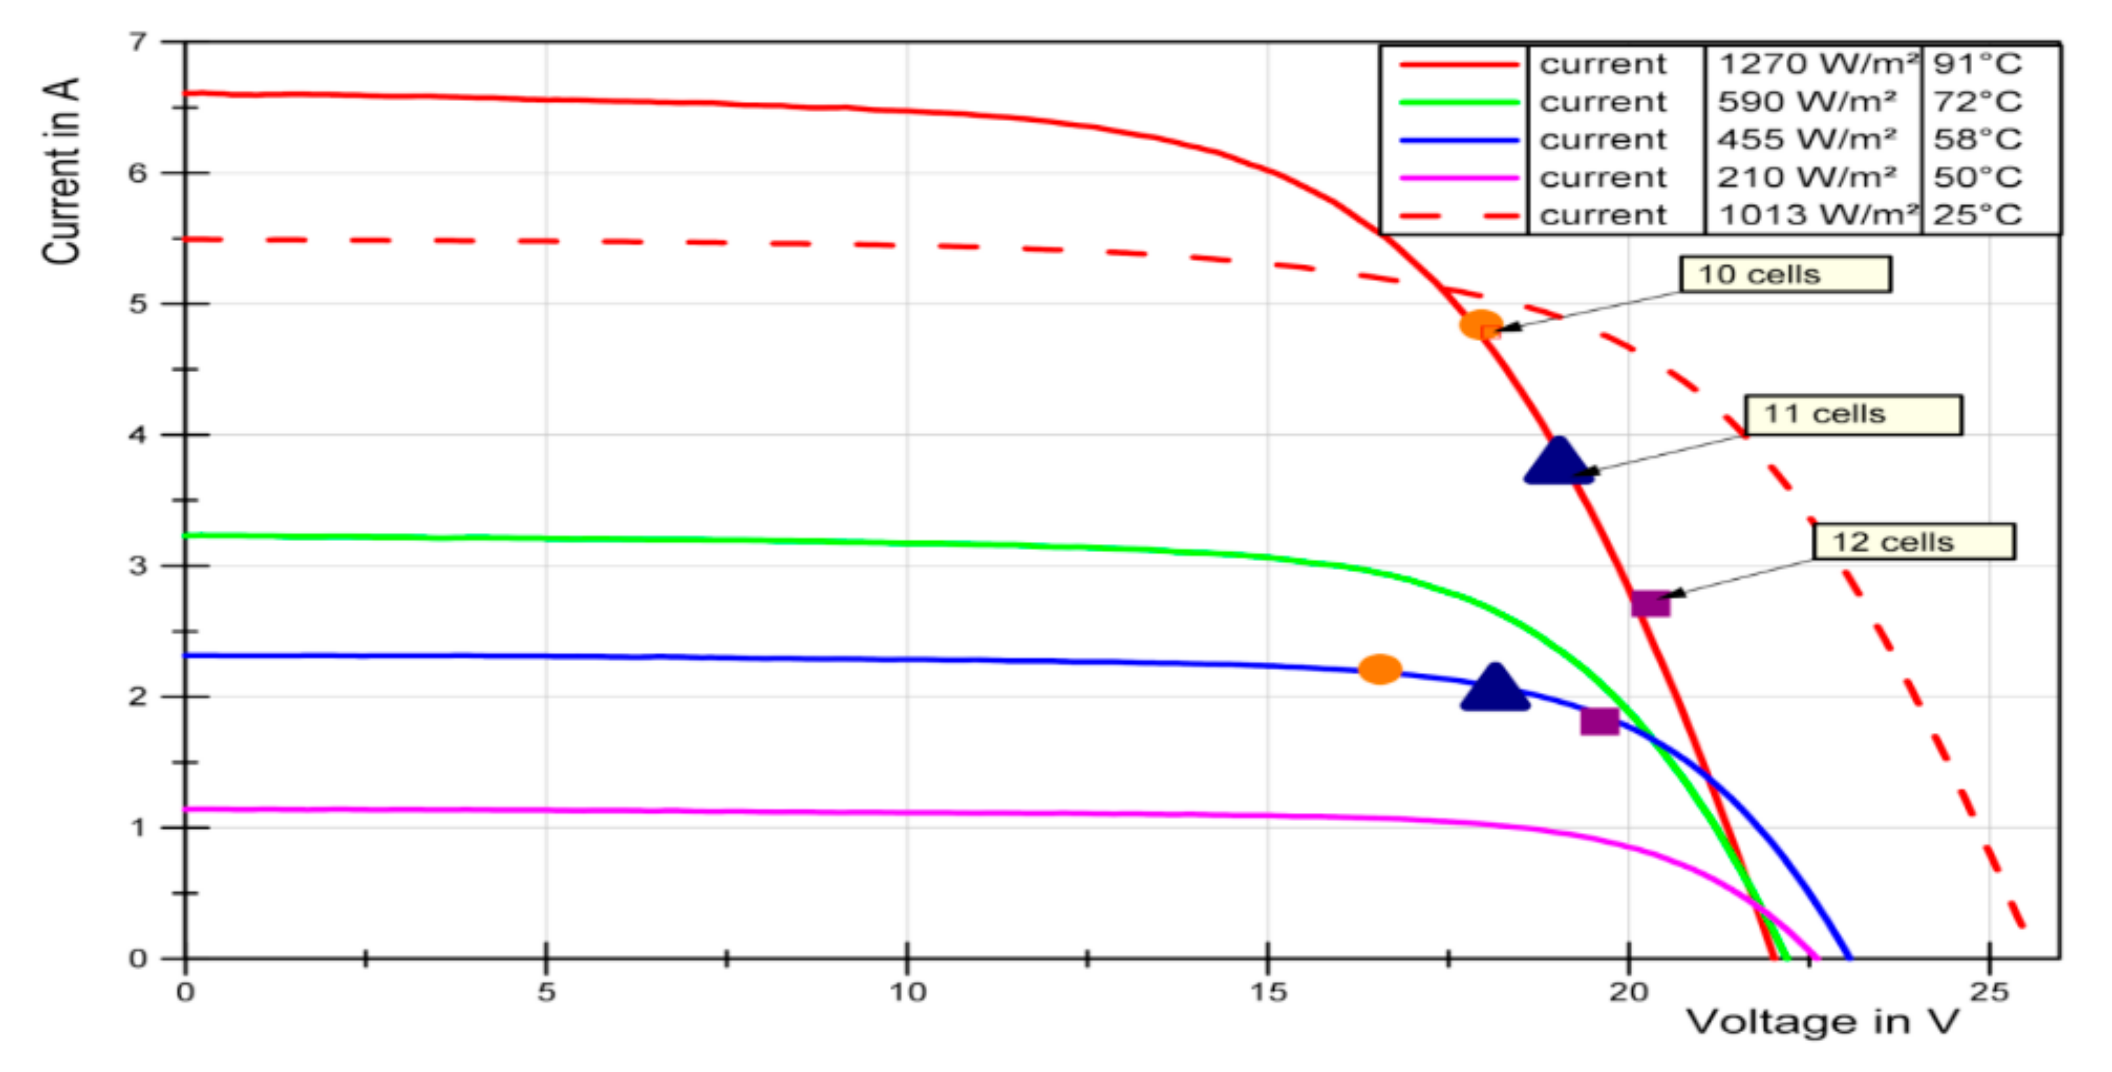
The operating temperature of a PV panel varies over a wide range. During the measurements in the sun simulator, with limited temperature control, we observed temperatures up to 91 °C at high radiation levels. This is an extreme value, but even in the presence of natural or forced convection, temperatures of up to 72 °C are possible. While increasing temperatures reduce the maximum voltage of the PV, the intensity of the radiation influences the maximum current (see
Figure 11).
To increase the efficiency of the directly coupled cell, it is possible to reduce the number of cells. This leads to higher voltages in the electrolysis process and thus to lower electrolysis efficiency, but the efficiency of the PV panel will be improved when the cell is operated closer to the MPP.
Accordingly, an important factor to characterize the coupled system is given by the following equation:
It describes how closely the system can be operated to the MPP of the PV cell. With the ten-cell configuration, we can achieve a power output of ~92 W at MPP from the PV panel. If the PV panel is coupled to a 10-cell stack, the power output is 87 W. This is close to the MPP and is at 0.95.
In the temperature range up to 72 °C, with lower radiation, the configuration with eleven cells also shows high efficiency. In any case, the reduced cell number leads to higher overall efficiency in the range of 6.2% to 8.5%.
5. Discussion
When developing new approaches for the conversion of solar radiation into electricity, aside from the investment, the efficiency of such systems is very important for estimating the economic feasibility. Here, we show a general approach that can be considered to determine the possible degree of efficiency in relation to the operating conditions. We have found that the temperature has an especially important influence on the overall efficiency or so-called solar to hydrogen efficiency ().
The following equation allows estimation of the efficiency based on measurements under standard conditions and to transfer these data to different operating conditions:
where
is the solar-to-hydrogen efficiency that can be achieved in the coupled systems. It considers the operating temperatures T, the efficiency of the PV panel (
) at the maximum power point, and a radiation of 1013 W/m
2. The efficiency term
describes the efficiency loss within the solar cell due to elevated operating temperatures. The term
assumes that the PV cell is not necessarily operated at the maximum power point. This will be the case if the cell is directly connected to the electrolysis device. The aim of the dimensioning activity is to come as close as possible to this operating point. The efficiency of the electrolysis process, considering the operating temperature of the electrolyzer, is given in
. Finally, there is the efficiency
that considers the connection between PV and electrolysis. For the direct coupling, we only have to consider the Ohmic losses,
. Where we use a DC/DC converter,
is in the range of 0.85 to 0.95, but we can operate the PV panel at the maximum power point.
In
Table 4, we show the parameters used for the calculations. One additional result is the fraction of the active area of the PV panel and the electrolysis process. This fraction is important to determine the costs of the systems, because the costs of electrolysis are mainly dependent on the active area.
With these data, we can calculate the maximum solar to hydrogen (STH) efficiency of 7.8% to 9.1% when the devices are thermally-decoupled in a winter scenario. If we utilize thermal coupling, the efficiency remains nearly constant but is lower. The operating performance of the PV-EC combination can be improved by reducing the number of cells in the cassette design. Therefore, a 9-cell configuration was chosen for most of the parameter variations. With this configuration, the operating point is much closer to the maximum power point and the efficiency is close to maximum. The variation of the cell number has shown that, in some cases, even a configuration with only nine cells could be advantageous.
From the results presented, it can also be determined that to achieve a high overall efficiency during the whole year, it is advantageous to operate the coupled system as close as possible to the MPP of the PV panel. Due to the shift in the MPP at different temperatures and irradiations, it could be an option to couple the devices using a DC/DC converter, which would allow operation of the PV panel at the maximum power point under any conditions. Our tests have shown that the efficiency of low-cost DC/DC converters is only at about 75%. The use of DC/DC converters is advantageous when the efficiency is higher than the efficiency of direct coupling. In our tests and simulations, the efficiency of the direct coupling was always higher than this value. However, if DC/DC converters with an efficiency of 90% and above at low costs are available, it could be better to use them instead of direct coupling to achieve a higher overall efficiency. In the future, the production of electric vehicles will increase more and more, so it is very likely that, because of this increase of production rates for electronic components, the costs for the DC/DC converters will also decrease, and the efficiency will rise.
6. Summary and Conclusions
Herein, we report on a new PEM electrolysis stack we developed that is well-suited for coupling with a PV panel. The generated oxygen is secreted directly into the environment to avoid the risk of the formation of explosive gas mixtures. The catalyst-coated membranes have low catalyst loading (0.38 mg/cm2 IrO2; cathode: 0.13 mg/cm2 Pt) and their performance is comparable to standard CCMs. Ageing tests at temperatures below 0 °C have shown that there is a loss of performance, but this is not influenced by the number of cycles at temperatures below 0 °C.
We operated the developed PEM electrolyzer, which was directly coupled to a PV panel, to generate hydrogen from solar radiation. It was possible to determine its efficiency under reproducible conditions in a sun simulator. With these results, as well as additional findings from characterizing the measurements of all components, it was possible to build up a simulation tool to gain a deeper understanding of the interaction and influence on the overall efficiency.
We found that in our configuration, a decrease in the electrolysis cell number had a positive effect on the efficiency, even though electrolysis works at a lower efficiency level and lower efficiency. This is affected by a shift in the operating conditions, which are now much closer to the MPP of the PV panel. Furthermore, the reduction in the active area to less than 1% of the PV panel area is possible without drastic losses in efficiency.
With these results, we are now able to perform an optimal dimensioning of our electrolysis modules for a 10 m2 demonstrator within the PECSYS project. In outdoor conditions, with the configuration we chose (9 cells with an 18 cm2 active area), solar-to-hydrogen efficiencies of 7% to 8% are realistic.
Author Contributions
Conceptualization, M.M.; Validation, W.Z. and S.H.; Investigation, W.Z., M.M.; Resources, L.S., W.Z.; Data curation, W.Z.; Writing—Original draft preparation, M.M., E.R.; Writing—Review and editing, M.H., H.J., M.C.; Project administration, M.M.; Funding acquisition, S.H., M.M.
Funding
This research received funding from the Fuel Cells and Hydrogen 2 Joint Undertaking under grant agreement 735218. This joint undertaking receives support from the European Union’s Horizon 2020 research and innovation program, Hydrogen Europe, and N.ERGHY.
Conflicts of Interest
The authors declare no conflict of interest. The funders had no role in the design of the study; in the collection, analyses, or interpretation of data; in the writing of the manuscript, or in the decision to publish the results.
References
- United Nations (UN). Paris Agreement; UN: Paris, France, 2015. [Google Scholar]
- IPCC. Climate Change 2014: Mitigation of Climate Change. In Contribution of Working Group III to the Fifth Assessment Report of the Intergovernmental Panel on Climate Change; IPCC: Geneva, Switzerland, 2014. [Google Scholar]
- Arantegui, R.L.; Jäger-Waldau, A. Photovoltaics and wind status in the European Union after the Paris Agreement. Renew. Sustain. Energy Rev. 2018, 81, 2460–2471. [Google Scholar] [CrossRef]
- IEA. The Future of Hydrogen Report Prepared by the IEA for the G20, Japan; IEA: Paris, France, 2019. [Google Scholar]
- European Comission (EC). In-Depth Analysis in Support of the Commission Communication Com(2018) 773—A Clean Planet for All a European Long-Term Strategic Vision for a Prosperous, Modern, Competitive and Climate Neutral Economy; EC: Brussels, Belgium, 2018. [Google Scholar]
- Brinner, A.; Bussmann, W.; Hug, W.; Seeger, W. Test. Results of the Hysolar 10 kW PV-Electrolysis Facility; DLR: Stuttgart, Germany, 1992. [Google Scholar]
- Lymberopoulos, N.; Zoulias, E. Hydrogen-Based Autonomous Power Systems: Techno-Economic Analysis of the Integration of Hydrogen in Autonomous Power Systems; Springer: London, UK, 2008. [Google Scholar]
- Lehman, P.A.; Chamberlin, C.E.; Pauletto, G.; Rocheleau, M.A. Operating Experience with a Photovoltaic-Hydrogen Energy System. In Proceedings of the 10th World Hydrogen Energy Conference, Cocoa Beach, FL, USA, 20–24 June 1994. [Google Scholar]
- Szyszka, A. Ten years of solar hydrogen demonstration project at Neunburg vorm Wald, Germany. Int. J. Hydrog. Energy 1998, 23, 849–860. [Google Scholar] [CrossRef]
- Behrmann, J.P.; Szyszka, A. Solar-hydrogen project. Int. J. Proj. Manag. 1993, 11, 49–56. [Google Scholar] [CrossRef]
- Stahl, W.; Voss, K.; Goetzberger, A. The Self-sufficient Solar House in Freiburg. Sol. Energy 1994, 52, 111–125. [Google Scholar] [CrossRef]
- Ghosh, P.C. Cost Optimisation of a Self-Sufficient Hydrogen Based Energy Supply System; Forschungszentrum Jülich: Jülich, Germany, 2003. [Google Scholar]
- Meurer, C.; Barthels, H.; Brocke, W.A.; Emonts, B.; Groehn, H.G. PHOEBUS—An autonomous supply system with renewable energy: Six years of operational experience and advanced concepts. Sol. Energy 1999, 67, 131–138. [Google Scholar] [CrossRef]
- Galli, S. The Solar-Hydrogen Saphys Project: Operating Results; Advanced Energy, Ed.; ENEA—Department of Energy Technologies: Rome, Italy, 1997. [Google Scholar]
- Hollmuller, P.; Joubert, J.-M.; Lachal, B.; Yvon, K. Evaluation of a 5 kWp photovoltaic hydrogen production and storage installation for a residential home in Switzerland. Int. J. Hydrog. Energy 2000, 25, 97–109. [Google Scholar] [CrossRef]
- Chaparro, A.M.; Soler, J.; Escudero, M.J.; de Ceballos, E.M.L.; Wittstadt, U.; Daza, L. Data results and operational experience with a solar hydrogen system. J. Power Sources 2005, 144, 165–169. [Google Scholar] [CrossRef]
- Arriaga, L.G.; Martínez, W.; Cano, U.; Blud, H. Direct coupling of a solar-hydrogen system in Mexico. Int. J. Hydrog. Energy 2007, 32, 2247–2252. [Google Scholar] [CrossRef]
- Clarke, R.E.; Giddey, S.; Ciacchi, F.T.; Badwal, S.P.S.; Paul, B.; Andrews, J. Direct coupling of an electrolyser to a solar PV system for generating hydrogen. Int. J. Hydrog. Energy 2009, 34, 2531–2542. [Google Scholar] [CrossRef]
- Ghribi, D.; Khelifa, A.; Diaf, S.; Belhamel, M. Study of hydrogen production system by using PV solar energy and PEM electrolyser in Algeria. Int. J. Hydrog. Energy 2013, 38, 8480–8490. [Google Scholar] [CrossRef]
- Maeda, T.; Ito, H.; Hasegawa, Y.; Zhou, Z.; Ishida, M. Study on control method of the stand-alone direct-coupling photovoltaic—Water electrolyzer. Int. J. Hydrog. Energy 2012, 37, 4819–4828. [Google Scholar] [CrossRef]
- Su, Z.; Ding, S.; Gan, Z.; Yang, X. Optimization and sensitivity analysis of a photovoltaic-electrolyser direct-coupling system in Beijing. Int. J. Hydrog. Energy 2014, 39, 7202–7215. [Google Scholar] [CrossRef]
- Ursúa, A.; López, J.; Gubía, E.; Marroyo, L.; Sanchis, P. Photovoltaic Hydrogen Production with Commercial AlkalineElectrolysers. In Parallel Sessions Book 3: Hydrogen Production Technologies—Part 2; Stolten, D., Grube, T., Eds.; Forschungszentrum Jülich GmbH, Zentralbibliothek: Jülich, Germany, 2010. [Google Scholar]
- Gibson, T.L.; Kelly, N.A. Predicting efficiency of solar powered hydrogen generation using photovoltaic-electrolysis devices. Int. J. Hydrog. Energy 2010, 35, 900–911. [Google Scholar] [CrossRef]
- Solmecke, H.; Just, O.; Hackstein, D. Comparison of solar hydrogen storage systems with and without power-electronic DC–DC-converters. Renew. Energy 2000, 19, 333–338. [Google Scholar] [CrossRef]
- Reuß, M.; Reul, J.; Grube, T.; Langemann, M.; Calnan, S.; Robinius, M.; Schlatmann, R.; Rau, U.; Stolten, D. Solar hydrogen production: A bottom-up analysis of different photovoltaic–electrolysis pathways. Sustain. Energy Fuels 2019, 3, 801–813. [Google Scholar] [CrossRef]
- Müller, M.; Carmo, M.; Glüsen, A.; Hehemann, M.; Saba, S.; Zwaygardt, W.; Stolten, D. Water management in membrane electrolysis and options for advanced plants. Int. J. Hydrog. Energy 2019, 44, 10147–10155. [Google Scholar] [CrossRef]
- Ross, R.G. Design-Techniques for Flat-Plate Photovoltaic Arrays. In Proceedings of the 15th Photovoltaic Specialists Conference, Orlando, FL, USA, 12–15 May 1981. [Google Scholar]
- Sprenger, E. Taschenbuch für Heizung, Lüftung und Klimatechnik; R. Oldenbourg: München, Germany, 1968. [Google Scholar]
Figure 1.
Scheme of an advanced setup: (1) PV module; (2) electrolysis cell/stack; (3) hydrogen separator; (4) valve for pressure control; (5) dehumidification; (6) compressor; (7) water circulation pump.
Figure 1.
Scheme of an advanced setup: (1) PV module; (2) electrolysis cell/stack; (3) hydrogen separator; (4) valve for pressure control; (5) dehumidification; (6) compressor; (7) water circulation pump.
Figure 2.
Setup of the electrolysis stack with cathodic media supply.
Figure 2.
Setup of the electrolysis stack with cathodic media supply.
Figure 3.
Theoretically possible power generation over the day. Temperature during a reference day in July. The blue curves show the irradiation and specific power that can be converted by the PV panel. The red curve shows the ambient temperature over a day in July and in green, the temperature of the PV panel is given.
Figure 4.
PV panel in the sun simulator at the Forschungszentrum, Jülich (left); configuration of the PV cells in the Solibro CIGS module (right).
Figure 4.
PV panel in the sun simulator at the Forschungszentrum, Jülich (left); configuration of the PV cells in the Solibro CIGS module (right).
Figure 5.
Setup of the cell that was used for the direct coupling of PV and electrolysis (left). A stack with the same setup (middle); active area: 17.64 cm2 per cell. The system with the gas separator is shown on the right.
Figure 5.
Setup of the cell that was used for the direct coupling of PV and electrolysis (left). A stack with the same setup (middle); active area: 17.64 cm2 per cell. The system with the gas separator is shown on the right.
Figure 6.
Performance of the PV panel at 25 °C and 1000 W/m2 (left); efficiency correction over PV panel temperature (right).
Figure 6.
Performance of the PV panel at 25 °C and 1000 W/m2 (left); efficiency correction over PV panel temperature (right).
Figure 7.
Electrolyzer efficiency across a specific power range at different temperatures. NR212 with reduced catalyst loading—anode: 0.38 mg/cm2 IrO2 | cathode: 0.13 mg/cm2 Pt.
Figure 7.
Electrolyzer efficiency across a specific power range at different temperatures. NR212 with reduced catalyst loading—anode: 0.38 mg/cm2 IrO2 | cathode: 0.13 mg/cm2 Pt.
Figure 8.
Temperature during outdoor freezing: 1st freezing cycle, 46 h of 64 h at subzero temperatures (left); 2nd freezing cycle, 15 h of 18 h at subzero temperatures (middle); 3rd freezing cycle, 66 h of 116 h at subzero temperatures (right).
Figure 8.
Temperature during outdoor freezing: 1st freezing cycle, 46 h of 64 h at subzero temperatures (left); 2nd freezing cycle, 15 h of 18 h at subzero temperatures (middle); 3rd freezing cycle, 66 h of 116 h at subzero temperatures (right).
Figure 9.
Performance of PEM electrolysis before and after freezing.
Figure 9.
Performance of PEM electrolysis before and after freezing.
Figure 10.
Comparison of realistic (sun simulation) and laboratory conditions with the corresponding PV current voltage curves represented by continuous and dashed lines, respectively. The performance of the 12-cell electrolyser stack is the solid green line.
Figure 10.
Comparison of realistic (sun simulation) and laboratory conditions with the corresponding PV current voltage curves represented by continuous and dashed lines, respectively. The performance of the 12-cell electrolyser stack is the solid green line.
Figure 11.
Variation of the electrolysis cell number and its influence on the performance of the coupled devices.
Figure 11.
Variation of the electrolysis cell number and its influence on the performance of the coupled devices.
Table 1.
List of demonstration systems developed in the last 30 years.
Table 1.
List of demonstration systems developed in the last 30 years.
| | | Photovoltaics (PV) | Electrolyzer | Solar-to-H2 | References |
|---|
| Project | Year | Peak Power kWp | PV Efficiency % | Power kW | Type | Efficiency % | Efficiency % | |
|---|
| HYSOLAR | 1986–1995 | 10/300 | 8.1 | 10/300 | AEL | 58.5 | 5.2 | [6] |
| INTA | 1989–1997 | 8.5 | 8.5 | 5.2 | AEL | 69.6 | 5.7 | [7] |
| SCHATZ | 1989–1996 | 9.2 | 8.1 | 6 | AEL | 76.7 | 6.2 | [8] |
| SWB | 1989–1998 | 370 | | 100 | AEL | | | [9] |
| Solar Hydrogen | 1990–1992 | 1.3 | | 0.8 | AEL | | | [10] |
| Solar House | 1992–1995 | 4.2 | | 2 | PEM | | | [11] |
| PHOEBUS | 1993–2003 | 43 | | 26 | AEL | | | [12,13] |
| SAPHYS | 1994–1997 | 5.6 | | 5 | AEL | | | [14] |
| | 2000 | 5 | 8.4 | 5 | AEL | | | [15] |
| FIRST | 2000–2004 | 1.4 | 9.9 | 1 | PEM | | 6.5 | [16] |
| | 2007 | 2.7 | | 5.6 | PEM | | | [17] |
| | 2009 | 2.4 | | 2.6 | PEM | | | [18] |
| | 2013 | 0.06 | | 0.05 | PEM | | | [19] |
| | 2012 | 2.7 | | - | PEM | | | [20] |
| | 2014 | 0.12 | | 0.26 | PEM | | | [21] |
| | 2010 | 5.1 | 13.5 | 4.9 | AEL | 72.7 | | [22] |
Table 2.
Results from the measurements in the sun simulator.
Table 2.
Results from the measurements in the sun simulator.
| E | UPV | IPV | PMPP | IMPP | UMPP | ηPV | Tpanel |
|---|
| W/m2 | V | A | W | A | V | % | °C |
|---|
| 1000 | 22.823 | 5.540 | 81.403 | 4.770 | 17.064 | 10.7 | 65.1 |
| 1000 | 23.412 | 5.530 | 84.512 | 4.777 | 17.693 | 11.1 | 55.3 |
| 1000 | 24.149 | 5.521 | 88.143 | 4.810 | 18.325 | 11.6 | 45.0 |
| 1000 | 24.830 | 5.513 | 91.470 | 4.822 | 18.968 | 12.0 | 35.3 |
| 1000 | 25.515 | 5.507 | 94.665 | 4.831 | 19.596 | 12.4 | 25.1 |
| 1100 | 25.746 | 6.041 | 103.310 | 5.246 | 19.694 | 12.325 | 24.9 |
| 1000 | 25.636 | 5.498 | 94.473 | 4.793 | 19.710 | 12.398 | 24.9 |
| 800 | 25.304 | 4.409 | 76.094 | 3.862 | 19.703 | 12.483 | 24.9 |
| 600 | 24.895 | 3.319 | 57.553 | 2.931 | 19.638 | 12.588 | 24.9 |
| 400 | 24.309 | 2.221 | 38.336 | 1.971 | 19.448 | 12.578 | 24.9 |
| 200 | 23.323 | 1.119 | 18.743 | 0.994 | 18.856 | 12.298 | 24.9 |
Table 3.
Parameters for a linear cell model.
Table 3.
Parameters for a linear cell model.
| | Dimension | CCM Low Catalyst Loading |
|---|
| U00 | V | 1.716497235 |
| m | V/K | −0.003014236 |
| R00 | Ω cm2 | 0.236788263 |
| n | (Ω cm2)/K | −0.000576891 |
Table 4.
Parameter variation for a PV panel with ηPV,25 °C,MPP = 12.4%.
Table 4.
Parameter variation for a PV panel with ηPV,25 °C,MPP = 12.4%.
| E | TPV | ηPV, temp | ηOP/MPP | IMPP | TEL | nEL | AEL | UEL | pEL | ηEL | ηcoup | ηsubzero | AEL/APV |
|---|
| % | Wm−2 | °C | % | % | A | °C | | cm2 | V | Wcm−2 | % | % | % | |
|---|
| Results from measurements in a sun simulator |
| 6.7 | 1270 | 91 | 76.4 | 87.7 | 6.4 | 91 | 10 | 18 | 1.594 | 0.564 | 80 | 100 | 100 | 0.024 |
| 7.0 | 590 | 72 | 83.3 | 87.2 | 3.2 | 72 | 10 | 18 | 1.603 | 0.287 | 78 | 100 | 100 | 0.024 |
| 7.2 | 455 | 58 | 88.3 | 86.0 | 2.6 | 58 | 10 | 18 | 1.627 | 0.238 | 76 | 100 | 100 | 0.024 |
| 7.3 | 210 | 50 | 91.2 | 85.9 | 1.3 | 50 | 10 | 18 | 1.628 | 0.114 | 76 | 100 | 100 | 0.024 |
| 7.1 | 1013 | 25 | 100.2 | 80.0 | 6.7 | 25 | 10 | 18 | 1.747 | 0.646 | 71 | 100 | 100 | 0.024 |
| Radiation and temperature in outdoor configuration (thermally-connected) |
| 6.4 | 1013 | 72 | 83.3 | 85.9 | 5.5 | 72 | 10 | 18 | 1.628 | 0.501 | 78 | 98 | 95 | 0.024 |
| 6.5 | 590 | 58 | 88.3 | 84.6 | 3.4 | 50 | 10 | 18 | 1.653 | 0.314 | 75 | 98 | 95 | 0.024 |
| 6.4 | 455 | 53 | 90.1 | 83.9 | 2.7 | 40 | 10 | 18 | 1.666 | 0.249 | 74 | 98 | 95 | 0.024 |
| 6.9 | 210 | 35 | 96.6 | 84.2 | 1.3 | 35 | 10 | 18 | 1.660 | 0.123 | 73 | 98 | 95 | 0.024 |
| Analysis of a wide operating temperature range (thermally-connected) |
| 7.3 | 1000 | 1 | 108.8 | 85.9 | 7.1 | 1 | 9 | 18 | 1.808 | 0.717 | 67 | 98 | 95 | 0.022 |
| 7.3 | 1000 | 30 | 102.0 | 88.3 | 6.7 | 30 | 9 | 18 | 1.759 | 0.654 | 70 | 98 | 95 | 0.022 |
| 7.3 | 1000 | 60 | 94.8 | 91.0 | 6.2 | 60 | 9 | 18 | 1.708 | 0.590 | 73 | 98 | 95 | 0.022 |
| 7.2 | 1000 | 90 | 87.6 | 93.8 | 5.7 | 90 | 9 | 18 | 1.657 | 0.529 | 76 | 98 | 95 | 0.022 |
| Reduction of the number of electrolysis cells and the active cell area |
| 6.4 | 1013 | 72 | 83.3 | 88.9 | 5.5 | 72 | 9 | 6 | 1.748 | 1.612 | 75 | 98 | 95 | 0.007 |
| 6.9 | 590 | 50 | 91.2 | 89.5 | 3.5 | 50 | 9 | 6 | 1.736 | 1.021 | 74 | 98 | 95 | 0.007 |
| 7.1 | 455 | 40 | 94.8 | 89.6 | 2.8 | 40 | 9 | 6 | 1.735 | 0.818 | 73 | 98 | 95 | 0.007 |
| 7.5 | 210 | 35 | 96.6 | 91.8 | 1.3 | 35 | 9 | 6 | 1.692 | 0.375 | 73 | 98 | 95 | 0.007 |
| Thermally-disconnected (PV at 20 °C & EL at 80 °C) |
| 7.8 | 1013 | 20 | 102.0 | 87.9 | 6.8 | 80 | 9 | 6 | 1.767 | 1.996 | 76 | 98 | 95 | 0.007 |
| 8.5 | 590 | 20 | 102.0 | 92.7 | 3.9 | 80 | 9 | 6 | 1.677 | 1.103 | 78 | 98 | 95 | 0.007 |
| 8.7 | 455 | 20 | 102.0 | 94.3 | 3.0 | 80 | 9 | 6 | 1.648 | 0.836 | 78 | 98 | 95 | 0.007 |
| 9.1 | 210 | 20 | 102.0 | 97.3 | 1.4 | 80 | 9 | 6 | 1.596 | 0.374 | 79 | 98 | 95 | 0.007 |
| Variation of the cell number |
| 6.3 | 1000 | 72 | 83.3 | 87.4 | 5.5 | 72 | 7 | 6 | 1.746 | 1.589 | 76 | 98 | 95 | 0.006 |
| 7.2 | 1000 | 72 | 83.3 | 99.9 | 5.5 | 72 | 8 | 6 | 1.746 | 1.589 | 76 | 98 | 95 | 0.006 |
| 6.5 | 1000 | 72 | 83.3 | 89.0 | 5.5 | 72 | 9 | 6 | 1.746 | 1.589 | 76 | 98 | 95 | 0.007 |
| 5.8 | 1000 | 72 | 83.3 | 80.1 | 5.5 | 72 | 10 | 6 | 1.746 | 1.589 | 76 | 98 | 95 | 0.008 |
| 5.3 | 1000 | 72 | 83.3 | 72.8 | 5.5 | 72 | 11 | 6 | 1.746 | 1.589 | 76 | 98 | 95 | 0.009 |
© 2019 by the authors. Licensee MDPI, Basel, Switzerland. This article is an open access article distributed under the terms and conditions of the Creative Commons Attribution (CC BY) license (http://creativecommons.org/licenses/by/4.0/).

 ,
, 


