Review of Detection Methods of Static Eccentricity for Interior Permanent Magnet Synchronous Machine


Abstract
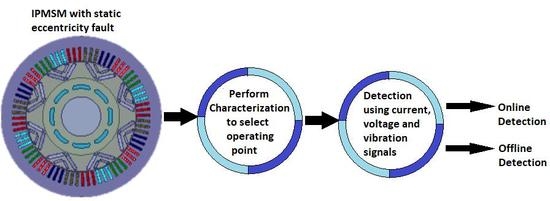
1. Introduction
2. Theoretical Background and Detection Techniques
2.1. Static Eccentricity
2.2. Commanded Voltages Method
2.3. Incremental Inductance Approach
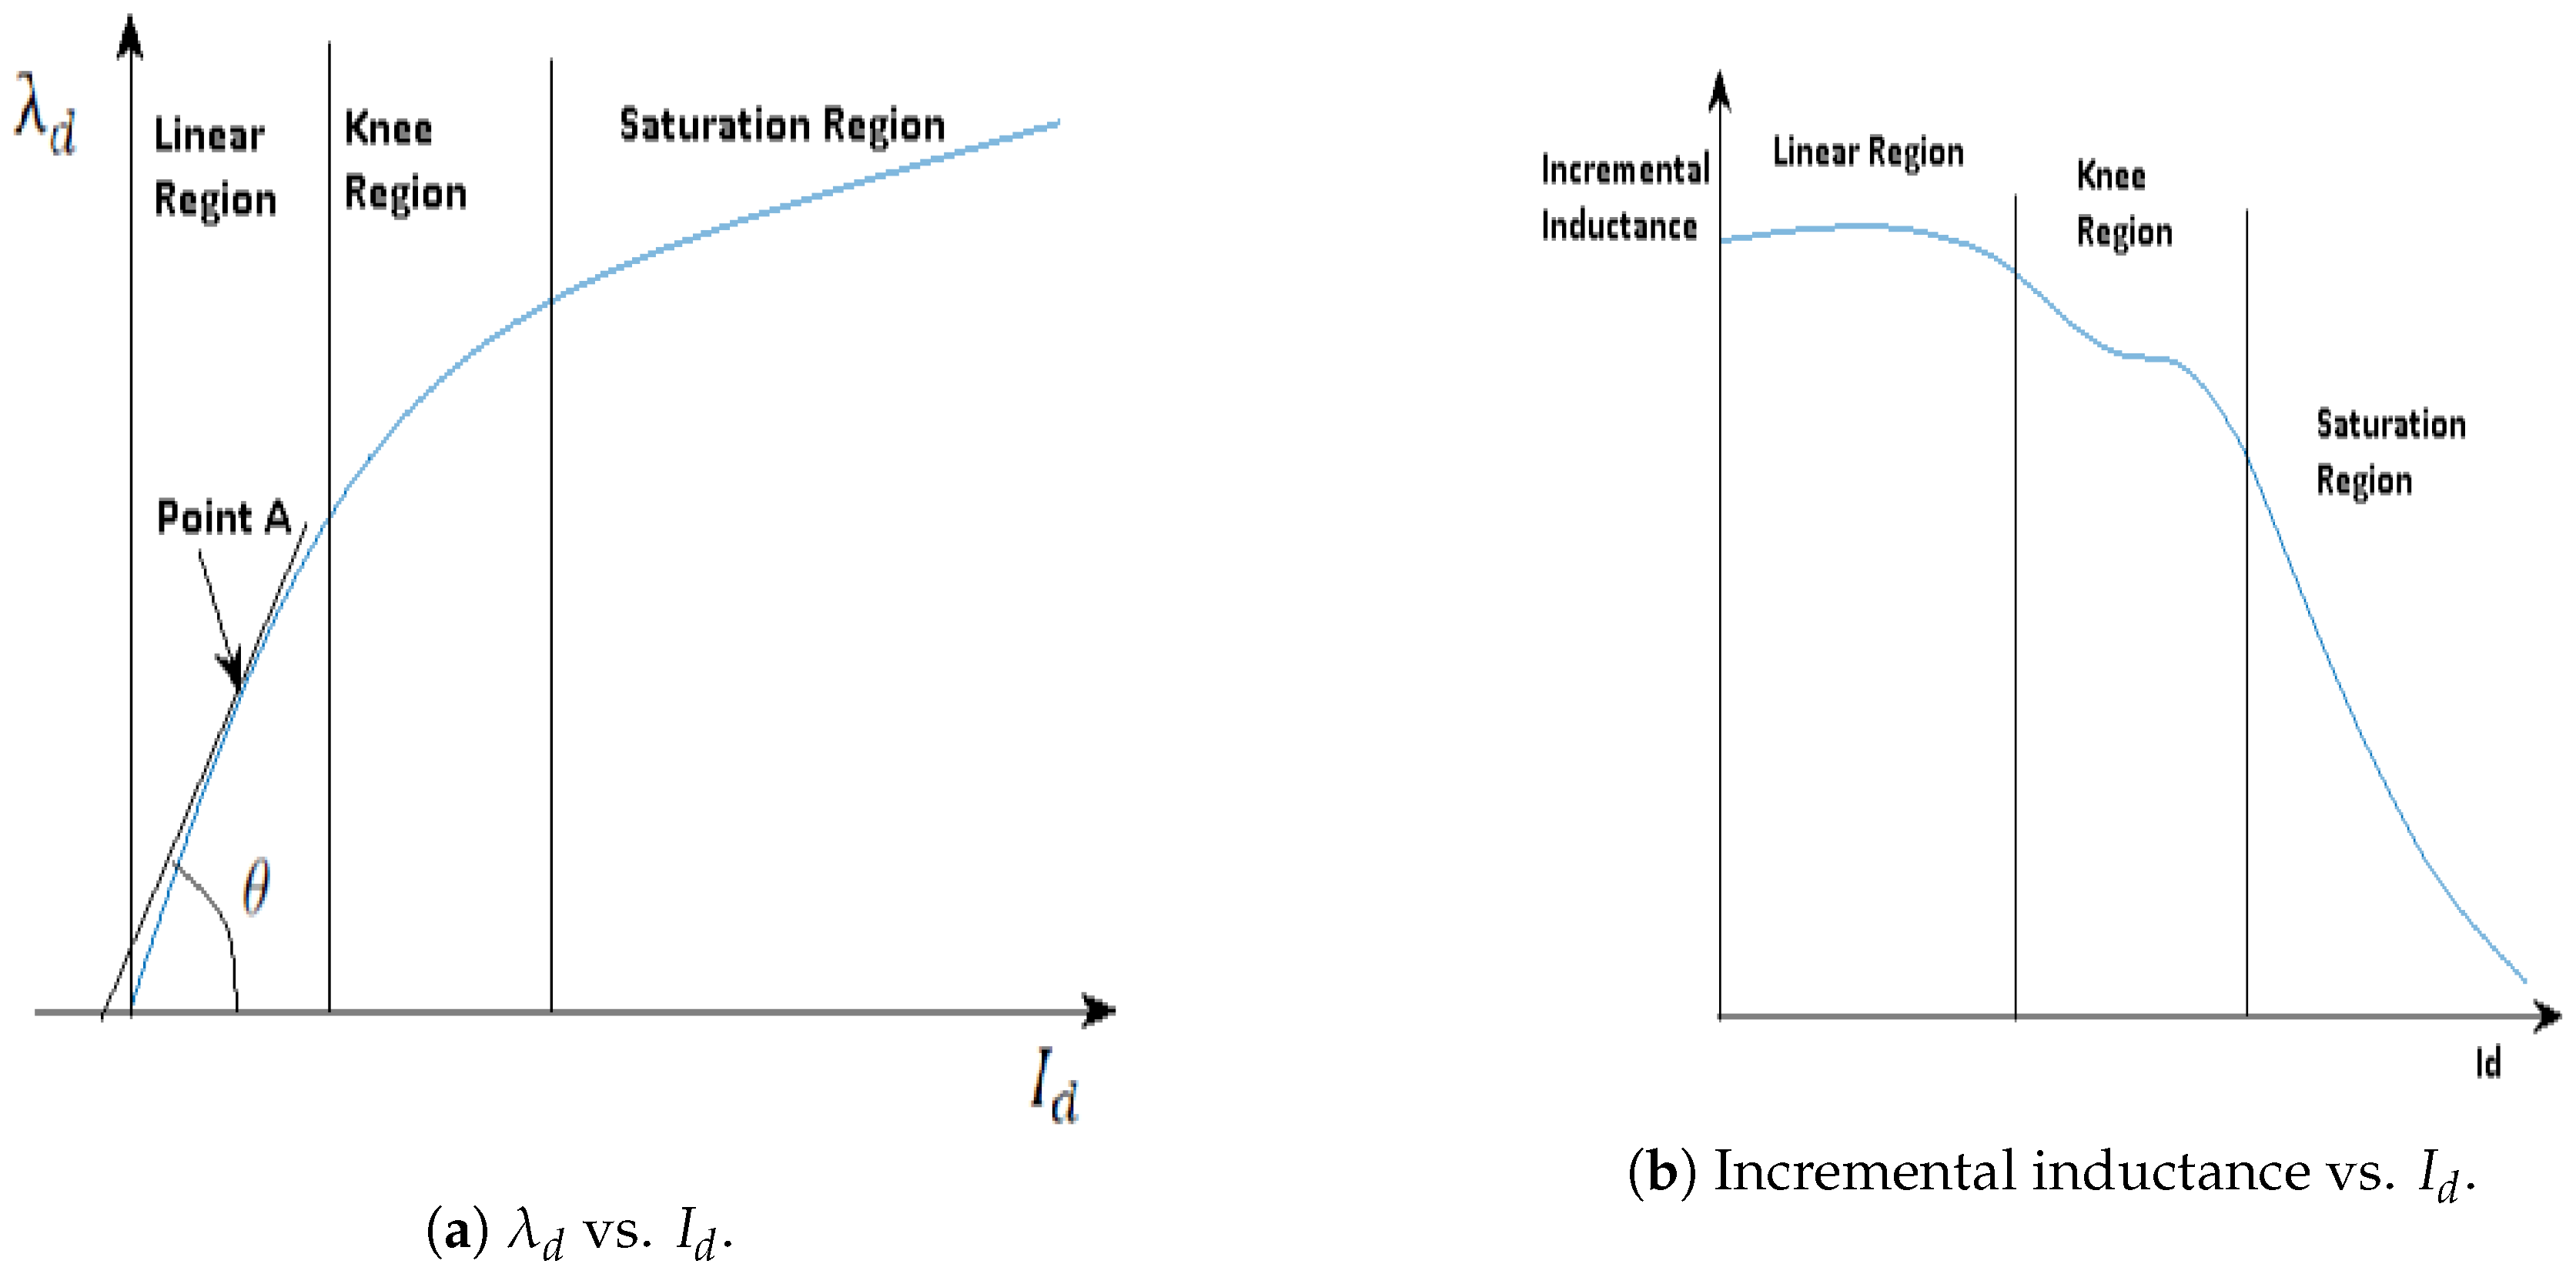
2.3.1. Incremental Inductance Definition and Effect of Fault
2.3.2. Methods to Calculate Incremental Inductance
- Current injection in d-axis with constant rotation:The authors of [11] show the method of generation of incremental inductance curve by injecting d-axis current with increasing levels at constant speed operation. The steady state equations for the PMSM in d–q-axis reference frame are given asOnly d-axis current () is injected, and therefore . Therefore, Equation (4) reduces toUsing Equation (5), the saturation curve ( vs. ) is calculated. From the saturation curve, incremental inductance curve is calculated by taking the derivative of the curve.
- d-axis current injection with AC injection at standstill:Ref. [10] shows the method of generation of incremental inductance curve by injecting d-axis current with an AC component. In this method d-axis current increases the saturation level, whereas the AC component detects the incremental inductance. The incremental inductance can be detected from the fundamental component of AC signal in the d-axis as follows,where and are the fundamental components of AC signals in the motor and is the incremental inductance.
2.4. Harmonics in Voltage and Current Signals
2.5. Detection Using Vibration Signals
- Fundamental
- Stator and rotor MMF harmonics
- Stator and rotor slot permeance harmonics
- Air gap eccentricity permeance harmonics
- Permeance harmonics due to saturation
3. Fault Signals for Detection
3.1. Commanded Voltages Method
3.2. Calculation of Incremental Inductance
3.3. Harmonics in Voltage and Current Signals
3.4. Vibration Signals for Analysis
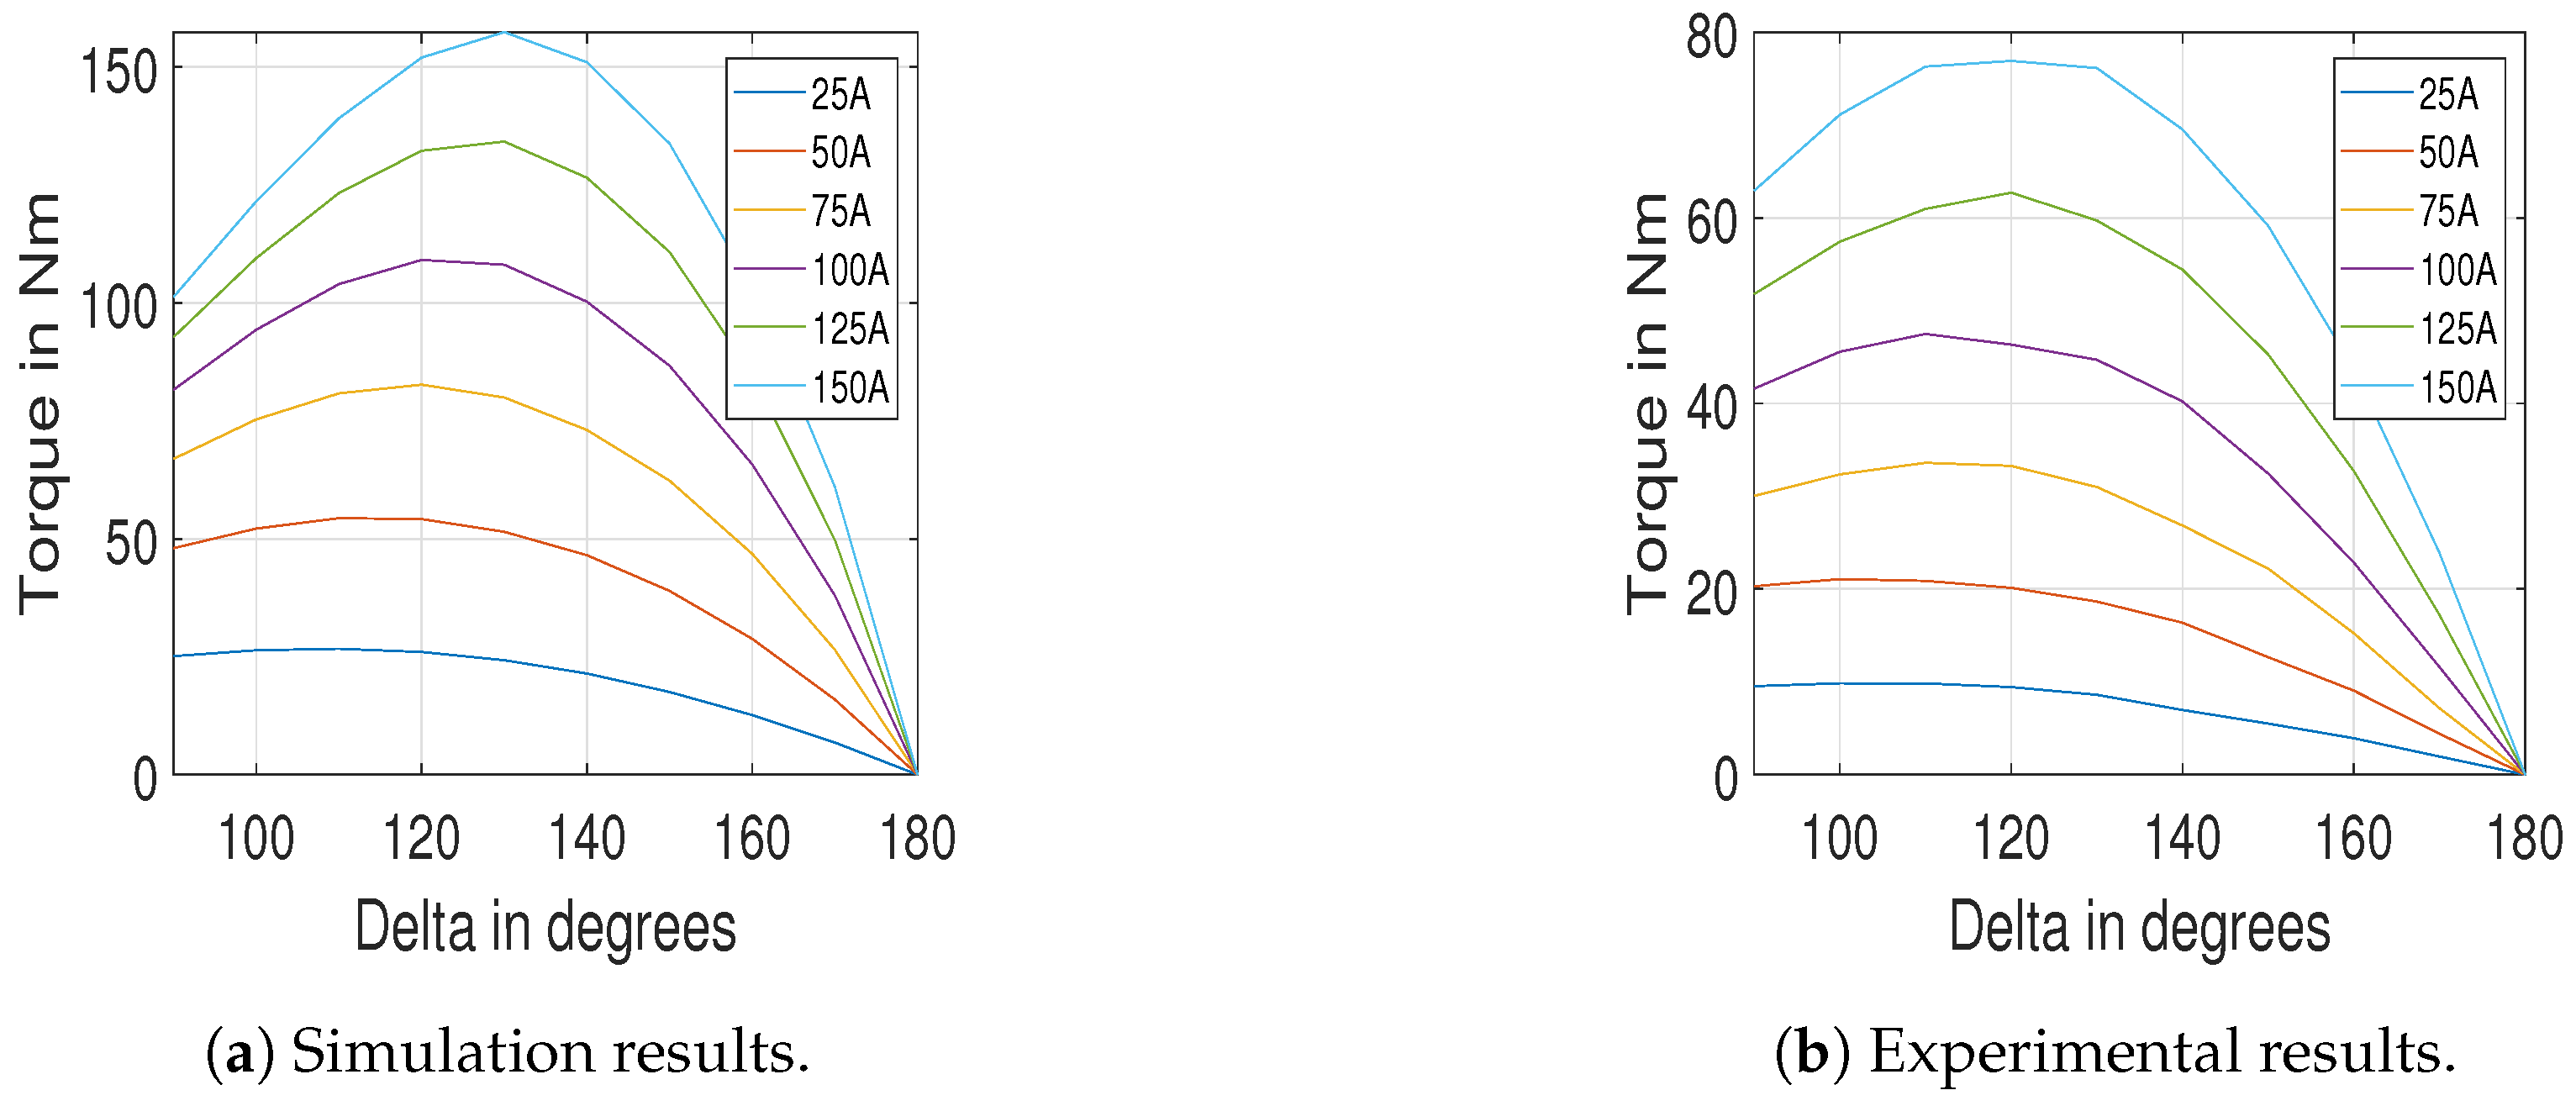
4. Numerical Set-Up and Fault Implementation
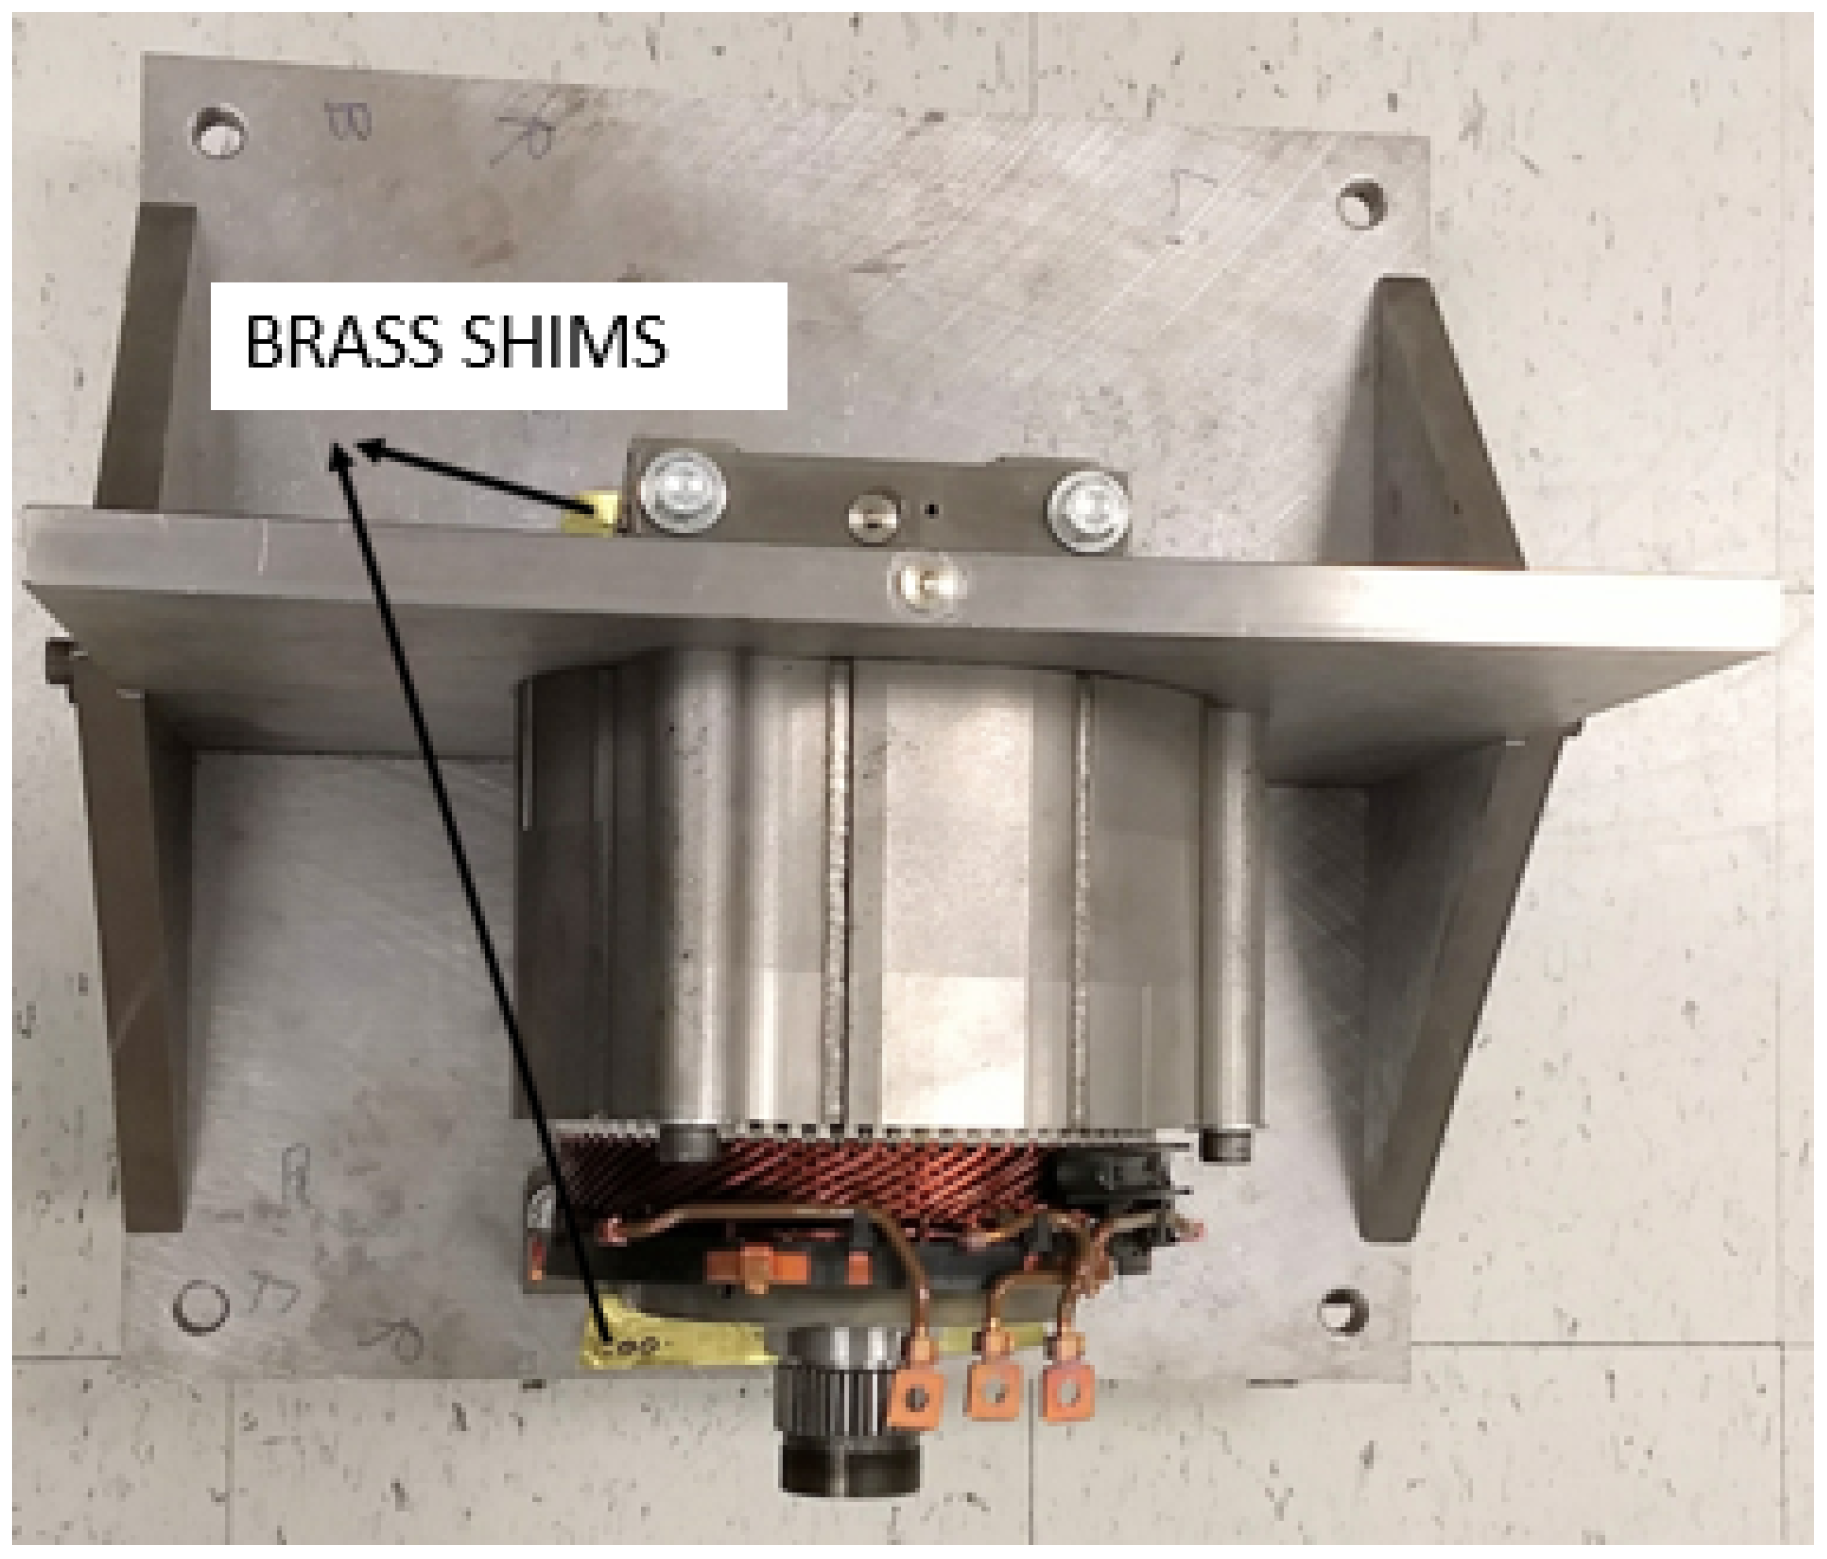
5. Experimental Set Up and Fault Implementation
6. Results
6.1. Commanded Voltages Method
6.1.1. Characterization Results
6.1.2. Operating Point Selection
6.1.3. Voltages at Different Eccentricities
6.2. Incremental Inductance Method
6.2.1. Variation of Incremental Inductance Curve with Current Levels
6.2.2. at Different Eccentricities
6.2.3. Incremental Inductance Curve
6.2.4. at Different Eccentricities
6.3. Harmonic Extraction
6.4. Vibrations and Oscillatory Forces
7. Utility of the Detection Methods
7.1. Mode of Operation
7.1.1. Commanded Voltages Method
7.1.2. Incremental Inductance Method
7.1.3. Harmonics in Voltage and Current Signals
7.1.4. Vibrations and Oscillatory Forces
7.2. Detection under Saturated Conditions
7.2.1. Commanded Voltages Method
7.2.2. Incremental Inductance Method
7.2.3. Harmonics in Voltage and Current Signals
7.2.4. Vibrations and Oscillatory Forces
8. Conclusions
Author Contributions
Funding
Conflicts of Interest
Nomenclature
| Stator Resistance | |
| Electrical Speed | |
| d-axis voltage for healthy case | |
| q-axis voltage for healthy case | |
| d-axis voltage for faulty case | |
| q-axis voltage for faulty case | |
| Value of saturation current values for healthy case | |
| Value of saturation current values for faulty case | |
| 6th | harmonic of IAP for healthy case |
| 6th | harmonic of IAP for faulty case |
| magnitude of harmonic permeance wave due to stator slotting | |
| S | Number of stator slots |
| magnitude of harmonic permeance wave due to saturation | |
| magnitude of harmonic mmf wave due to stator windings | |
| magnitude of harmonic mmf wave due to stator windings | |
| magnitude of harmonic permeance wave due to rotor slotting | |
| Mechanical speed of rotor in rad/s | |
| p | Pole pairs |
| Rotor spatial distribution | |
| Stator spatial distribution | |
| magnitude of harmonic permeance wave due to static eccentricity | |
| g | Air gap length |
| Fraction of static eccentricity fault | |
| Frequency in oscillatory forces due to static eccentricity | |
| Electrical frequency in rad/s | |
| Radial stress | |
| Radial Magnetic Field intensity | |
| Tangential Magnetic Field intensity | |
| Magnitude of Magnetic Field intensity | |
| Permeability of free space | |
| Stress in x-axis at a given time t and position | |
| Stress in y-axis at a given time t and position | |
| Force in x-axis at a given time t | |
| Force in y-axis at a given time t | |
| Differential area chosen around rotor for force calculation |
References
- Rosero, J.; Romeral, J.L.; Cusido, J.; Ortega, J.A.; Garcia, A. Fault detection of eccentricity and bearing damage in a PMSM by means of wavelet transforms decomposition of the stator current. In Proceedings of the 2008 Twenty-Third Annual IEEE Applied Power Electronics Conference and Exposition, Austin, TX, USA, 24–28 February 2008; pp. 111–116. [Google Scholar] [CrossRef]
- Ebrahimi, B.M.; Faiz, J.; Roshtkhari, M.J. Static-, Dynamic-, and Mixed-Eccentricity Fault Diagnoses in Permanent-Magnet Synchronous Motors. IEEE Trans. Ind. Electron. 2009, 56, 4727–4739. [Google Scholar] [CrossRef]
- Ebrahimi, B.M.; Roshtkhari, M.J.; Faiz, J.; Khatami, S.V. Advanced Eccentricity Fault Recognition in Permanent Magnet Synchronous Motors Using Stator Current Signature Analysis. IEEE Trans. Ind. Electron. 2014, 61, 2041–2052. [Google Scholar] [CrossRef]
- Bruzzese, C.; Joksimovic, G.; Santini, E. Static eccentricity detection in synchronous generators by field current and stator Voltage Signature Analysis—Part II: Measurements. In Proceedings of the XIX International Conference on Electrical Machines—ICEM 2010, Rome, Italy, 6–8 September 2010; pp. 1–5. [Google Scholar] [CrossRef]
- Goktas, T.; Zafarani, M.; Akin, B. Discernment of Broken Magnet and Static Eccentricity Faults in Permanent Magnet Synchronous Motors. IEEE Trans. Energy Convers. 2016, 31, 578–587. [Google Scholar] [CrossRef]
- Bessous, N.; Sbaa, S.; Zouzou, S.E.; Bentrah, W.; Becer, Z.; Zarour, L. Application of new quantitative and qualitative study based on DWT method to diagnose the eccentricity fault in induction motors. In Proceedings of the 2017 5th International Conference on Electrical Engineering—Boumerdes (ICEE-B), Boumerdes, Algeria, 29–31 October 2017; pp. 1–6. [Google Scholar] [CrossRef]
- Cintron-Rivera, J.G.; Foster, S.N.; Strangas, E.G. Mitigation of Turn-to-Turn Faults in Fault Tolerant Permanent Magnet Synchronous Motors. IEEE Trans. Energy Convers. 2015, 30, 465–475. [Google Scholar] [CrossRef]
- Hao, L.; Nawrocki, S.; Tang, X. Modeling & analysis of weld short faults of bar-wound propulsion IPM machine part I: Turn short. In Proceedings of the 2011 IEEE Vehicle Power and Propulsion Conference; Chicago, IL, USA; pp. 1–6. [CrossRef]
- Haddad, R.Z.; Lopez, C.A.; Foster, S.N.; Strangas, E.G. A Voltage-Based Approach for Fault Detection and Separation in Permanent Magnet Synchronous Machines. IEEE Trans. Ind. Appl. 2017, 53, 5305–5314. [Google Scholar] [CrossRef]
- Hong, J.; Park, S.; Hyun, D.; Kang, T.; Lee, S.B.; Kral, C.; Haumer, A. Detection and Classification of Rotor Demagnetization and Eccentricity Faults for PM Synchronous Motors. IEEE Trans. Ind. Appl. 2012, 48, 923–932. [Google Scholar] [CrossRef]
- Haddad, R.Z.; Strangas, E.G. Detection of static eccentricity and turn-to-turn short circuit faults in permanent magnet synchronous AC machines. In Proceedings of the 2015 IEEE 10th International Symposium on Diagnostics for Electrical Machines, Power Electronics and Drives (SDEMPED), Guarda, Portugal, 4 September 2015; pp. 277–283. [Google Scholar] [CrossRef]
- Rajagopalan, S.; Aller, J.M.; Restrepo, J.A.; Habetler, T.G.; Harley, R.G. Detection of Rotor Faults in Brushless DC Motors Operating Under Nonstationary Conditions. IEEE Trans. Ind. Appl. 2006, 42, 1464–1477. [Google Scholar] [CrossRef]
- Nandi, S.; Toliyat, H.A. Detection of rotor slot and other eccentricity related harmonics in a three phase induction motor with different rotor cages. In Proceedings of the 1998 International Conference on Power Electronic Drives and Energy Systems for Industrial Growth, Perth, Australia, 1–3 December 1998; Volume 1, pp. 135–140. [Google Scholar] [CrossRef]
- Zhu, Z.Q.; Wu, L.J.; Mohd Jamil, M.L. Influence of Pole and Slot Number Combinations on Cogging Torque in Permanent-Magnet Machines With Static and Rotating Eccentricities. IEEE Trans. Ind. Appl. 2014, 50, 3265–3277. [Google Scholar] [CrossRef]
- Haddad, R.Z.; Strangas, E.G. Fault detection and classification in permanent magnet synchronous machines using Fast Fourier Transform and Linear Discriminant Analysis. In Proceedings of the 2013 9th IEEE International Symposium on Diagnostics for Electric Machines, Power Electronics and Drives (SDEMPED), Valencia, Spain, 27–30 August 2013; pp. 99–104. [Google Scholar] [CrossRef]
- Wang, B.; Wang, J.; Griffo, A.; Sen, B. Stator Turn Fault Detection by Second Harmonic in Instantaneous Power for a Triple-Redundant Fault-Tolerant PM Drive. IEEE Trans. Ind. Electron. 2018, 65, 7279–7289. [Google Scholar] [CrossRef]
- Ahsanullah, K.; Jeyasankar, E.; Vignesh, A.N.; Panda, S.K.; Shanmukha, R.; Nadarajan, S. Eccentricity fault analysis in PMSM based marine propulsion motors. In Proceedings of the 2017 20th International Conference on Electrical Machines and Systems (ICEMS), Sydney, Australia, 11–14 August 2017; pp. 1–6. [Google Scholar] [CrossRef]
- Jang, G.H.; Lieu, D.K. Vibration reduction in electric machine by interlocking of the magnets. IEEE Trans. Magn. 1993, 29, 1423–1426. [Google Scholar] [CrossRef]
- Dorrell, D.G.; Hsieh, M.; Guo, Y. Unbalanced Magnet Pull in Large Brushless Rare-Earth Permanent Magnet Motors With Rotor Eccentricity. IEEE Trans. Magn. 2009, 45, 4586–4589. [Google Scholar] [CrossRef]
- Calleecharan, Y.; Aidanpaa, J. Stability analysis of an hydropower generator subjected to unbalanced magnetic pull. IET Sci. Meas. Technol. 2011, 5, 231–243. [Google Scholar] [CrossRef]
- Ruf, A.; Schröder, M.; Putri, A.; Franck, D.; Hameyer, K. Analysis and determination of mechanical bearing load caused by unbalanced magnetic pull. In Proceedings of the 2014 17th International Conference on Electrical Machines and Systems (ICEMS), Zhejiang, China, 22–25 October 2014; pp. 8–14. [Google Scholar] [CrossRef]
- Maruthi, G.S.; Hegde, V. Mathematical analysis of unbalanced magnetic pull and detection of mixed air gap eccentricity in induction motor by vibration analysis using MEMS accelerometer. In Proceedings of the 2013 IEEE 1st International Conference on Condition Assessment Techniques in Electrical Systems (CATCON), Kolkata, India, 6–8 December 2013; pp. 207–212. [Google Scholar]
- Li, J.T.; Liu, Z.J.; Nay, L.H.A. Effect of radial magnetic forces in permanent magnet motors with rotor eccentricity. IEEE Trans. Magn. 2007, 43, 2525–2527. [Google Scholar] [CrossRef]
- Aggarwal, A.; Strangas, E.G.; Agapiou, J. Robust Voltage based Technique for Automatic Off-Line Detection of Static Eccentricity of PMSM. In Proceedings of the 2019 IEEE International Electric Machines Drives Conference (IEMDC), San Diego, CA, USA, 11–15 May 2019; pp. 351–358. [Google Scholar] [CrossRef]
- Cameron, J.R.; Thomson, W.T.; Dow, A.B. Vibration and current monitoring for detecting airgap eccentricity in large induction motors. IEE Proc. B Electr. Power Appl. 1986, 133, 155–163. [Google Scholar] [CrossRef]
- Heller, B.; Hamata, V. Harmonic Field Effects in Induction Machines; Elsevier Scientific Publishing Company: Amsterdam, The Netherlands, 1977. [Google Scholar]
- Rahman, K.M.; Hiti, S. Identification of machine parameters of a synchronous motor. In Proceedings of the 38th IAS Annual Meeting on Conference Record of the Industry Applications Conference, Salt Lake City, UT, USA, 12–16 October 2003; Volume 1, pp. 409–415. [Google Scholar] [CrossRef]
- Cintron-Rivera, J.G.; Babel, A.S.; Montalvo-Ortiz, E.E.; Foster, S.N.; Strangas, E.G. A simplified characterization method including saturation effects for permanent magnet Machines. In Proceedings of the 2012 XXth International Conference on Electrical Machines, Marseille, France, 2–5 September 2012; pp. 837–843. [Google Scholar] [CrossRef]
- Kliman, G.B.; Stein, J. Methods of Motor Current Signature Analysis. Electr. Mach. Power Syst. 1992, 20, 463–474. [Google Scholar] [CrossRef]
- Chin, R.; Kanninen, P. The Phenomenon of Magnetic Force: Estimating its Effects on Wind Turbine Generators. IEEE Ind. Appl. Mag. 2013, 19, 39–46. [Google Scholar] [CrossRef]
- Ebrahimi, B.M.; Faiz, J. Magnetic field and vibration monitoring in permanent magnet synchronous motors under eccentricity fault. IET Electr. Power Appl. 2012, 6, 35–45. [Google Scholar] [CrossRef]


| Healthy Case | 25% ECC | 50% ECC | |
|---|---|---|---|
| Experiment | 93.22 | 90 | 77.85 |
| FEA | 400.4 | 378.2 | 331.2 |
© 2019 by the authors. Licensee MDPI, Basel, Switzerland. This article is an open access article distributed under the terms and conditions of the Creative Commons Attribution (CC BY) license (http://creativecommons.org/licenses/by/4.0/).
Share and Cite
Aggarwal, A.; Strangas, E.G. Review of Detection Methods of Static Eccentricity for Interior Permanent Magnet Synchronous Machine. Energies 2019, 12, 4105. https://doi.org/10.3390/en12214105
Aggarwal A, Strangas EG. Review of Detection Methods of Static Eccentricity for Interior Permanent Magnet Synchronous Machine. Energies. 2019; 12(21):4105. https://doi.org/10.3390/en12214105
Chicago/Turabian StyleAggarwal, Anmol, and Elias G. Strangas. 2019. "Review of Detection Methods of Static Eccentricity for Interior Permanent Magnet Synchronous Machine" Energies 12, no. 21: 4105. https://doi.org/10.3390/en12214105
APA StyleAggarwal, A., & Strangas, E. G. (2019). Review of Detection Methods of Static Eccentricity for Interior Permanent Magnet Synchronous Machine. Energies, 12(21), 4105. https://doi.org/10.3390/en12214105