1. Introduction
Lightning discharges and operational maneuvers, such as switching of capacitor banks, can generate overvoltage that propagates in the electrical network. The increased levels of voltage in distribution networks cause concern to electric power utilities, because the presence of overvoltage can provoke, among others, malfunctioning and reduction of lifespan of equipment and devices, and in some cases might even cause permanent failures that may result in partial or complete shutdown of the electrical network. In addition to the losses due to equipment damage, if the electric power utility remains too long with no power supply, it shall be subjected to penalties which may reach significant values as the shutdown time period increases.
Thus, using mitigating measures is essential in order to avoid these costs, and it is as important as mitigation to conduct preventive measures in order to protect the equipment and the electrical grid against overvoltage. One way to achieve equipment protection against high levels of overvoltage is through the installation of surge arresters along the power grid [
1]. A surge arrester, as long as it is properly grounded, is able to damp overvoltage, sending part of the electrical current to ground.
A recurring problem among electric utilities is how to define an efficient methodology to perform surge arresters allocation along the electric network. To perform this allocation in an efficient manner, it is recommended to take into consideration the optimal placement of surge arresters along the power grid. In addition to maintaining the quality of power delivered to consumers by keeping the voltage levels below the system insulation limit, it is of great importance to ensure the equipment protection and secure operation, as well as allow better planning on future equipment installation.
Many works can be found in the literature whose focus is the allocation of surge arresters using metaheuristics (e.g., [
2,
3,
4,
5,
6,
7,
8]). Several intelligent techniques may be used for the allocation procedure, for example, the use of Fuzzy Logic technique [
2], the Discrete Imperialist Competition Algorithm [
7], and the Genetic Algorithm, which is one of the computational intelligence techniques that seems to be quite consolidated in the optimal solution of this type of problem [
3,
4,
5,
6,
8].
It is common to adopt a statistical approach using the Monte Carlo’s method for the exhaustive generation of lightning discharges of different magnitudes [
2,
3,
4,
7,
8], to analyze the induced overvoltage along the electrical grid [
2,
3,
4,
5,
6,
7,
8] in order to perform a risk analysis based on the probability of flashover occurrence [
2,
3,
7]. In some cases, this assessment is made based on the critical flashover voltage
[
5,
6,
8].
However, taking into account that real electric distribution networks invariably have a large number of electrical nodes, the time required for processing the transient analyses in an exhaustive manner in these electrical networks can become prohibitive, even in the pre-execution phase of the optimization procedure, generating limitation in the number of simulations for the application of Monte Carlo’s procedure. To overcome this difficulty, in this article, a deterministic approach is used to identify in which electric nodes the incidence of direct lightning discharges causes the largest overvoltage in the system, so that only this reduced set of more critical electrical nodes will be part of the optimization procedure.
Two main innovative aspects differentiate this work with respect to others found in the literature. The first one is the use of a fitness function that takes into account weight factors to distinguish the desired protection level for electrical nodes and equipment individually, and also considering restrictions on the number of surge arresters to be allocated. This aims at maximizing the protection level and at the same time minimizing the number of surge arresters needed, which allows the user to configure the problem focus through the definition of the fitness function. The second aspect to be highlighted is the proposed procedure to select the most critical electric nodes concerning the incidence of lightning discharges. This procedure makes it possible to apply the optimal surge arrester allocation routine even in large electrical networks using ATP.
2. Proposed Methodology
To perform the surge arrester allocation using the proposed GA procedure, firstly, it is necessary to model the electrical network via ATP input cards, which serve as template for the genetic algorithm. This template can be constructed manually by using ATPDraw module or automatically by using the procedure presented in [
9].
Once the template is built, it is necessary to select in the electrical network under study, the critical electric nodes to apply lightning discharges, which will propagate voltage and current surges along the power grid [
1]. It is important that all genetic individuals created in all populations of the GA evolution be tested in the same scenario, with the same lightning incidence points, otherwise it is considered that the GA individuals represent distinct scenarios. Before presenting the genetic algorithm configuration, it is necessary to introduce some concepts that were used in the proposed methodology for surge arresters allocation.
2.1. Lightning Discharge Modeling
The lightning discharge current is modeled by the impulsive Heidler function, as presented in Equation (
1).
This waveform is characterized by the parameters: rising time
, settling time
, lightning discharge current magnitude
, magnitude correction factor
, and
n, an exponent varying from 2 to 10. Parameter
is represented in Equation (
2) [
10] being
μs and
μs:
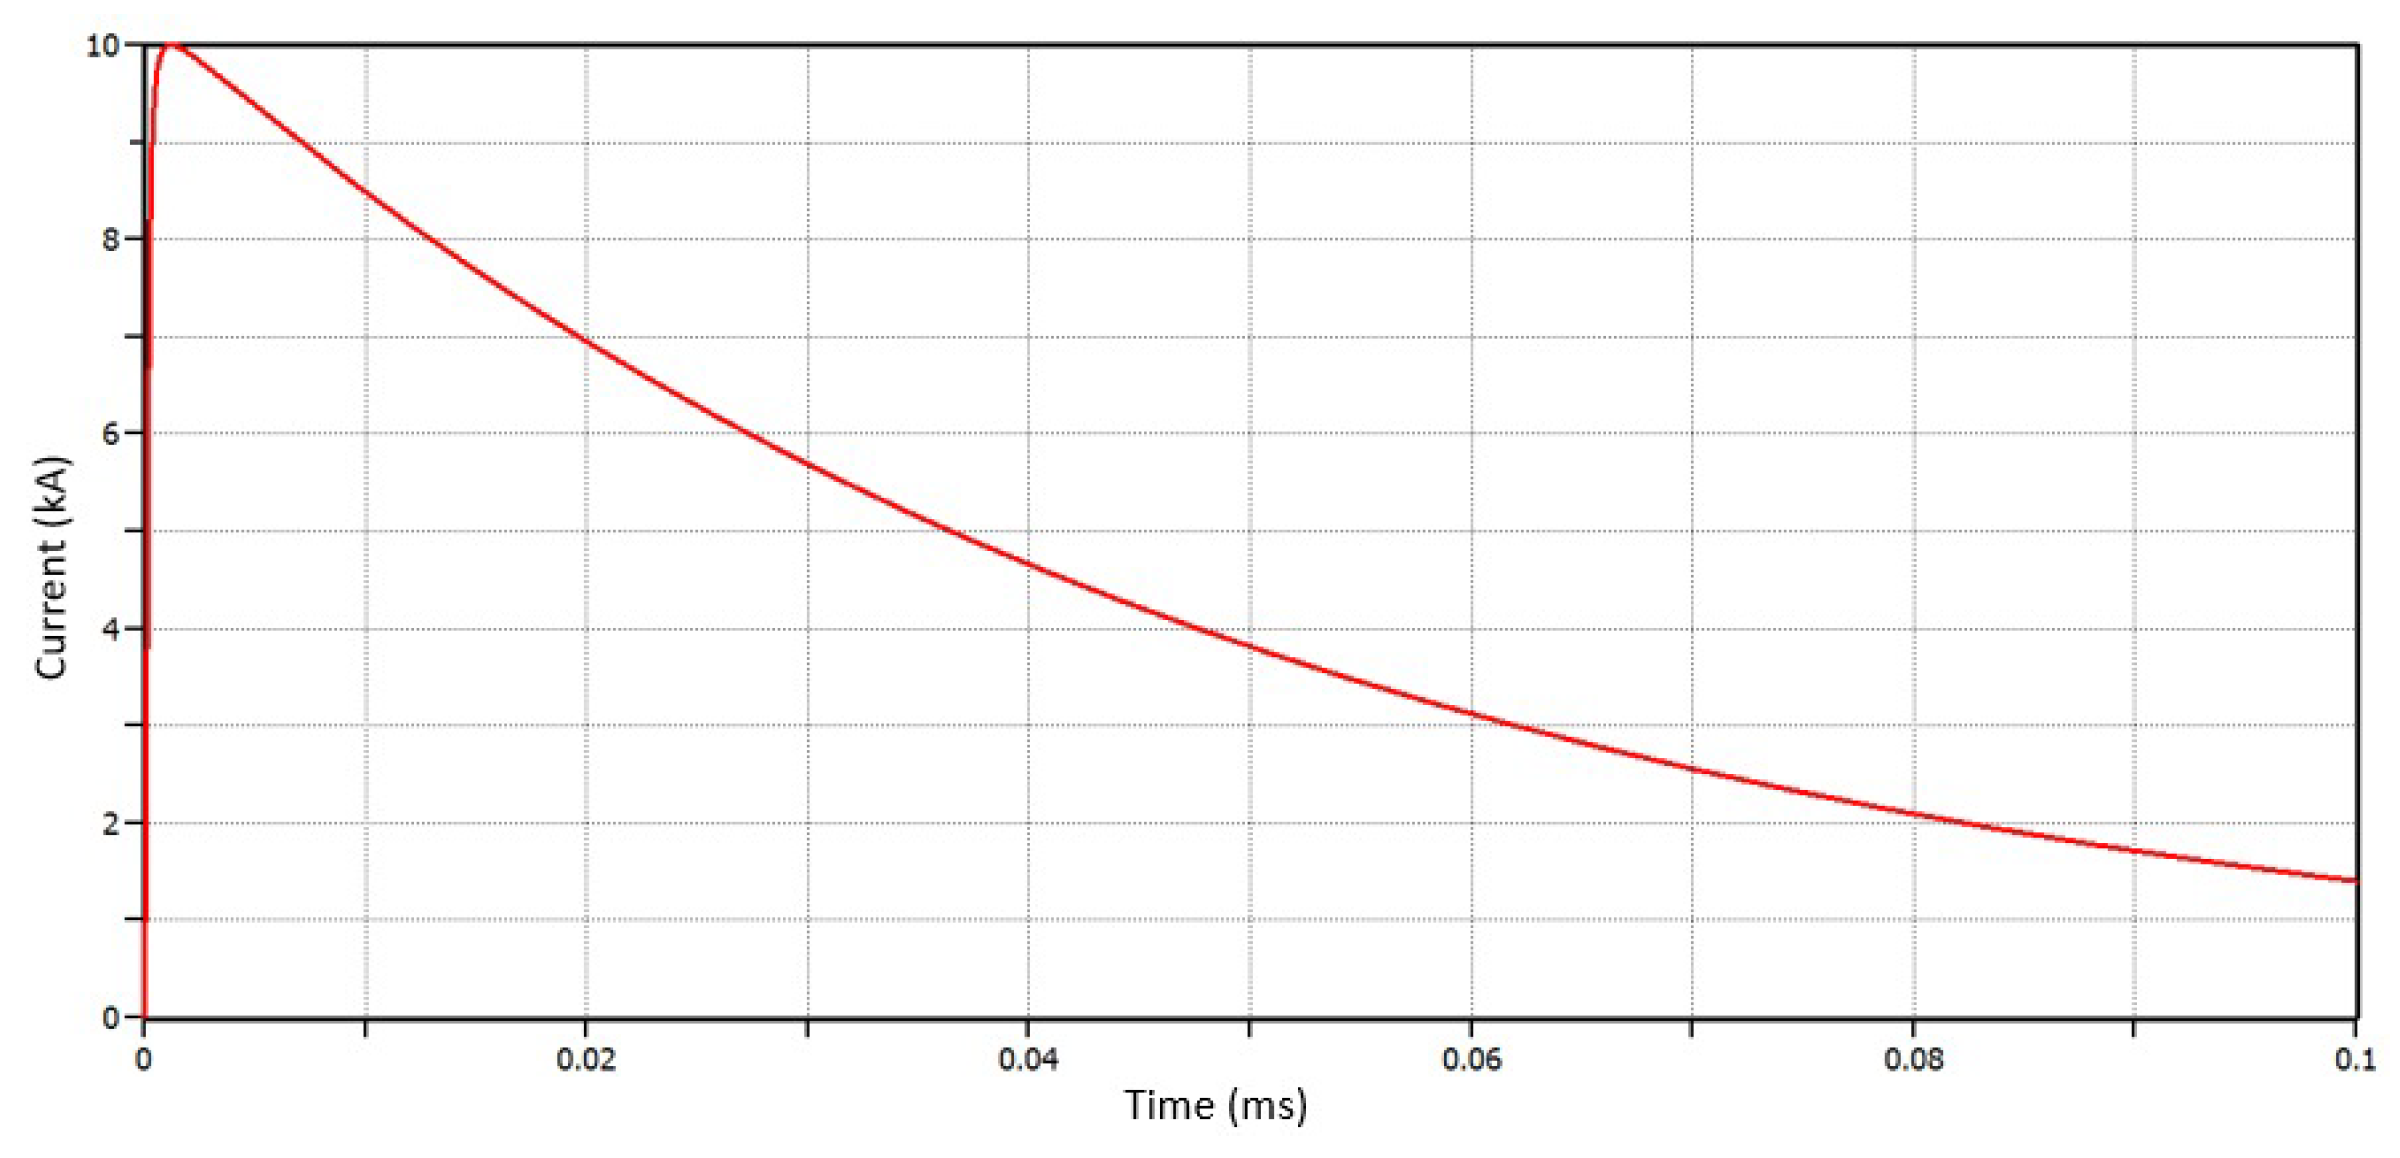
In this article, a lightning discharge waveform of 1.2/50 and peak current magnitude of 10 kA are used, as illustrated in
Figure 1. The 10 kA magnitude was chosen for having a significant incidence in typical urban distribution grids and also as being a standard lightning discharge to test surge arresters in distribution grids with nominal voltage of 13.8 kV and 34.5 kV [
11,
12].
Induced lightning overvoltage in distribution feeders can cause significant impacts, and are widely used in the literature to evaluate the allocation of lightning arresters and other protection devices [
4,
6,
13,
14,
15]. Due to the lower voltage class of these feeders, the induced overvoltage caused by lightning discharge also tends to be smaller. On the other hand, the direct lightning discharges cause overvoltage of higher magnitudes, being considered a more critical condition for the protection of the electric grid and customers’ equipment. In this article, only direct lightning discharges are considered in the analysis.
2.2. Cross Mean Table
Firstly, it is highlighted that, for every surge arrester allocation suggested by the GA solution, a simulation of ATP electromagnetic transient analysis is performed. With respect to this point, it is worth mentioning that the use of the GA in conjunction with ATP for the optimal solution is a process that consumes too much processing time, which makes the application of this optimization process to a great diversity of lightning discharges in large electric distribution grids impracticable in terms of the solution time duration.
Thus, the concept of Cross Mean Table (CMT) was created, which represents an organized summary of ATP simulation results obtained by simulating the incidence of lightning discharge in each electrical node of the grid, one at a time. In this case, when applying the GA optimization procedure, instead of considering lighting discharges in all nodes of the electric network, only the electrical nodes with the most critical overvoltage values obtained in the ATP simulation are considered for incidence of lightning discharges and participate in all GA generations.
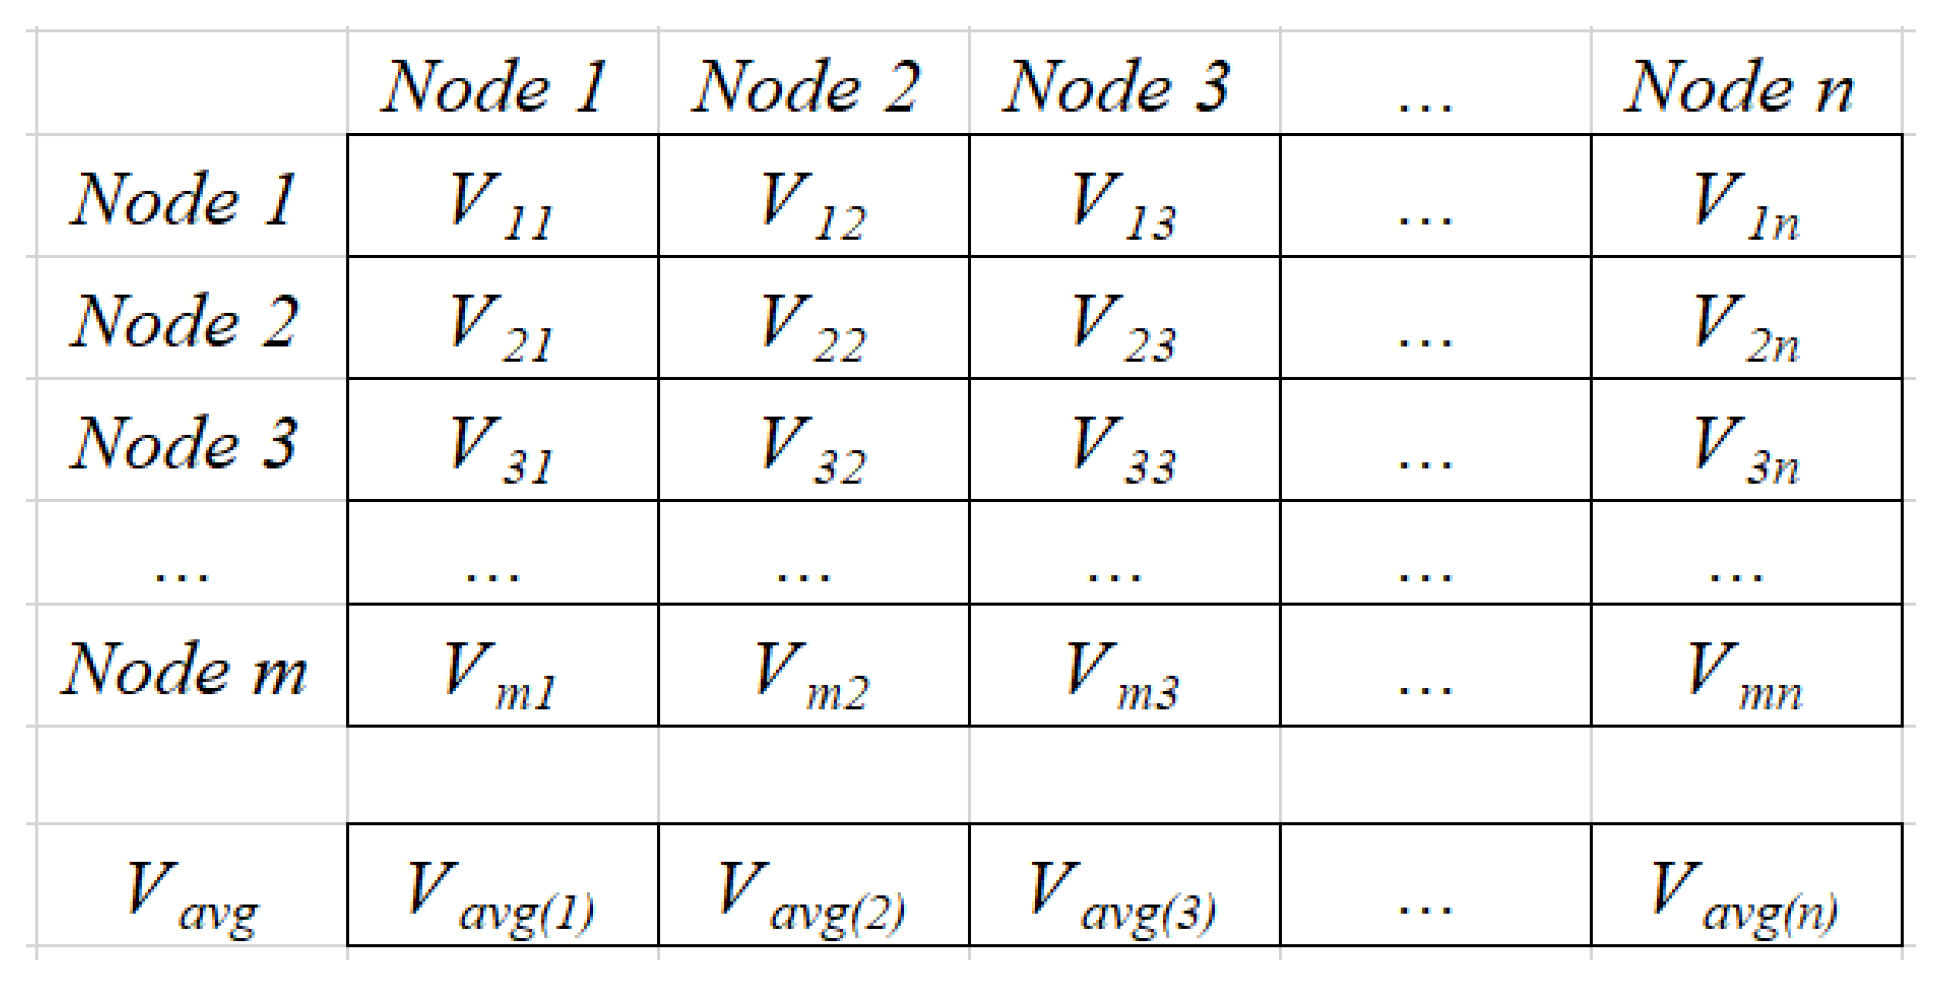
To construct the CMT, it is necessary to create a
array, as depicted in
Figure 2, where
m is the total number of nodes in the electric network and
n is the number of nodes at which it is desired to evaluate the impacts of lightning discharges. For each node
n in the column array, it is simulated, by using ATP, the incidence of a lightning discharge with same parameters for each node. The highest overvoltage resulting in phases A-B-C of nodes
m due to lightning discharges in nodes
n are stored in the column array forming the elements
, for
i = 1, 2, …,
m.
A sensitivity analysis is performed to evaluate for which node j the overvoltage caused in the electric network is more critical. The average overvoltage per column is calculated and stored in the array . Once this array is sorted, it is possible to identify the most critical nodes for lightning discharges. Thus, it is reasonable that any study done to mitigate the impacts caused in the network due to lightning discharges should first consider the most critical nodes, assuming that, by minimizing damages caused in this scenario, the impacts due to lightning discharges in other nodes would consequently be reduced.
2.3. Genetic Algorithm
Genetic algorithm is a technique of local search that uses evolution-based procedures to make small changes in a population of chromosomes in searching for an optimal solution [
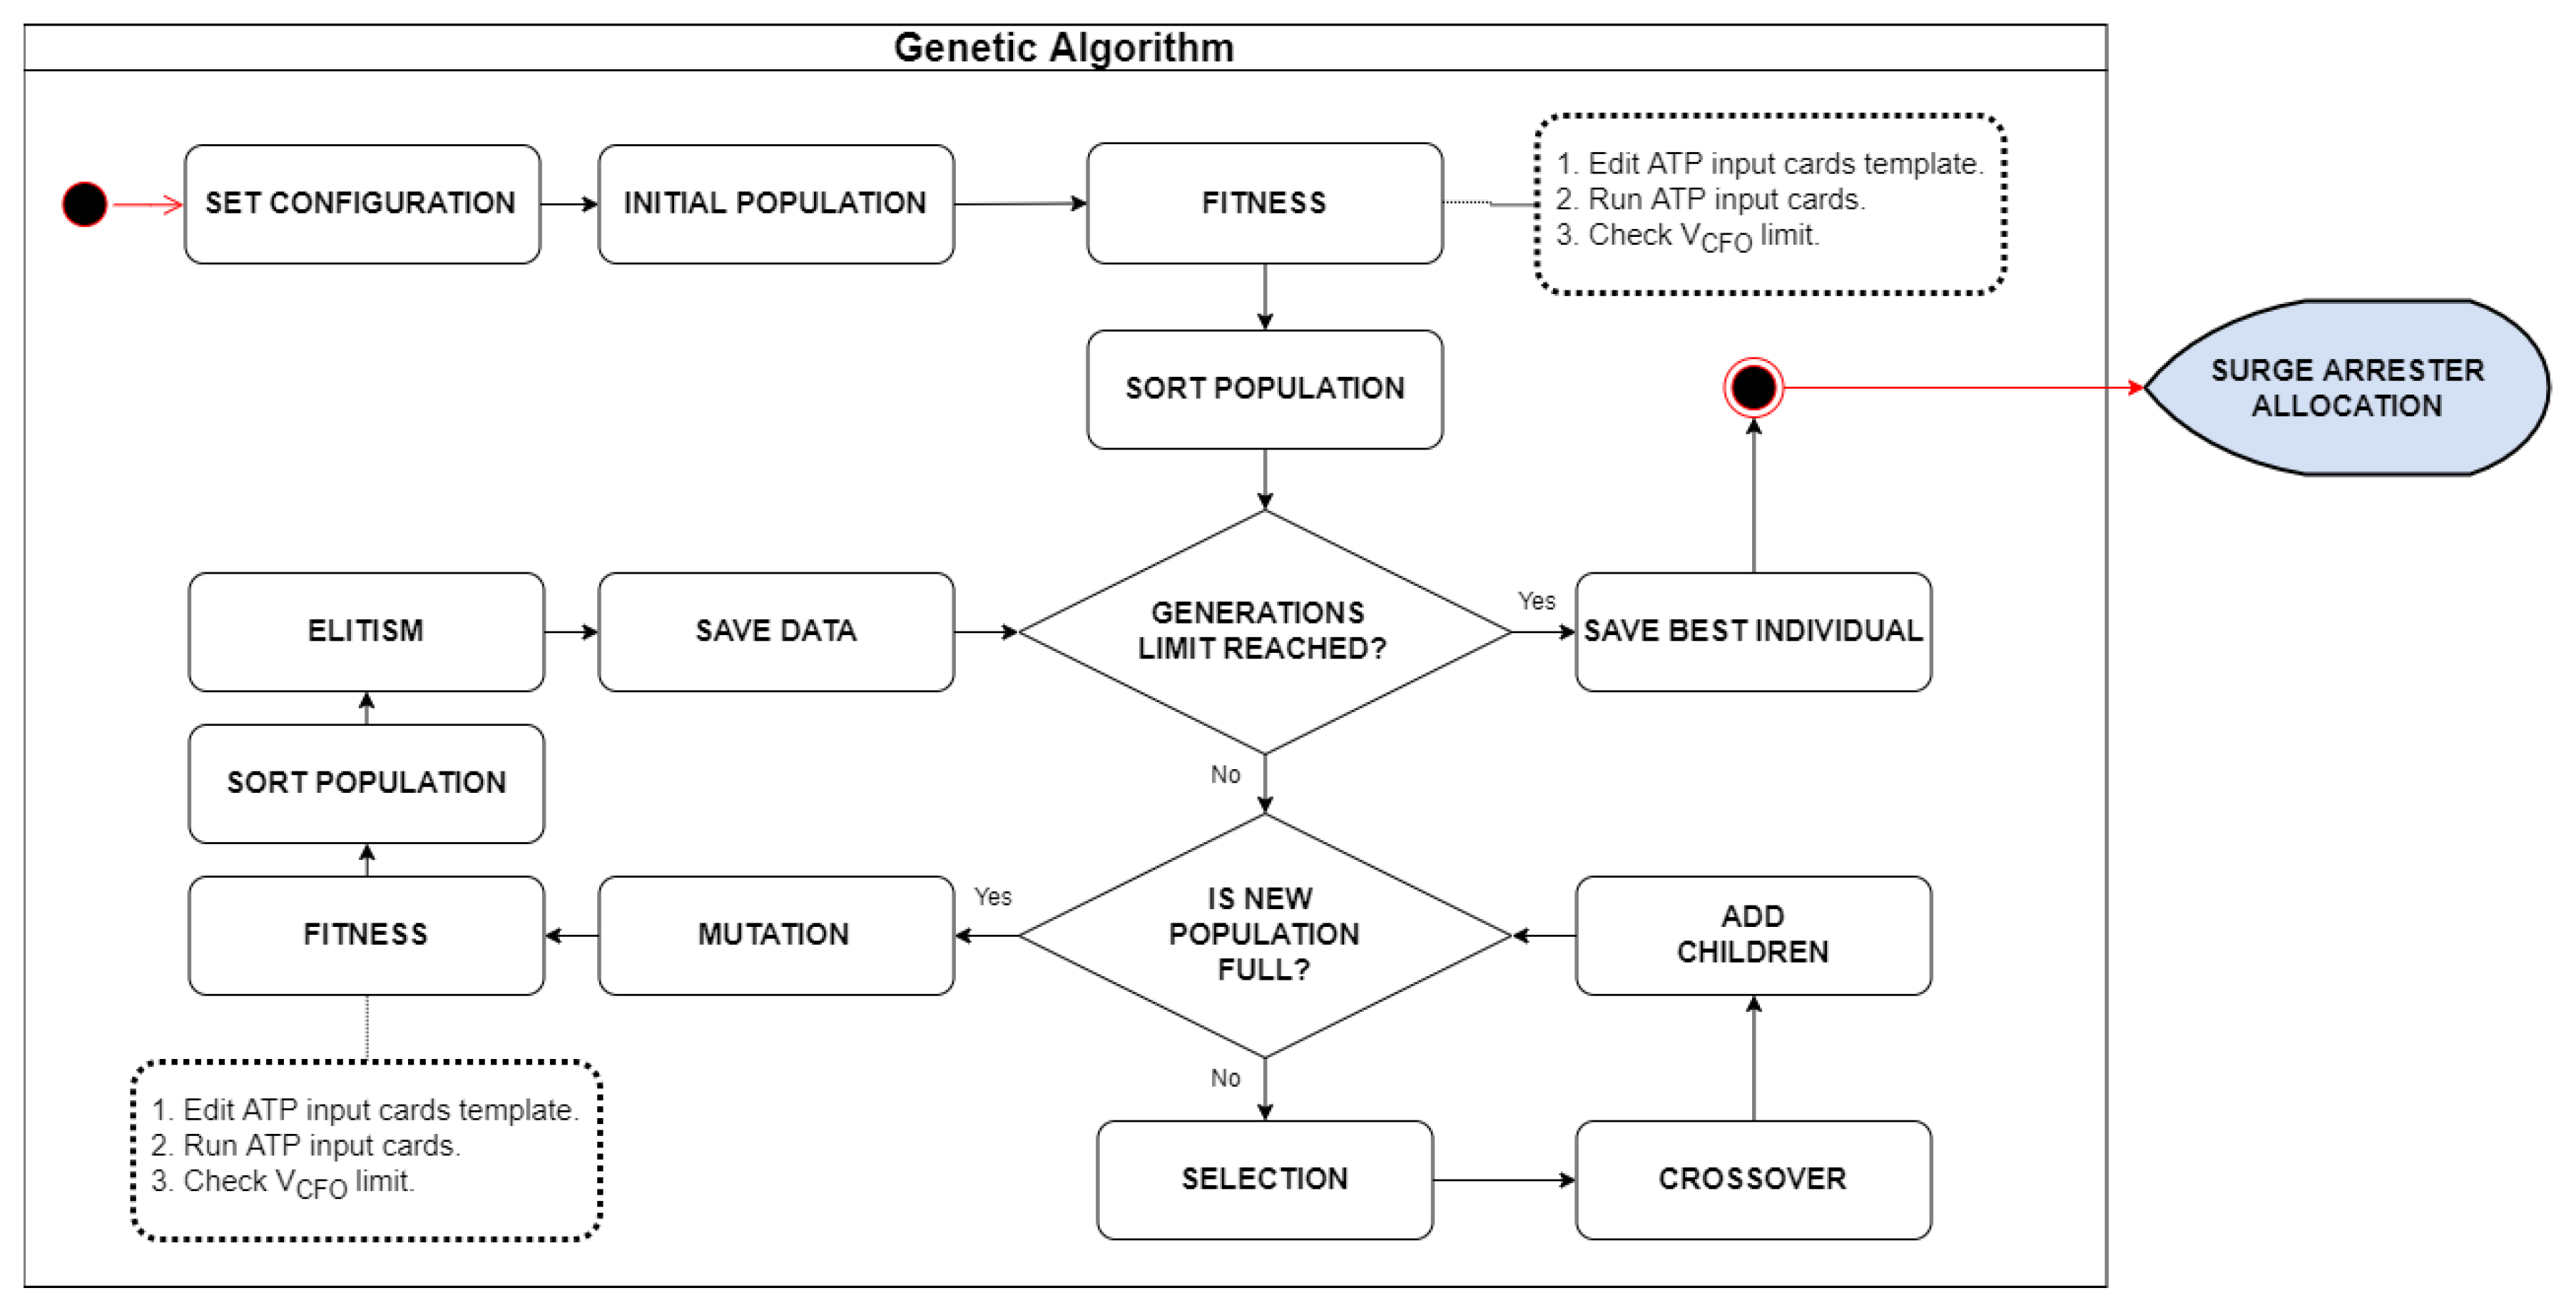
16]. In the following, a discussion on the main elements that compose the genetic algorithm fundamentals applying to the problem of surge arrester optimal allocation is presented, as shown in
Figure 3.
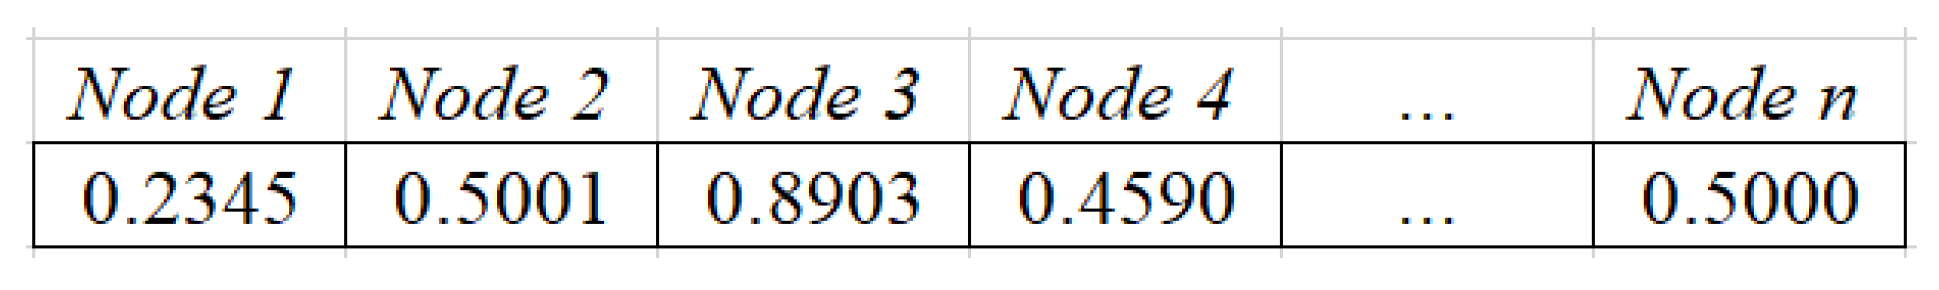
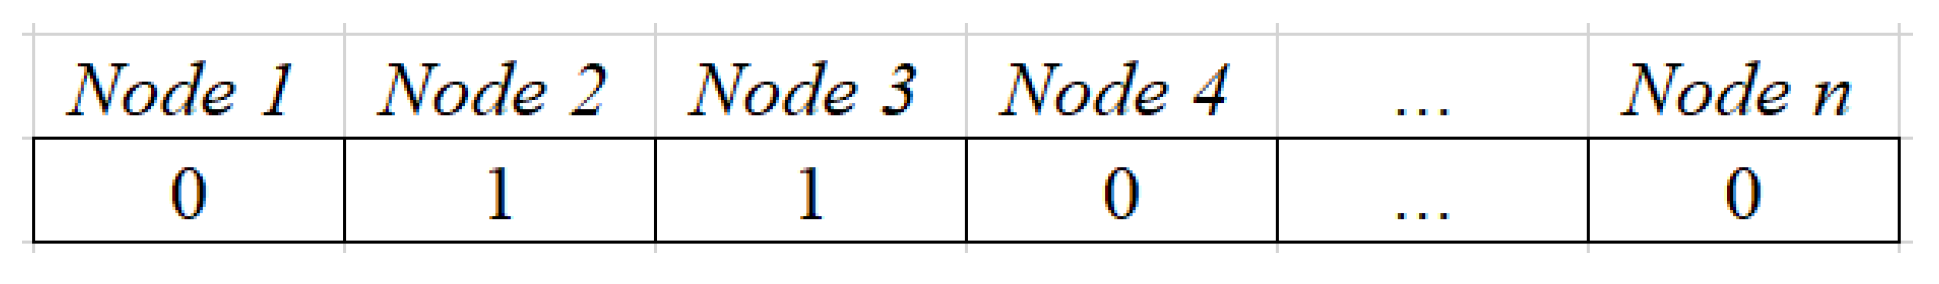
2.3.1. Chromosome
The chromosome represents a solution to be tested as a possible candidate to the optimal solution for the problem.
Figure 4 presents the chromosome definition to be used in the problem of surge arresters optimal allocation as proposed in this paper, where each gene represents a network electric node that is candidate to receive a surge arrester.
The number of chromosome genes is equal to the number of electrical nodes that do not have any surge arrester installed. Each gene uses real coding with values in the range of [0, 1].
2.3.2. Individual
The population individuals, as presented in
Figure 5, refer to solutions found from decoding a chromosome. Each gene is decoded considering the value 0.5 as cutoff point; that is, if
, then it is assigned a value 0, otherwise it is assigned a value 1. A gene with value 0 indicates that the corresponding electric node has no surge arresters allocated, while value 1 indicates that surge arresters are allocated in all phases of the corresponding node, being one-, two- or three-phase nodes.
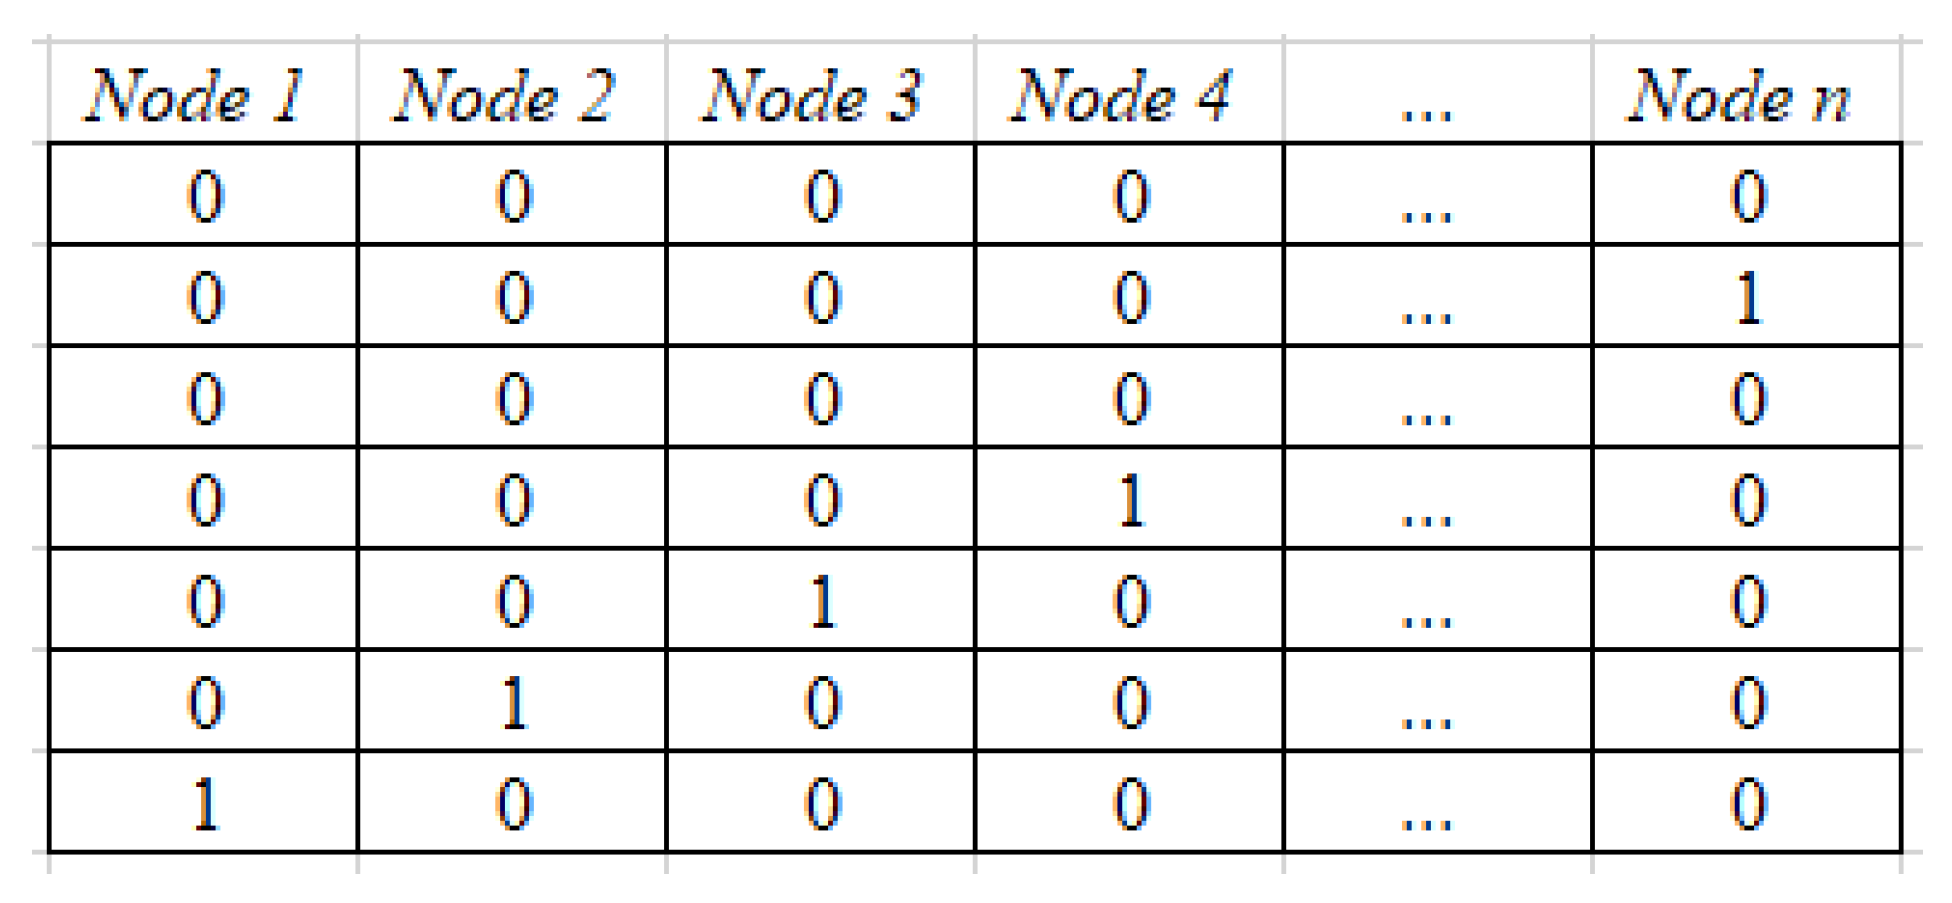
2.3.3. Population
Population is a set of chromosomes that will undergo changes over the genetic algorithm generations. Two population settings have been defined that can be chosen by user. The first configuration is set to carry out a search for a solution that performs optimal allocation with the least amount of surge arresters possible. For this, the minimum population size is defined as being twice the sum of the number of candidate electric nodes plus 1, as in Equation (
3).
Half of this population is stochastically generated using a uniform distribution to generate the genes, and the other half in a deterministic way, where one of the chromosomes created does not contain surge arresters allocated, that is, all genes are equal to zero. The other chromosomes have only one surge arrester set allocated. In other words, for each candidate electrical node, a chromosome with only one surge arrester set is placed in the corresponding gene, and no surge arresters in the other genes, according to
Figure 6.
If the electrical network has a significant quantity of electrical nodes and equipment, the combined execution time of GA and ATP may take several hours, depending on the number of generations and the number of distinct chromosomes that are created over the generations. As a result, the second configuration aims to reduce the number of chromosomes to be generated in order to reduce execution time. This way, it is suggested to focus the search around the electric nodes whose lightning discharges have caused the most critical overvoltage values, according to the results obtained from the Cross Mean Table analysis.
As in the first configuration, in the second one, half of the population is also generated stochastically using a uniform distribution to generate the genes, and the other half deterministically. The difference is in the size of the population and how individuals are created. The population size is defined as in Equation (
4), where
n is the number of lightning discharges to be analyzed.
The deterministic half consists of generating the truth table of surge arresters combinations in the electric nodes where there was incidence of lightning discharges.
Figure 7 presents an example of the deterministic construction, where each individual represents one of the
possible combinations, considering the number of discharges
, for illustrative purpose. In these individuals, surge arresters will be allocated in the
n electric nodes with value 1, and in the others it is assigned value zero, that is, no surge arrester allocated.
2.3.4. Selection
The tournament selection operator is used, where a set of chromosomes is randomly chosen to participate in a ring. The two best chromosomes evaluated by the fitness function are chosen as parents to generate a new pair of chromosomes. The size of the ring is defined by the user.
2.3.5. Crossover
The crossover operator used is the arithmetic crossover. With each generation a new empty population is created and filled with new individuals until it reaches the configured size. For that, repeatedly two chromosomes are selected and a random number is generated using a uniform distribution. If it is verified that this number satisfies the stipulated crossover rate, a random number
is generated which will serve to create weights by performing the weighted average of the parents chromosomes genes, generating new genes for each child chromosome, as in Equations (
5) and (
6). Otherwise, two new chromosomes with the same parents’ genes are generated.
2.3.6. Mutation
The mutation operator used is the reflexive Gaussian mutation. For each chromosome gene, a random number is generated using a uniform distribution and checked if it satisfies the configured mutation rate. If false, the gene remains unchanged; otherwise, a number is generated from a Gaussian distribution with mean and standard deviation in the range of [0, 1] as defined in the settings.
The standard deviation represents the maximum change that the gene will suffer. The number generated in the range is added to the gene; if the result exceeds the range limits of [0, 1], the surplus is reflected in the opposite direction, thus the gene will never overcome this range.
2.3.7. Fitness
The fitness function aims to evaluate how good the solution represented by a chromosome is. To perform this evaluation, it is necessary to execute the ATP input cards using the template created and modified based on the individuals, allocating a surge arrester set at the electric nodes where there is a gene with value 1. For each individual, n lightning discharge scenarios are simulated. At the end of each simulation, the maximum phase voltage peaks of each electrical node is extracted from the output file.
The defined fitness function is composed of the sum of three terms. The first term
B aims to maximize the number of electrical nodes that are within the
voltage limit, which varies according to the feeder nominal voltage
and represents the voltage level above which the flashover occurs and, consequently, shutdown. For that, the percentage of electrical nodes whose electrical voltages are less than
is calculated according to Equation (
7).
where
is the total number of electrical nodes in the electrical network.
is the total number of electrical nodes that has exceeded the electric voltage limit of
, considering
equal to the NIL (Basic Insulation Level).
An electrical node violates the
limit when at least one of its phases presents a voltage level greater than
, defined as in
Table 1 [
17]. When a nominal voltage occurs at the ends of each range, a more conservative profile is adopted using the lowest value of
among the possible ones.
The second term
E consists of evaluating the percentage of equipment that has been protected according to Equation (
8). Protected equipment is one whose electrical node has electric voltage level within the
limit in all its phases. Capacitor banks and transformers are considered as equipment.
where
is the total number of equipment in the electrical network.
is the total number of equipment that is connected at electric nodes that have exceeded the
limit.
The third term
A evaluates the number of surge arresters that were required to perform the optimal allocation, as in Equation (
9), considering that each electric node receives a surge arrester in each phase. This term acts as a bonus if
; otherwise, it acts as a penalty to the individuals that have exceeded the established desired number of surge arresters.
where
is the maximum number of surge arresters that can be allocated in the electrical network, that is, a surge arrester in each phase of each electric node.
is the user-defined desired number of arresters to be allocated.
is the amount of allocated surge arresters by the GA procedure.
The final fitness function is defined by Equation (
10), as the weighted sum of terms
B,
E and
A, where
is the equipment protection factor and
is the surge arrester factor, both of which can assume values in the interval [0, 1]. It is possible that the weighted sum in Equation (
10) generates a negative value, and in this case the fitness value will be set to zero.
However, the user must define a limit number of surge arresters () that can be tested on each solution. Individuals who exceed will not be simulated by the ATP and their fitness will be zero. In summary, individuals will receive in their fitness, a bonus if or a penalty if , and in the case they will not be simulated in ATP.
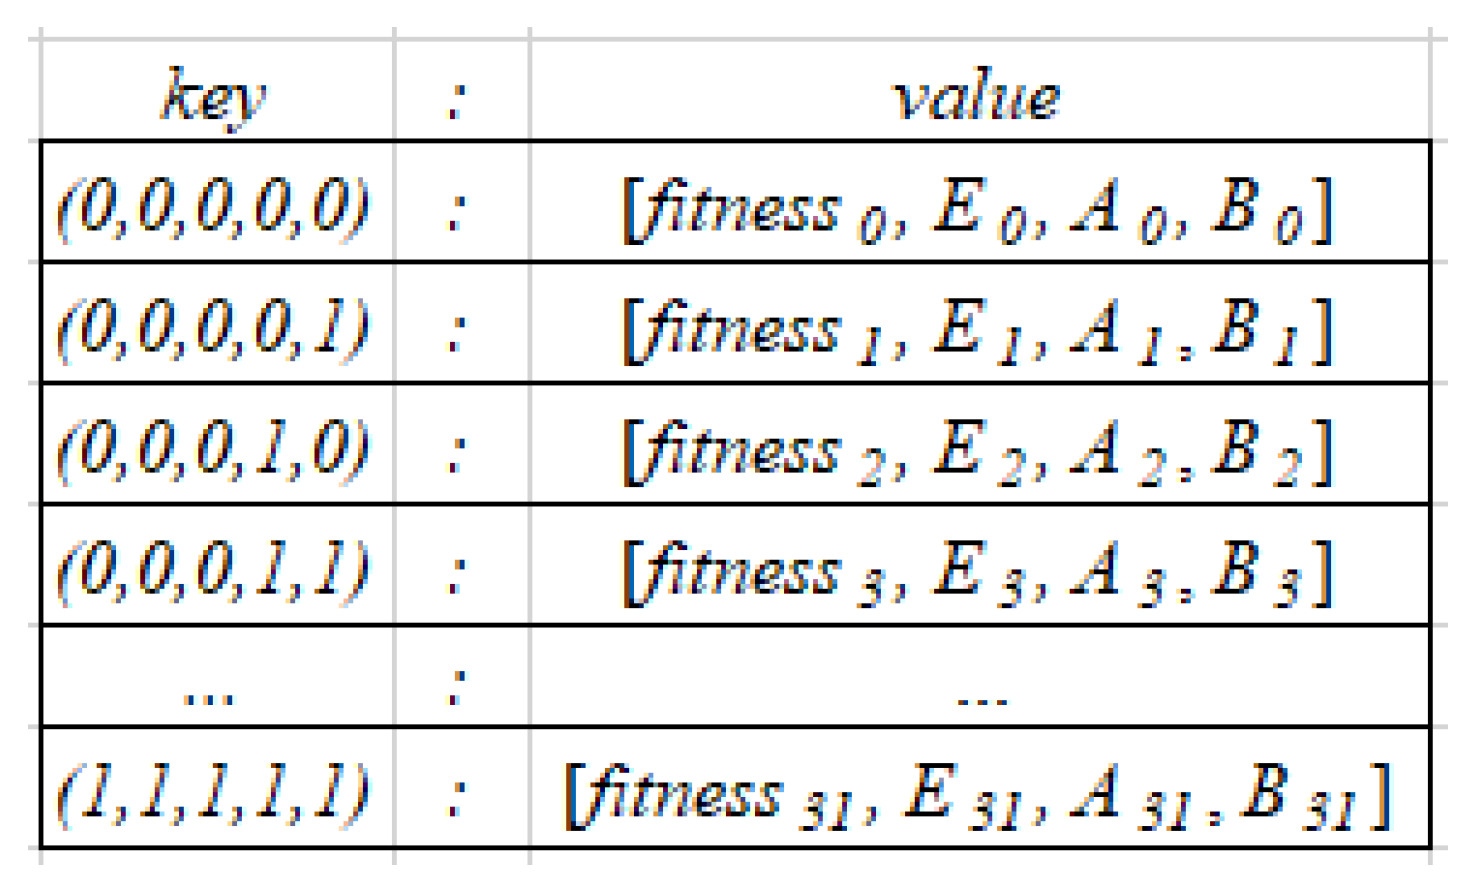
2.4. Memory Map
A simulation run in ATP may take a few minutes depending on the size of the electrical network and the simulation parameters. It is necessary to perform an ATP simulation for each individual that was generated by the GA evolution, but it is possible that the same individual is generated more than one time during the GA execution.
Regardless of how many times the same simulation is performed, the result obtained is the same. Therefore, these extra ATP calls spend unnecessary processing time, and to avoid them a memory map is used to store the calculated fitness.
A memory map is a data structure that indexes a value to a unique key, which is used as the search parameter. In Python, a memory map is implemented in dictionary form. For this application the key consists of a tuple of the individual genes and the value is the calculated fitness and the tiebreaker criteria, as shown in
Figure 8. The main advantage of using this feature is the reduced processing time; however, there is also an increase in memory consumption.
2.5. Parallelization
Running the genetic algorithm sequentially can be very costly due to the time spent with each ATP simulation. Therefore, it is essential to perform parallelization to accomplish multiple simulations of ATP simultaneously. Parallelization can be performed in processing the fitness function and in the methodology of constructing the CMT, because both routines use exhaustive ATP executions.
3. Results Discussions
To test the proposed methodology, the IEEE-123 Node Test Feeder [
18] was used, whose single-line diagram can be seen in
Figure 9. To guarantee the electrical network has no islands and is radial, all switches were considered closed except switches 18–135 and 54–94.
The distribution networkwas modeled as distributed parameter lines, using the J. Marti model with frequency-dependent parameters [
19]. In addition, the IEEE Working Group model for representing lightning arresters [
20] and the grounding model of a vertical rod proposed by [
21] were used. The used models are adequate for simulating fast forward transients such as those used in this article.
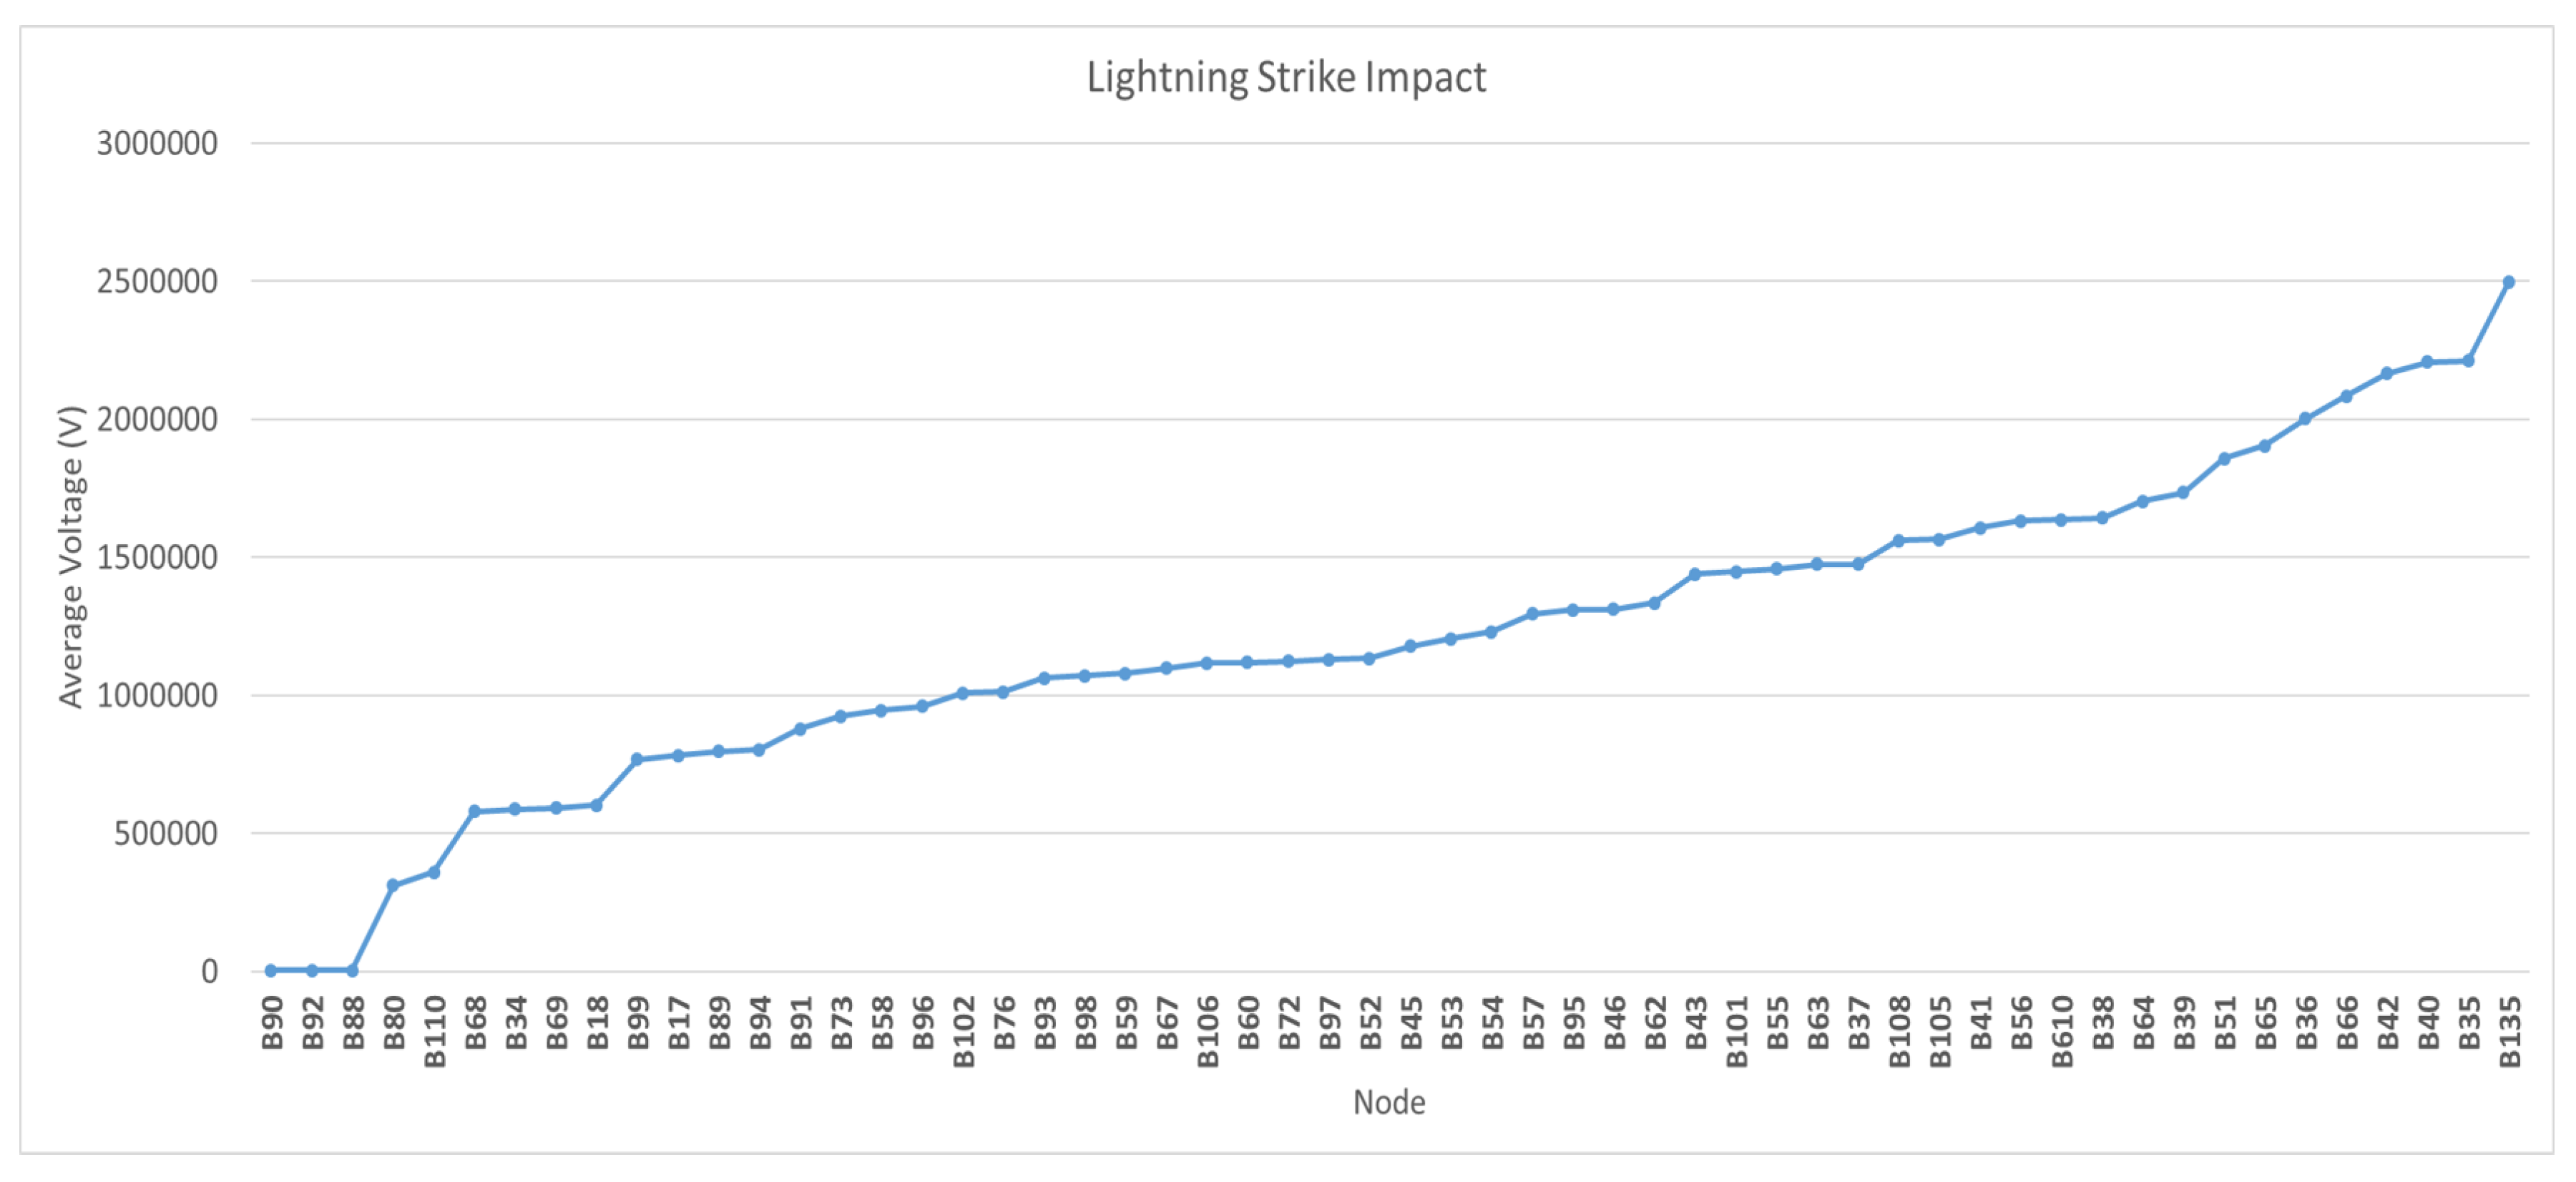
Figure 10 represents the sorted array
obtained from the CMT, considering a lightning discharge of 10 kA, which is a commonly used value for impulse test of surge arresters in medium voltage electric distribution networks, most having nominal currents of 5 kA and 10 kA [
10].
The runtime spent to obtain this curve was 6.12 min. As can be observed, the three most critical nodes with respect to overvoltage are , and . From the electric network overvoltage characterization, the GA execution for optimal allocation of surge arrester was done considering the incidence of lightning discharges only in these three most critical nodes, firstly analyzing the most critical one (), then simulating lightning discharges in the two most critical nodes ( and ) and finally in the three most critical nodes (, and ).
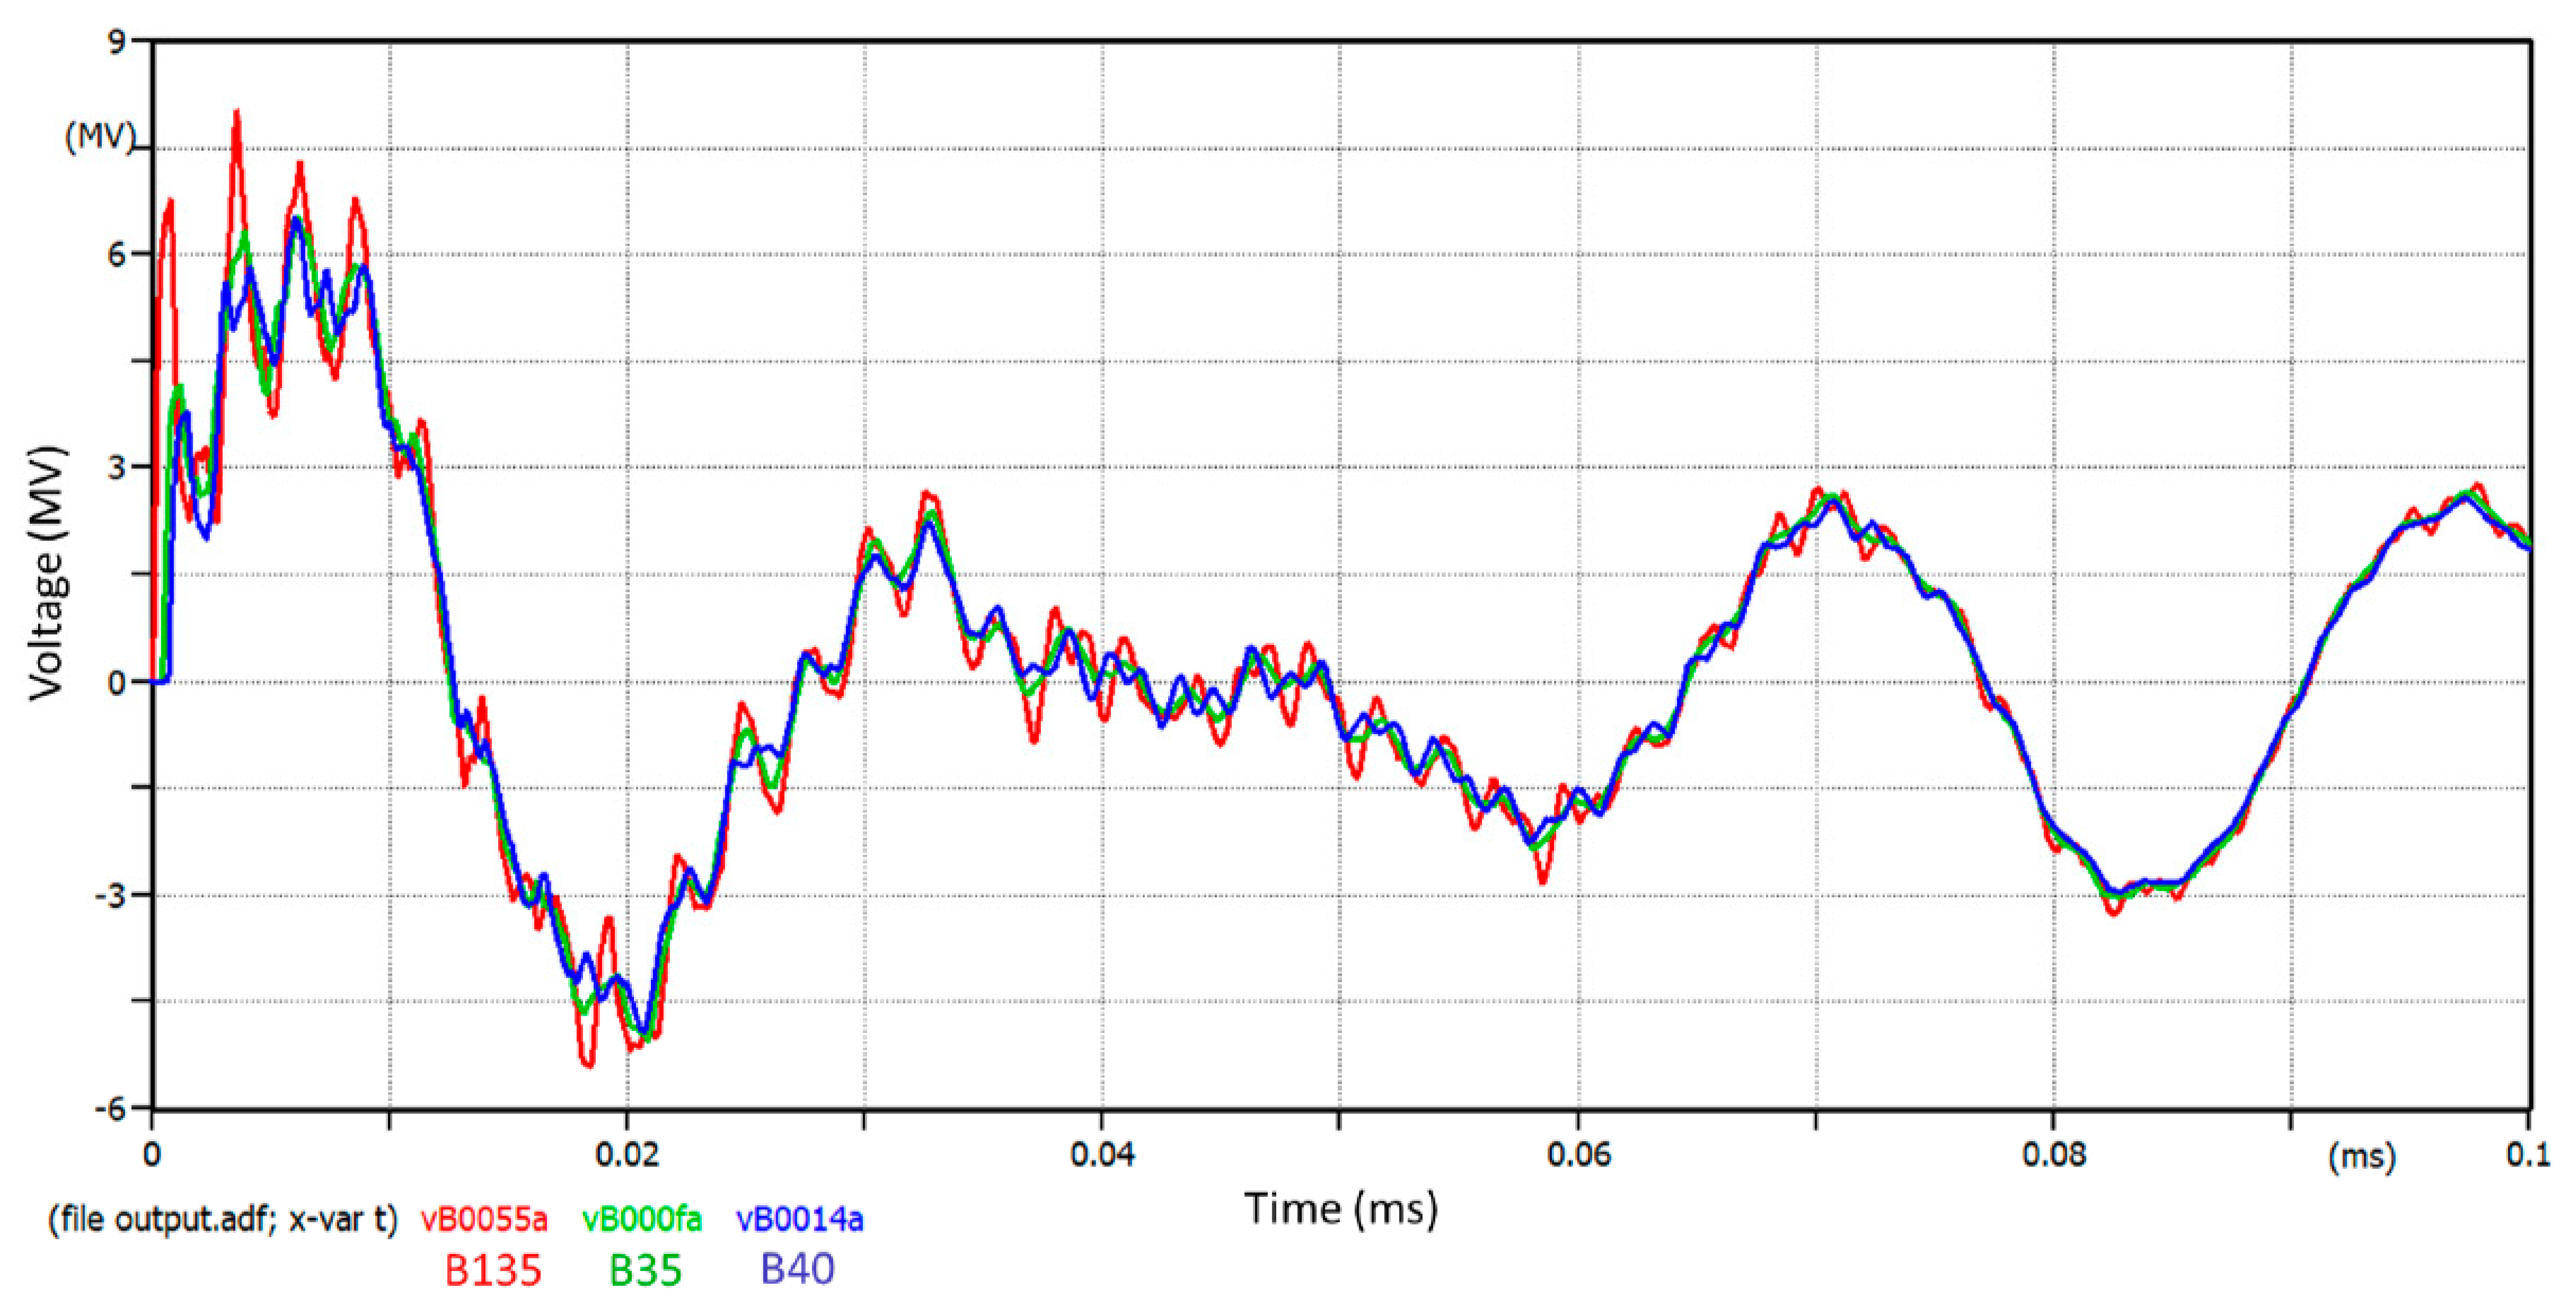
Figure 11 presents the voltage dynamic responses at the most critical electric nodes
,
and
considering the lightning discharge incidence at node
.
The GA parameters setting is described in
Table 2. The minimum population size used was defined by Equation (
4).
The GA was executed considering six different configurations of fitness settings, as presented in
Table 3. Each configuration has a specific focus that can vary between the high priority protection of electrical nodes with already installed equipment, namely transformers and capacitor banks, or an equal priority protection scheme of all electrical nodes, considering or not a restriction on the maximum number of surge arresters to be allocated. For the current case study, the tests were performed with
and
.
As can be seen by inspection of
Table 4,
Table 5 and
Table 6, all configurations presented a good percentage of equipment protection in all cases. For a lightning discharge at the most critical electric node
, the best surge arrester allocation solution was obtained by Configuration 6, which resulted in 100% protection of equipment and 98.89% protection of electric nodes in general, allocating the smallest number of surge arresters. In the case of lightning discharges at nodes
and
, Configurations 5 and 6 presented similar results for equipment protection reaching 89.23%, and allocating 56 and 55 surge arresters, respectively. For lightning discharges at nodes
,
, and
, the best solution corresponded to Configuration 3, which reached 92.31% of equipment protection, allocating 58 surge arresters, which was the allowed limit.
The GA average runtime for
Table 4,
Table 5 and
Table 6 were 15.55, 36.32, and 79.28 min, respectively. The larger is the number of critical nodes to be analyzed, the higher is the runtime due to the increased ATP executions. A linear approximation, for example, considering that all IEEE-123-grid electric nodes are to be analyzed would spend approximately 54 h of continuous computer processing. Typical electric distribution grids may have thousands of electric nodes, thus the direct application of GA optimization procedures using ATP may become not viable with respect to processing time, and using a procedure such as the one proposed in this article may become viable.
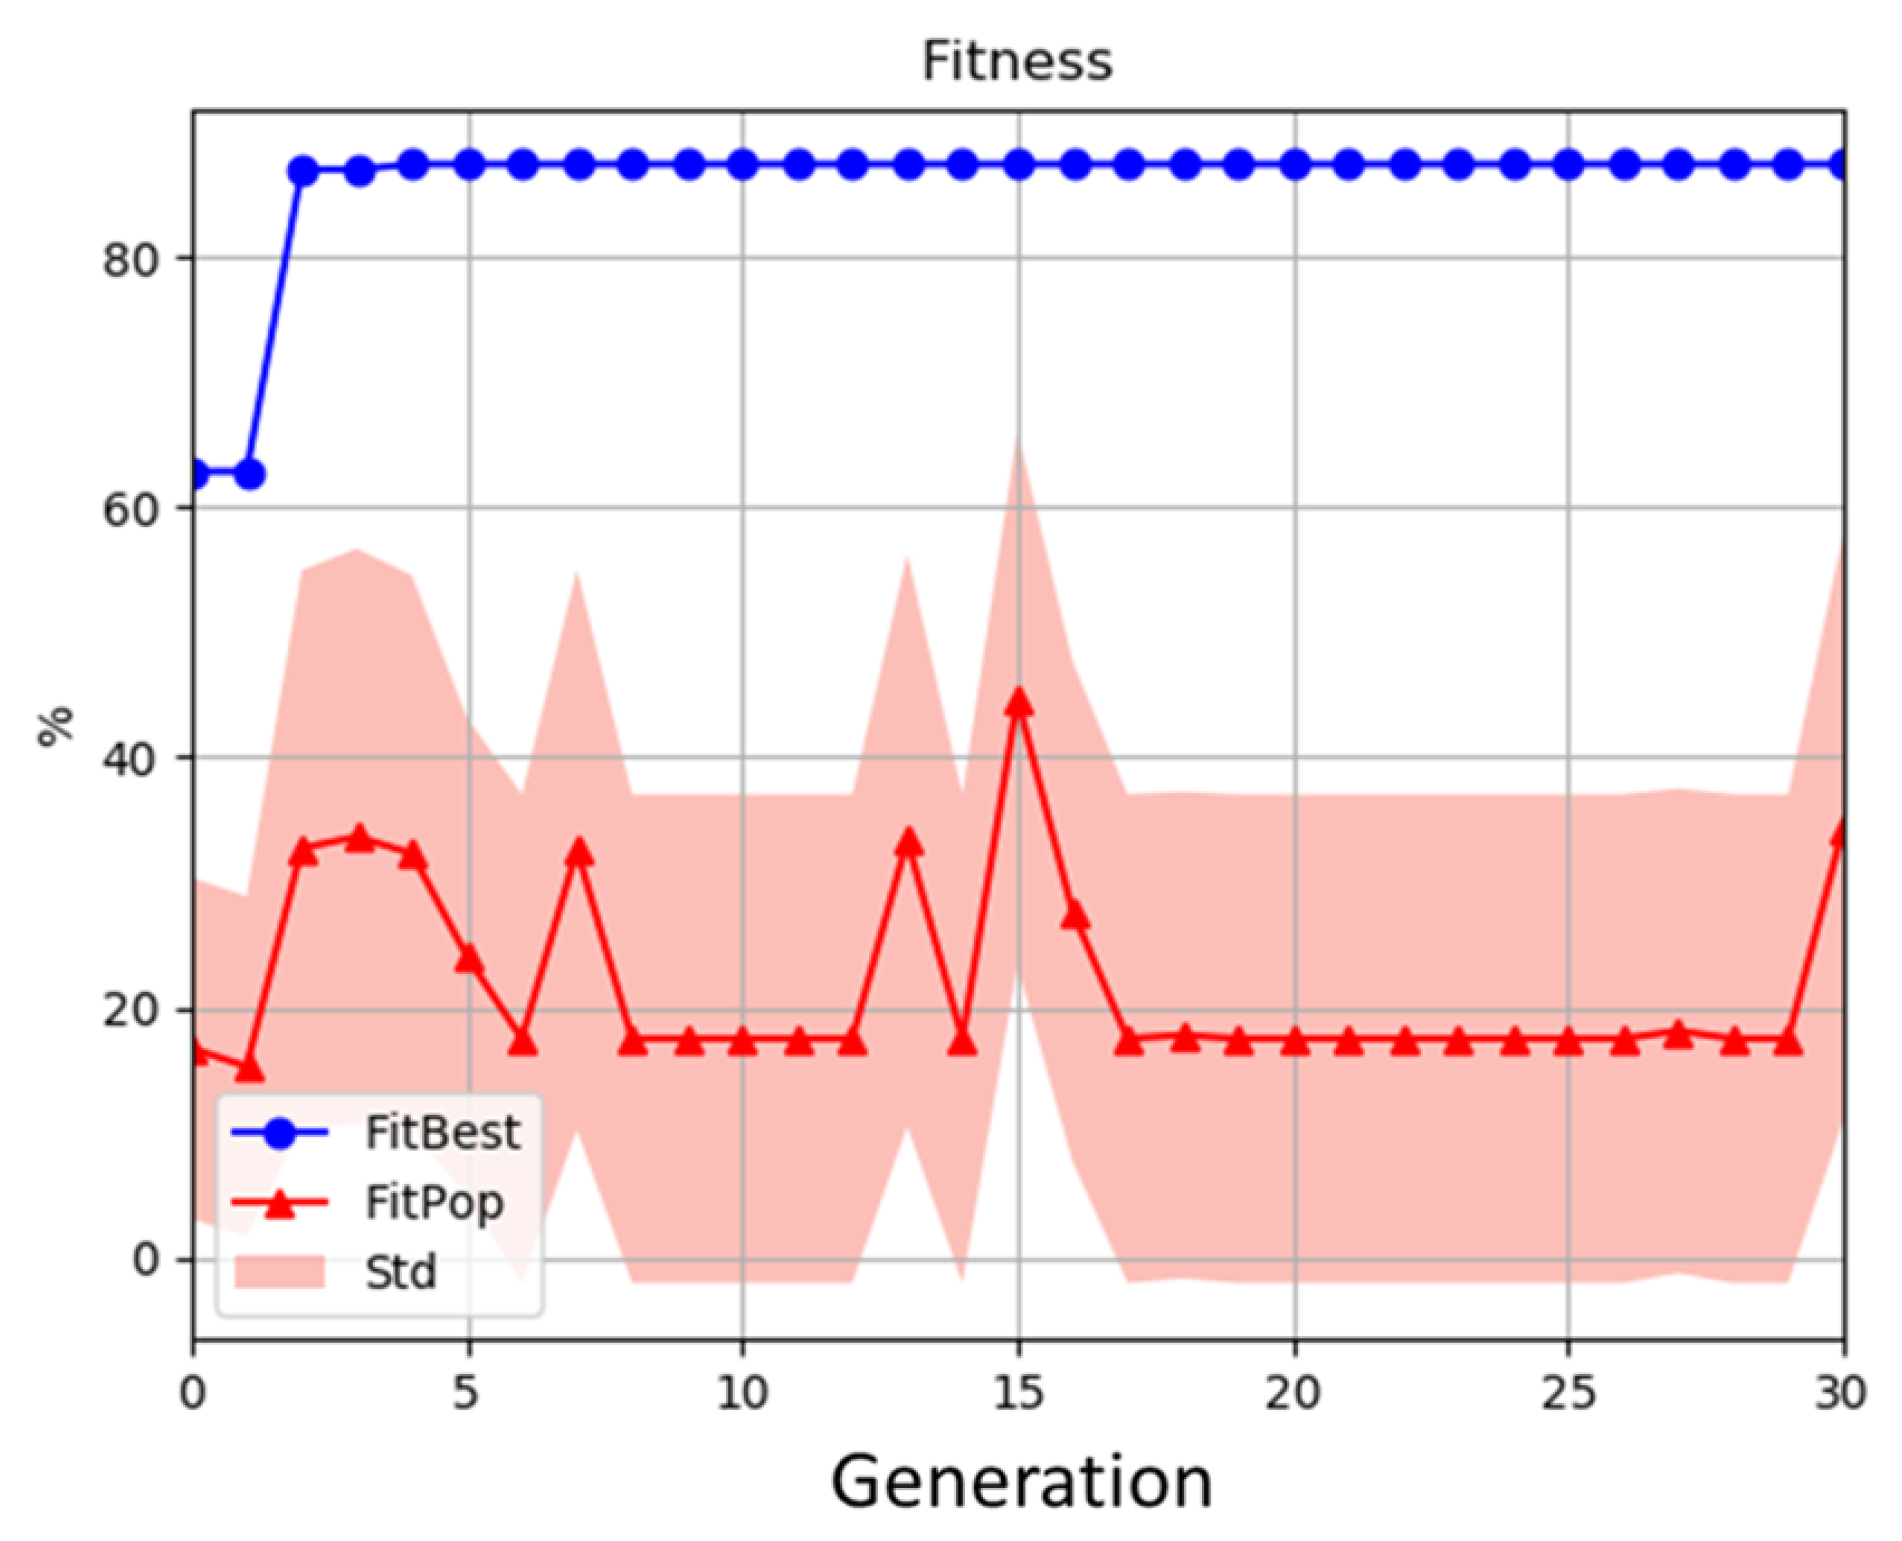
The GA convergence performance for Configurations 1–6 exhibited similar profiles. Configuration 1 was selected to illustrate this performance, whose results can be seen in
Figure 12,
Figure 13 and
Figure 14. For each GA execution,
Figure 12 presents the fitness function convergence profile, being the best individual convergence presented as a dotted blue line and the population convergence as a dotted red line, with the respective standard deviation confidence interval.
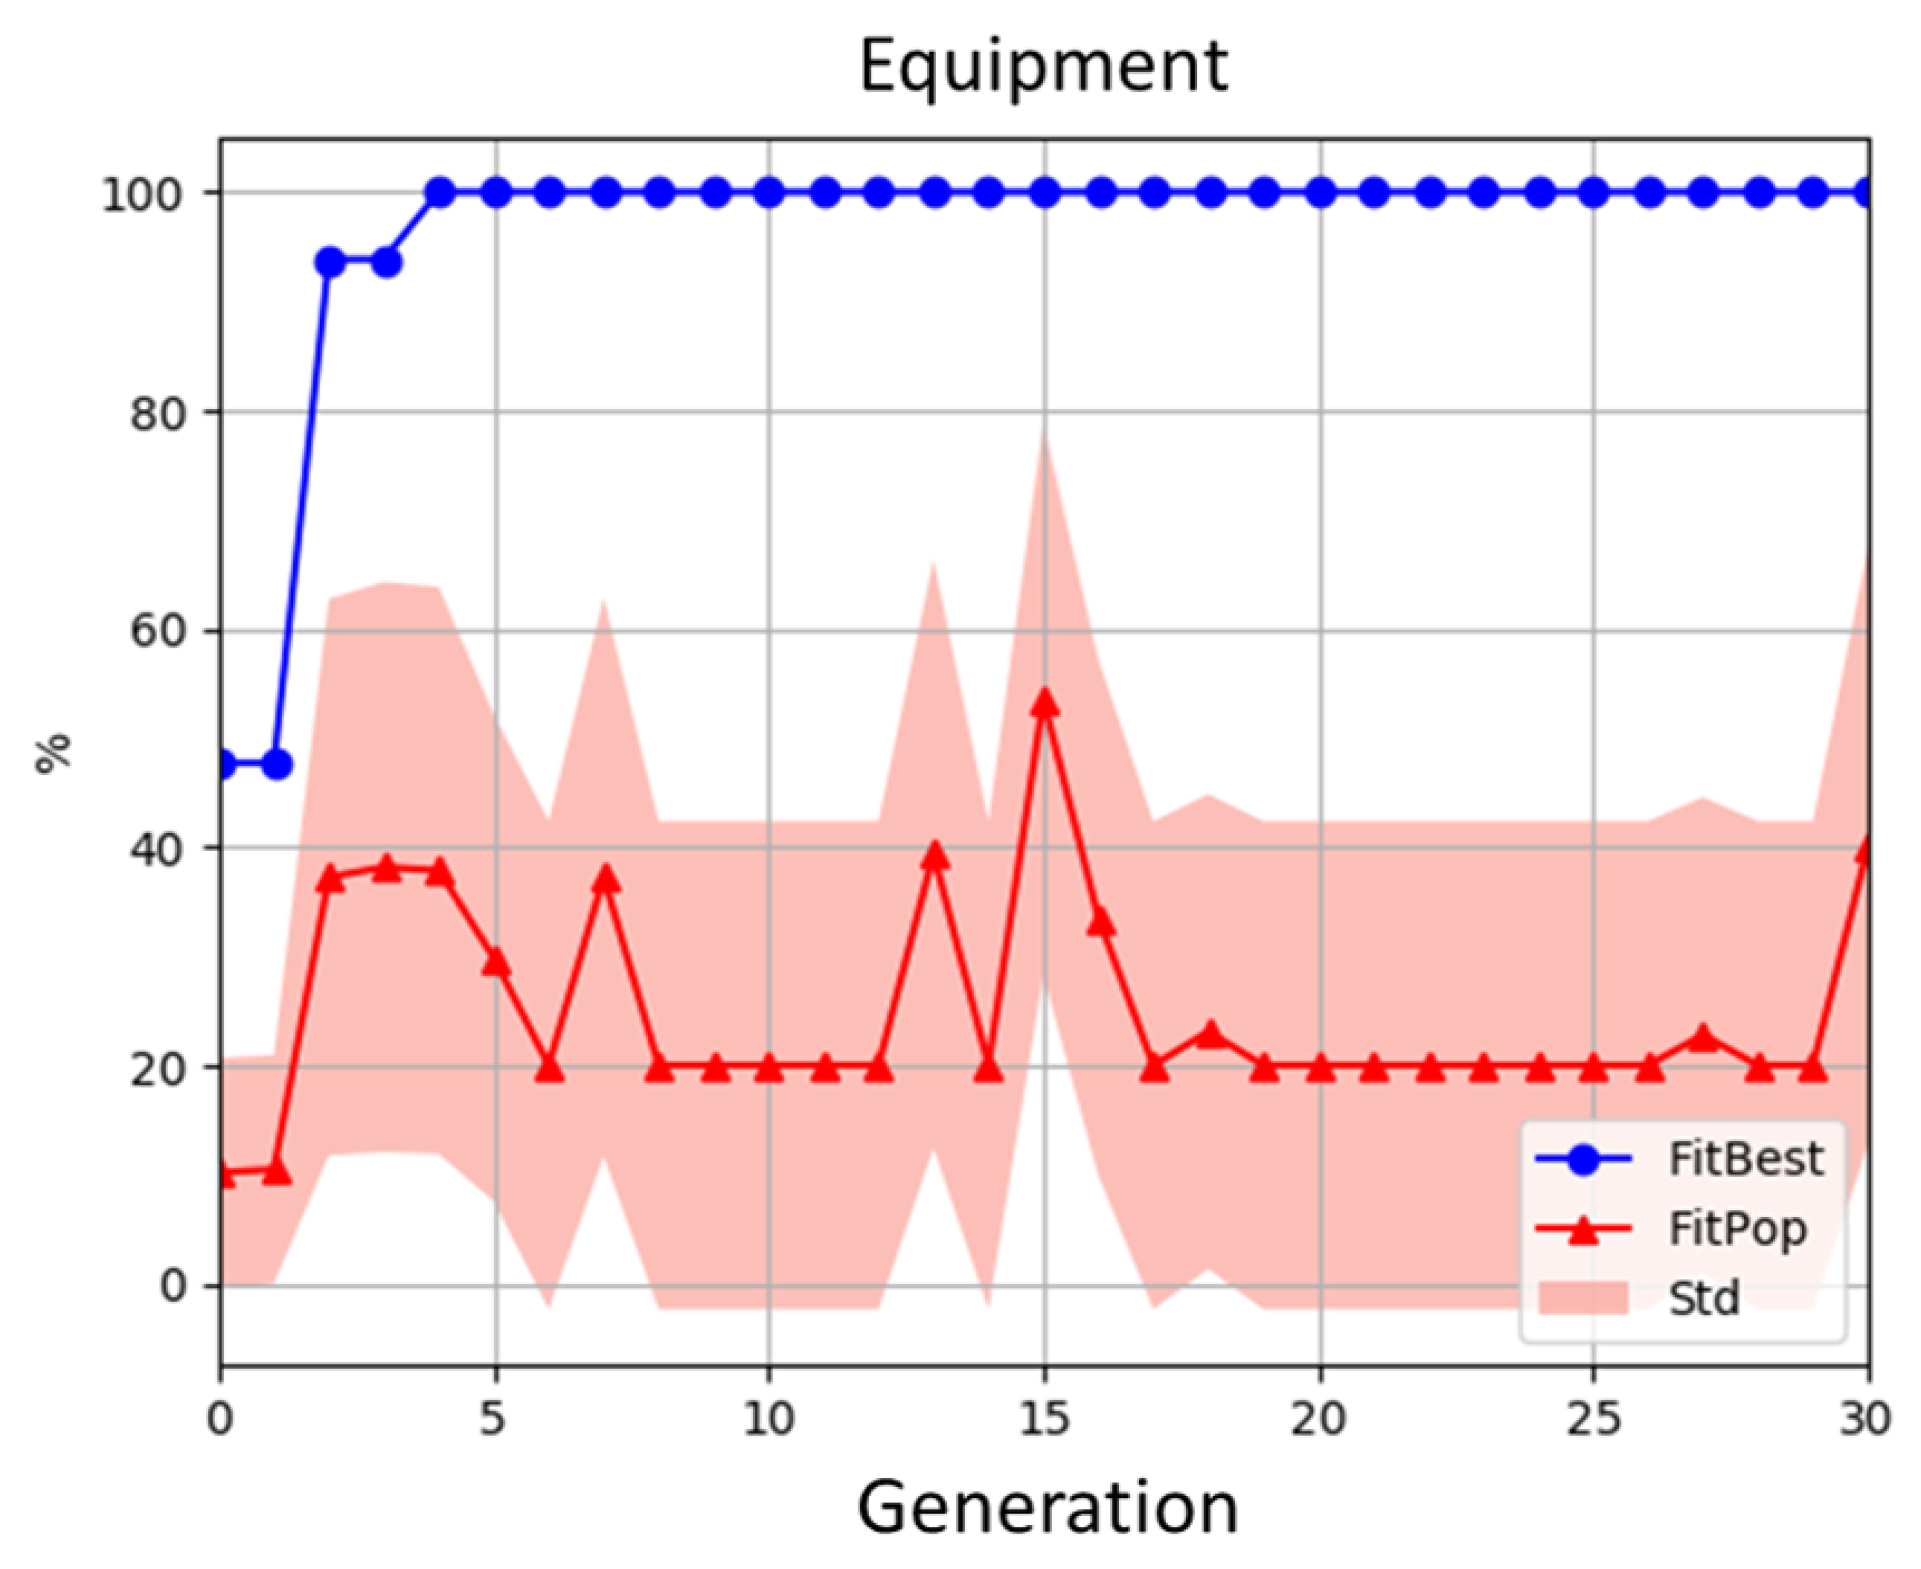
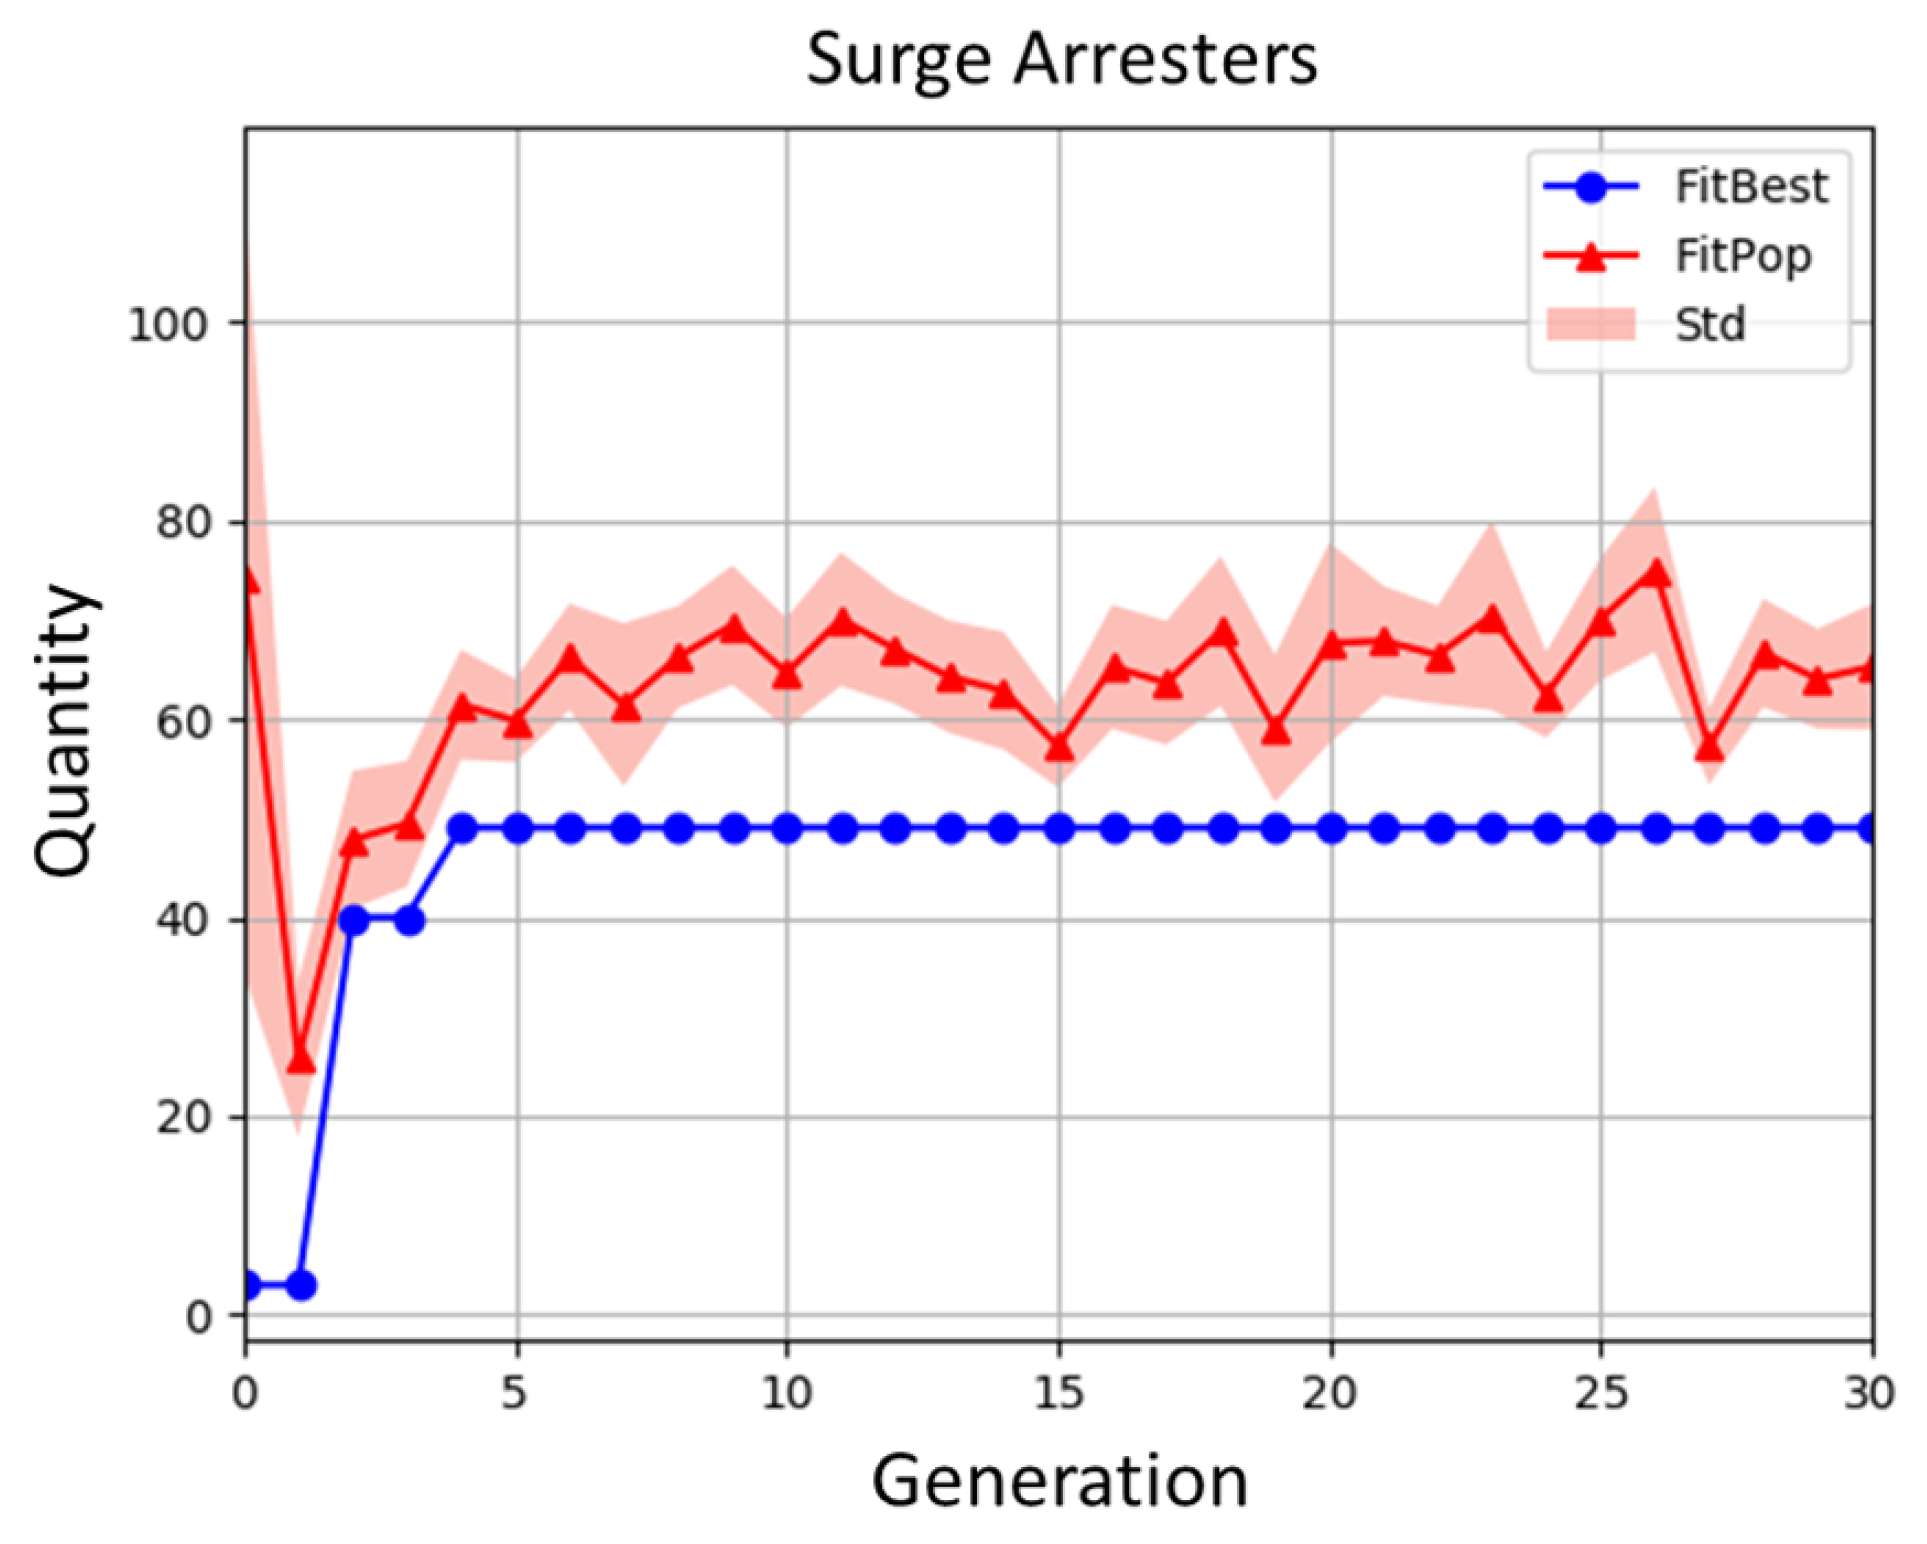
The percentage of protected equipment and allocated surge arresters are updated with each generation, trying to keep the amount of protected equipment as great as possible, and the number of arresters as small as possible, as depicted in
Figure 13 and
Figure 14.
In
Figure 13, the percentage of equipment protection for the best individuals presented in
Figure 12 is highlighted with a dotted blue line. The population curve representing the average of all individuals in the generation, the variation profile of which is constrained by the standard deviation confidence interval, is also presented as a dotted red line.
Figure 14 presents with a dotted blue line the number of allocated surge arresters for the best individual for each GA generation and the corresponding allocation profile for the average population individuals with a dotted red line.
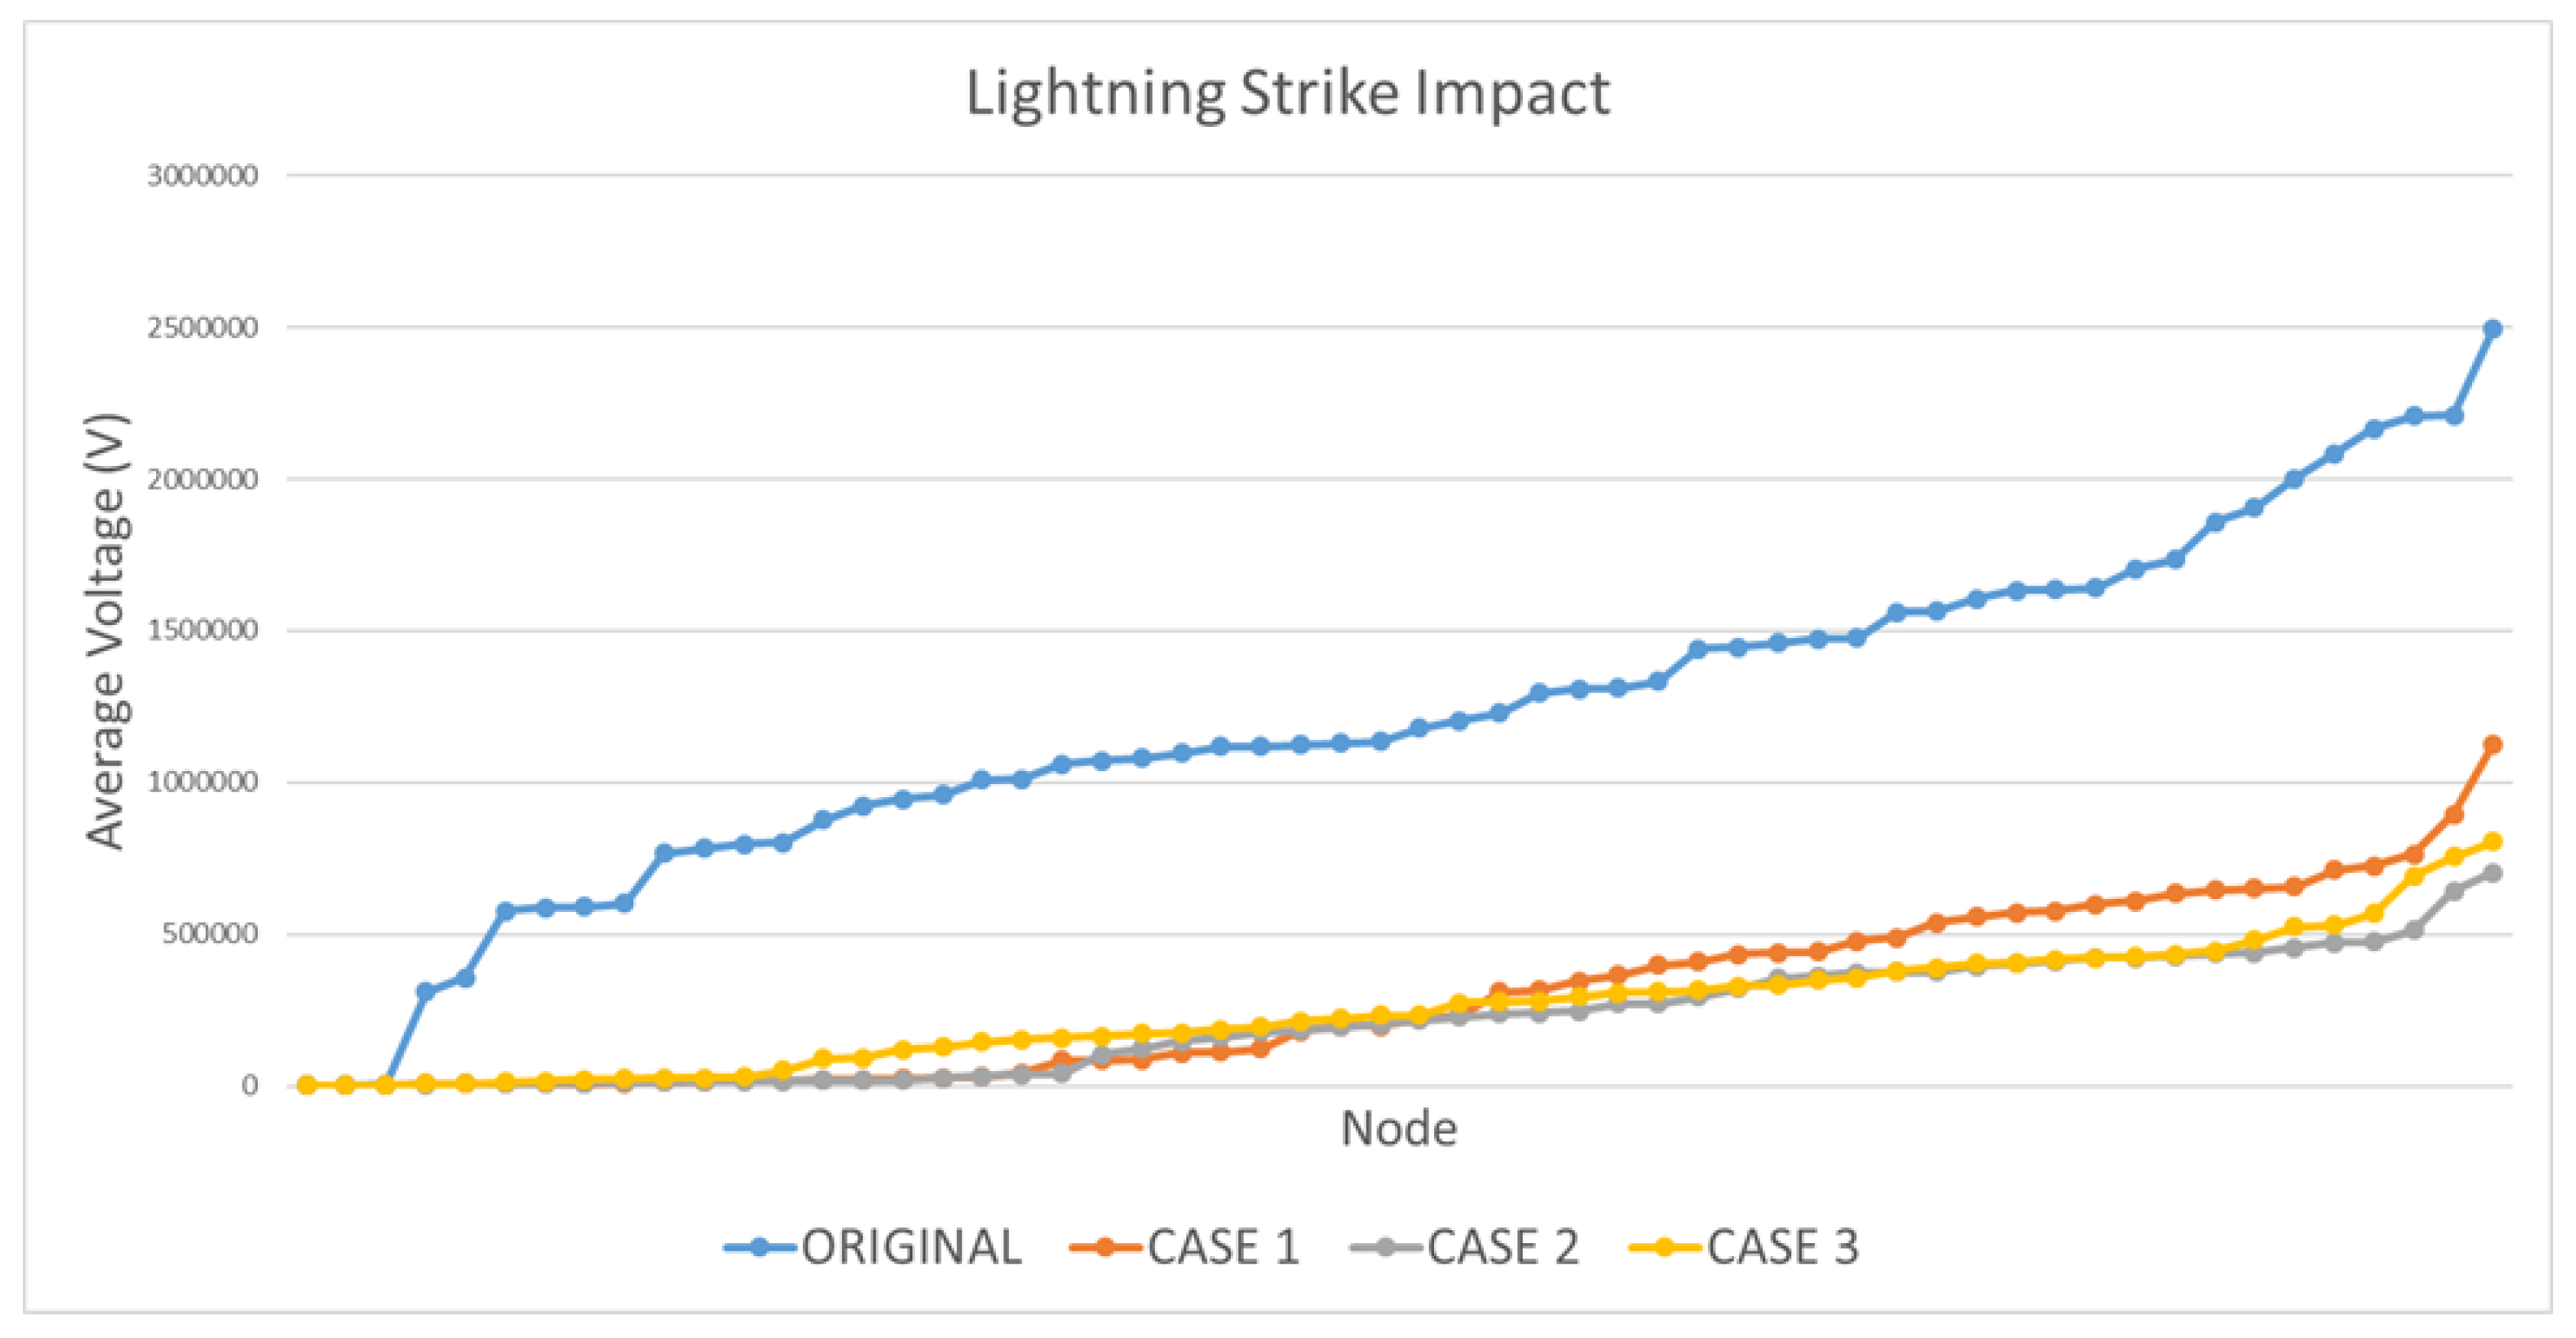
To evaluate the GA optimal solutions performances in terms of the resulting system overvoltage, the CMT methodology was again applied, considering 10 kA lightning discharges in all electric nodes, but now considering the optimal allocation of surge arresters as obtained by the GA optimal solutions. To exemplify this performance, Configuration 6, as presented in
Table 4,
Table 5 and
Table 6, was used.
Figure 15 shows the CMT results obtained after the optimal allocation of surge arresters, when considering the most critical node (orange dotted curve), the two most critical nodes (gray dotted curve), and the three most critical nodes (yellow dotted curve). These results are compared with results obtained for the original system without surge arrester allocation (blue dotted curve) in
Figure 10.
It is observed in
Figure 15 that, in all cases considered, that is only the most critical node, the two most critical nodes, and the three most critical nodes, the proposed methodology presented a significant reduction of overvoltage with respect to the condition without surge arresters allocation (original electric network). The comparison among the three cases of optimal allocation, either observing
Figure 10, or the previous results presented in
Table 4,
Table 5 and
Table 6, demonstrates that they are very similar, with slight variations between the solutions presented. In this way, one has a varied set of feasible solutions to be adopted. It is worth emphasizing that, by using the proposed methodology, these solutions were obtained with a reduced computational effort, when compared with standard optimization procedures using GA.
4. Conclusions
An innovative proposal is presented in this article for the analysis of criticality of electrical distribution networks in relation to overvoltage caused by direct lightning discharges and identifying the overvoltage severity at each electric node. As an innovative optimization methodology, the combination of this procedure with the use of genetic algorithms for optimal allocation of lightning arresters, considering the incidence of lightning discharges only in the most critical nodes, is also presented. Surge arresters optimal allocation based on this proposed methodology proved to be quite effective, obtaining very good results regarding the overvoltage reduction at all electric nodes, ensuring high percentages of electric nodes below the flashover voltage limit, obtaining equipment protection percentages above 80% for most analyzed cases, reaching in some cases 95% and 100% protection.
It is worth mentioning that the proposed fitness function allows important features of electrical systems operation to be met in planning surge arresters allocation in electrical networks, namely, to protect a maximum possible number of electric nodes and equipment, with the least possible financial investments in surge arresters acquisition. The results demonstrated the proposed methodology has a great potential for application in real problems of electric distribution utilities, which typically involve large electric networks, serving as a guide in decision making concerning surge arresters allocation planning.

 ,
, 


