Article

Experimental Methodology and Facility for the J69-Engine Performance and Emissions Evaluation Using Jet A1 and Biodiesel Blends

1
Universidad ECCI, Cra. 19 No. 49-20, Bogotá 111311, Colombia
2
Escuela de Postgrados de la Fuerza Aérea Colombiana, Cra. 57 No. 43-28—CAN Puerta 8, Bogotá 111321, Colombia
3
Fuerza Aérea Colombiana, Cra. 57 No. 43-28—CAN Puerta 8, Bogotá 111321, Colombia
*
Author to whom correspondence should be addressed.
Energies 2019, 12(23), 4530; https://doi.org/10.3390/en12234530
Submission received: 5 November 2019 / Revised: 23 November 2019 / Accepted: 25 November 2019 / Published: 28 November 2019
(This article belongs to the Special Issue Small-Scale Energy Systems with Gas Turbines and Heat Pumps)

Abstract

:
Aeronautic transport is a leading energy consumer that strongly contributes to greenhouse gas emissions due to a significant dependency on fossil fuels. Biodiesel, a substitution of conventional fuels, is considered as an alternative fuel for aircrafts and power generation turbine engines. Unfortunately, experimentation has been mostly limited to small scale turbines, and technical challenges remain open regarding operational safety. The current study presents the facility, the instrumentation, and the measured results of experimental tests in a 640 kW full-scale J69-T-25A turbojet engine, operating with blends of Jet A1 and oil palm biodiesel with volume contents from 0% to 10% at different load regimes. Findings are related to the fuel injection system, the engine thrust, and the emissions. The thrust force and the exhaust gas temperature do not expose a significant variation in all the operation regimes with the utilization of up to 10% volume content of biodiesel. A maximum increase of 36% in fuel consumption and 11% in injection pressure are observed at idle operation between B0 and B10. A reduction of the CO and HC emissions is also registered with a maximum variation at the cruise regime (80% Revolutions Per Minute—RPM).

Graphical Abstract

1. Introduction

Aviation transport is an important energy consumer sector that strongly depends on fossil fuels such as jet/kerosene, diesel, and gasoline. It is also largely vulnerable to the availability and cost of fossil fuel [1]. Domestic and international aviation transport consumed almost 3.2% of the world’s energy consumption in 2015 [2]. Moreover, fossil fuel prices strongly affect the sustainability of the aviation sector, projecting a rise of jet fuel costs near $100 USD/ton per year [3]. In 2016, air transportation contributed around 2.3% of the global anthropogenic CO2 emissions [4], significantly contributing to the greenhouse as (GHG) emissions. As a result of the increasing freight transport activities throughout the world and low utilization of renewable energies in the aircraft powertrain splits, the international-aviation sector is constantly evaluating a variety of alternatives for the replacement of conventional fuels with alternative fuels [3].
Alternative aviation fuels can be produced from a variety of renewable biomass feedstock as soybean, palm, coconut, or jatropha with different production routes as biomass to liquid (BTL), Fischer Tropsch, hydro-processing, biochemical fermentation, or transesterification. The mixtures of fatty acid methyl esters (FAME) derived from vegetable oils or biodiesel have shown advantages in miscibility with fossil fuels and contain no sulfur or aromatic compounds [3]. Biodiesel has been studied worldwide as an alternative fuel for turbine engines, in part, explained by the current commercial availability of this biofuel. The substitution of biodiesel has been studied not only for generating thrust in aircrafts [5,6,7] but also for electric power generation systems [8,9,10].
According to the literature, one main difference between biofuel and fossil fuel is the higher viscosity of the former. For example, when using a mixture of soybean biodiesel with ultra-low-sulfur-diesel, the viscosity difference affects the atomization of fuel in the nozzle [11]. Several studies of biodiesel blends used in aviation engines have shown no significative detrimental effect on the engine performance compared to the use of pure jet fuels [7,12]. The exhaust gas emissions expose no significant variations of O2 and CO2 compounds [13], but a significant rise in CO emissions is reported when increasing the biodiesel content as a result of an inadequate atomizing of the fuel that causes a more incomplete combustion [6,14]. There are still several challenges to overcome with the utilization of biodiesel in aviation turbines regarding the high cost of fuel production, the degradative effect of biofuels over fuel systems linked to the crucial operating safety, and the adjustment of the biodiesel properties to aviation standards [15].
Unfortunately, the experimentation on full scale turbines—which may clarify the acceptable operation parameters—are expensive and complex, limiting most of the reported experimentation to small size turbojets ranging from 10 to 50 kW [16]. Studies reported by Chiaramonti et al. [7] and Nascimento et al. [6] evaluated the effect of blends of diesel and biodiesel on the energy performance and the emissions of a micro-turbine with energy power ratings of 20 and 30 kW, indicating no changes in the energy performance of the engine. In opposition, French [17] and Habib et al. [18] report a reduction in the thrust force by around 8% and, thus, a reduction in the thrust specific fuel consumption when mixing biodiesel and Jet A in 30 kW micro-turbines. Regarding the emission, a reduction in the evolved CO, HC, and NOx is noted by Chiaramonti et al. [7], but a formation of cloudiness is reported by French [17].
On the other hand, the evaluation of turbines with an energy power rating above 100 kW is reported in a few studies, except in the ones presented by Corporan et al. [5] and Lupandin et al. [19]. In this sense, Corporan et al. [5] tested mixtures of JP-8 and up to 20% volume content (v/v) of biodiesel in a 230 kW helicopter engine ref. Allison T63-A-700, reporting an increase of 20% in the particulate emissions at the idle regime. In that study, a rise of 4% in fuel consumption was reported due to inaccuracy in the fuel control unit (FCU). Lupandin et al. [19] tested a 2.5 MW power generation gas turbine ref. GT2500 using mixtures of Jet A and up to 12% v/v of biodiesel. The experimentation concluded an increase in the exhaust gas temperature, fuel consumption, and the evolved CO emissions, also exposing the plugging of biodiesel in the filtration system.
The former incongruences in the behavior of each micro-turbine preclude an accurate prediction of the effect of biodiesel in large-scale turbines. Furthermore, the lack of experimental information and validation in real aeronautic turbines with biodiesel is remarkable, with the major absence of information on the effects in the operating performance, emissions, and in the mechanical wearing of components. The main purpose of the current study is to present the experimental methodology and facility in a 640 kW full-scale J69-T-25A turbojet engine operated at different load regimes using mixtures of Jet A1 with 0%, 5%, and 10% oil palm biodiesel. We describe the test facility and experimental procedures, including the test bench and monitoring system, and the experimental planning. The main findings are related to the overall engine operating performance and the exhaust emissions by measuring the: thrust force ( T ), fuel mass flow ( m ˙ f ), and volume fractions of O2, CO2, CO, and HC. The present work is complementary to computational analysis of the performance of gas turbine engines operating with biodiesel blends, such as the one presented in [20].

2. Materials and Methods

Two fuels were used in the present study: a commercial kerosene-based Jet A1, and a Colombian palm oil biodiesel with a commercial reference BioD, Premium 360. The experimental plan was conducted with fuel blends of Jet A1 and biodiesel using the biodiesel volume contents ( w B D ) of 0% (B0), 5% (B5), and 10% (B10). The blends were prepared in a tank with a nominal capacity of 4 m3, using a transfer pump and a flow meter Tuthill Fill-Rite model 820 (accuracy of 0.1%). An initial volume V i , B 0 = 1762 ± 8 L of Jet A1 was filled in the tank and was consumed in the baseline experiments B0 until a final volume V f , B 0 was obtained. Thereafter, a volume of biodiesel was added to the tank to increase the biodiesel volume fraction. The same procedure was repeated for the mixture of B10. The experimental level and the accuracy of the volume contents of biodiesel were always kept below 2.5%. These fuel blends were used to test the engine performance operating at different load regimes from idle to maximum throttle.

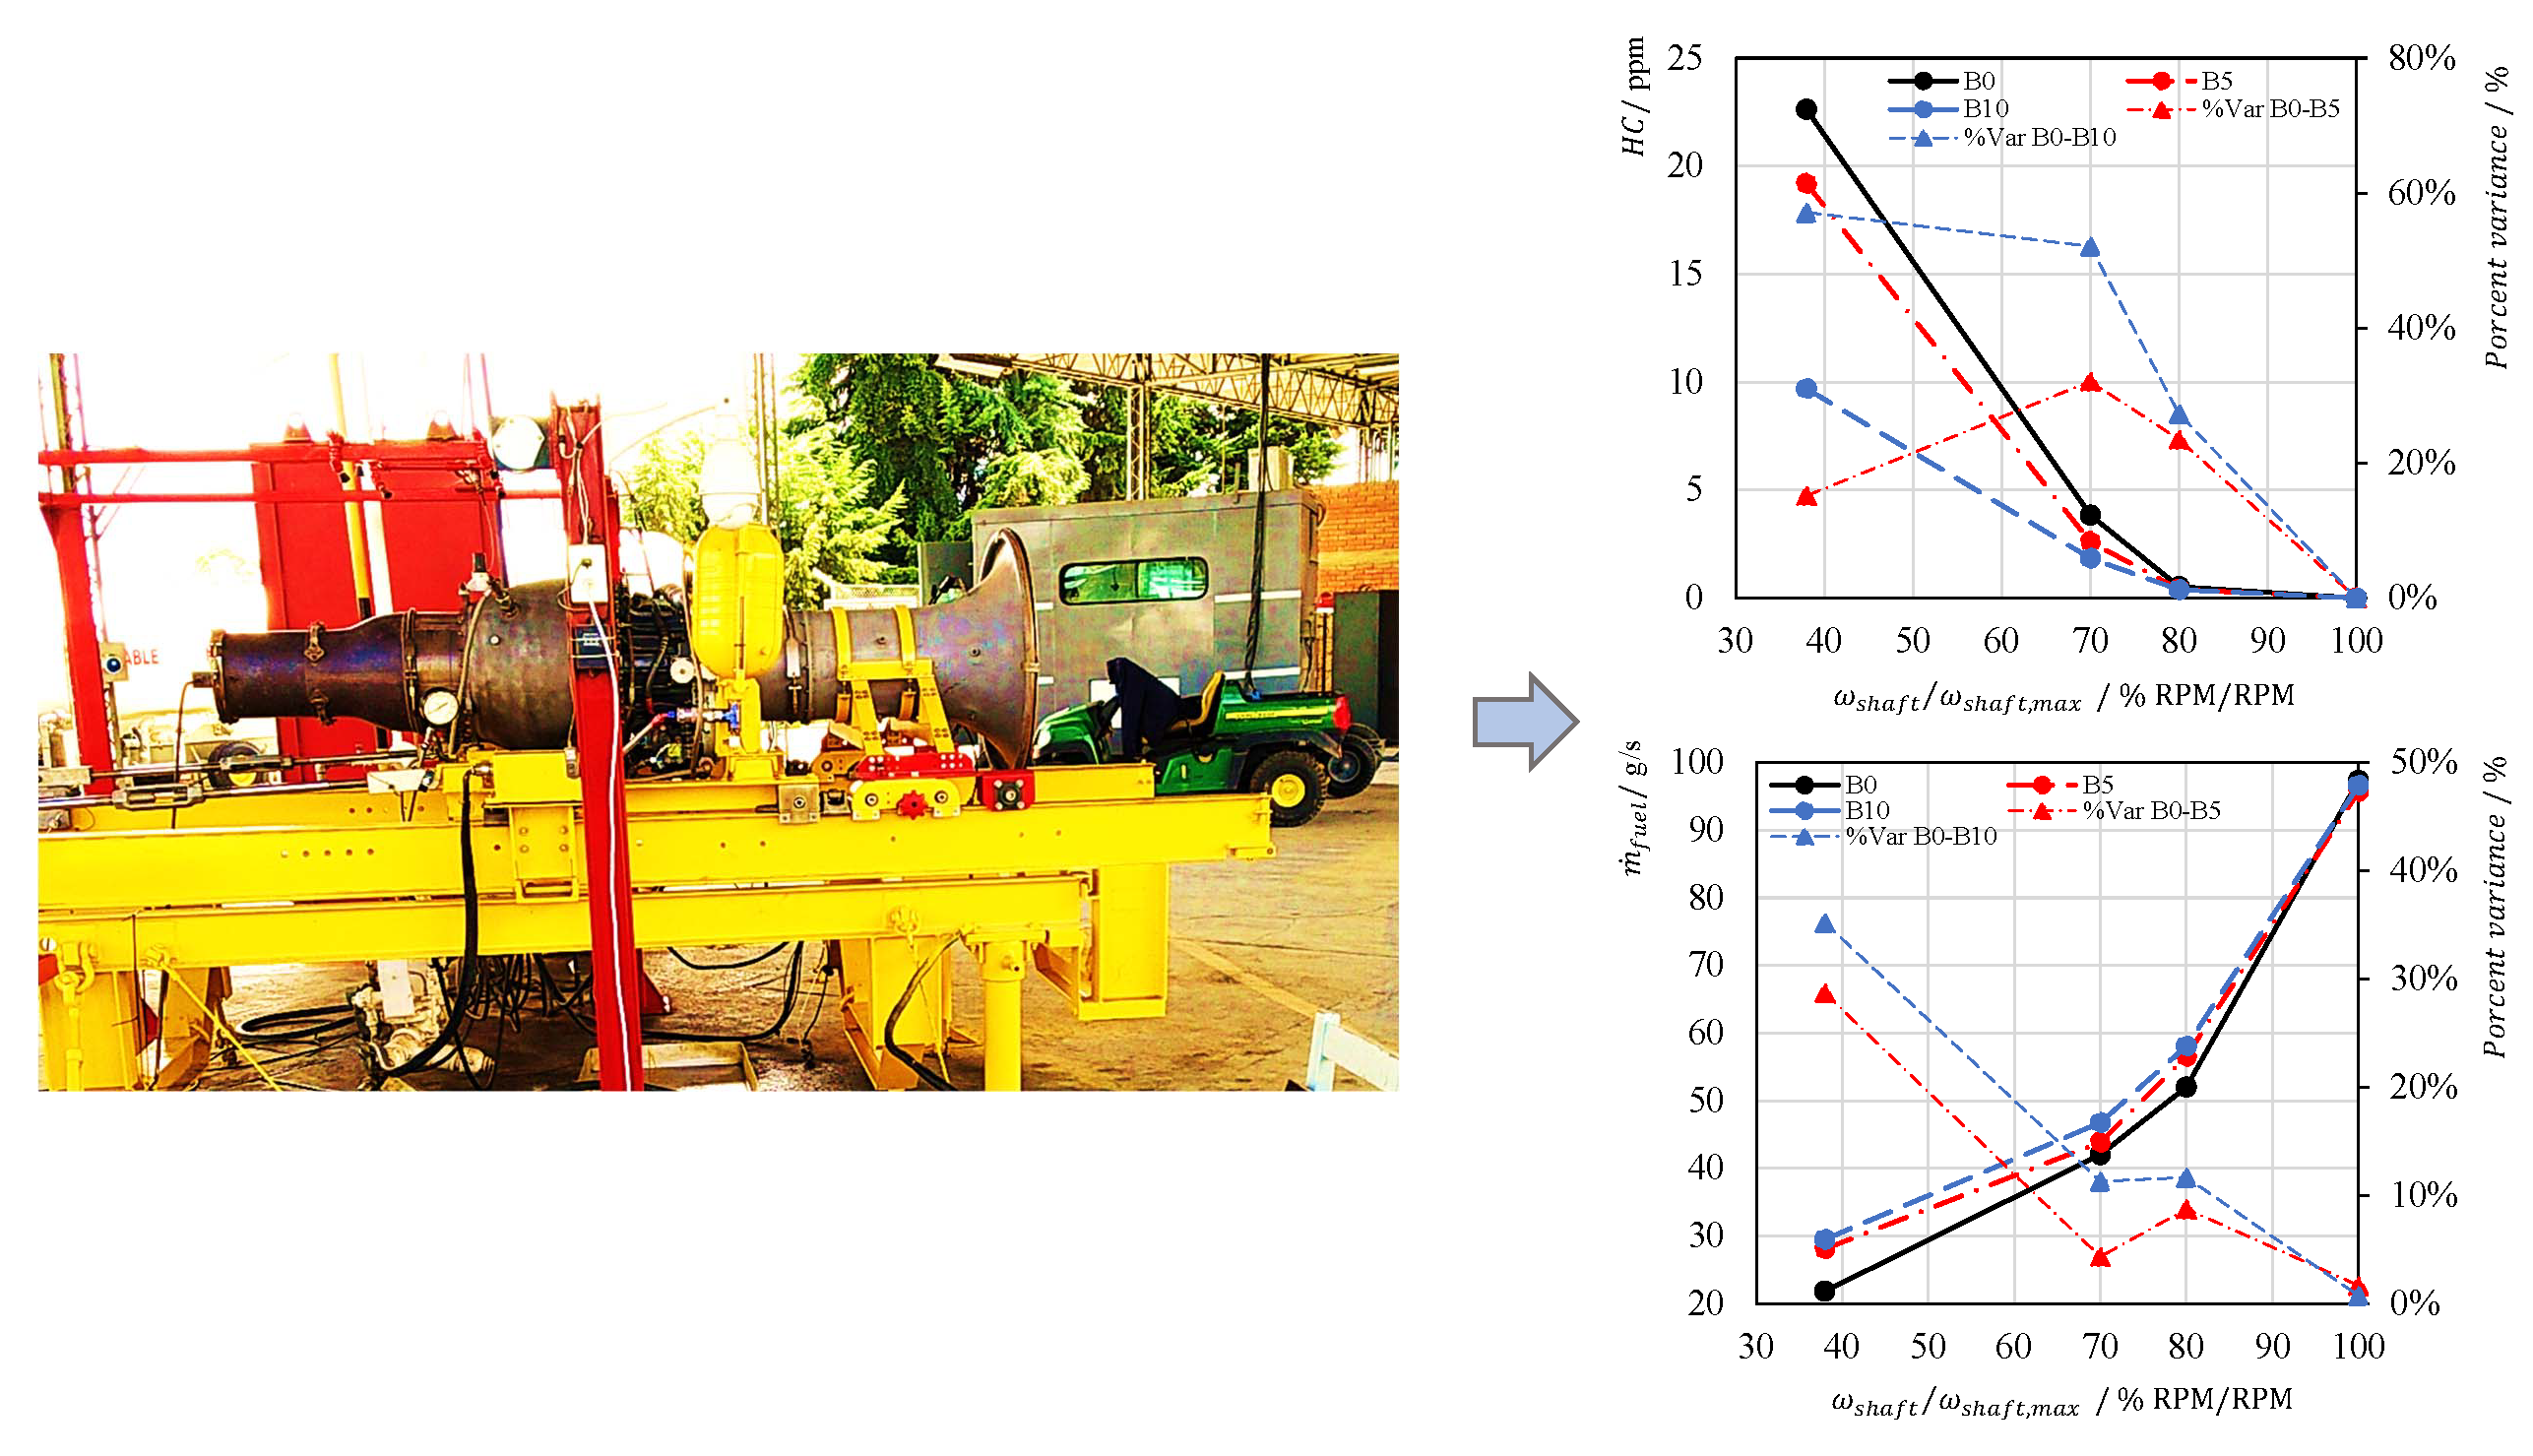
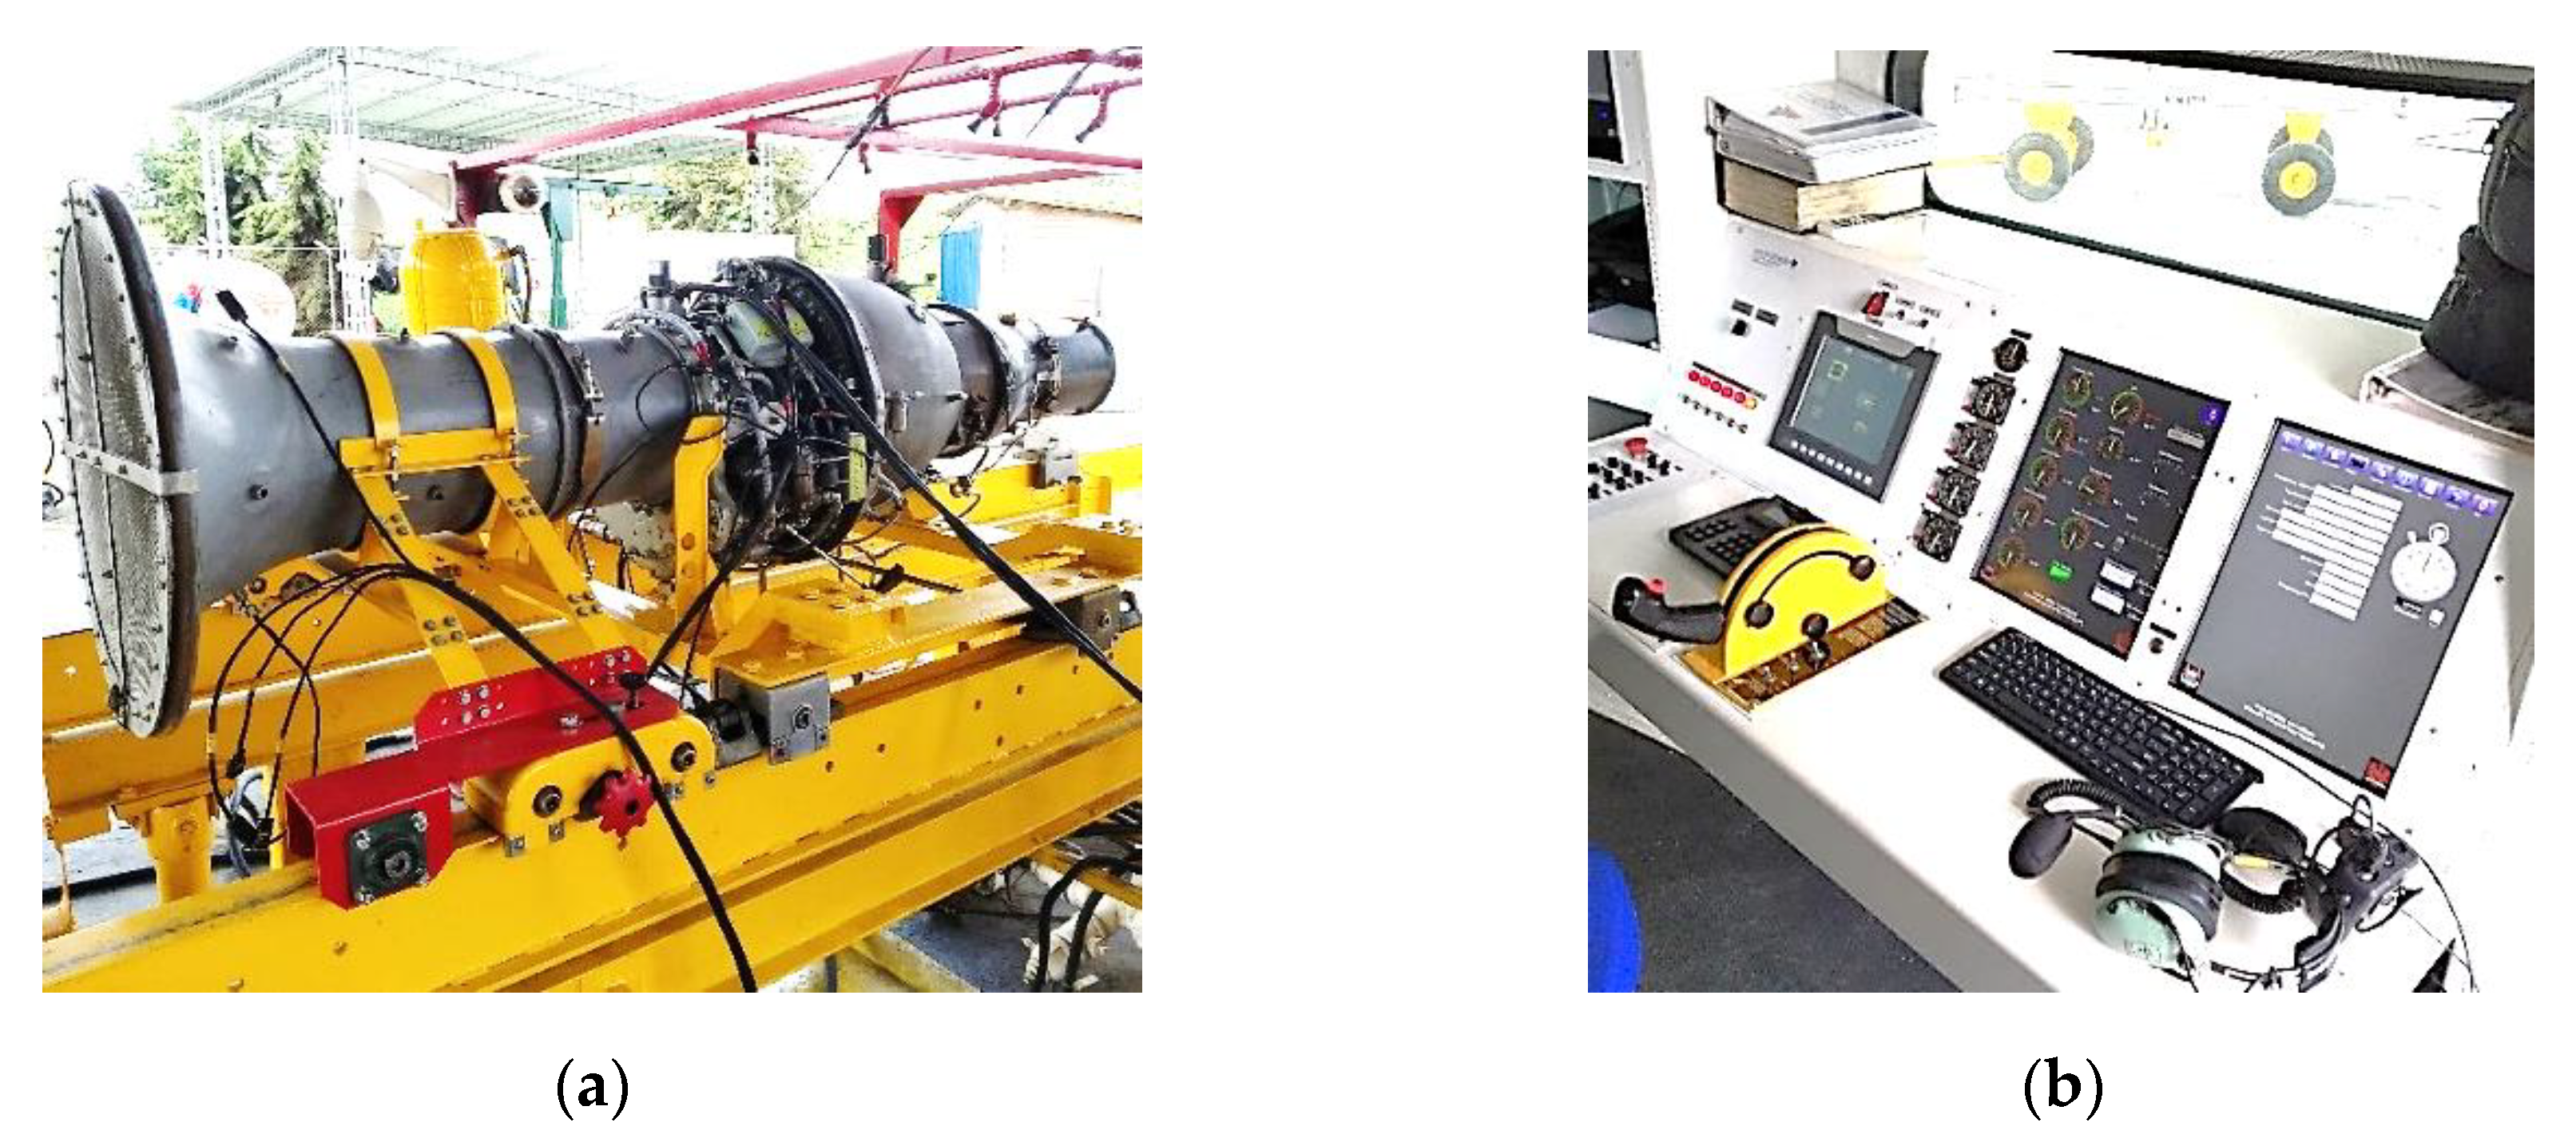
2.1. Experimental Facility and Procedure

The experimental facility employed in this study is presented in Figure 1 and Figure 2. The tested engine is a turbojet engine Teledyne Continental Aviation and Engineering—CAE J69 used in the military aircraft Cessna T-37 by the Colombian Air Force. The engine was installed on a testing bench, as presented in Figure 1a, and the instrumentation used corresponds to the one described in the engine technical manual (T.O. 2J-J69-72) [21]. The variables: Outside Air Temperature OAT, Exhaust Gas Temperature—EGT, rotational speed of the main shaft— ω s h a f t , thrust force— T , and fuel injection pressure— P f were measured and acquired in the control booth every 5 s only using a National Instruments ref. cRIO data logger.
The main components of the experimental facility are schematically presented in Figure 2a, consisting of the turbojet engine, the control and instrumentation sets, the thrust force measurement system, the fuel delivery system, the exhaust gas sampling stand, and the lubrication system. The Teledyne CAE J69 is a turbojet engine of model variant J69-T-25A with its main technical specifications, as indicated in Table 1 and with a nominal energy power rating of 640 kW. The rotational speed of the main shaft ( ω s h a f t ) is measured with an AAE model MS25038-4 tachometer generator, with a speed ratio, measurement range, and accuracy of 6:1, 0–4200 RPM, and 1%, respectively.
The exhaust gas temperature (EGT) is one main operative parameter that allows the evaluation of the mechanical and energetic behavior of the engine, as this is affected by the combustion conditions in the hot section of the turbine, the changes of the air to fuel ratio (AFR) at the different operating regimes, and the final power conversion and heat dissipation of the turbine. The outside air temperature (OAT) affects the density of the intake air, modifying the compression efficiency and the general performance of the engine. The values of OAT and EGT were measured with a set of 6 thermocouples, ref. 700530, normally used during a flight routine, which are installed at the air inlet duct and the outer tailpipe, as presented in Figure 2a. The layout of the installation of these thermocouples is presented in Figure 2c in accordance with the standard instrumentation of the engine reported in its technical manual [21].
The exhaust gas is sampled at the outer tailpipe with an exhaust gas sampling rake, as presented in Figure 2b, designed to meet the standards of the International Civil Aviation Organization [22]. The volume fractions of O2, CO2, CO, and HC at the exhaust are measured using a Hanatech ref. IM2400 Ultra 4/5 gas analyzer with ranges 0%–23%, 0%–20%, 0%–10%, and 0–10,000 ppm for the O2, CO2, CO, and HC, respectively.
The fuel mass flow ( m ˙ f ) was measured using a Tuthill Fill-Rite model 820 digital flow meter, ranging from 7.6 L/min to 75.7 L/min with an accuracy of 0.5%. To sense the fuel injection pressure ( P f ), a Sunpass 300 PSI pressure gage model with an accuracy of 0.4% was used. During the experimentation, the fuel blends were stored in the tank trailer and pumped with an external transfer pump (with a flow range from 20 L/min to 120 L/min and 345 kPa of max. pressure) into the fuel pump group (FPG). In the FPG, the fuel was pressurized up to 1448 kPa and pumped into the fuel control unit (FCU), where the fuel mass flow was controlled as a function of the acceleration control, ω s h a f t , EGT, and the sensed pressure of the pre-heated primary air.
The thrust force ( T ) was measured with a set of two Toroid Corp. 3965 model load cells (with a load range of 11,340 kg and an accuracy of 1%). General specifications of the experimental facility and the operating conditions of the engine are presented in Table 1. Experimentation was carried out in the atmospheric environment of Madrid, Colombia. The barometric pressure, the temperature, and relative humidity of the ambient air were measured with a Wallace and Tiernan ref. FA 112170 barometer and an Omet ref. C3121 thermo-hygrometer.
To run an experiment, the testing bench sensors are first checked, and the fuel line coming from the tank trailer is pressurized. Then, the turbine shaft is actioned to rotate to 8257 RPM using a starter-generator drive. The fuel blend is injected with 2 sets of starting fuel nozzles. Thereupon, a set of 2 spark plugs are used to ignite the combustion, and the fuel distributor starts the fuel injection. At this procedure, the exhaust gas temperature immediately reaches the max. operation value. The ignition procedure checks if the value of EGT is below 662 °C, such that the starter-generator drive and the spark plugs are switched off, and the engine is left over at the idle regime (8257 RPM). Once the engine is turned on and all the peripheral systems are checked, the engine is gradually sped up to the take-off regime (21,730 RPM) until the lubrication oil temperature reaches from 37 °C to 65 °C. The response variables are registered for 5 min at steady-state conditions.
Then, the engine is slowed down to the cruise regime (17,384 RPM), left over for 5 min to attain steady-state conditions, and the response variables are again registered for another 5 min. The register procedure is repeated for the 15,211 RPM and the idle (8257 RPM) regime. Lastly, the engine is left over at the cruise regime for 10 min to evaluate changes in operation variables. To finish the experimental run, the engine is slowed down gradually to the idle regime, and the combustion systems are turned off. The engine is then cooled down until EGT is below 120 °C, and the main components of the engine are visually checked. After that, a new fuel blend is prepared and tested by repeating the same procedure. Three test replicas were done for each blend to have a statistical control of the experimental measurements.

2.2. Experimental Planning and Data Processing

The experiments are codified with “B” for w B D and “RPM” for the engine operating regime as a percentage ratio of the maximum ω s h a f t of 21,730 RPM. The baseline experiments with no biodiesel content (B0-RPM38, B0-RPM70, B0-RPM80, B0-RPM100) were selected to evaluate the design operating regimes of the engine using pure Jet A1. The biodiesel volume contents of B5 and B10 were selected to evaluate the effect of the biodiesel substitution in the engine operation as no prior evidence of operation with biodiesel is reported in the literature for the J-69 engine. The operating regimes of the engine were set to 38% RPM (8257 RPM), 80% RPM (17,384 RPM), and 100% RPM (21,730 RPM) in order to evaluate the idle, cruise, and take-off regimes, respectively. An additional operating regime of 70% RPM (15,211 RPM) was selected to assess the effect of the biodiesel substitution in an intermediate regime between the idle and cruise regimes.
These regimes were chosen to be evaluated since they are the most frequently used during a flight. The idle regime (38% RPM) is the stabilization condition after the start-up of the engine with no acceleration. At this regime, all of the operating parameters of the engine are normally verified before the flight to avoid overheating, possible fuel and oil leakages, or excessive vibration. The cruise regime (80% RPM) and intermediate regime (70% RPM) are commonly used during flight but also to evaluate the performance of the engine during the taxing of the aircraft at minimum thrust. Finally, the take-off regime (100% RPM) is used during the take-off and landing of the aircraft, normally reporting the maximum power generation of the engine with maximum fuel consumption and mechanical stresses of the main components.
During the steady-state of the engine at every operating regime, the OAT, EGT, ω s h a f t , T , and P f variables were measured and automatically acquired every 5 s by a National Instruments ref. cRIO data logger. On the other hand, the value of m ˙ f and the volume fractions of O2, CO2, CO, and HC at the exhaust gas were manually registered every 15 s by using the perimetric instrumentation (defined in Figure 2a) only during the steady-state regimes. To test repeatability, the experimental runs were executed three times.

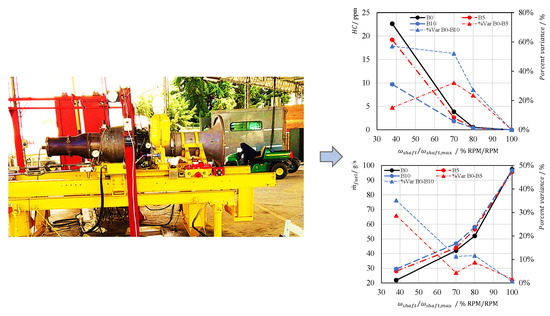
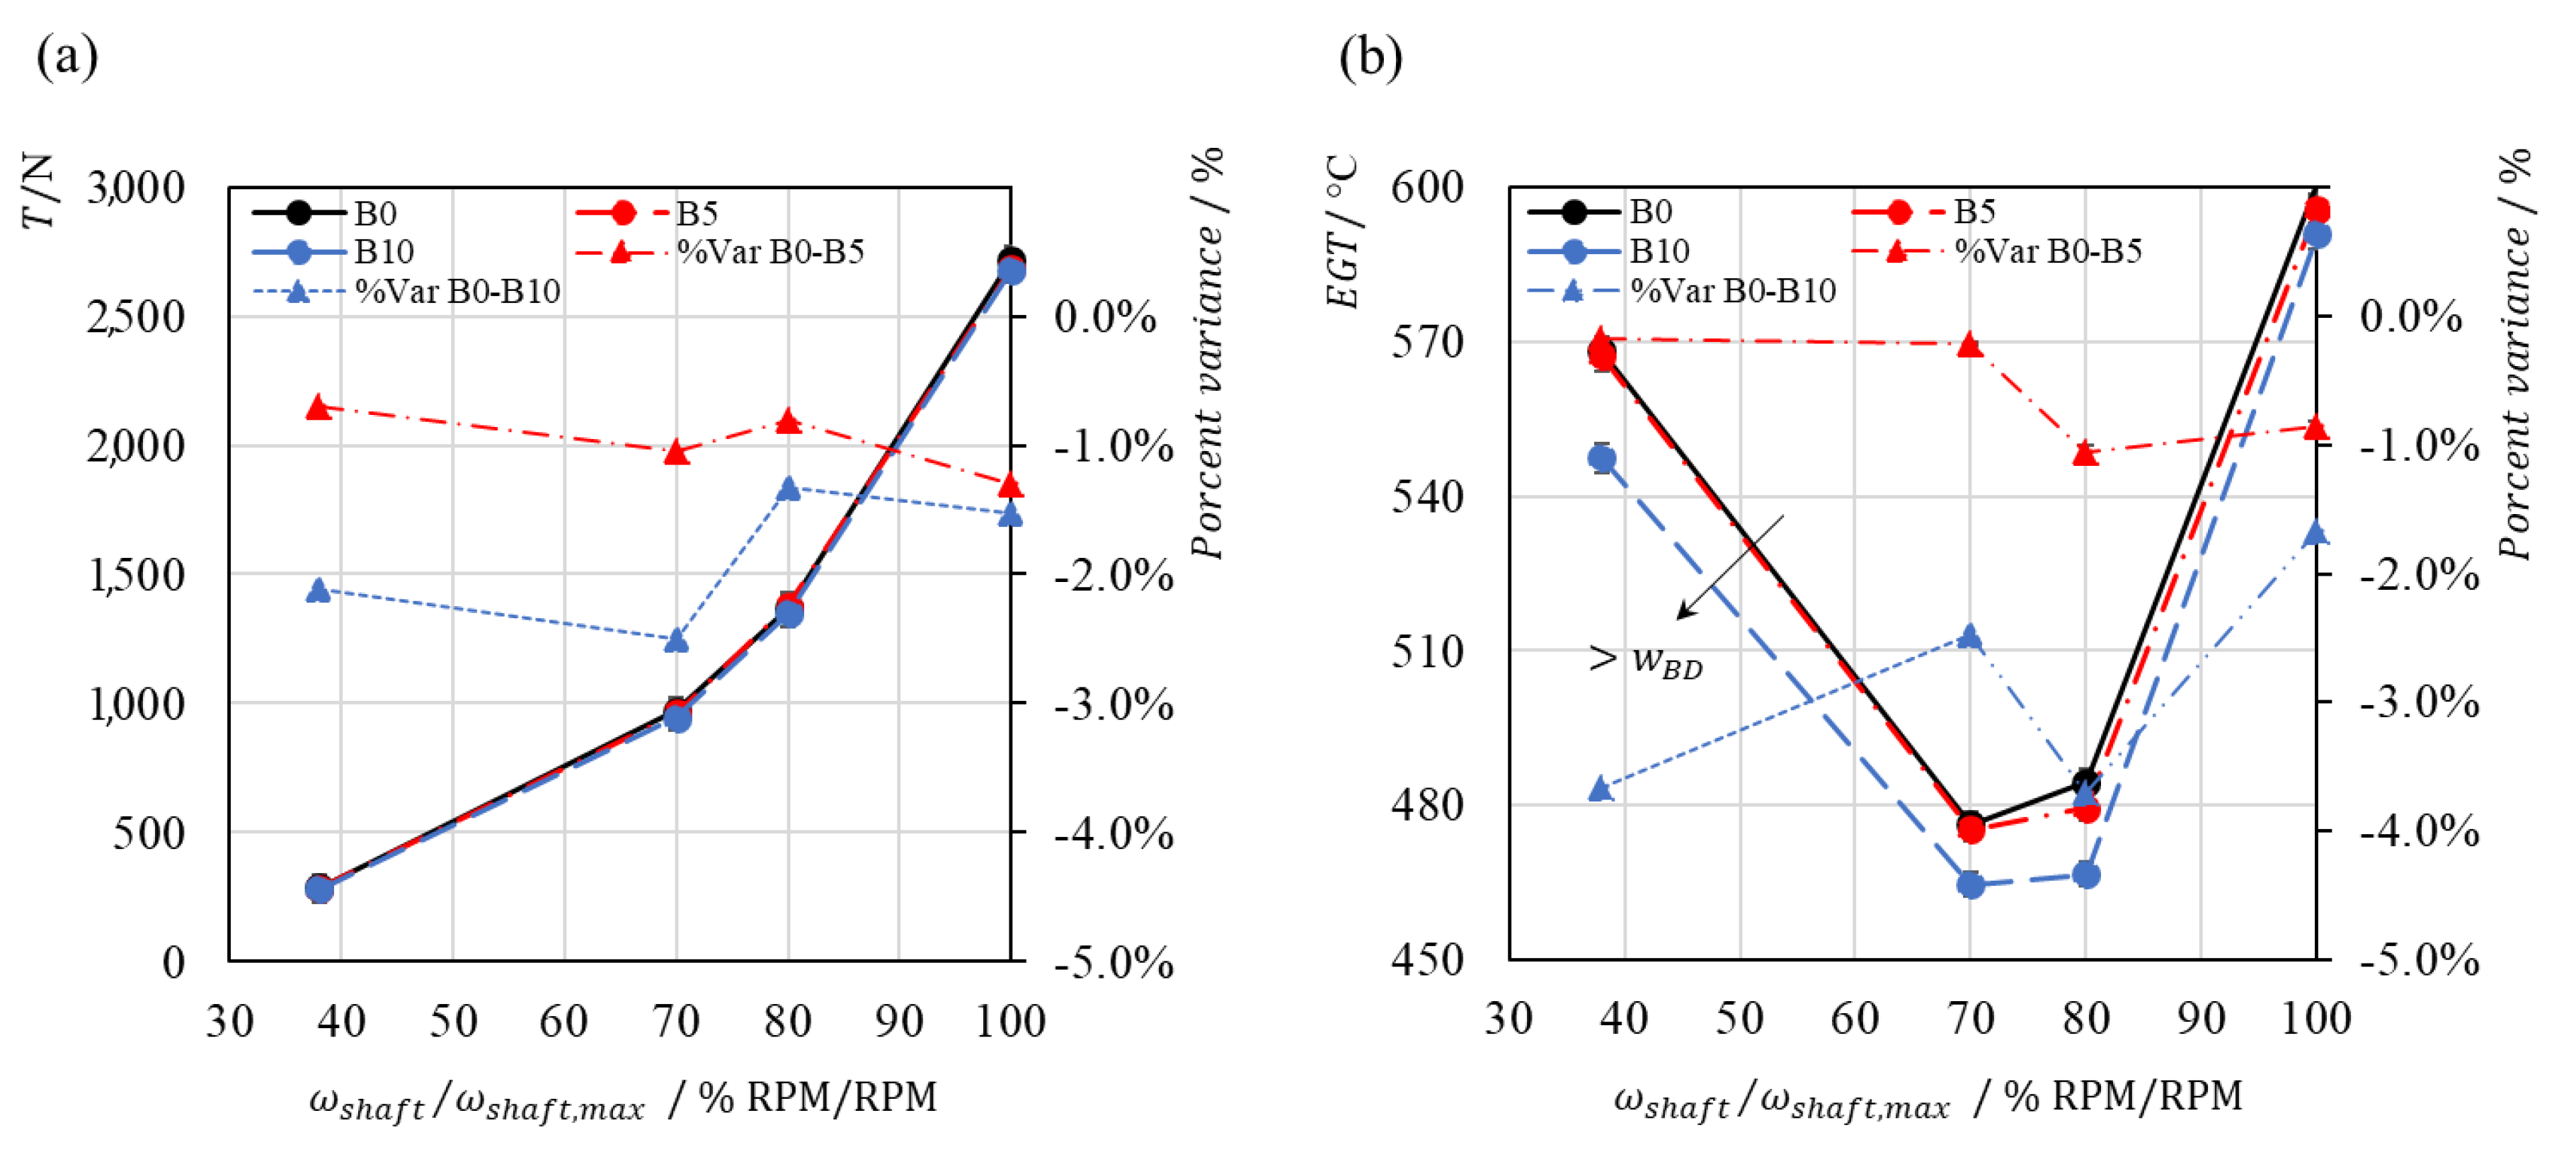
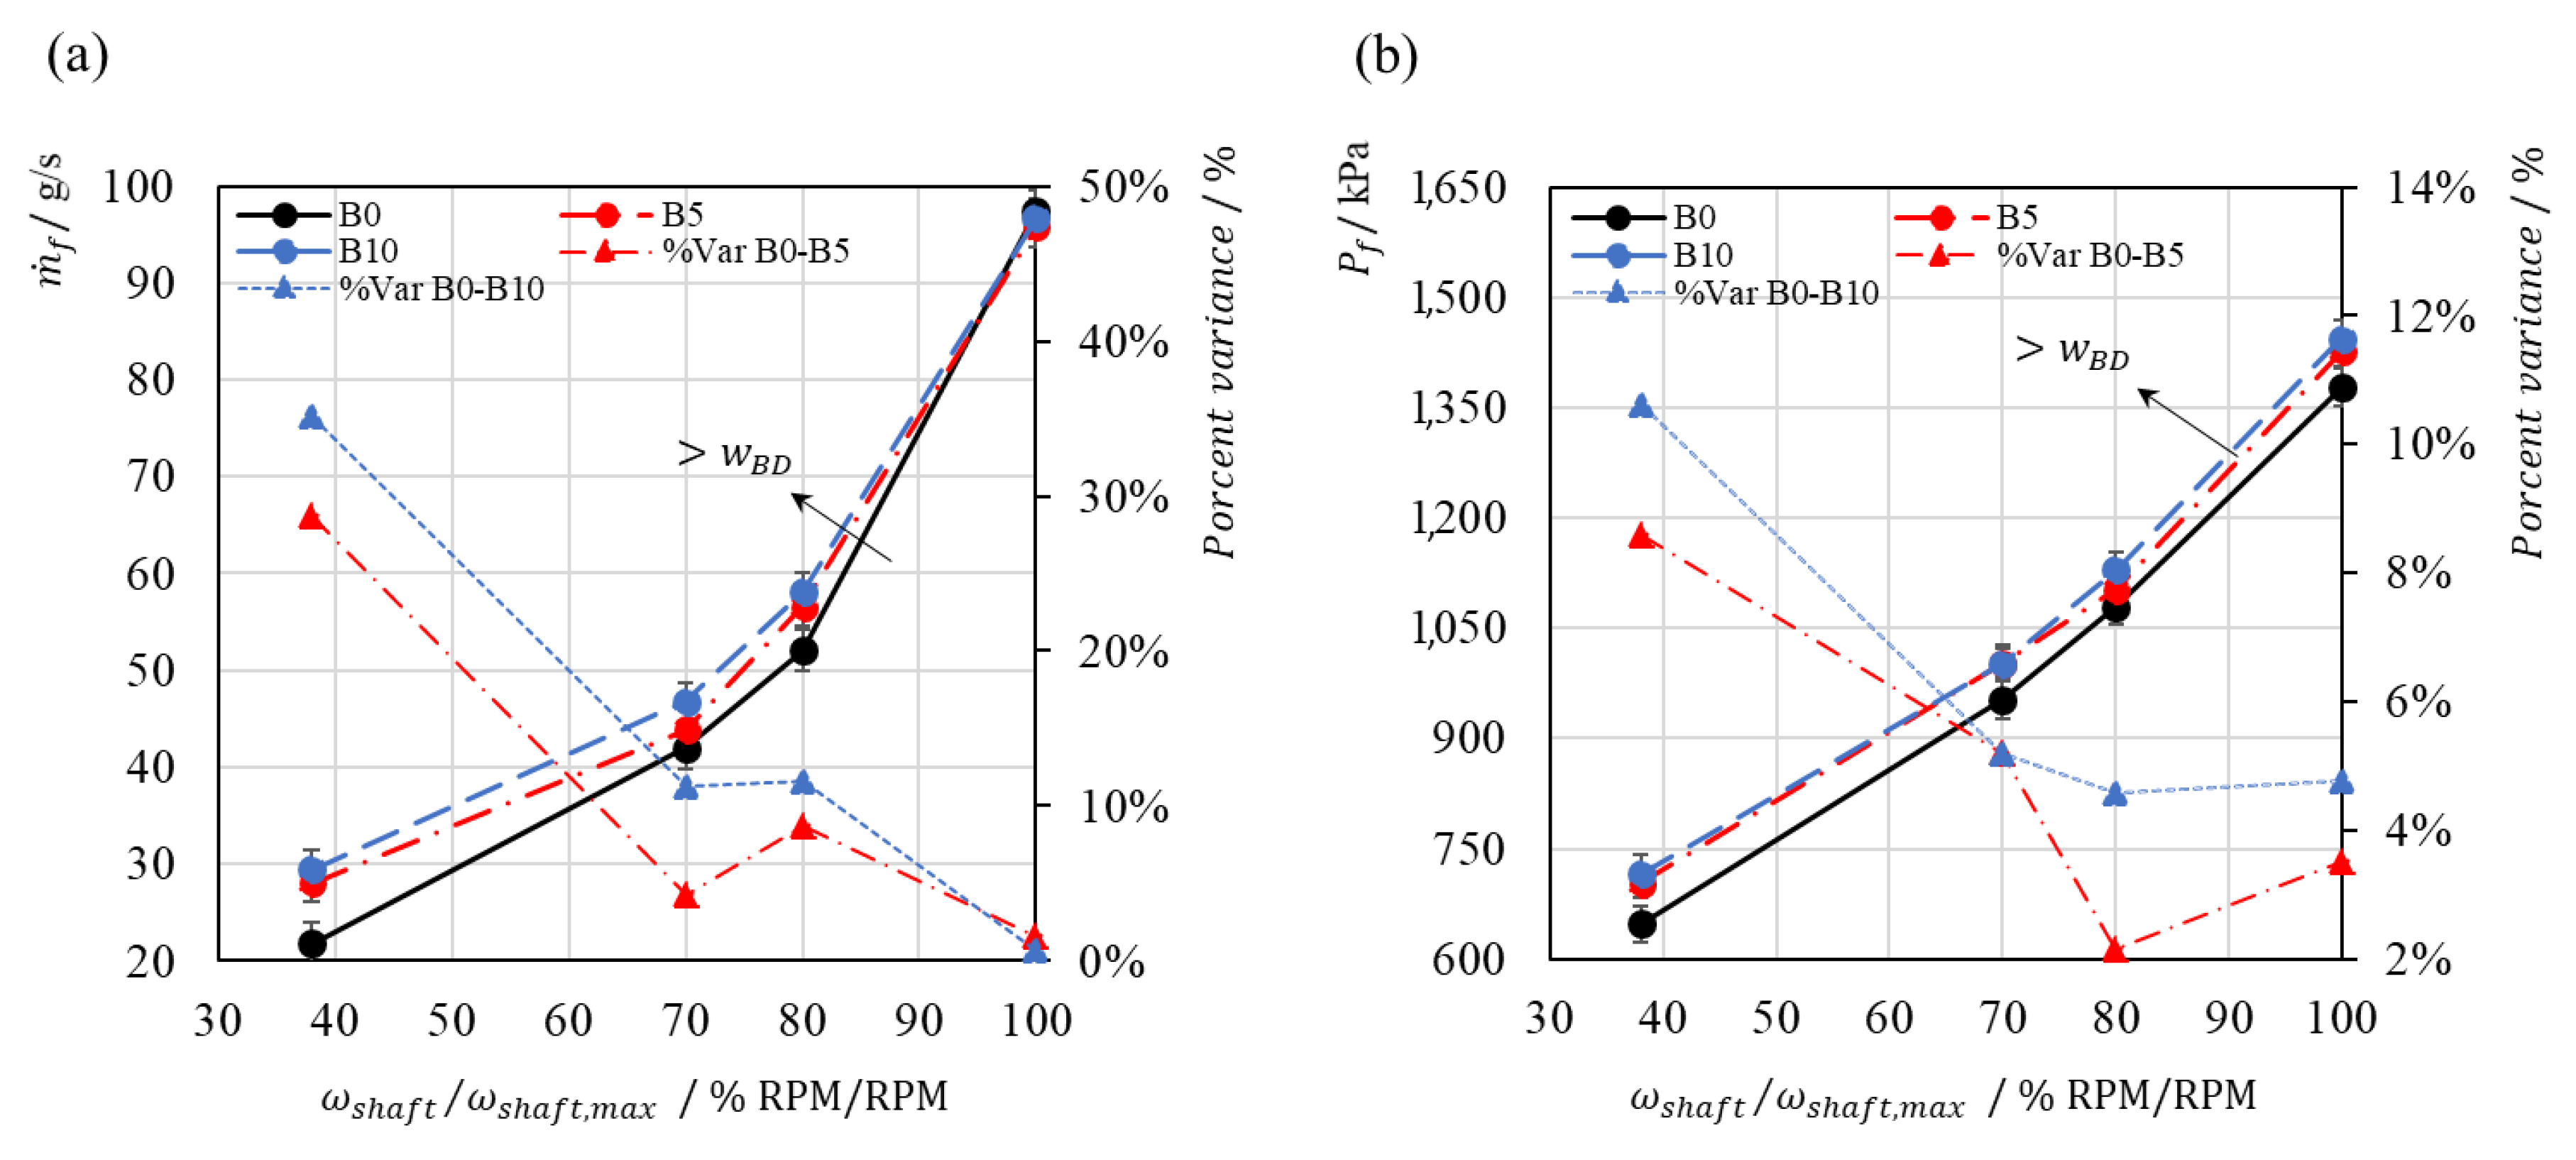
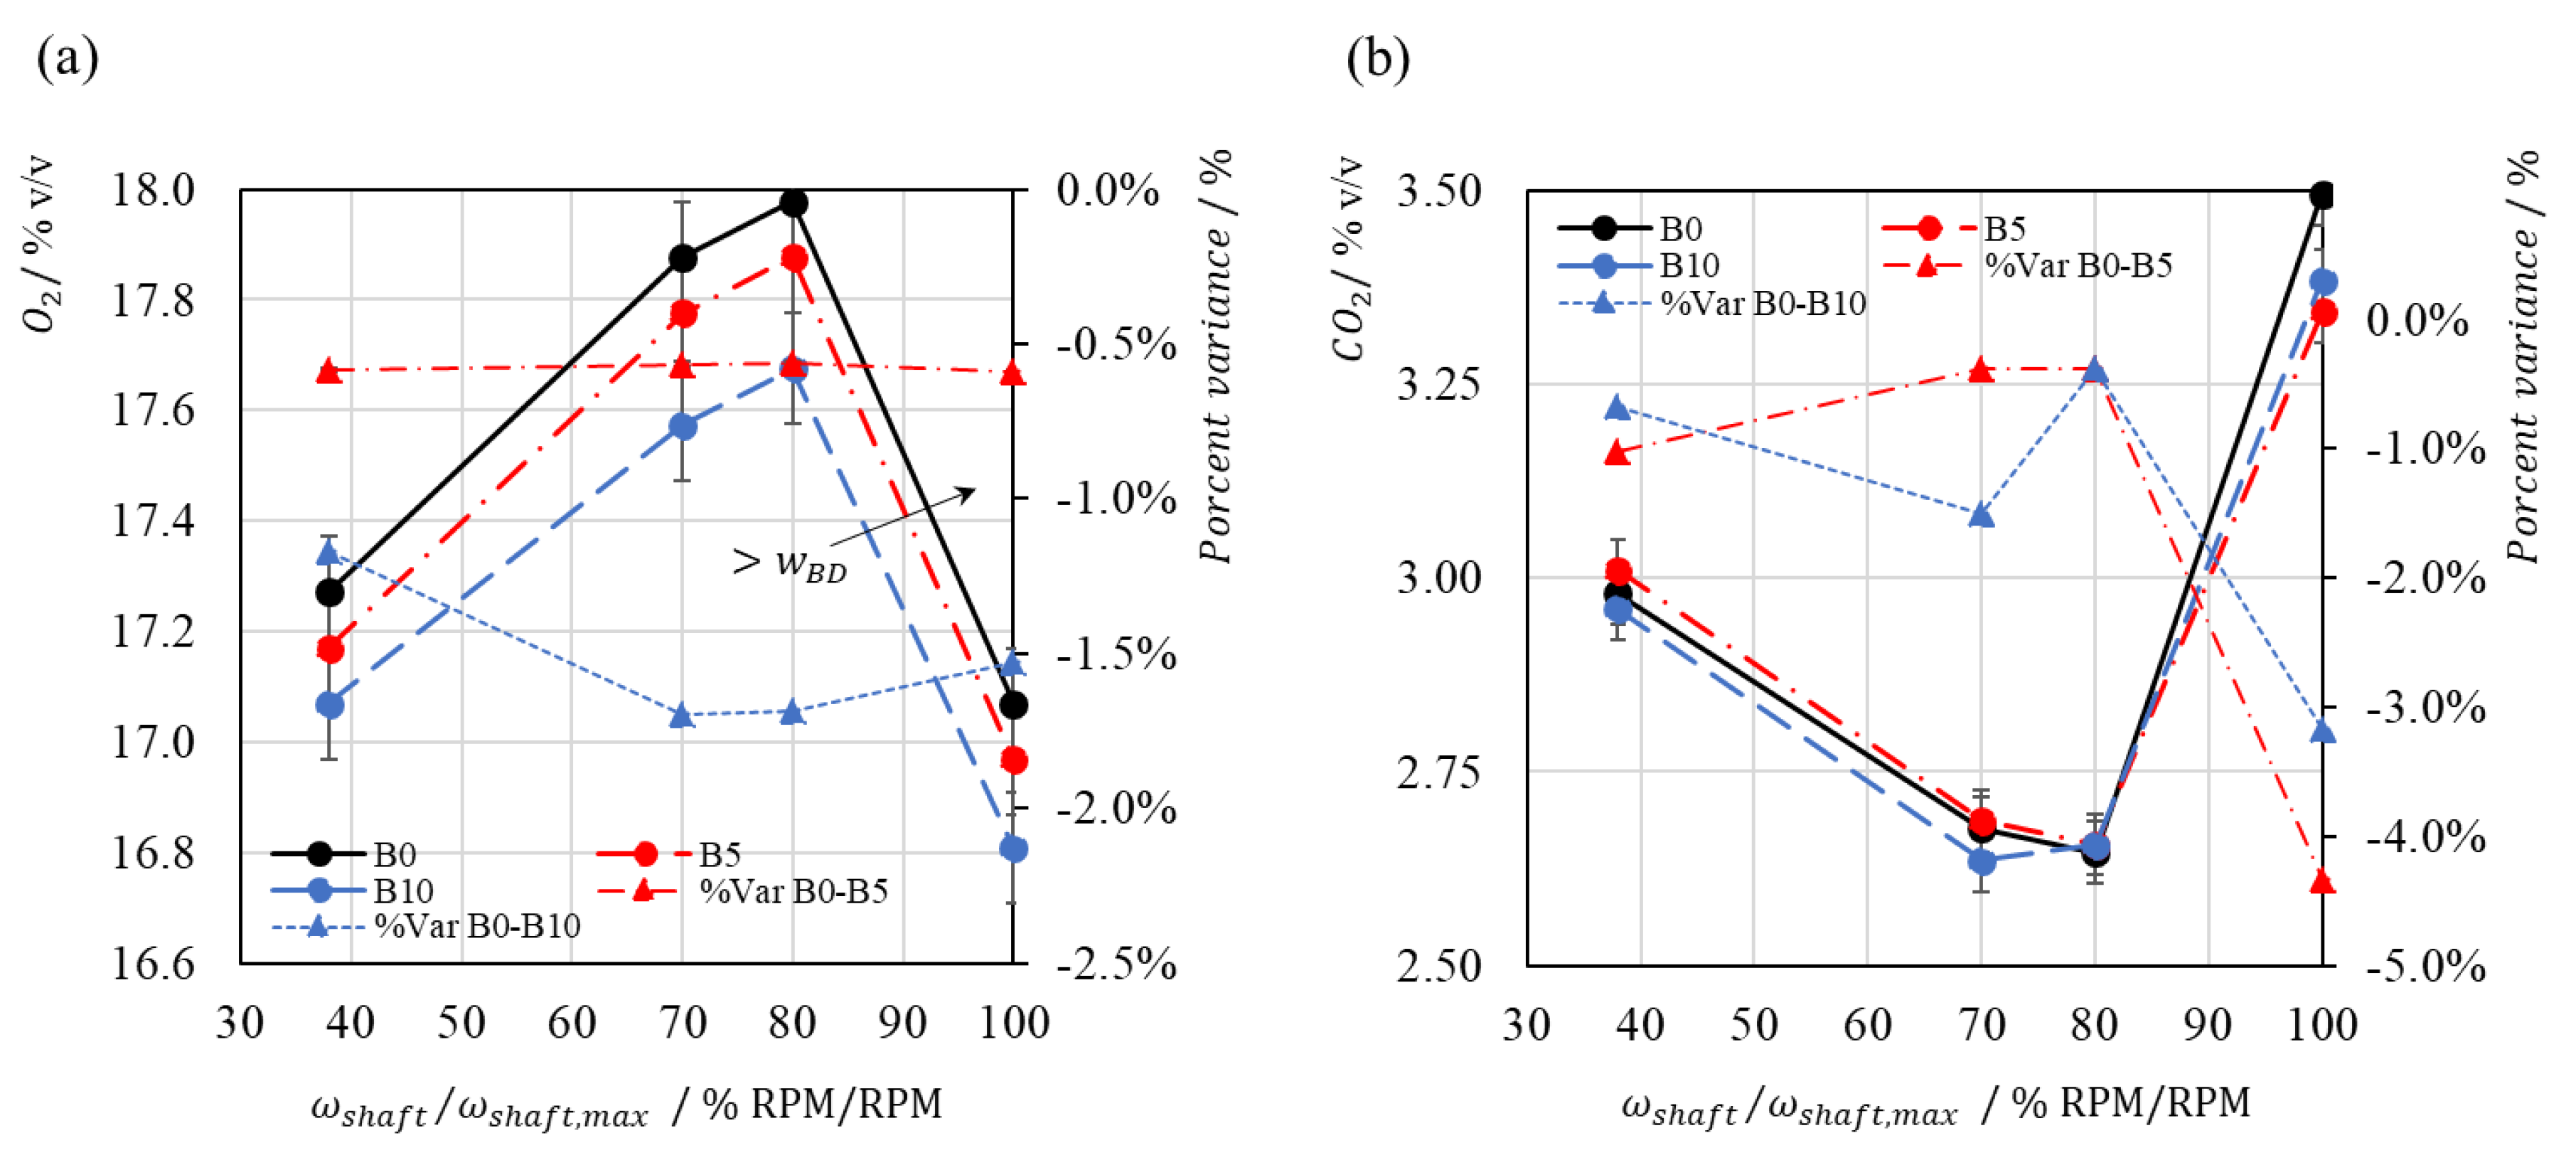
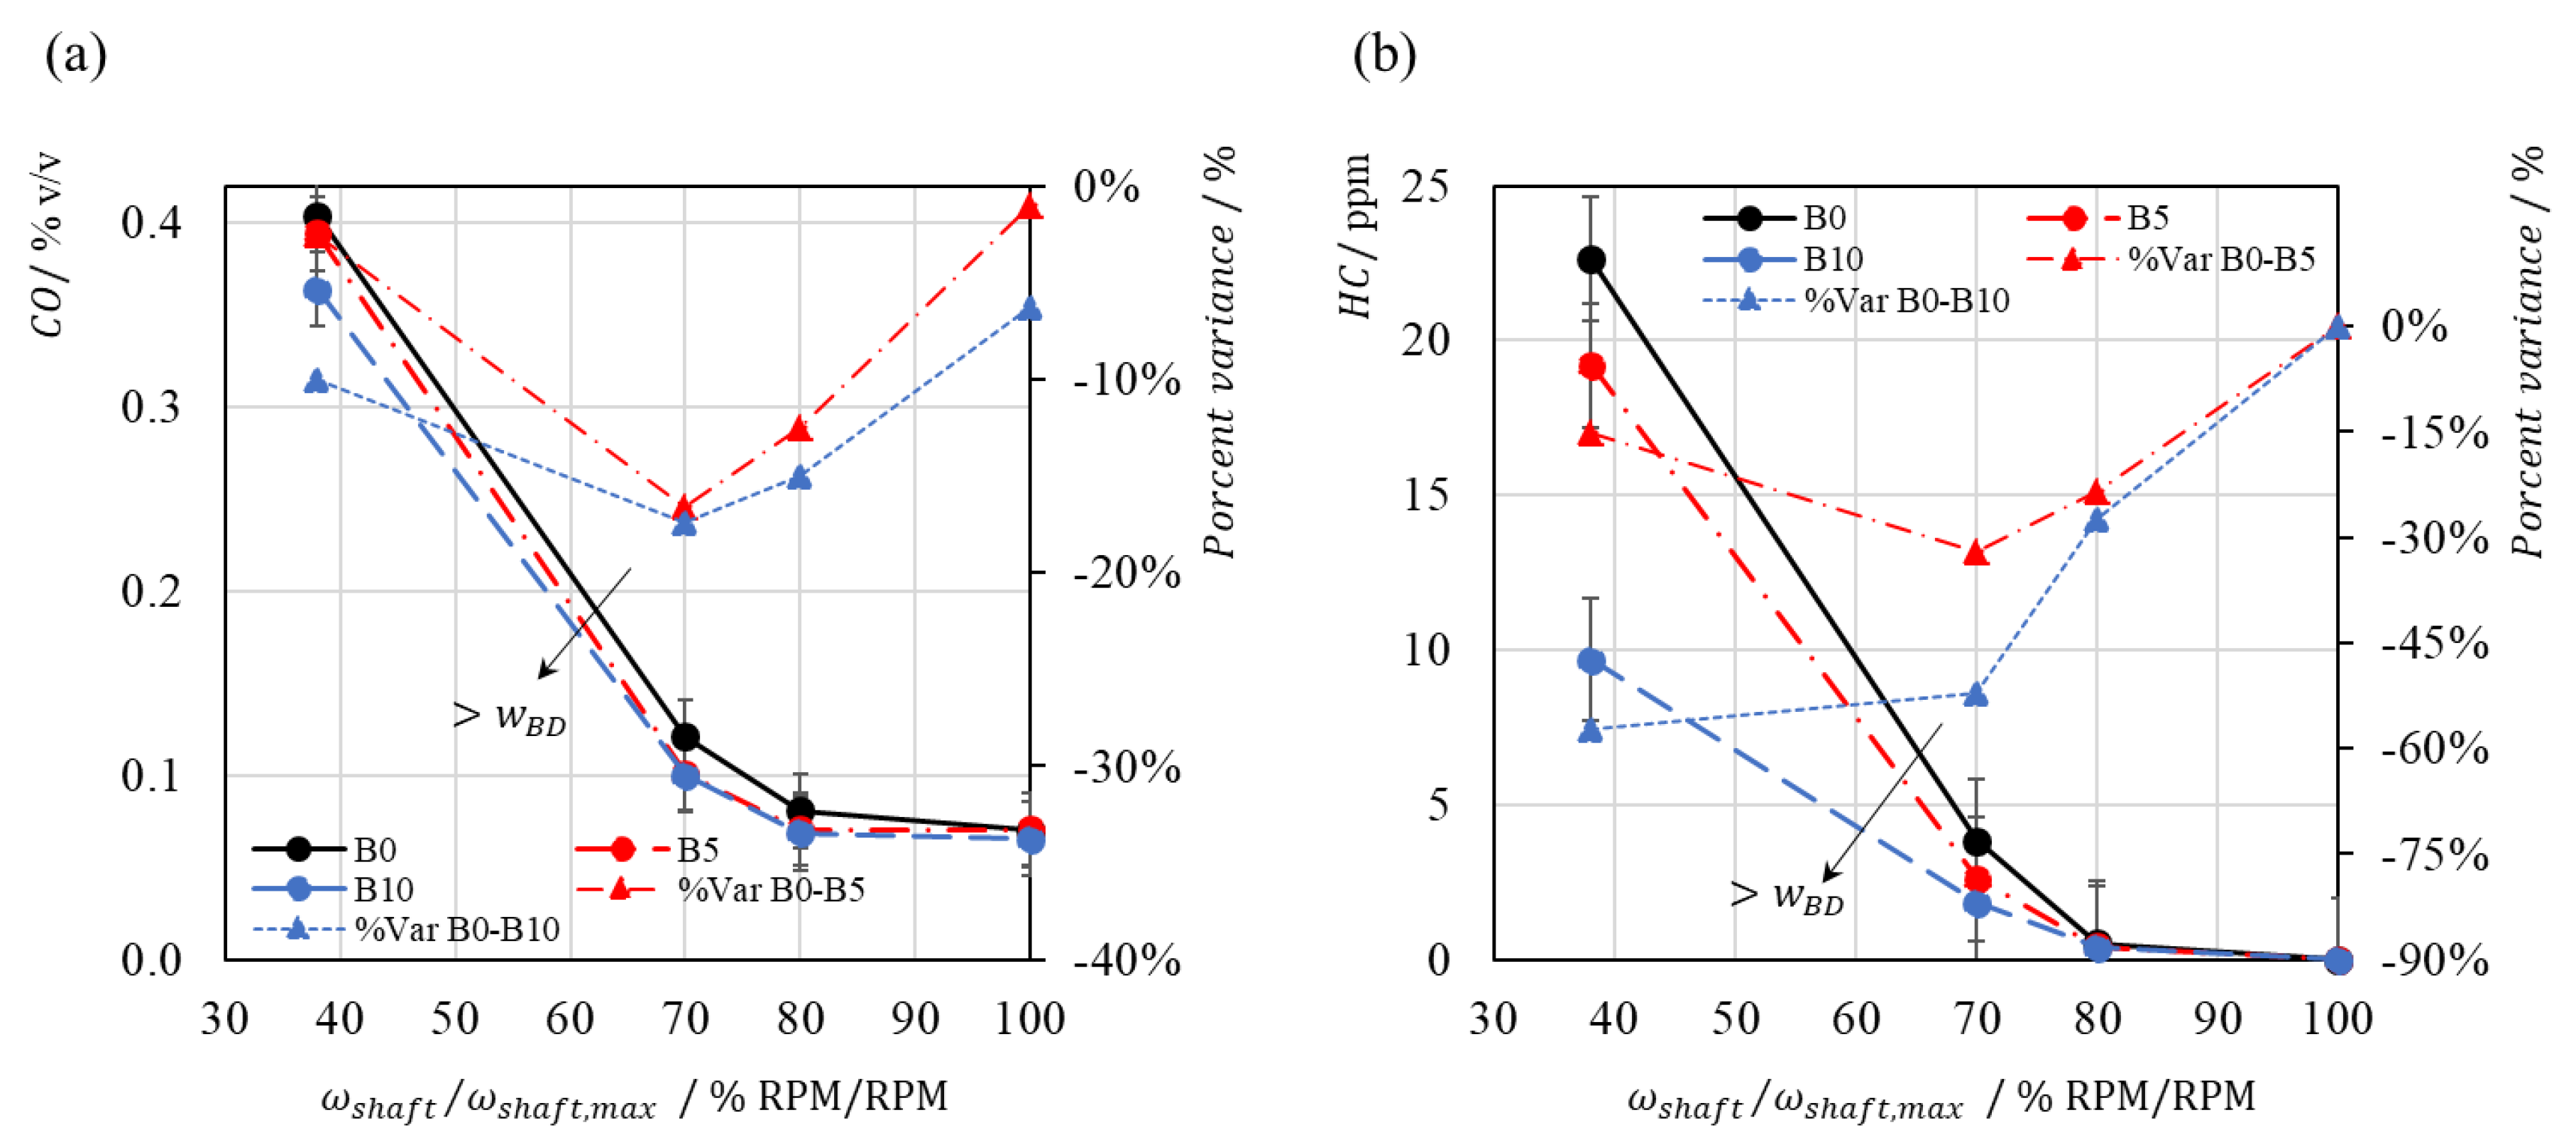
3. Results and Discussion

Figure 3 and Figure 4 present the results of the measured variables T , EGT, m ˙ f , and P f following the experimental plan, compilating, at first, the baseline experiments (B0) with non-biodiesel content and the substitution of biodiesel B5 and B10, varying the engine responses at the operating regimes: idle—38% RPM, 70% RPM70; cruise—80% RPM; take-off—100% RPM. The obtained max. coefficients of variations are as follows: T is 4.2%, EGT is 0.4%, m ˙ f is 2.3%, and P f is 2.5%. Hence, the extracted results and discussions rely on statistically representative data. The minimum and maximum values of T , m ˙ f , and P f are attained at idle and cruise regimes, respectively. The minimum EGT value occurs between 70% RPM and cruise regimes, as a result of the optimal heat dissipation of the engine [21].
The effect of the biodiesel content increases up to 10% v/v and does not reveal a significant variation in the T and EGT variables for every operation regime as the absolute percent variation is below 2.5% and 3.8%, respectively. On the other hand, a significative statistical difference is found at the idle regime for m ˙ f and P f , with a level of significance of 90%. Instead, no significative differences are found for the 70% RPM, cruise, and take-off regimes. The rise in biodiesel content from 0% to 10% increases the m ˙ f by 36% and P f by 11% at the idle operation, mainly explained by a fuel control unit (FCU) malfunctioning as a result of lower energy content of the biodiesel, poor atomization of the fuel, and possible saturation of the fuel filters.
The FCU is a hydro-mechanical component that dozes the amount of fuel by modifying the valves opening in a set of needles as a function of the ω s h a f t , T a i r , and the density and viscosity of the fuel blend. Thus, modification in the hydro-mechanical properties of the fuel blend alters the FCU operation, increasing the stress of the needle valves and the fuel injection pressure. Hoxie et al. [11] and Corporan et al. [5] also reported those variations in m ˙ f and P f , attributed to the decrease of the fuel blend H H V a d that reduces the rate of energy supplied by the fuel and to poor atomization of the fuel in the combustor chamber when increasing the biodiesel content. According to Lupandin et al. [19], an increase in the viscosity of the fuel mixture and the plugging of biodiesel in the filtration system was registered during those previous experimentations.
Also, the emission measurements of O2, CO2, CO, and HC are presented in Figure 5 and Figure 6. The max. standard deviation for the volume fraction of exhaust gases is as follows: O2 is 0.13%, CO2 is 0.04%, CO is 0.04%, and HC is 2.5 ppm. A maximum volume fraction in the flue gas of O2 and a minimum of CO2 are observed at the cruise regime (80% RPM), indicating an increase of the air to fuel ratio (AFR). Prior variations are also reported by Chiong et al. [13] and Rochelle et al. [6,14], in which a higher oxygen content was linked to biodiesel compared to fossil fuel, increasing the percent excess combustion air and thus increasing the AFR. Nonetheless, the evolution of CO and HC presented in Figure 6 exposes a reduction in the volume fraction when increasing the main shaft rotational speed with a minimum value of CO at the take-off regime (100% RPM). Moreover, no HC emissions are observed at take-off as a result of a possible increase in the excess air of combustion.
A reduction of the CO and HC emissions is also presented in Figure 6 with the rise of biodiesel content up to 10% v/v, with a maximum variation between 70% RPM and the cruise regime (80% RPM). The reduction of the HC emissions when using 10% v/v near 58% indicates a higher combustion efficiency and a more complete combustion within the engine. Kimble et al. [23] and Chiaramoniti et al. [7] also reported a reduction in the evolved CO when increasing the atomizing pressure from 0.3 bar to 1.1 bar, leading to a better flame stability within the combustion chamber and raising the fuel injection temperature above 120 °C, as the fuel viscosity is reduced when increasing the injection temperature and thus, improves the atomization and volatilization processes.
The effects of these changes in the emission can be further identified as a possible variation of the AFR and the E A at different biodiesel contents and operating regimes. The E A tends to decrease when increasing the biodiesel content from 0% to 10%, as the A F R s t is reduced. Moreover, the additional excess air and the slight reduction of the EGT are indicators of a possible higher influence of the secondary air stream during combustion. Even though prior behavior can be linked to the variation of the AFR and the excess air of combustion, no measurement of the airflow intake of the engine at all the operating regimes precludes the validation of the effect of those variables in the measured emissions.

4. Conclusions

The testing of the turbine J69-T-25A using blends of Jet A1 and biodiesel validates the feasibility of using up to 10% v/v of oil palm biodiesel in a full-size military aviation engine. The experimental methodology and the used facility allowed the measurement of operating parameters of the engine. No significant variations in the thrust force and EGT were observed in all the operation regimes with the utilization up to 10% v/v of biodiesel. Nonetheless, a 36% increase in fuel consumption and an 11% increase in injection pressure were observed at idle operation between B0 and B10.
Additionally, the perimetral instrumentation allowed the quantification of the evolved emissions in terms of the volume content of CO and HC in the flue gas. At the cruise regime (80% RPM), a maximum reduction of the CO and HC emissions was observed with a maximum variation of 25% and 58%, respectively. The reduction of those emissions indicates a sustainable operation of the J69 engine with 10% of biodiesel content by presenting a more complete combustion with a significative reduction in the operating performance variables.
In further studies, a more detailed examination of the energy performance in terms of energy efficiency, thrust-specific fuel consumption, and combustion reaction is recommended. Furthermore, the validation of a higher substitution of biodiesel in the fuel blend is advised in order to identify possible detrimental aspects of the operating performance or mechanical wearing of the main components.

Author Contributions

Conceptualization, G.T., V.S., J.P. and M.L.; data curation, G.T., G.M. and M.G.; formal analysis, G.T. and C.B.-R.; funding acquisition, M.L.; investigation, G.T., G.M. and V.S.; methodology, G.T., G.M. and V.S.; project administration, V.S. and M.L.; resources, G.M., M.G., J.P. and M.L.; supervision, C.B.-R., J.P. and M.L.; visualization, G.T.; writing—original draft, G.T., G.M. and V.S.; writing—review and editing, C.B.-R.

Funding

This work was supported by COLCIENCIAS (Grant No. 56752). The Colombian Air Force—FAC and The Universidad ECCI.

Acknowledgments

The authors would like to thank Hamilton Henao from CAMAN for all the support during the experimental labor; Nelson Jimenez from ESUFA; and M.G., Renso Arango from the Universidad ECCI.

Conflicts of Interest

The authors declare no conflict of interest.

Abbreviations

The following nomenclature is used in this manuscript:
SymbolDefinitionUnits
% E A Percent excess combustion air % g/g
P f Fuel pressurekPa
m ˙ f Fuel mass flowg/s
w B D Biodiesel volume content in fuel blend% v/v
ω s h a f t Main shaft rotational speedRPM
A F R Air/fuel ratiog/g
E G T Exhaust gas temperature-
H H V Higher heating valueMJ/kg
T Thrust forceN
O A T Outside Air Temperature°C

References

  1. Abu Talib, A.R.; Gires, E.; Ahmad, M.T. Performance Evaluation of a Small-Scale Turbojet Engine Running on Palm Oil Biodiesel Blends. J. Fuels 2014. [Google Scholar] [CrossRef]
  2. Teske, S. Achieving the Paris Climate Agreement Goals: Global and Regional 100% Renewable Energy Scenarios with Non-Energy GHG Pathways for +1.5 C and +2 C; Institute for Sustainable Futures University of Technology Sydney, Ed.; Springer: Sydney, NSW, Australia, 2019; ISBN 9783030058432. [Google Scholar]
  3. Kandaramath Hari, T.; Yaakob, Z.; Binitha, N.N. Aviation biofuel from renewable resources: Routes, opportunities and challenges. Renew. Sustain. Energy Rev. 2015, 42, 1234–1244. [Google Scholar] [CrossRef]
  4. Coban, K.; Colpan, C.O.; Karakoc, T.H. Application of thermodynamic laws on a military helicopter engine. Energy 2017, 140, 1427–1436. [Google Scholar] [CrossRef]
  5. Corporan, E.; Reich, R.; Larson, V.; Aulich, T.; Mann, M.; Seames, W. Impacts of biodiesel on pollutant emissions of a JP-8–fueled turbine engine. J. Air Waste Manag. Assoc. 2005, 55, 940–949. [Google Scholar] [CrossRef] [PubMed]
  6. Nascimento, M.A.R.; Lora, E.S.; Corrêa, P.S.P.; Andrade, R.V.; Rendon, M.A.; Venturini, O.J.; Ramirez, G.A.S. Biodiesel fuel in diesel micro-turbine engines: Modelling and experimental evaluation. Energy 2008, 33, 233–240. [Google Scholar] [CrossRef]
  7. Chiaramonti, D.; Rizzo, A.M.; Spadi, A.; Prussi, M.; Riccio, G.; Martelli, F. Exhaust emissions from liquid fuel micro gas turbine fed with diesel oil, biodiesel and vegetable oil. Appl. Energy 2013, 101, 349–356. [Google Scholar] [CrossRef]
  8. Sundararaj, R.H.; Dinesh, R.; Kumar, A.; Sekar, T.C.; Pandey, V.; Kushari, A.; Puri, S.K. Combustion and emission characteristics from biojet fuel blends in a gas turbine combustor. Energy 2019, 182, 689–705. [Google Scholar] [CrossRef]
  9. Udeh, G.T.; Udeh, P.O. Comparative thermo-economic analysis of multi-fuel fired gas turbine power plant. Renew. Energy 2019, 133, 295–306. [Google Scholar] [CrossRef]
  10. Harahap, F.; Silveira, S.; Khatiwada, D. Cost competitiveness of palm oil biodiesel production in Indonesia. Energy 2019, 170, 62–72. [Google Scholar] [CrossRef]
  11. Hoxie, A.; Anderson, M. Evaluating high volume blends of vegetable oil in micro-gas turbine engines. Renew. Energy 2017, 101, 886–893. [Google Scholar] [CrossRef]
  12. Allouis, C.; Beretta, F.; Minutolo, P.; Pagliara, R.; Sirignano, M.; Sgro, L.A.; Anna, A.D. Measurements of ultrafine particles from a gas-turbine burning biofuels. Exp. Therm. Fluid Sci. 2010, 34, 258–261. [Google Scholar] [CrossRef]
  13. Chiong, M.C.; Chong, C.T.; Ng, J.H.; Lam, S.S.; Tran, M.V.; Chong, W.W.F.; Mohd Jaafar, M.N.; Valera-Medina, A. Liquid biofuels production and emissions performance in gas turbines: A review. Energy Convers. Manag. 2018, 173, 640–658. [Google Scholar] [CrossRef]
  14. Rochelle, D.; Najafi, H. A review of the effect of biodiesel on gas turbine emissions and performance. Renew. Sustain. Energy Rev. 2019, 105, 129–137. [Google Scholar] [CrossRef]
  15. Čerňan, J.; Hocko, M.; Cúttová, M. Safety risks of biofuel utilization in aircraft operations. Transp. Res. Procedia 2017, 28, 141–148. [Google Scholar] [CrossRef]
  16. Badami, M.; Nuccio, P.; Signoretto, A. Experimental and numerical analysis of a small-scale turbojet engine. Energy Convers. Manag. 2013, 76, 225–233. [Google Scholar] [CrossRef]
  17. French, K.W. Recycled fuel performance in the SR-30 gas turbine. In Proceedings of the 2003 American Society for Engineering Education Annual Conference Exposition, Nashville, TN, USA, 22–25 June 2003. [Google Scholar]
  18. Habib, Z.; Parthasarathy, R.; Gollahalli, S. Performance and emission characteristics of biofuel in a small-scale gas turbine engine. Appl. Energy 2010, 87, 1701–1709. [Google Scholar] [CrossRef]
  19. Lupandin, V.; Thamburaj, R.; Nikolayev, A. Test results of the OGT2500 Gas Turbine. Engine Running on Alternative Fuels: BioOil, Ethanol, BioDiesel and Crude Oil 2005. In Proceedings of the ASME Turbo Expo 2005. Power for Land, Sea, and Air, Reno, NV, USA, 6–9 June 2005; pp. 421–426. [Google Scholar]
  20. Bayona-Roa, C.; Solís-Chaves, J.; Bonilla, J.; Rodriguez-Melendez, A.; Castellanos, D. Computational Simulation of PT6A Gas Turbine Engine Operating with Different Blends of Biodiesel—A Transient-Response Analysis. Energies 2019, 12, 4258. [Google Scholar] [CrossRef]
  21. Teledyne Continental Aviation and Engineering—CAE. Technichal Manual T.0. 2J-J69-72 Intermediate Maintenance Instructions Turbojet Engine Model No. J69-T-25-A; US Air Force: Oklahoma City, OK, USA, 2004.
  22. Choi, S.; Lee, D.; Park, J. Ignition and combustion characteristics of the gas turbine slinger combustor. J. Mech. Sci. Technol. 2008, 22, 538–544. [Google Scholar] [CrossRef]
  23. Kimble-Thom, M.A.; Stanley, D.L.; Cholis, J.T.; Lopp, D.W. The Use of Bio-Fuels as Additives and Extenders for Aviation Turbine Fuels. In Proceedings of the ASME 1999 International Gas Turbine and Aeroengine Congress and Exhibition, Indianapolis, IN, USA, 7–10 June 1999; ASME: New York, NY, USA, 2014. V002T01A007. [Google Scholar]
Figure 1. (a) General aspect of the J69 engine installed in the testing bench; (b) detail of the control booth used in the experimentation.
Energies 12 04530 g001
Figure 2. (a) General J69 engine experimental facility detailing peripheral components and instrumentation: (1) turbojet engine model J69T-25A, (2) tachometer, (3) fuel pressure manometer, (4) air inlet duct, (5) air inlet temperature probe set, (6) exhaust gas temperature (EGT) thermocouple set, (7) exhaust gas sampling rake, (8) exhaust gas analyzer, (9) fuel flow meter, (10) fuel supply line, (11) fuel inlet pressure manometer, (12) fuel supply pump, and (13) fuel tank; (b) detail of the exhaust gas sampling rake: (14) outer tailpipe, (15) gas sampling ducts; (c) the layout of the installation of the thermocouples, in accordance with the standard instrumentation of the engine technical manual [21]. (Source: Author’s own figures).
Energies 12 04530 g002
Figure 3. Effect of the biodiesel content for experiments B0, B5, and B10 varying the engine regime ( ω s h a f t / ω s h a f t , m a x ) in the: (a) thrust force ( T ) and the absolute percent variance, (b) exhaust gas temperature (EGT) and the absolute percent variance.
Energies 12 04530 g003
Figure 4. Effect of the biodiesel content for experiments B0, B5, and B10 varying the engine regime ( ω s h a f t / ω s h a f t , m a x ) in the: (a) fuel consumption ( m ˙ f ) and the absolute percent variance, (b) fuel injection pressure ( P f u e l ) and the absolute percent variance.
Energies 12 04530 g004
Figure 5. Effect of the biodiesel content for experiments B0, B5, and B10 varying the engine regime ( ω s h a f t / ω s h a f t , m a x ) in the: (a) content of oxygen in flue gas ( O 2 ) and the absolute percent variance, (b) content of carbon dioxide in flue gas ( C O 2 ) and the absolute percent variance.
Energies 12 04530 g005
Figure 6. Effect of the biodiesel content for experiments B0, B5, and B10 varying the engine regime ( ω s h a f t / ω s h a f t , m a x ) in the: (a) content of carbon monoxide in flue gas ( C O ) and the absolute percent variance, (b) hydrocarbons in flue gas ( H C ) and the absolute percent variance.
Energies 12 04530 g006
Table 1. General specifications and operating environment of the J69 engine.
General Specifications of the J69 Engine
Engine referenceTeledyne CAE J69
VariantJ69-T-25A
Engine typeTurbojet—Single spool
Rotational speed max./RPM21,730
Thrust max./N4560
EGT max./°C663
Compressor typeCentrifugal—1 stage
Inlet air flow max./kg/s9.07
Pressure ratio max.3.9
Turbine typeAxial flow—1 stage
Fuel distributorCentrifugal/Slinger holes
No. Of fuel injectors2
No. Of Slinger Holes 16
Fuel typeJP-4, Jet A, Jet A1
Fuel consumption max./g/s143.6
Operating Environment
LocationMadrid, Colombia
MSN/m2554
OAT/°C16–26
RH/%25–56
Patm/hPa1017

