Data-Driven Ohmic Resistance Estimation of Battery Packs for Electric Vehicles


1
National Engineering Laboratory for Electric Vehicles, Beijing Institute of Technology, Beijing 100081, China
2
Collaborative Innovation Center of Electric Vehicles, Beijing 100081, China
3
Zhengzhou Yutong Bus Co., Ltd., Henan 450016, China
*
Authors to whom correspondence should be addressed.
Energies 2019, 12(24), 4772; https://doi.org/10.3390/en12244772
Submission received: 1 October 2019
/
Revised: 5 December 2019
/
Accepted: 11 December 2019
/
Published: 13 December 2019
(This article belongs to the Special Issue Battery Aging and Life Prediction for Electric Vehicles, Energy Storage Systems and Portable Electronics)
Abstract
:Accurate state-of-health (SOH) estimation for battery packs in electric vehicles (EVs) plays a pivotal role in preventing battery fault occurrence and extending their service life. In this paper, a novel internal ohmic resistance estimation method is proposed by combining electric circuit models and data-driven algorithms. Firstly, an improved recursive least squares (RLS) is used to estimate the internal ohmic resistance. Then, an automatic outlier identification method is presented to filter out the abnormal ohmic resistance estimated under different temperatures. Finally, the ohmic resistance estimation model is established based on the Extreme Gradient Boosting (XGBoost) regression algorithm and inputs of temperature and driving distance. The proposed model is examined based on test datasets. The root mean square errors (RMSEs) are less than 4 mΩ while the mean absolute percentage errors (MAPEs) are less than 6%. The results show that the proposed method is feasible and accurate, and can be implemented in real-world EVs.
1. Introduction
With the increasing urgency of environmental pollution and fossil oil shortage, the development of electric vehicles (EVs) has gained increased attention from governments and automotive industries around the world [1]. Under the support of the Chinese government and continuous efforts of automobile manufacturers [2], China has become the leading EV market, which has accounted for more than 60% of the global sales of EVs in 2016 [3]. Lithium-ion batteries are widely used as power sources for EVs because of their high energy and power density, wide operating temperature window and long cycle life [4]. Due to the existence of pervasive side-reactions during the operation of batteries, battery state-of-health (SOH) sees a continuous degradation throughout their service life. And different factors can have different effects on battery capacity or internal resistance [5,6]. For example, low temperature affects the de-insertion capability of lithium ions from the negative electrode, which in turn influences battery capacity. An accurate metering of battery SOH is essential for ensuring efficient and safe operation of battery systems [7,8,9]. However, battery SOH cannot be directly gauged with commercially available sensors, thereby enabling estimation approaches that are being extensively researched. But accurate SOH estimation proves to be a non-trivial and challenging task due to the complicated and coupled electrochemical reactions related to it [10]. And due to the fact that operating conditions and consistency of EV batteries are different, EV batteries could have a different aging path, so automobile manufacturers cannot establish an accurate and robust SOH estimation model of batteries before the batteries are used [11]. At present, actual capacity and internal resistance are usually used as indicators of battery SOH [12,13].
Various methods have been put forward in the literature for battery SOH estimation, which can be generally grouped into three groups: physics-based, equivalent circuit model-based (ECM-based) and data-driven approaches. Physics-based models for battery SOH estimation are developed based on the first principle and use coupled partial differential equations to describe the aging mechanisms of batteries. The solid electrolyte interface (SEI) is considered as the main factor that leads to continuous capacity loss and resistance increase during battery utilization [14,15]. However, the heavy computational requirements and difficulty of efficient model parameterization for physics-based models hinders it being used in real-time battery management systems (BMSs). To meet these challenges, model simplification is constantly pursued [16]. For example, in Reference [17], the classic Pseudo-two-Dimensional (P2D) model was simplified via the finite analysis method, and the relationship between battery degradation and related characteristic parameters was identified by the genetic algorithm to estimate battery SOH. In comparison, ECMs use conventional circuitry elements such as a resistor, inductor, and capacitor to represent battery dynamics. They have simplicity and the series resistor can be used to describe the internal resistance of a battery as a direct indictor of battery SOH [18]. Thus, the problem of battery SOH estimation can be converted into model parameter identification for ECMs through enabling observer design, such as recursive least squares (RLS) [19], extended Kalman filter (EKF) [20], particle filter (PF) [21] and the like. The used ECMs mainly include the Rint, Thevenin and Partnership for a New Generation of Vehicles (PNGV) models [22].
In recent years, data-driven approaches have attracted increasing attention for battery SOH estimation. They treat the battery as a black box and have no requirements of knowledge of the underlying aging mechanisms. Some studies took voltage and/or current curves to extract features as model inputs for battery capacity estimation [23,24,25]. In this regard, incremental capacity analysis (ICA) methods have been widely adopted, in which the IC curves at different cycles are derived based on the corresponding voltage curves during a constant-current (CC) charge regime and the peak position and amplitude of the derived IC curves are extracted for battery SOH indication [26]. Different data-driven methods can be used for battery SOH estimation, such as support vector machine (SVM), relevance vector machine (RVM) [27] and neural networks [28,29].
Despite that an array of methods have been presented and verified through laboratory-based experiments [30,31,32], their performance in real-time BMSs may be heavily curtailed since the working conditions of batteries are ever-changing during vehicular operation and the influencing factors of battery health degradation cannot be fully represented in laboratory-based experiments.
The increase in internal resistance is an important indicator of battery SOH and can severely affect battery performance. The ohmic resistance can be regarded as the bulk internal resistance, and proves to be more easily obtained than battery capacity in real-world operating EVs. Thus, this study selects the ohmic resistance as indictor for battery SOH estimation. Intuitively, ECMs can be directly employed for battery SOH estimation through parameter identification of the series resistance. However, the parameter identification of ECM needs accurate metering of the open circuit voltage (OCV), which is strongly related to the remaining battery capacity [33]. The acquisition of battery OCV requires a long period of static standing for terminal voltage stabilization, which is unrealistic during practical vehicular operation. Moreover, the accuracy of parameter identification is strongly influenced by the noises of voltage and current sensors [34]. In contrast, the data-driven methods can be effectively utilized to dig out the implicit relationship between the ohmic resistance and the collected datasets. Therefore, this study proposed a novel ohmic resistance estimation scheme by combining an electrical and a data-driven model for accurate SOH estimation. Firstly, the Thevenin model of batteries is established, and the ohmic resistance is identified by the dynamic OCV–RLS method without knowing the OCV of the battery. Then, the correlation analysis method is used to select the critical factor that has significant influence on the ohmic resistance, and the boxplot analysis method is further leveraged to filter out outliers. The selected critical factor and the battery aging parameter are used as the input datasets of the XGBoost model to establish the ohmic resistance estimation model. Finally, the accuracy and robustness of the ohmic resistance estimation model are verified using real-world operating datasets of EVs collected from the National Big Data Platform for New Energy Vehicles in China.
This paper is organized as follows: The platform and data collection are introduced in Section 2. Section 3 details the proposed method for the ohmic resistance estimation. Section 4 describes the influencing factor and aging analysis. Section 5 discusses the battery ohmic resistance estimation results, with the key conclusions summarized in Section 6.
2. Platform Introduction and Data Collection
The used datasets for model training were collected from the National Big Data Platform for New Energy Vehicles in China. The datasets contain the information of battery systems, motor drive systems, and vehicle control systems, such as battery voltage and temperature, motor speed and torque, and vehicle position, etc. The format of the collection data used in this study is shown in Table 1 for demonstration.
In order to satisfy the data requirements for analyzing battery degradation, electric passenger vehicles in Beijing were selected as the research objects, whose total driving distances exceed 100,000 km and service time is more than one year.
An EV that meets the above conditions was used in this study. The battery pack of this vehicle consisted of 96 series-connected LiNixCoyMnzO2 (NCM) lithium-ion battery cells. The nominal energy of battery pack is 26 kWh, and the official driving range is 180 km. The detailed data of this vehicle is shown in Table 2.
The voltage, current and temperature of the partial data are shown in Figure 1a. Figure 1b shows the voltage, current and temperature data of EVs during driving. It can be seen that the correlation between voltage and current is strong and the voltage changes with the varying current. Moreover, the current changes frequently and sharply, which is different from that under experimental conditions. The temperature also gradually increases with battery discharging.
3. The Ohmic Resistance Estimation Method for Lithium-Ion Batteries
A method combining an electrical and a data-driven model is proposed to estimate the ohmic resistances of batteries. The flowchart of the proposed method is given in Figure 2. First, the operating data of EVs was extracted from the big-data platform. The raw data were divided into charging segments and driving segments according to states of EVs. Then, the Thevenin model and dynamic OCV-RLS method were used to identify the ohmic resistance. The correlation analysis was further used to extract features and the multiple boxplot analysis method was used to filter out the outliers. Finally, temperature and driving distance were used as input datasets to establish the ohmic resistance estimation model based on the XGBoost algorithm, and two error analysis methods were used to verify the reliability and accuracy of the proposed model.
3.1. Parameter Identification Based on the Dynamic OCV–RLS
The Thevenin model is widely used in simulating battery dynamics due to its simplicity and efficiency. It consists of an ideal voltage source, a series resistor and a set of Resistance–Capacitance (RC) networks, as shown in Figure 3. In this model, U represents the battery terminal voltage, I represents the total current of the circuit, Uocv represents the battery OCV that has a non-linear relationship with the state-of-charge (SOC), R0 is the battery ohmic resistance and is an indicator of battery SOH, Rp represents the polarization resistance and Cp represents the polarization capacitance. R0 is a reflection of the instantaneous voltage drop during battery charging and discharging. The RC network is approximately equal to a nonlinear transient response and can simulate complex reactions inside the battery.
According to the Thevenin model, the terminal voltage U at the kth sampling time can be described as follows:
where .
Since the sampling period is limited, it is assumed that SOC(k) ≈ SOC(k − 1) and UOCV(k) ≈ UOCV(k − 1), and Equation (1) can be reformulated as
where , , , , and T is the sampling period.
According to k1, k2, k3, and k4, the parameters of the equivalent circuit model can be obtained by
In this study, is defined as the estimated output and as the estimated parameter vector. Their relationship can be expressed as
Thus, the battery model can be obtained as
where xk is the input vector, Hk is the parameter vector, and yk is the system output.
The RLS method is widely used to estimate system parameters thanks to its simple procedure and rapid convergence. In this study, the RLS is used to identify the parameters of the Thevenin model. However, due to the influence of polarization phenomenon, the acquisition of battery OCV is difficult during vehicular operation. Therefore, a dynamic OCV method is proposed in combination of the RLS for parameter identification, which does not need to collect the battery OCV.
Since the vehicle battery would usually be left standing for a long time between two trips, the terminal voltage at the beginning of the next trip can be considered as the OCV, which is UOCV(0) ≈ U(0). In order to avoid the influence of battery polarization on OCV and ensure enough relaxed time of the battery, the time interval between two trips is not less than 3 h. And can be described as
Suppose , and an estimated can be derived as
can be used as the next iteration OCV input UOCV(k + 1) and the parameter xk + 1 at the k + 1th sampling time can be calculated according to the space state equation of the RLS. The parameter identification flowchart based on the dynamic OCV–RLS method is shown in Figure 4.
The accuracy of the parameter identification model is verified based on the vehicle data in Section 2, and the test results are shown in Figure 5a. All curves show small fluctuations during the iterations. After 200 iterations, all curves tend to converge and all parameters k can be obtained. The parameter identification results of R0 is shown in Figure 5b. It can be seen that with the discharge of the battery, the ohmic resistance is stable, indicating the parameter identification method is reliable.
However, a 10 s sampling time is so high that it does not capture some of the battery dynamics, i.e., current peaks during the vehicle city driving with frequent start–stop intervals. In order to avoid the sampling time affecting the accuracy of resistance estimation, the EV data of 1 s and 10 s sampling times were tested by the Dynamic OCV–RLS method, respectively, in our previous work. Figure 6 shows the comparison of ohmic resistance estimation results in different sampling time. The test results show that the ohmic resistance estimation difference between the two different sampling times is 0.185 mΩ (0.484%) at the end of the curve in Figure 6b, indicating that a 10 s sampling time has little effect on the estimation accuracy of ohmic resistances.
The comparison of the real voltage and the estimation voltage is shown in Figure 7. It can be seen that the real voltage curve is very close to their estimation, and the relative errors are all below 1%, and the maximum relative error is 0.908% at the 195th iteration. The results show that the established ECM and the dynamic OCV–RLS method can simulate the characteristics of the EV battery very well.
3.2. Abnormal Ohmic Resistances Filtering Based on the Boxplot Analysis
Since the working conditions of the sensors affect the accuracy and reality of collected data, some ohmic resistances obtained by the parameter identification method would deviate from the average. Common methods for filtering out the outliers mainly include the Pauta criterion (3σ) and boxplot analysis. The Pauta criterion requires that the data is a random variable and conforms to a normal distribution. However, the identification of the ohmic resistance is mainly affected by noise without regularity. Moreover, the boxplot analysis does not need to make any parameterization hypothesis about the distribution of data and is not affected by the outliers, so it is robust and can be used as a fast and automatic outlier detection tool.
The boxplot analysis method is used to filter out the ohmic resistances identified by the dynamic OCV–RLS method described in Section 3.1. The boundary of the boxplot outlier is defined as
where IQR is the interquartile range of the sample, Q3 is the upper quartile of the sample, Q1 is the lower quartile of the sample, lu is the upper limit of the boxplot, and ll is the lower limit of the boxplot.
Through multiple boxplot analysis until the sample size is unchanged, the outliers have been completely filtered out. The multiple boxplot analysis method does not require artificially setting the thresholds to judge the outliers, so it is an automatic method for outlier filtering.
3.3. The Battery Ohmic Resistance Estimation Model Based on the XGBoost
The XGBoost (extreme gradient boosting) is a tree ensemble learning model that adds regularization to the loss function for controlling the complexity of the model, so that the model is simple and is not easy for over-fitting. Moreover, data does not need to be normalized and standardized for this model, which has a non-normal distribution and is in a particular range. The predicted result of XGBoost is described as
where t is the number of trees, is the predicted result of the t-th tree to the sample xi, f is a regression tree function in the functional space , and is a set of all possible classification and regression trees (CARTs). The regression tree function is defined as
where w is the vector of scores on leaves, q is a function assigning each data point to the corresponding leaf, T is the number of leaves, and d is the number of features.
In each iteration calculation, the objective function of XGBoost includes two parts, i.e., the loss function and the regularization. The objective function to be optimized is expressed as
where γ and λ are punishments, respectively.
We define the and , and Equation (20) can be written as follows:
where and .
For a given structure q(x), the optimal solution can be obtained by deriving , which is denoted by
In this paper, the input variables of the ohmic resistance estimation model based on XGBoost is defined as X = [x1, x2,…, xn], where xi is the 2-dimensional vector, including end driving distance and average temperature of one driving segment, and n is the total number of driving segments. The output datasets are average ohmic resistances of EV batteries obtained by the dynamic OCV–RLS method and boxplot analysis. Through the XGBoost method, the ohmic resistances of EV batteries can be estimated offline, and the problem that EV batteries in use cannot be tested is solved.
4. Analysis of Battery Ohmic Resistances
In this section, the influence factors and the aging of ohmic resistances are analyzed based on ohmic resistances and feature variables from previous driving segments.
4.1. Analysis of Factors Affecting Ohmic Resistances
Because battery performance parameters change with the complicated operating conditions of EVs, so correlation analysis methods are used to extract the feature variables which affect ohmic resistances as the high-quality input datasets. Moreover, the Spearman correlation coefficient is used to calculate the correlation of different feature variables. The formula of Spearman’s correlation coefficient is defined as follows:
where n is sample size, and it is the number of driving segments for the EV, the xi is the ith value of the sample, is the sample mean. In this study, the x and y are the feature variables and battery ohmic resistance, respectively.
According to previous studies, the factors affecting battery performance include discharge rate, depth of discharge (DOD), and temperature [10]. The voltage difference and the battery usage time are added in this study. The voltage difference represents the voltage change of the EV battery during one trip, i.e., the difference of voltage between the start of driving and the end of driving. The usage time represents the usage time of the EV battery for one trip. Based on the Spearman correlation analysis method, the results of correlation coefficient between the five feature variables and ohmic resistances are listed in Table 3.
Table 3 shows that, among the five feature variables, temperature is the strongest correlational feature variable, and the remaining are voltage difference, average current, DOD, and usage time. And statistical significance between ohmic resistance and five feature variables was also calculated. The statistical significance between ohmic resistance and temperature is 0, indicating that these two variables are significantly correlated. Therefore, the effect of temperature on ohmic resistances is analyzed.
The relationship between temperature and ohmic resistances shows an exponential function form in Figure 8 and the ohmic resistance increases as the temperature decreases. Reference [35] describes the internal mechanism of batteries and how temperature affects ohmic resistances, and the relationship between ohmic resistances and temperature in this study is verified.
However, there are many outliers marked as black circles away from the normal ohmic resistance range at different temperatures in Figure 8. We analyze that the complex operating conditions may affect the acquisition accuracy of sensors, resulting in the poor quality of the collected data. Therefore, the ohmic resistances obtained by direct parameter identification method are not stable and reliable.
In order to guarantee the reality of ohmic resistances for the battery aging analysis, the outliers need to be filtered. According to the filtering method described in Section 3.2, the ohmic resistances at different temperatures are filtered multiple times until the dataset size no longer changes, indicating that all the outliers have been removed, and the filtered results are shown in Figure 8 with blue points.
We assume that the data conforms to the exponential function relationship is expressed as
where a, b, and c are positive numbers, which used to fit the function of temperature and ohmic resistance, T is the temperature of battery for one driving, °C, R is the ohmic resistance at the temperature T, mΩ.
R = ae-bT + c,
So the fit curve with red color is shown in Figure 8 and described as
R = 90.196e−0.080T + 25.166.
4.2. Aging Analysis of Ohmic Resistances
In previous studies, battery aging experiments use the given experimental conditions, such as the given SOC interval and given charging rate, so the number of cycles can be regarded as the indicator to characterize battery aging, which is the representation for the total discharge capacity of batteries. However, during the operation of EVs, the SOC usage ranges of EV batteries are mutative due to the drivers’ use requirements, so the cycle number cannot be used as the indicator of battery aging. The driving distance of EVs is a suitable representation for the total discharge capacity of EV batteries, so it can be used to evaluate battery aging. Figure 9 shows the relationship between ohmic resistances and driving distance. It can be found that ohmic resistances change periodically due to the seasonality of temperature. Therefore, in order to isolate the influence of temperature, the relationships between ohmic resistances and driving distance at three temperatures are analyzed.
The green, red, and blue points in Figure 9 are ohmic resistances in 25 °C, 40 °C, and 10 °C, respectively. Linear regression is used to describe the rate of change for ohmic resistances with driving distance at three temperatures in Figure 9 as follows:
where y1, y2 and y3 are the estimation ohmic resistances by the linear regression method at three temperatures, respectively, mΩ, and x is the driving distance, km.
y1 = 7.113 × 10⁻⁵·x + 63.221,
y2 = 6.373 × 10⁻⁵·x + 31.232,
y3 = 4.091 × 10⁻⁵·x + 22.955,
The results show that ohmic resistances for the EV battery at three temperatures gradually increase with the driving distance in Figure 9. The average growth rate of ohmic resistances at three temperatures are about 7.113 (mΩ/100,000 km), 6.373 (mΩ/100,000 km), and 4.091 (mΩ/100,000 km), respectively. It can be seen that the effect of aging on ohmic resistances is much smaller than the effect of temperature and the effect of aging on ohmic resistances increases as the temperature decreases. So the estimation model of ohmic resistances is trained by taking temperature and driving distance as inputs, and ohmic resistances as output.
5. Result and Discussion
In this section, the short-term and long-term estimation results for battery ohmic resistances are analyzed. As described in Section 3.3, driving distance and average temperature of driving segments are the input datasets of the XGBoost model, and average ohmic resistances obtained by the dynamic OCV–RLS method and boxplot analysis are output datasets. The datasets are divided into training sets and test sets to verify the accuracy and efficiency of the proposed method. And since the aging datasets of batteries have the characteristic of time series, the first 80% (about 70,000 km data) of the datasets are used as the training set to build the estimation model, and the remaining 20% (about 17,000 km data) of the datasets are utilized as the test set to verify the accuracy and stability of the model.
In order to obtain the XGBoost model that performs well on the test set, it is necessary to set the depth and number of trees reasonably. Different depths and number of trees are set to test the estimation accuracy of the model as shown in Figure 10. In this study, the parameters of the XGBoost model are selected through comparing with the results of different parameters and the depth and number of trees are set as 3 and 80, respectively. Based on the ohmic resistance estimation model, the 3D surface is fitted to show the trend of ohmic resistances with temperature and driving distance in Figure 11.
The first 1000 km of test data, which is close to the time of training datasets, was used to verify the accuracy of short-term ohmic resistance estimation, and the last 1000 km of test data, which is far from to the time of training datasets, was used to verify the robustness and effectiveness of long-term ohmic resistance estimation. The short-term estimation results for the battery ohmic resistances are shown in Figure 12. It can be seen that all relative errors are low and well below 7%. The result shows that the proposed model is highly accurate for short-term battery ohmic resistance estimation.
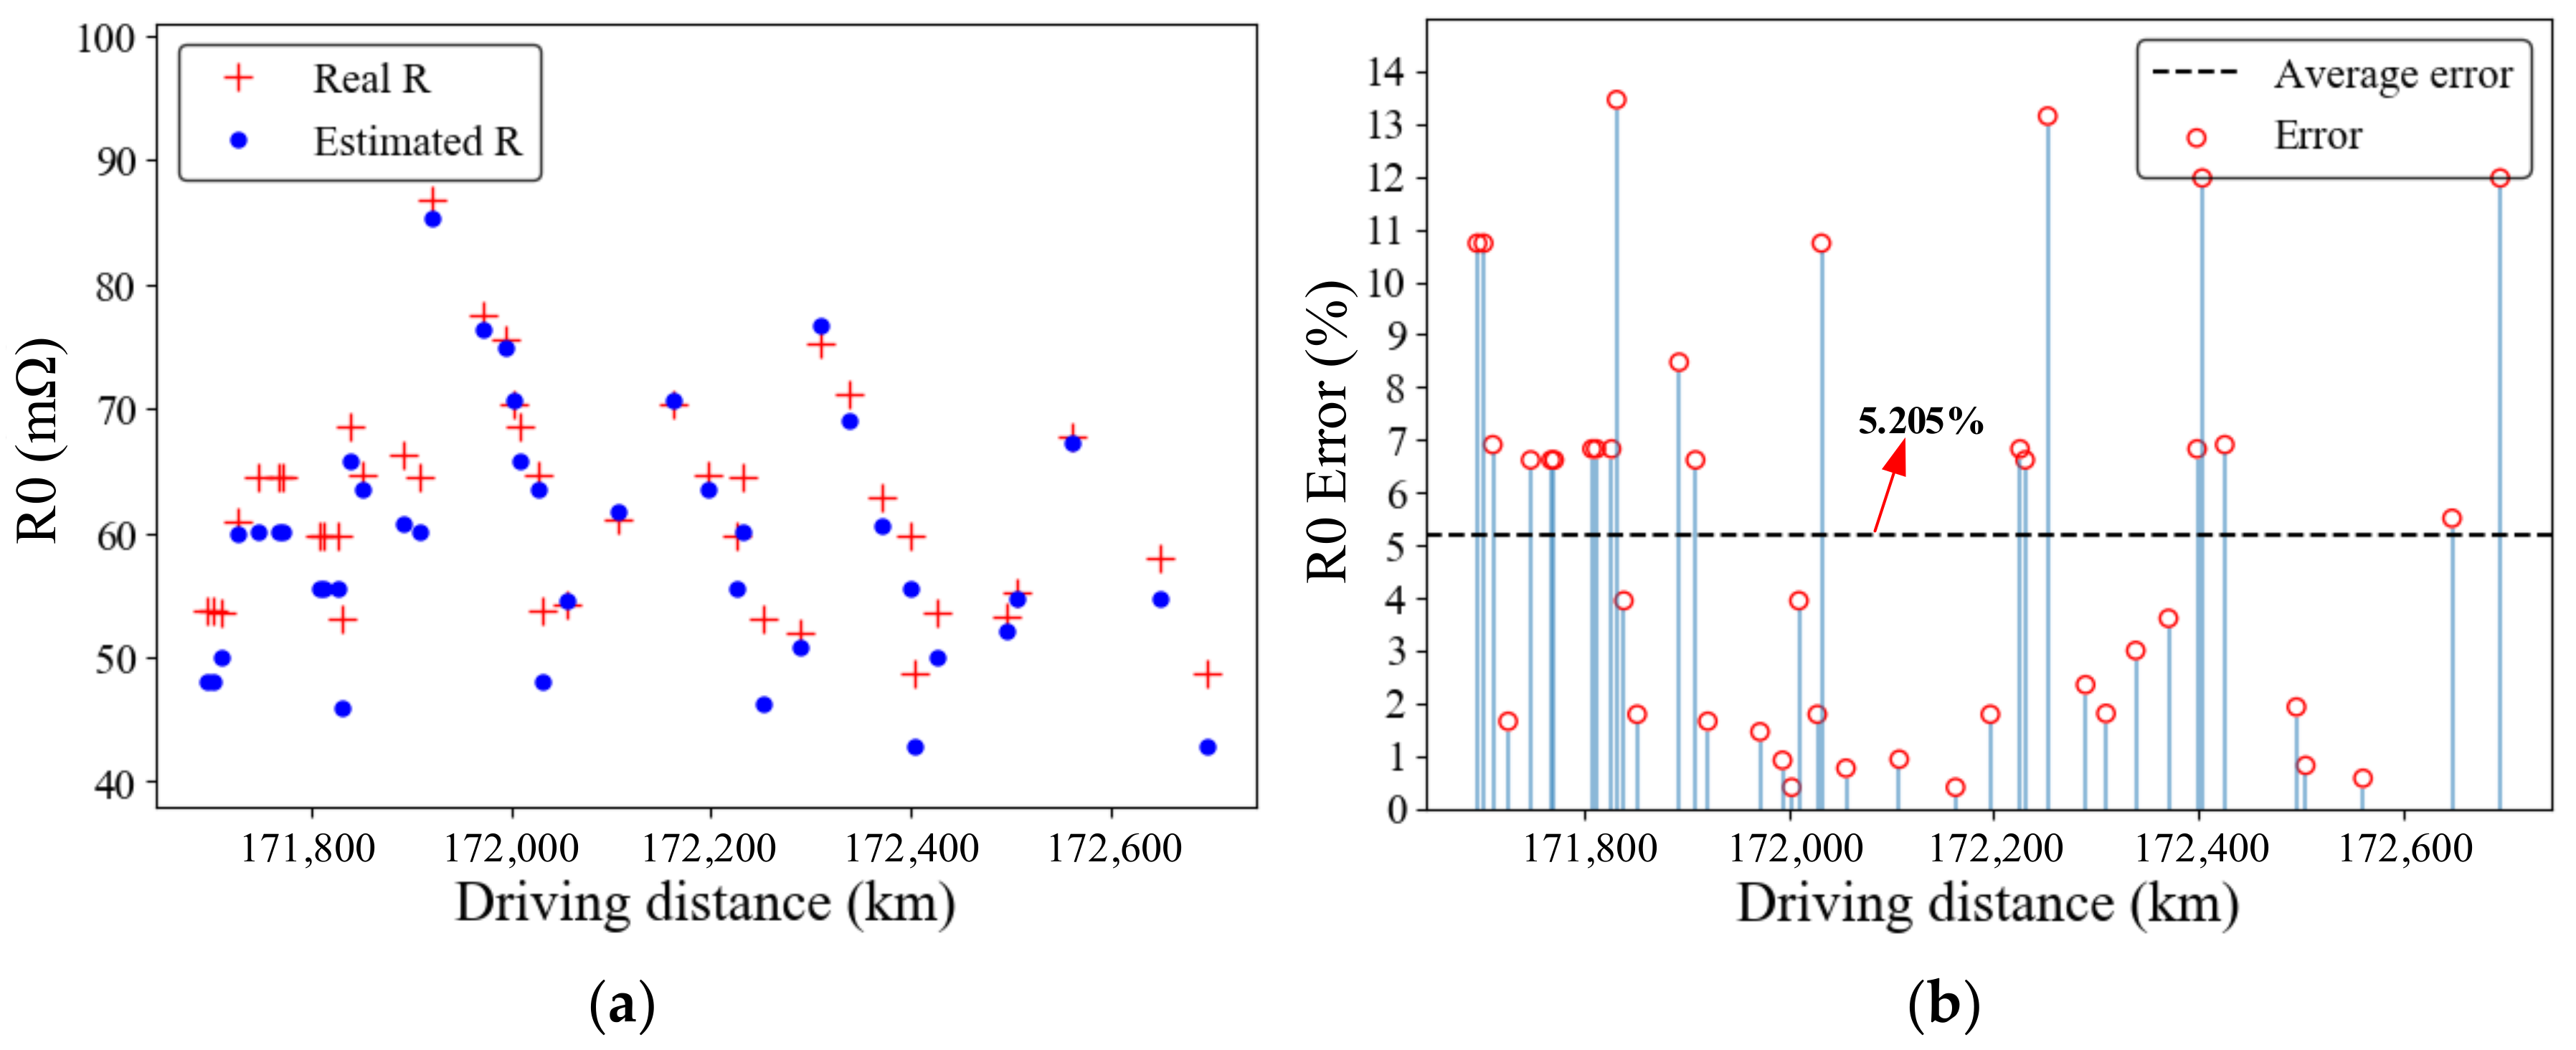
Figure 13 shows the long-term estimation results for battery ohmic resistances. It can be seen that all relative errors are low and well below 14%. The result shows that the proposed model is also highly accurate for long-term battery ohmic resistance estimation.
The root mean square error (RMSE) and the mean absolute percentage error (MAPE) are used to make a quantitative evaluation of the proposed model, which can be defined as
where and are the kth real ohmic resistance and estimated ohmic resistance, and n is the test sample size.
Table 4 shows that the RMSE and MAPE are relatively low, despite that they are more significant in the long-term estimation than in the short-term estimation, thus verifying the accuracy and robustness of the proposed model.
6. Conclusions
Accurate battery system SOH estimation is crucial to guarantee the safe and reliable operation of EVs. In this study, the ohmic resistance is used as a battery SOH indicator, which is estimated by combining the ECM and data-driven model. The ohmic resistance estimation model is based on the dynamic OCV–RLS and XGBoost algorithm. The tested datasets of different steps extracted from the National Big Data Platform for New Energy Vehicles in China are used to verify the estimation performance. The results show that the short-term ohmic resistance estimation is accurate and reliable, and the relative errors are less than 7%. In order to verify the robustness of the proposed method, the results of long-term ohmic resistance estimation are also obtained. Compared with the results of the short-term estimation, the results of long-term estimation still show a stable performance and the relative errors are less than 14%. The RMSEs are less than 4 mΩ and the MAPEs are less than 6%. In practical applications, based on the historical operation data of EVs, the ohmic resistance estimation model can be embedded into a realistic BMS to monitor battery SOH for different EV batteries.
Author Contributions
Conceptualization, Z.Z.; methodology, K.L.; formal analysis, P.L.; writing, K.L.; supervision, Z.Z., P.L., Z.W. and S.J.
Funding
This research was partly funded by the National Key Research and Development Program of China under grant number 2018YFB0105700 and by the National Natural Science Foundation of China under grant numbers 61703042 and U1764258.
Conflicts of Interest
The authors declare no conflict of interest.
Abbreviations
| SOH | State of health |
| EV | Electric vehicle |
| RLS | Recursive Least Squares |
| OCV | Open circuit voltage |
| ECM | Equivalent circuit model |
| SEI | Solid electrolyte interface |
| BMS | Battery management system |
| EKF | Extended Kalman Filter |
| PF | Particle Filter |
| ICA | Incremental capacity analysis |
| CC | Constant current |
| GPR | Gaussian process regression |
| RVM | Relevance vector machine |
| NCM | LiNixCoyMnzO2 |
| SOC | State of charge |
| DOD | Depth of discharge |
| RMSE | Root mean square error |
| MAPE | Mean absolute percentage error |
| U | Battery terminal voltage |
| Uocv | Battery OCV |
| R0 | Battery ohmic resistance |
| Rp | Battery polarization resistance |
| Cp | Battery polarization capacitance |
| I | Total current of the circuit |
| SOC | State of charge |
| T | Sampling period, 10 s |
| τ | Time constant, RpCp |
| Variable | Unit |
| U | V |
| Uocv | V |
| Cp | F |
| R0 | Ω |
| Rp | Ω |
| I | A |
| SOC | 1 |
References
- Zhang, L.; Hu, X.; Wang, Z.; Sun, F.; Deng, J.; Dorrell, D.D. Multi-objective optimal sizing of hybrid energy storage system for electric vehicles. IEEE Trans. Veh. Technol. 2018, 67, 1027–1035. [Google Scholar] [CrossRef]
- Du, J.; Ouyang, D. Progress of Chinese electric vehicles industrialization in 2015: A review. Appl. Energy 2017, 188, 529–546. [Google Scholar] [CrossRef]
- Du, J.; Ouyang, M.; Chen, J. Prospects for Chinese electric vehicle technologies in 2016–2020: Ambition and rationality. Energy 2017, 120, 584–596. [Google Scholar] [CrossRef]
- Huang, L.; Zhang, Z.; Wang, Z.; Zhang, L.; Zhu, X.; Dorrell, D.D. Thermal runaway behavior during overcharge for large-format Lithium-ion batteries with different packaging patterns. J. Energy Storage 2019, 378, 383–403. [Google Scholar] [CrossRef]
- Han, X.; Lu, L.; Zheng, Y.; Feng, X.; Li, Z.; Li, J.; Ouyang, M. A review on the key issues of the lithium ion battery degradation among the whole life cycle. eTransportation 2019, 1, 100005. [Google Scholar] [CrossRef]
- Li, X.; Wang, Z.; Zhang, L. Co-estimation of capacity and state-of-charge for lithium-ion batteries in electric vehicles. Energy 2019, 174, 33–44. [Google Scholar] [CrossRef]
- Cabrera-Castillo, E.; Niedermeier, F.; Jossen, A. Calculation of the state of safety (SOS) for lithium ion batteries. J. Power Sources 2016, 324, 509–520. [Google Scholar] [CrossRef] [Green Version]
- Hong, J.; Wang, Z.; Yao, Y. Fault prognosis of battery system based on accurate voltage abnormity prognosis using long short-term memory neural networks. Appl. Energy 2019, 251, 113381. [Google Scholar] [CrossRef]
- Hong, J.; Wang, Z.; Chen, W.; Yao, Y. Synchronous multi-parameter prediction of battery systems on electric vehicles using long short-term memory networks. Appl. Energy 2019, 254, 113648. [Google Scholar] [CrossRef]
- Ouyang, M.; Feng, X.; Han, X.; Lu, L.; Li, Z.; He, X. A dynamic capacity degradation model and its applications considering varying load for a large format Li-ion battery. Appl. Energy 2016, 165, 48–59. [Google Scholar] [CrossRef] [Green Version]
- Rezvanizaniani, S.; Liu, Z.; Chen, Y.; Lee, J. Review and recent advances in battery health monitoring and prognostics technologies for electric vehicle (EV) safety and mobility. J. Power Sources 2014, 256, 110–124. [Google Scholar] [CrossRef]
- She, C.; Wang, Z.; Sun, F.; Liu, P.; Zhang, L. Battery aging assessment for real-world electric buses based on incremental capacity analysis and radial basis function neural network. IEEE Trans. Ind. Informat. 2019. [Google Scholar] [CrossRef]
- Xiong, R.; Li, L.; Tian, J. Towards a smarter battery management system: A critical review on battery state of health monitoring methods. J. Power Sources 2018, 405, 18–29. [Google Scholar] [CrossRef]
- Li, J.; Adewuyi, K.; Lotfi, N.; Landers, R.G.; Park, J. A single particle model with chemical/mechanical degradation physics for lithium ion battery State of Health (SOH) estimation. Appl. Energy 2018, 212, 1178–1190. [Google Scholar] [CrossRef]
- Jiang, J.; Lin, Z.; Ju, Q.; Ma, Z.; Zheng, C.; Wang, Z. Electrochemical impedance spectra for lithium-ion battery ageing considering the rate of discharge ability. Energy Procedia 2017, 105, 844–849. [Google Scholar] [CrossRef]
- Lyu, C.; Song, Y.; Zheng, J.; Luo, W.; Hinds, G.; Li, J.; Wang, L. In situ monitoring of lithium-ion battery degradation using an electrochemical model. Appl. Energy 2019, 250, 685–696. [Google Scholar] [CrossRef]
- Xiong, R.; Li, L.; Li, Z.; Yu, Q.; Mu, H. An electrochemical model based degradation state identification method of Lithium-ion battery for all-climate electric vehicles application. Appl. Energy 2018, 219, 264–275. [Google Scholar] [CrossRef]
- Feng, T.; Yang, L.; Zhao, X.; Zhang, H.; Qiang, J. Online identification of lithium-ion battery parameters based on an improved equivalent-circuit model and its implementation on battery state-of-power prediction. J. Power Sources 2015, 281, 192–203. [Google Scholar] [CrossRef]
- Hu, X.; Li, S.; Peng, H. A comparative study of equivalent circuit models for Li-ion batteries. J. Power Sources 2012, 198, 359–367. [Google Scholar] [CrossRef]
- Ma, Z.; Yang, R.; Wang, Z. A novel data-model fusion state-of-health estimation approach for lithium-ion batteries. Appl. Energy 2019, 237, 836–847. [Google Scholar] [CrossRef]
- Yang, D.; Wang, Y.; Pan, R.; Chen, R.; Chen, Z. State-of-health estimation for the lithium-ion battery based on support vector regression. Appl. Energy 2018, 227, 273–283. [Google Scholar] [CrossRef]
- Song, Z.; Hofmann, H.; Lin, X.; Han, X.; Hou, J. Parameter identification of lithium-ion battery pack for different applications based on Cramer-Rao bound analysis and experimental study. Appl. Energy 2018, 231, 1307–1318. [Google Scholar] [CrossRef]
- Zhang, X.; Wang, Y.; Liu, C.; Chen, Z. A novel approach of battery pack state of health estimation using artificial intelligence optimization algorithm. J. Power Sources 2018, 376, 191–199. [Google Scholar] [CrossRef]
- Li, Y.; Zhong, S.; Zhong, Q.; Shi, K. Lithium-Ion Battery State of Health Monitoring Based on Ensemble Learning. IEEE Access 2019, 7, 8754–8762. [Google Scholar] [CrossRef]
- Severson, K.A.; Attia, P.M.; Jin, N.; Perkins, N.; Jiang, B.; Yang, Z.; Chen, M.H.; Aykol, M.; Herring, P.K.; Fraggedakis, D.; et al. Data-driven prediction of battery cycle life before capacity degradation. Nat. Energy 2019, 4, 383–391. [Google Scholar] [CrossRef] [Green Version]
- Li, Y.; Liu, K.; Foley, A.M.; Zülke, A.; Berecibar, M.; Nanini-Maury, E.; Van Mierlo, J.; Hoster, H.E. Data-driven health estimation and lifetime prediction of lithium-ion batteries: A review. Renew. Sustain. Energy Rev. 2019, 113, 109254. [Google Scholar] [CrossRef]
- Li, X.; Yuan, C.; Li, X.; Wang, Z. State of health estimation for Li-Ion battery using incremental capacity analysis and Gaussian process regression. Energy 2019. [Google Scholar] [CrossRef]
- Guo, P.; Cheng, Z.; Yang, L. A data-driven remaining capacity estimation approach for lithium-ion batteries based on charging health feature extraction. J. Power Sources 2019, 412, 442–450. [Google Scholar] [CrossRef]
- Yang, D.; Wang, Y.; Pan, R.; Chen, R.; Chen, Z. A Neural Network Based State-of-Health Estimation of Lithium-ion Battery in Electric Vehicles. Energy Procedia 2017, 105, 2059–2064. [Google Scholar] [CrossRef]
- You, G.; Park, S.; Oh, D. Real-time state-of-health estimation for electric vehicle batteries: A data-driven approach. Appl. Energy 2016, 176, 92–103. [Google Scholar] [CrossRef]
- Tang, X.; Zou, C.; Yao, K.; Chen, G.; Liu, B.; He, Z.; Gao, F. A fast estimation algorithm for lithium-ion battery state of health. J. Power Sources 2018, 396, 453–458. [Google Scholar] [CrossRef]
- Weng, C.; Feng, X.; Sun, J.; Peng, H. State-of-health monitoring of lithium-ion battery modules and packs via incremental capacity peak tracking. Appl. Energy 2016, 180, 360–368. [Google Scholar] [CrossRef] [Green Version]
- Yang, D.; Zhang, X.; Pan, R.; Wang, Y.; Chen, Z. A novel Gaussian process regression model for state-of-health estimation of lithium-ion battery using charging curve. J. Power Sources 2018, 384, 387–395. [Google Scholar] [CrossRef]
- Chiang, Y.; Sean, W.; Ke, J. Online estimation of internal resistance and open-circuit voltage of lithium-ion batteries in electric vehicles. J. Power Sources 2011, 196, 3921–3932. [Google Scholar] [CrossRef]
- Remmlinger, J.; Buchholz, M.; Meiler, M.; Bernreuter, P.; Dietmayer, K. State-of-health monitoring of lithium-ion batteries in electric vehicles by on-board internal resistance estimation. J. Power Sources 2011, 196, 5357–5363. [Google Scholar] [CrossRef]
Figure 1.
The partial data of the EV. (a) The voltage, current and temperature data of the EV; and (b) the voltage, current and temperature data of the EV during driving.
Figure 1.
The partial data of the EV. (a) The voltage, current and temperature data of the EV; and (b) the voltage, current and temperature data of the EV during driving.
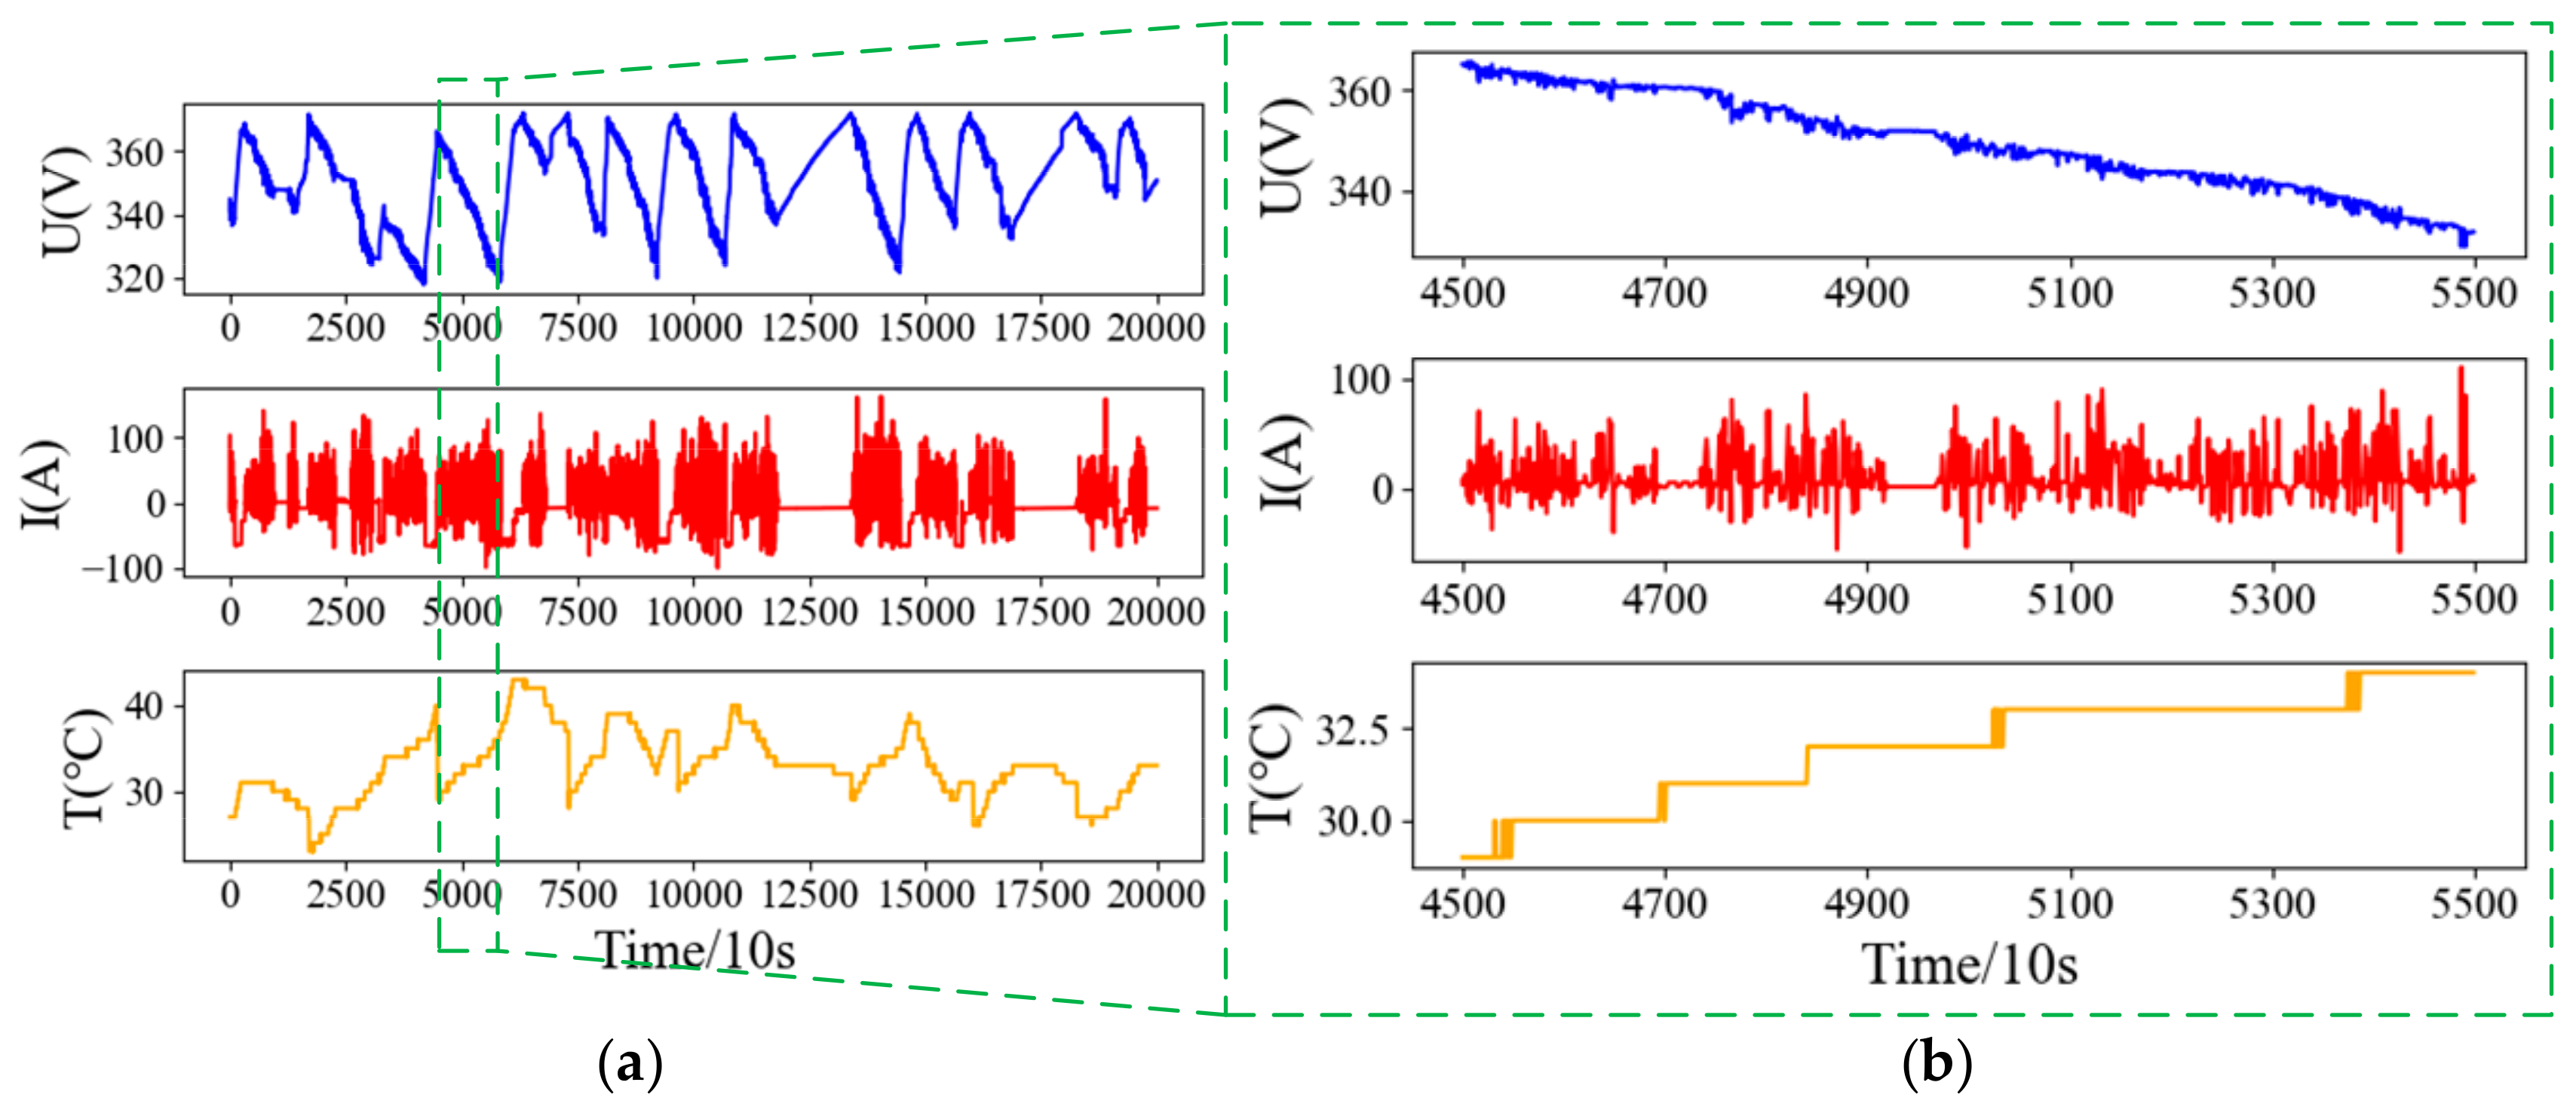
Figure 2.
The flowchart of ohmic resistance estimation.
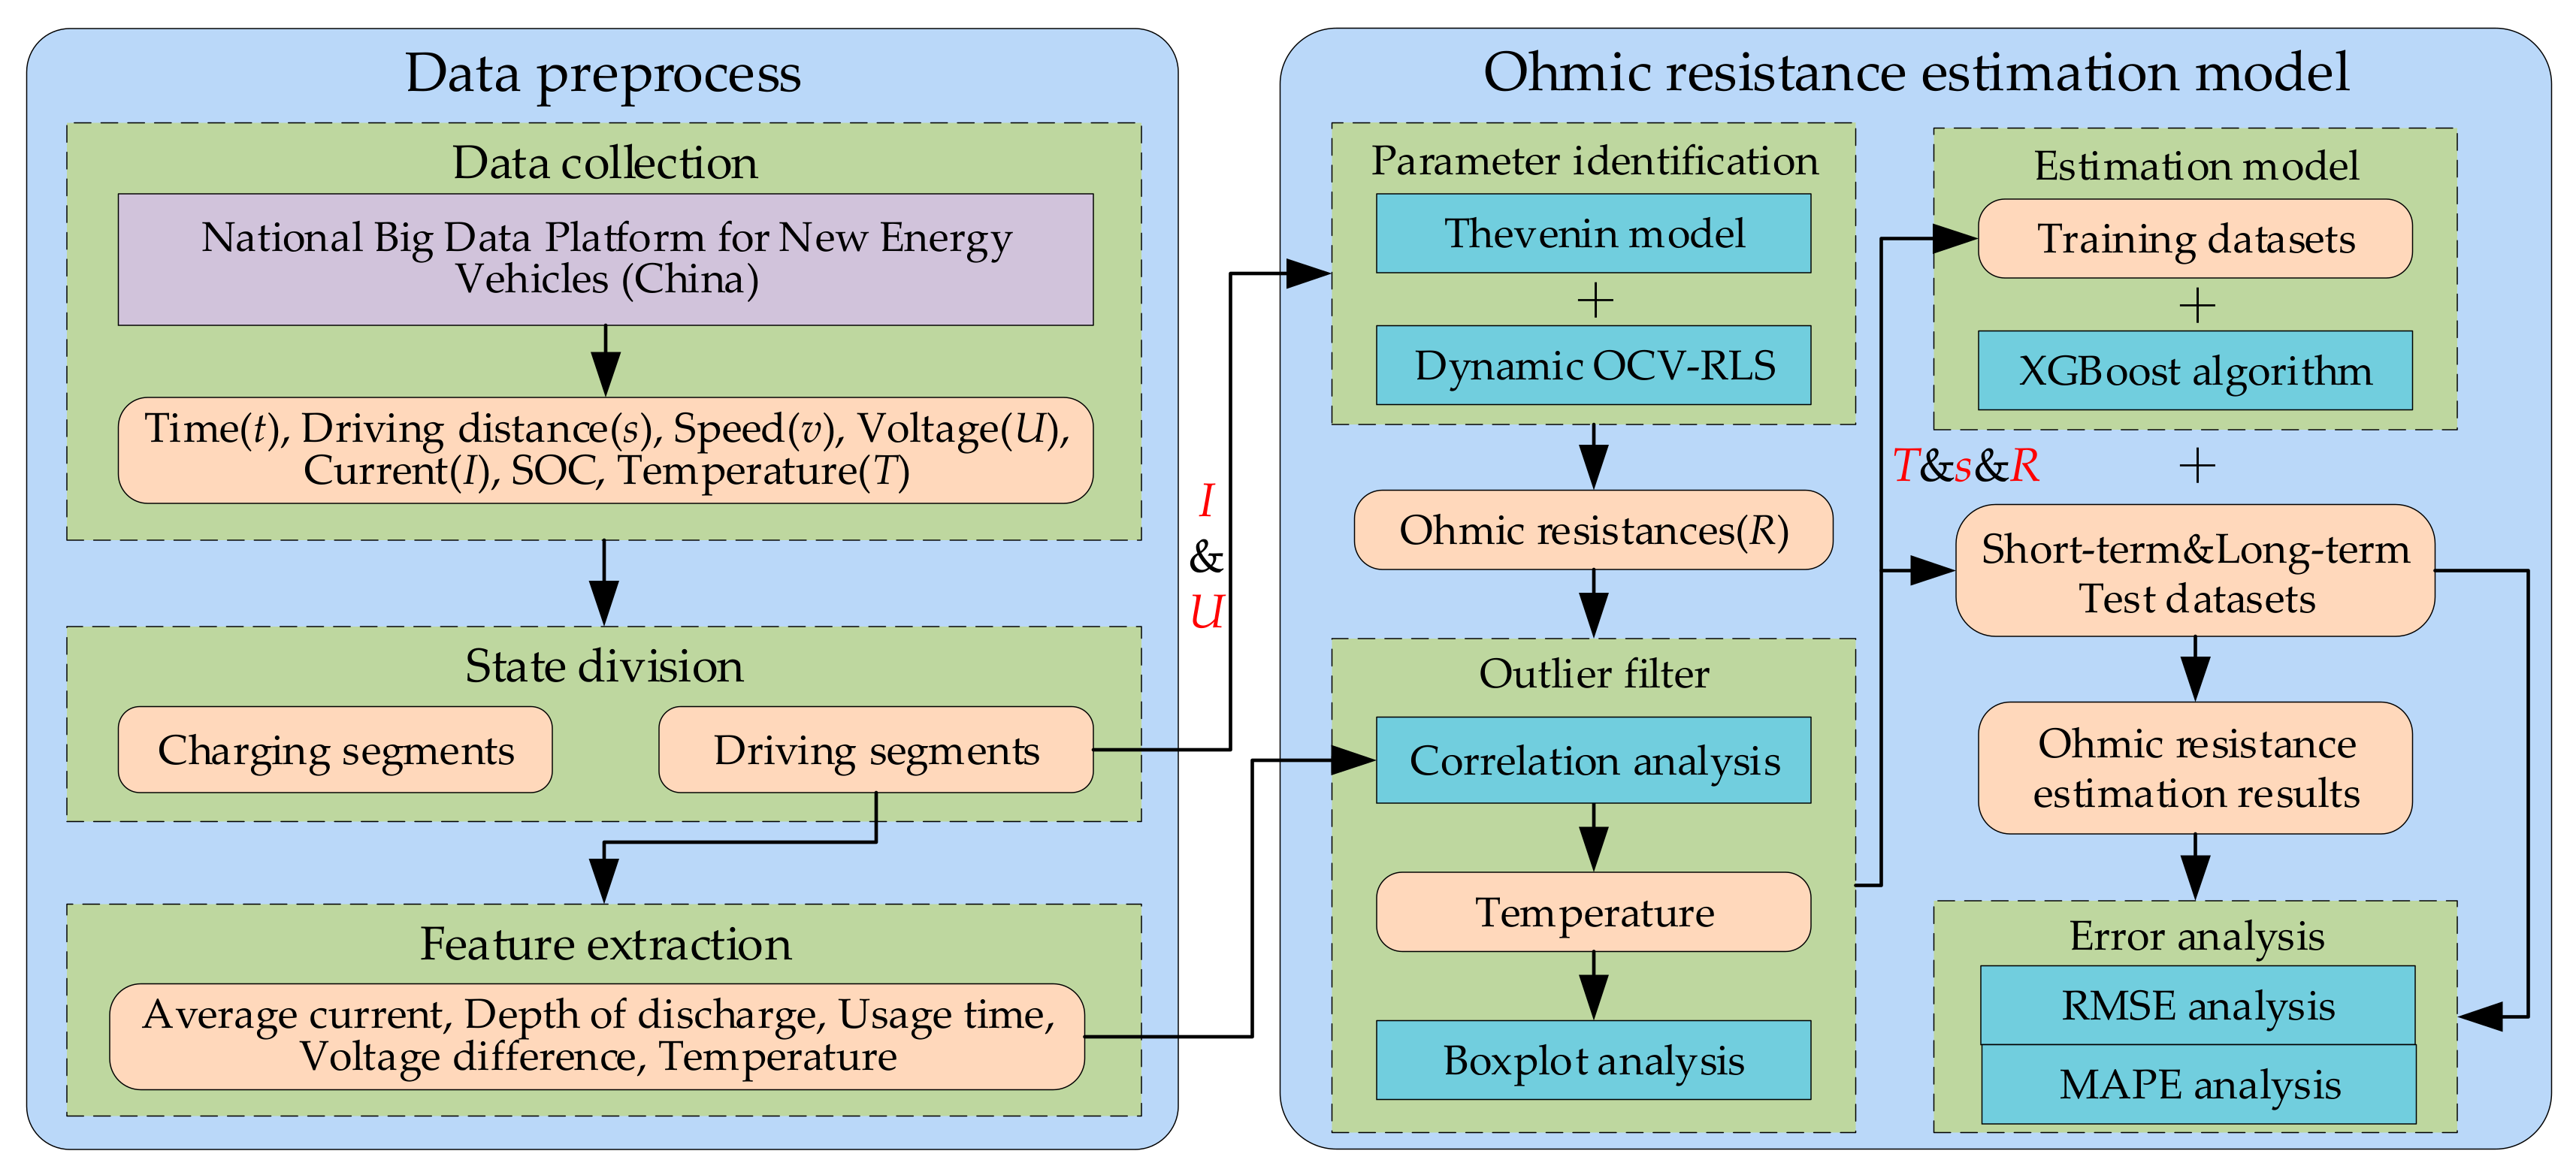
Figure 3.
Thevenin model of the EV battery.

Figure 4.
Flowchart of the parameter identification based on dynamic OCV–RLS method.
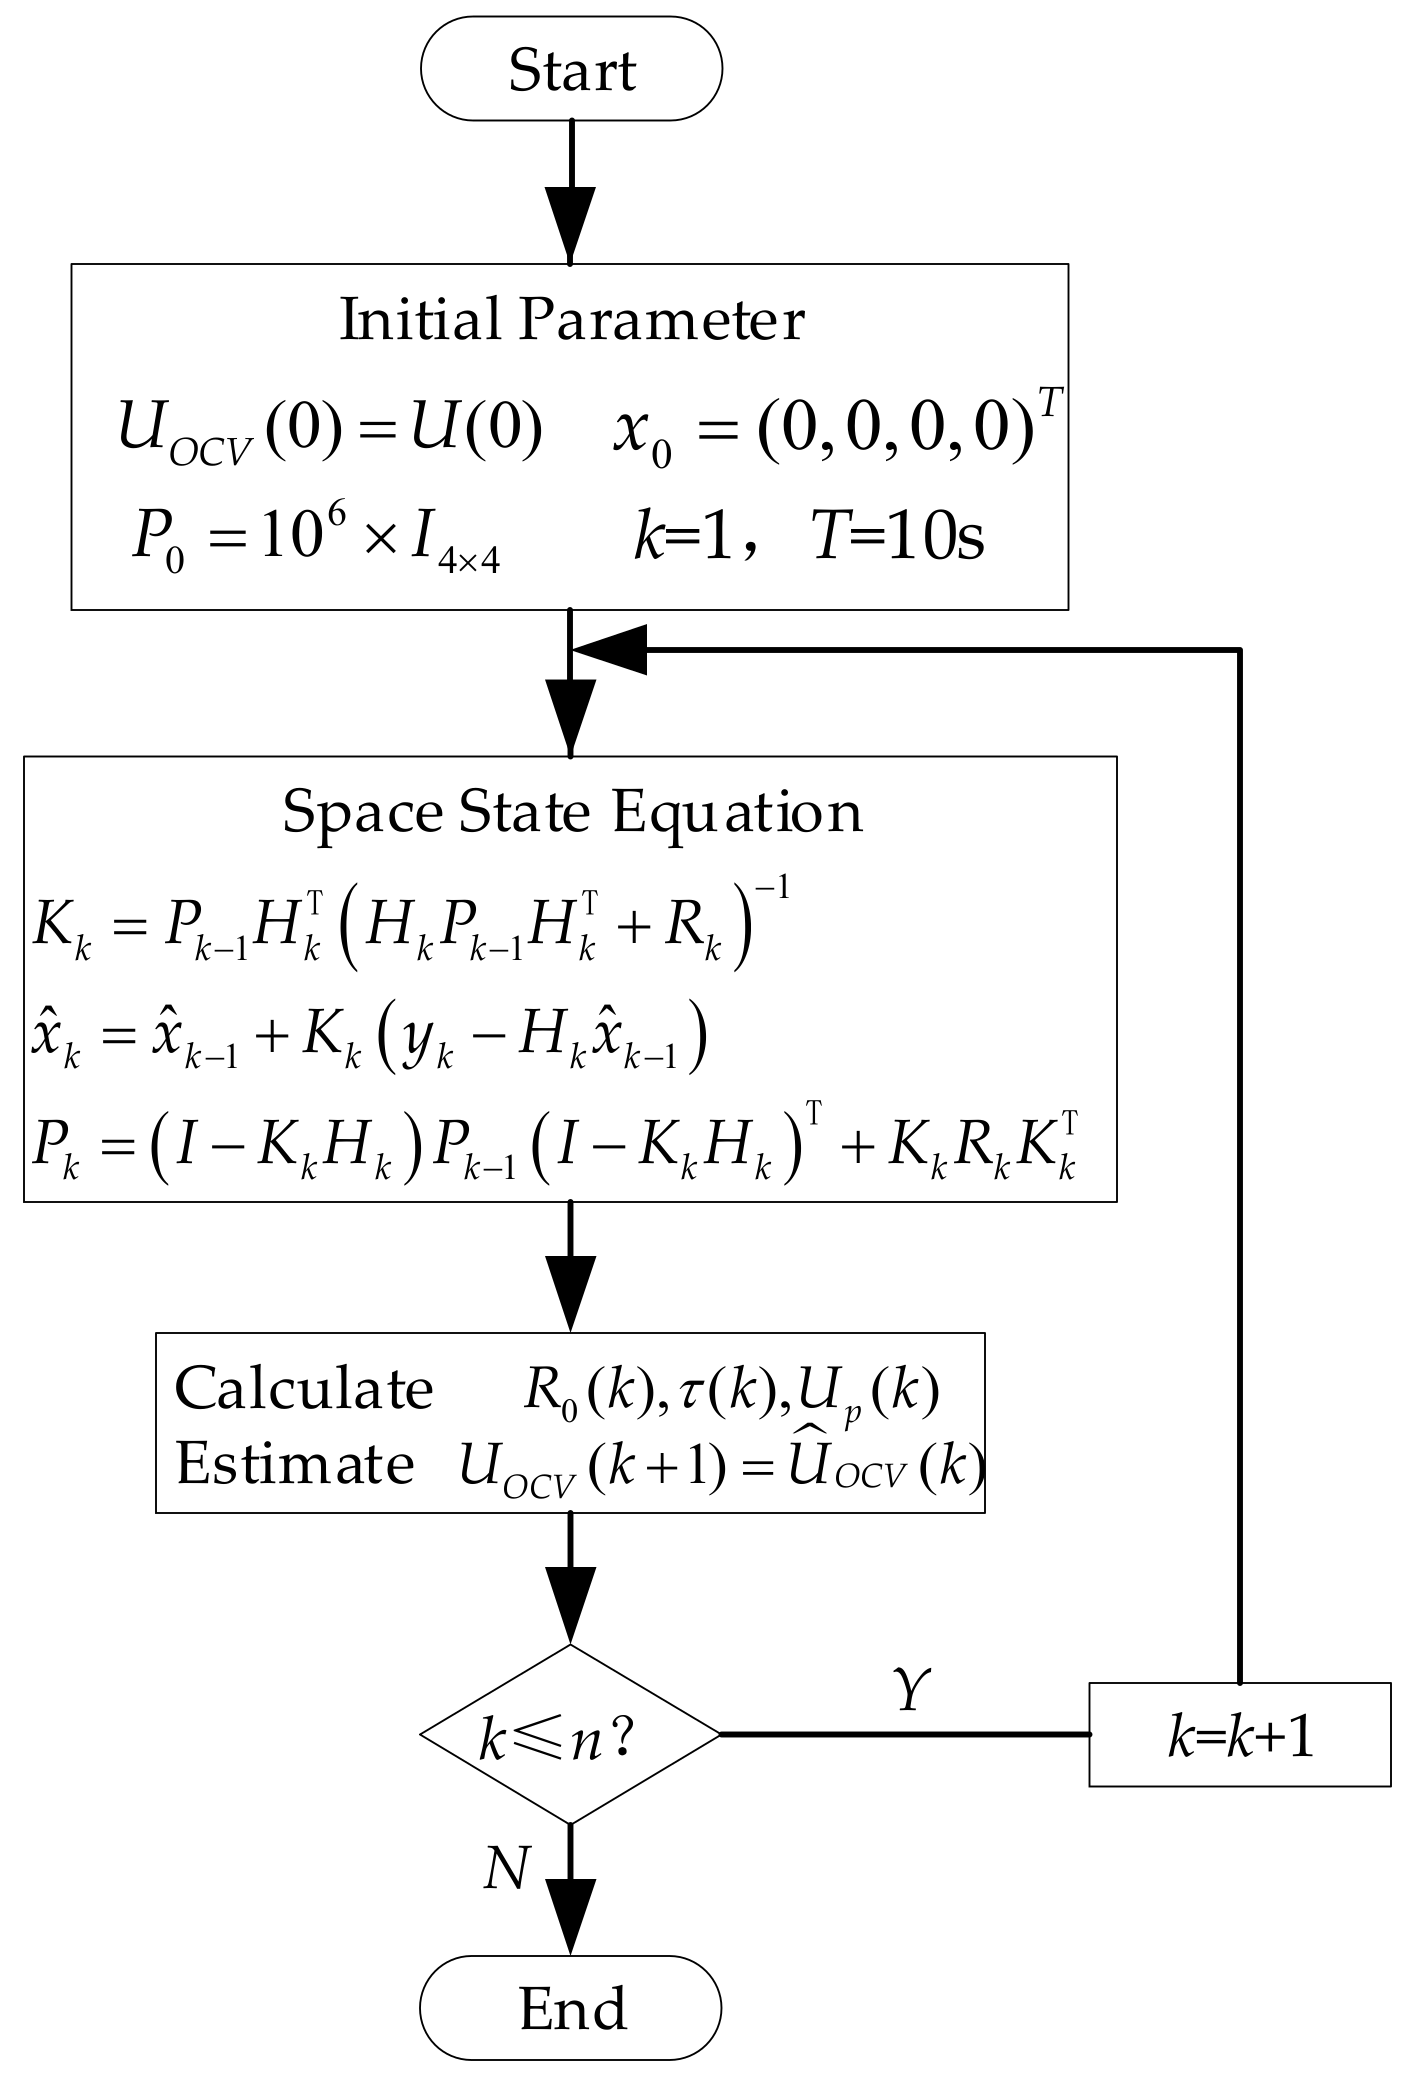
Figure 5.
Parameter identification results. (a) Identification results of parameter k1, k2, k3, k4; and (b) identification result of parameter R0.
Figure 5.
Parameter identification results. (a) Identification results of parameter k1, k2, k3, k4; and (b) identification result of parameter R0.
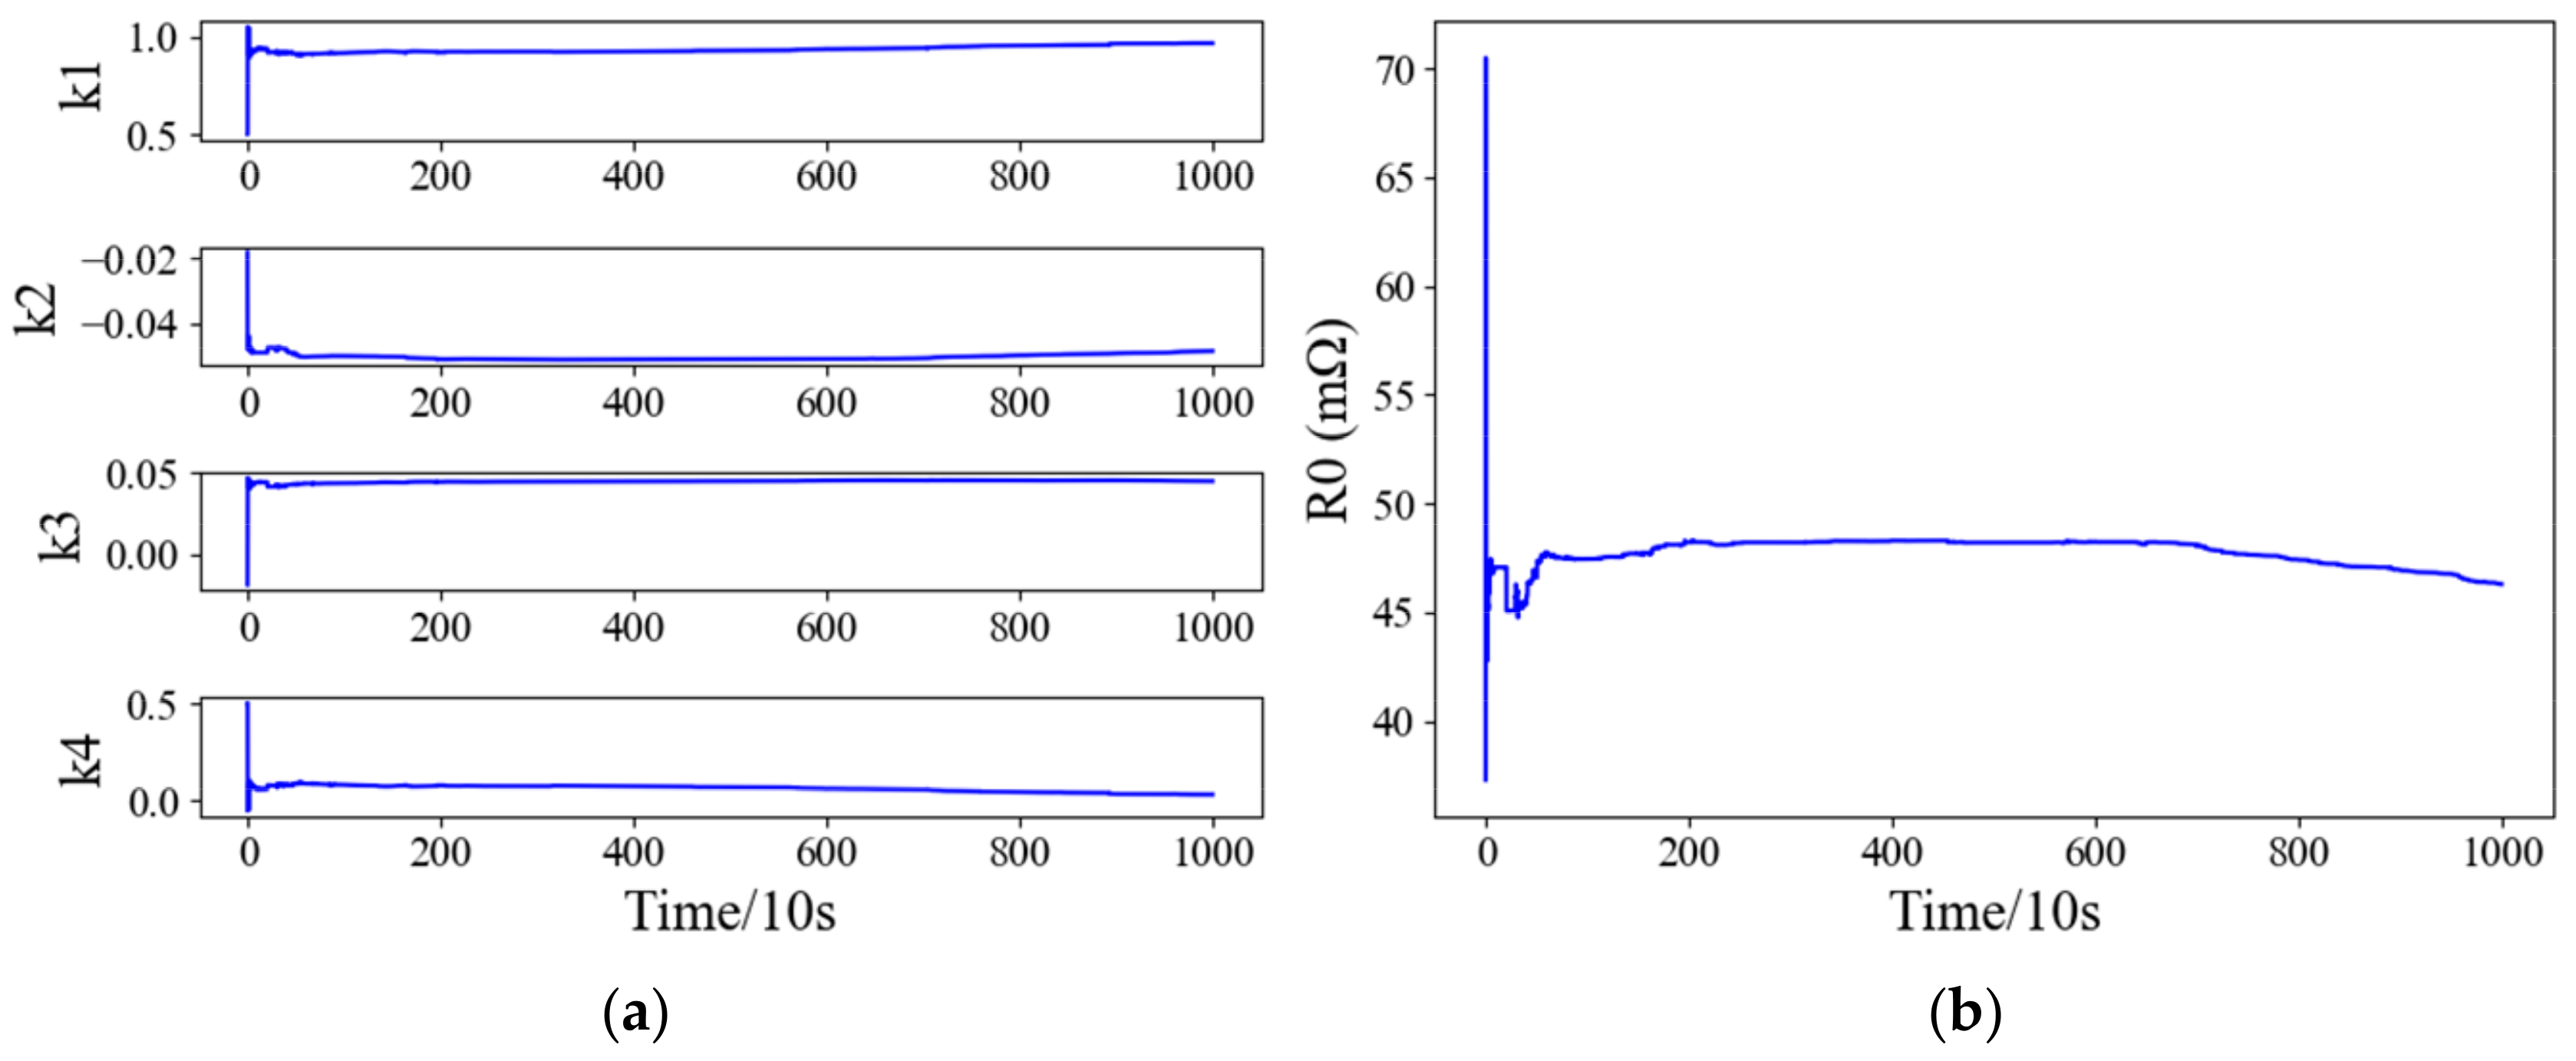
Figure 6.
Comparison of ohmic resistance estimation results in different sampling time. (a) Complete estimation results of parameter R0; and (b) partial estimation results of parameter R0.
Figure 6.
Comparison of ohmic resistance estimation results in different sampling time. (a) Complete estimation results of parameter R0; and (b) partial estimation results of parameter R0.
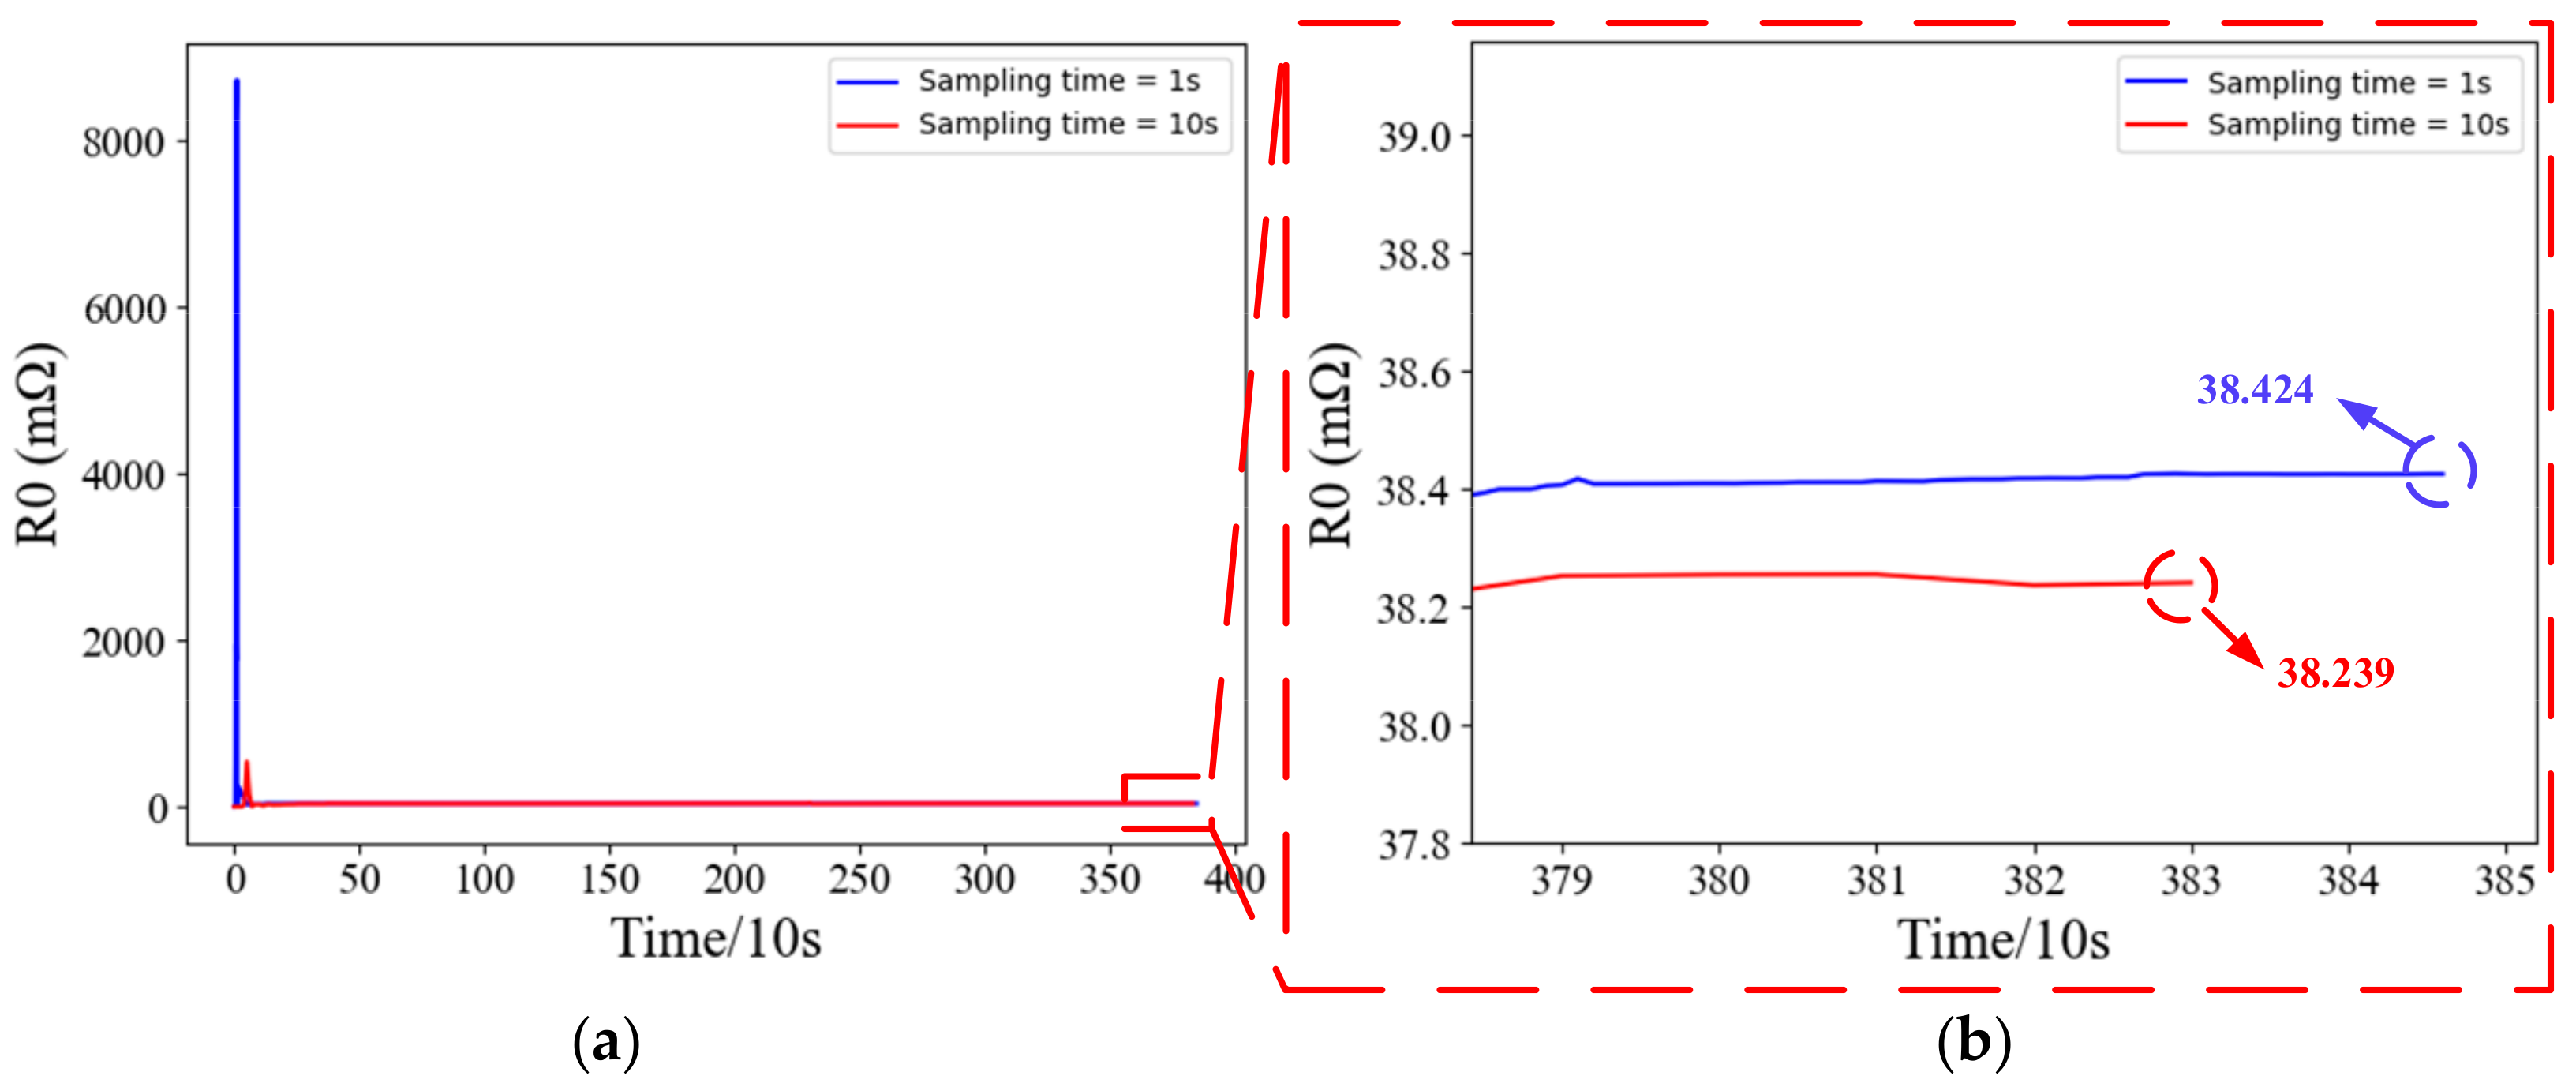
Figure 7.
The estimation results of the terminal voltage.
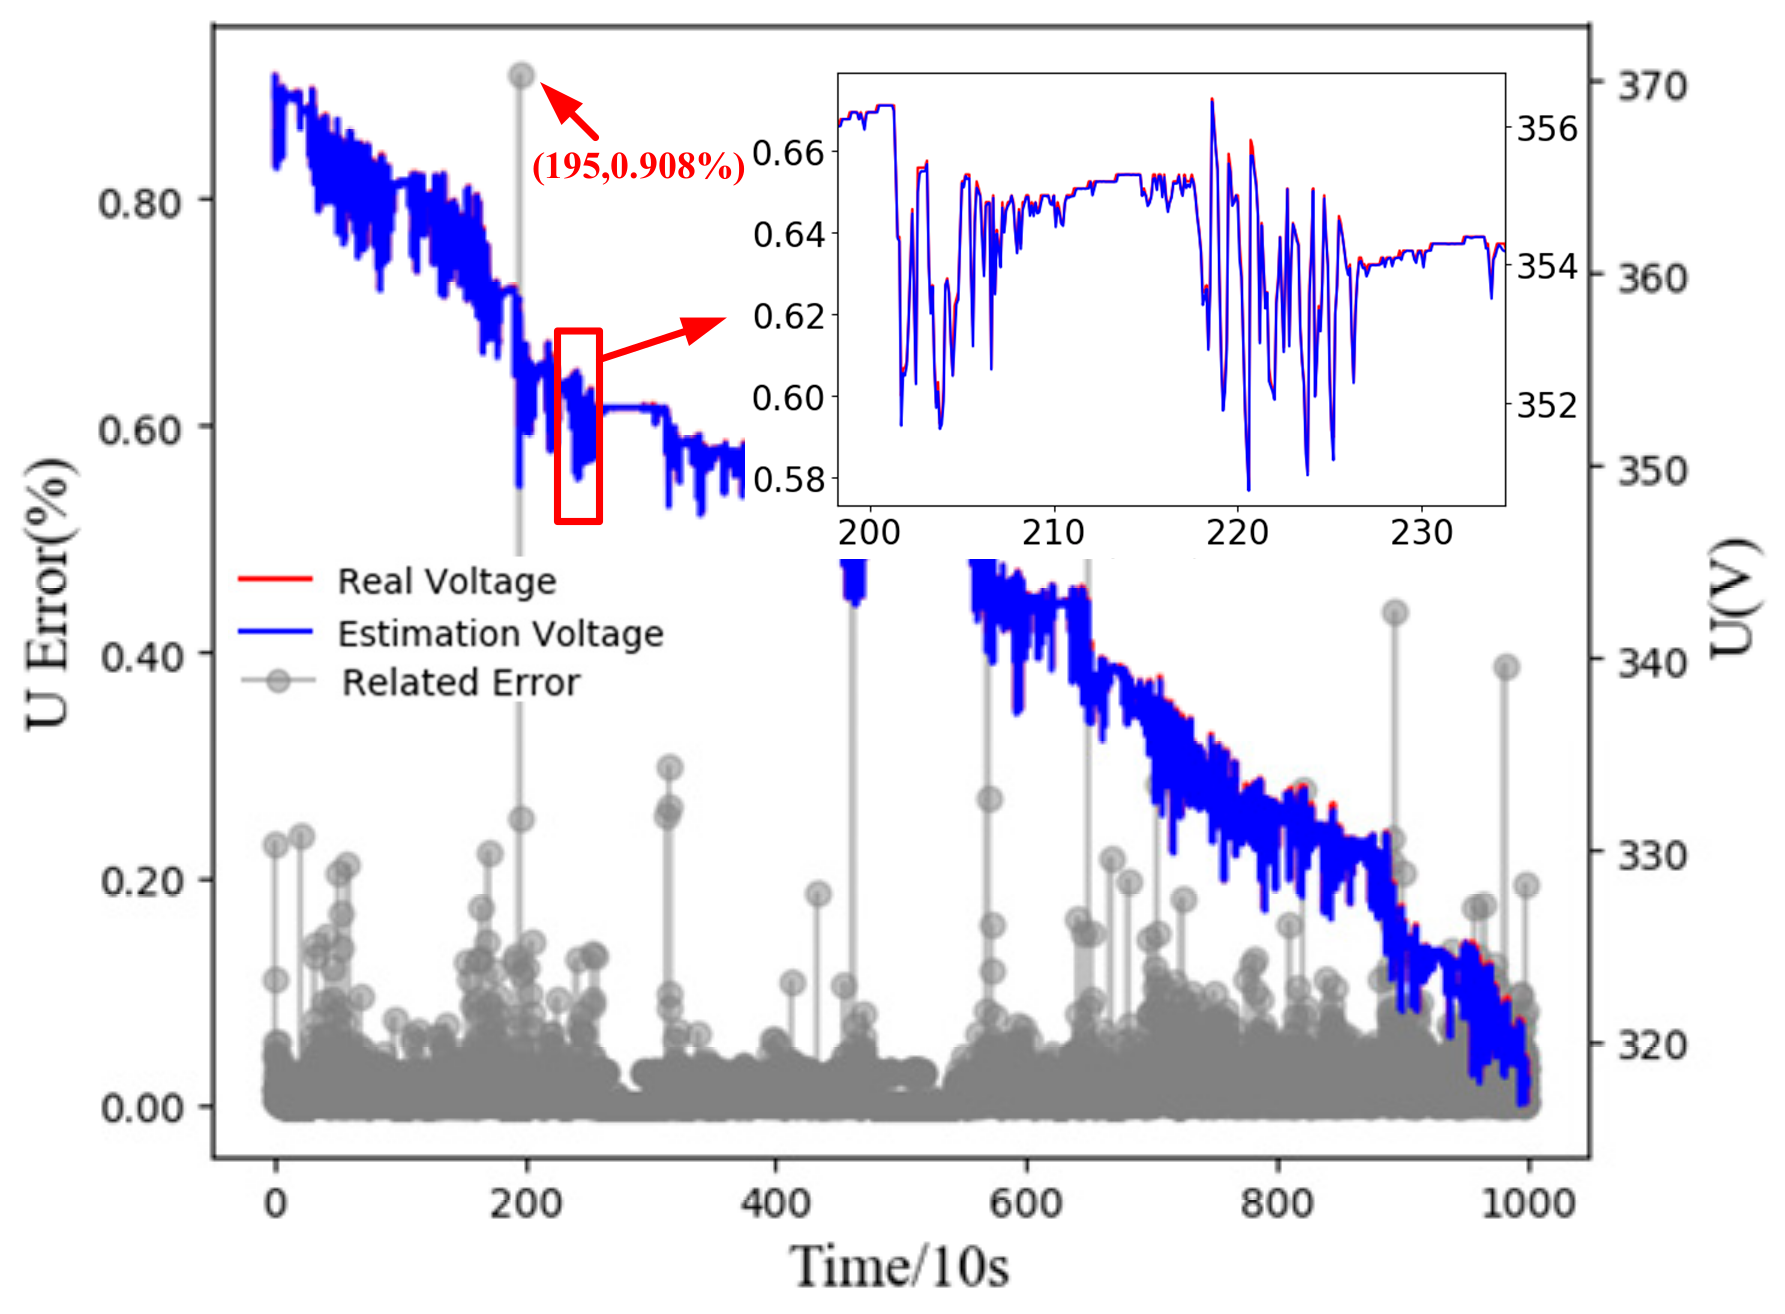
Figure 8.
The relationship between temperature and ohmic resistance.

Figure 9.
Aging analysis of ohmic resistances.
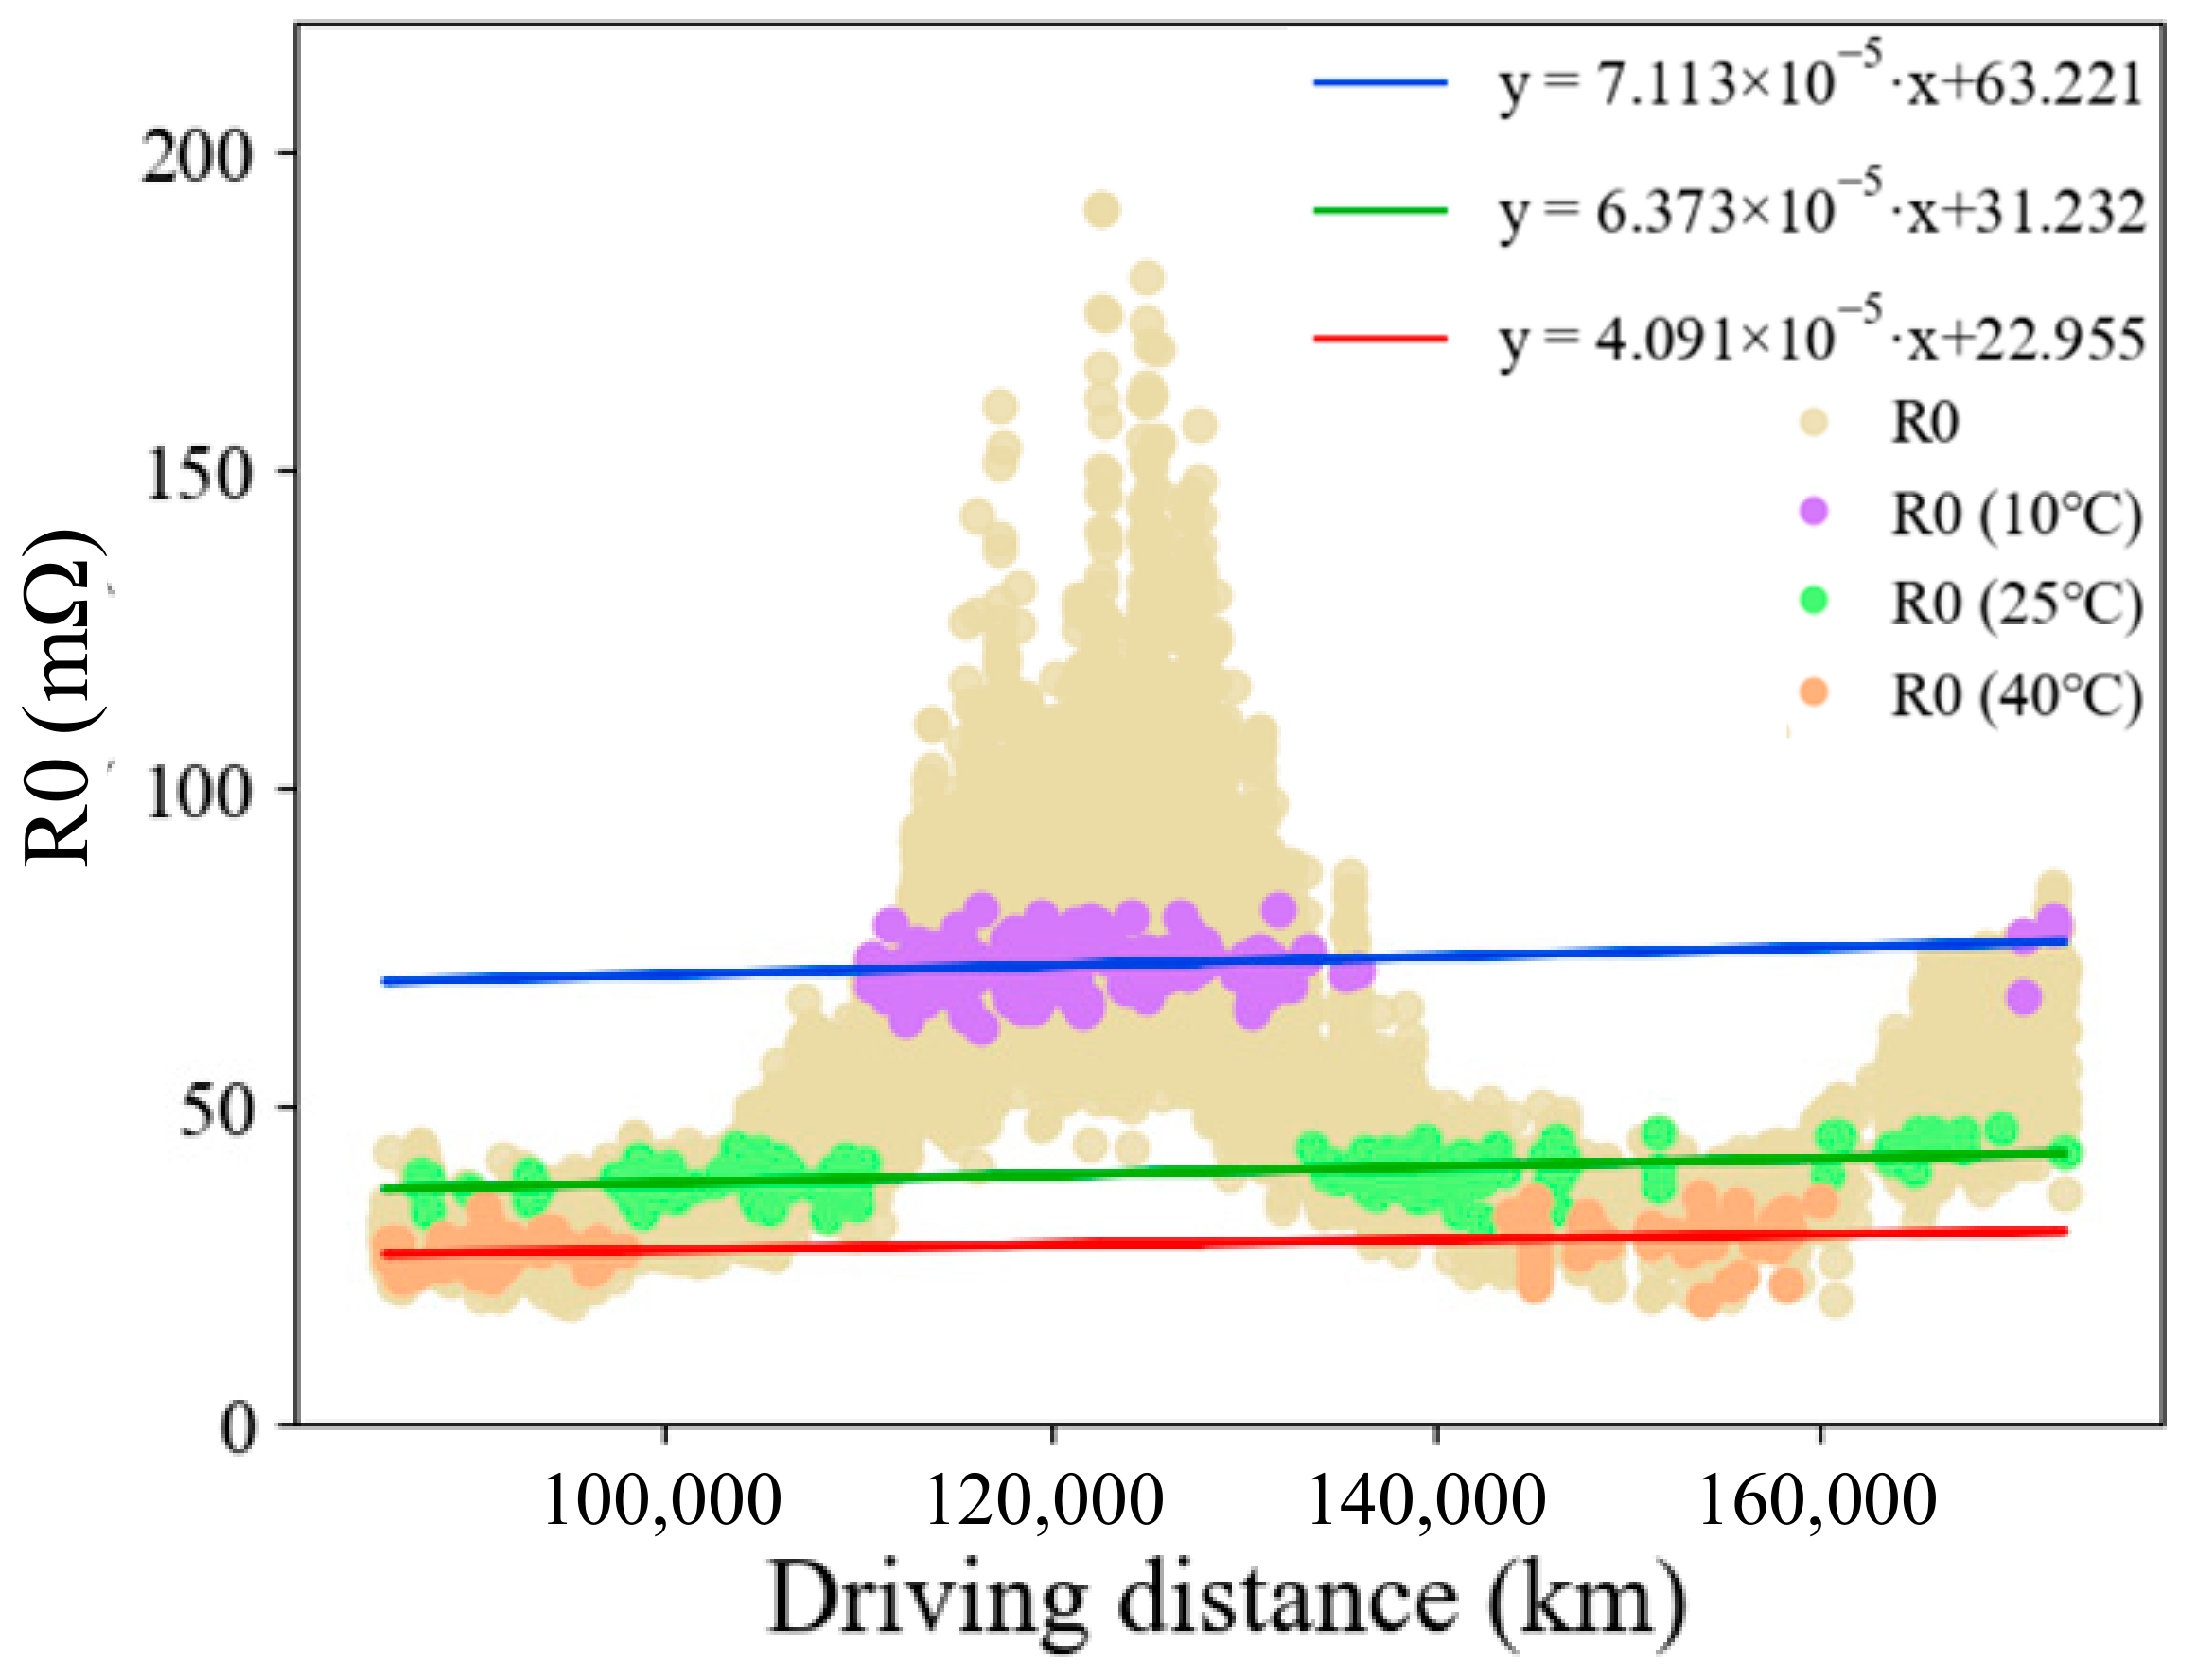
Figure 10.
The effect of parameter settings on model accuracy. (a) The average relative error results for different tree depths; and (b) the average relative error results for different tree number.
Figure 10.
The effect of parameter settings on model accuracy. (a) The average relative error results for different tree depths; and (b) the average relative error results for different tree number.
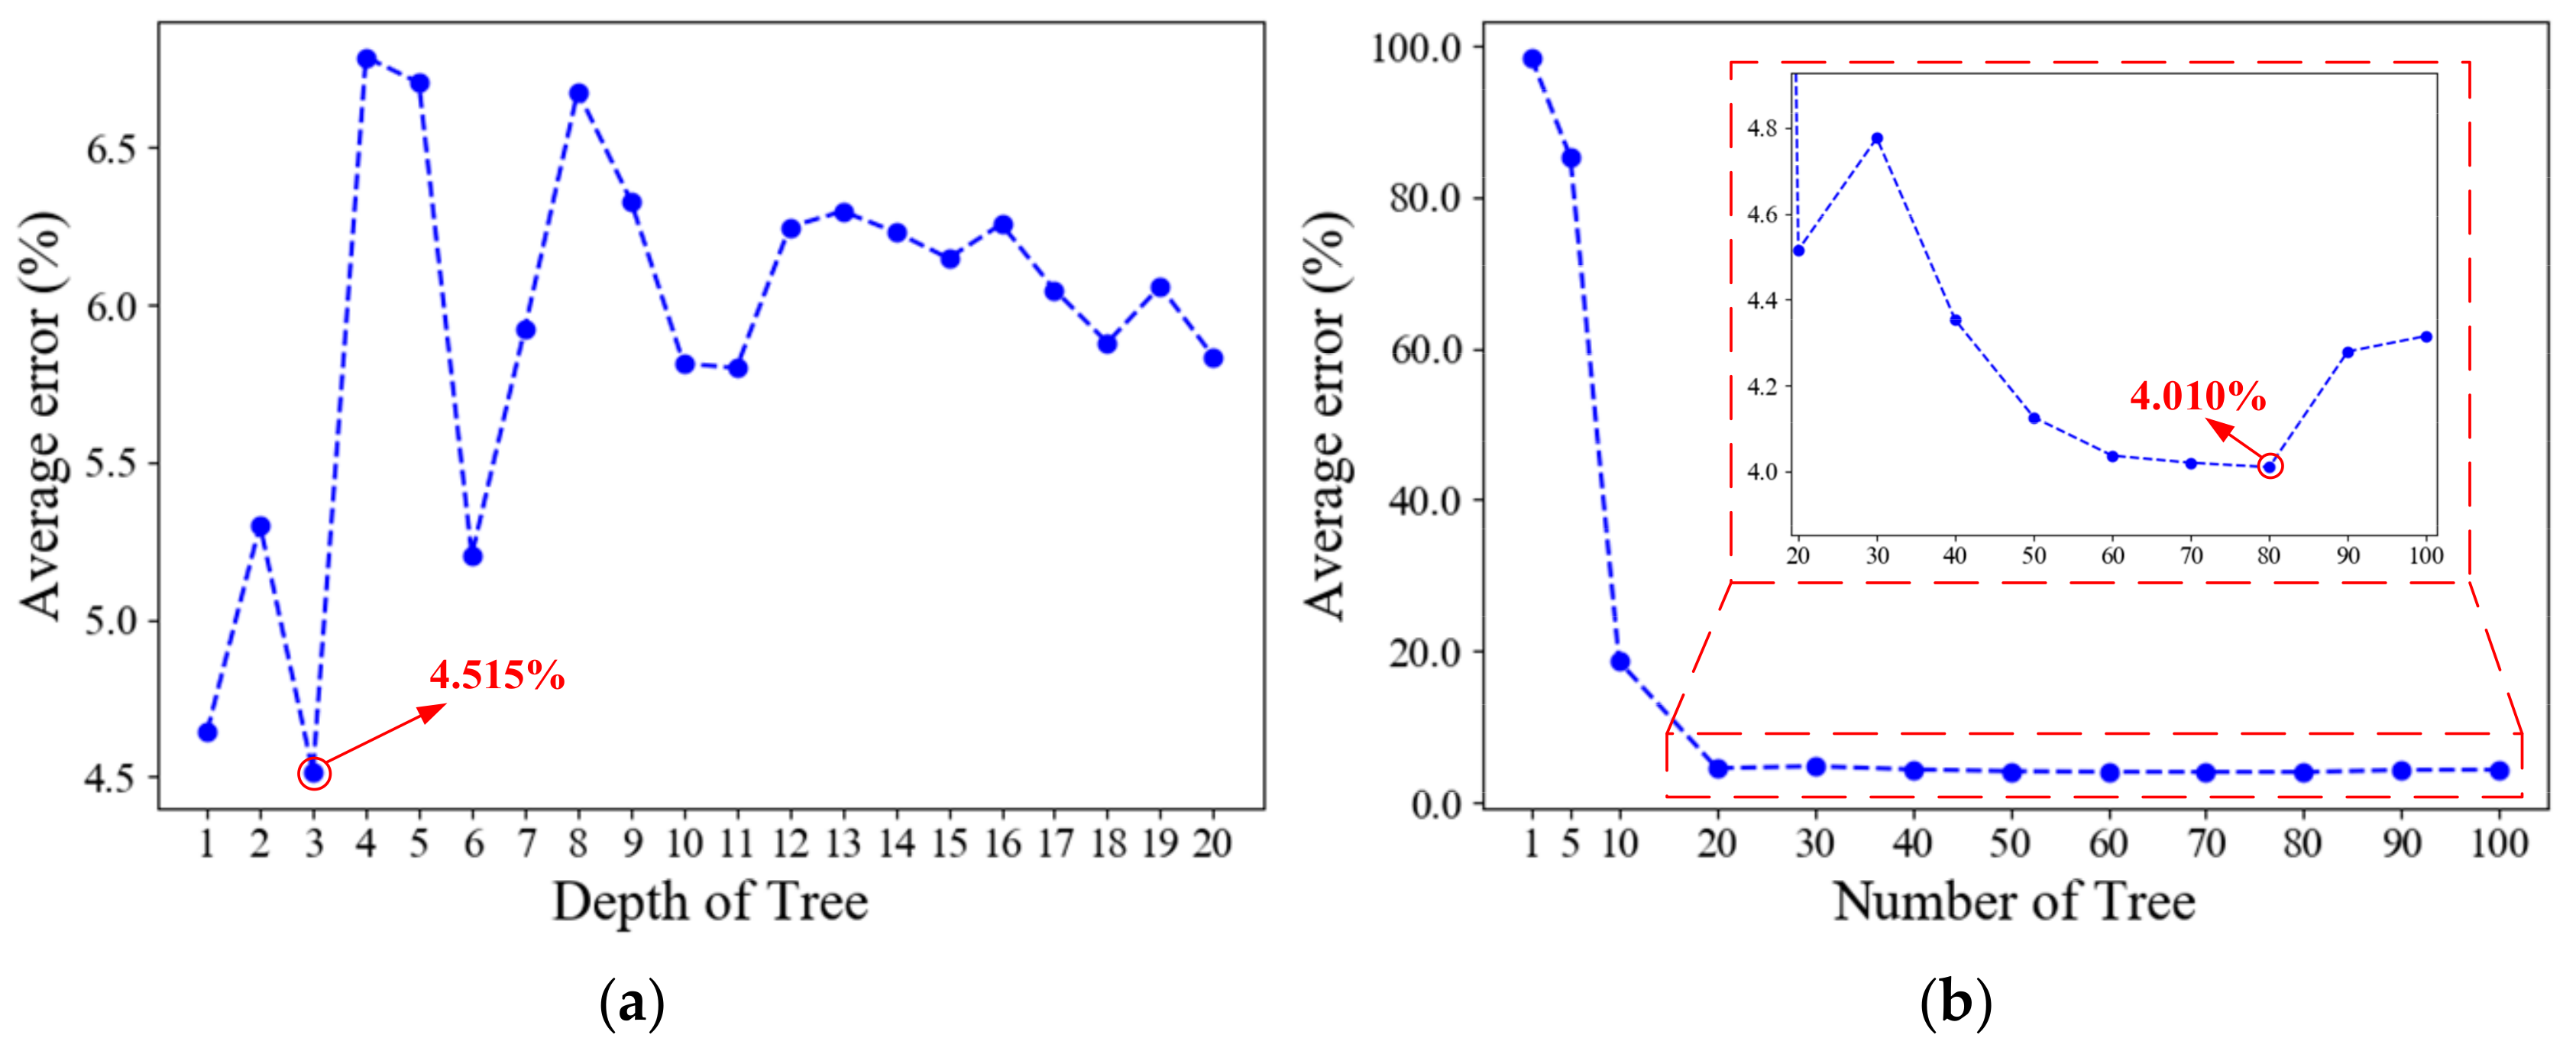
Figure 11.
The relationship between ohmic resistance, temperature, and driving distance.
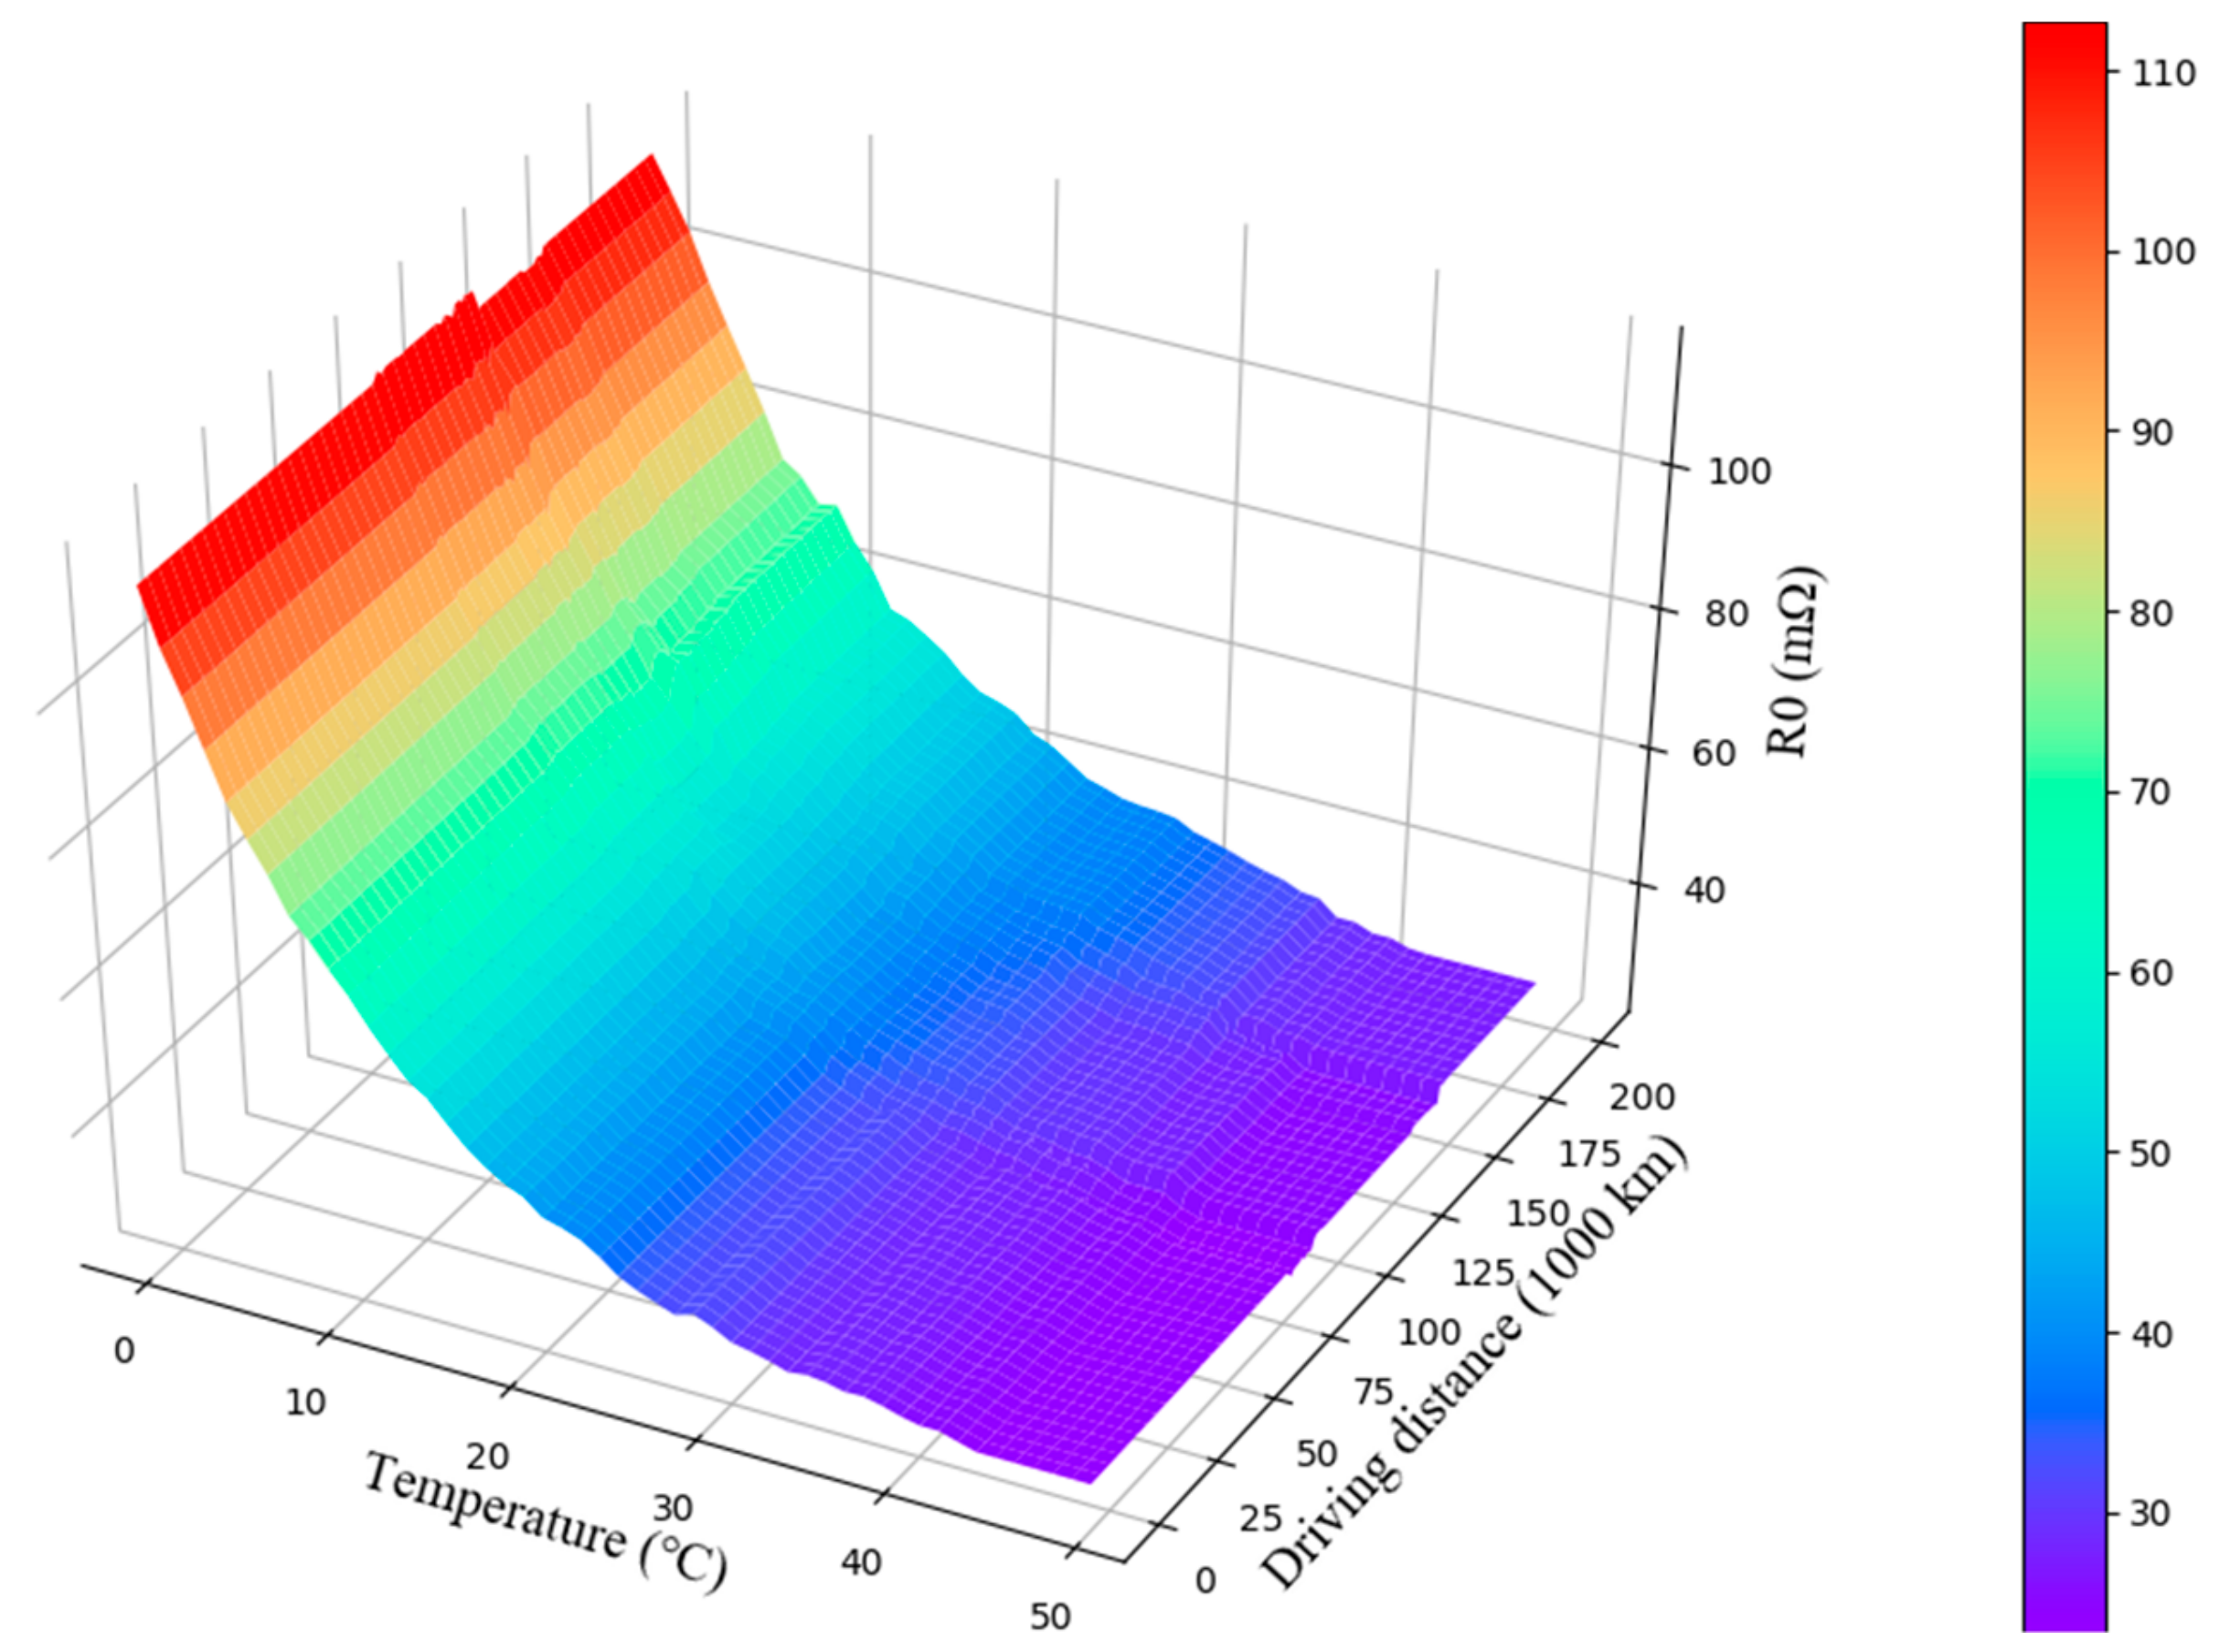
Figure 12.
Short-term ohmic resistance estimation. (a) The short-term estimation results for battery ohmic resistances; and (b) the relative errors of short-term estimation for battery ohmic resistances.
Figure 12.
Short-term ohmic resistance estimation. (a) The short-term estimation results for battery ohmic resistances; and (b) the relative errors of short-term estimation for battery ohmic resistances.
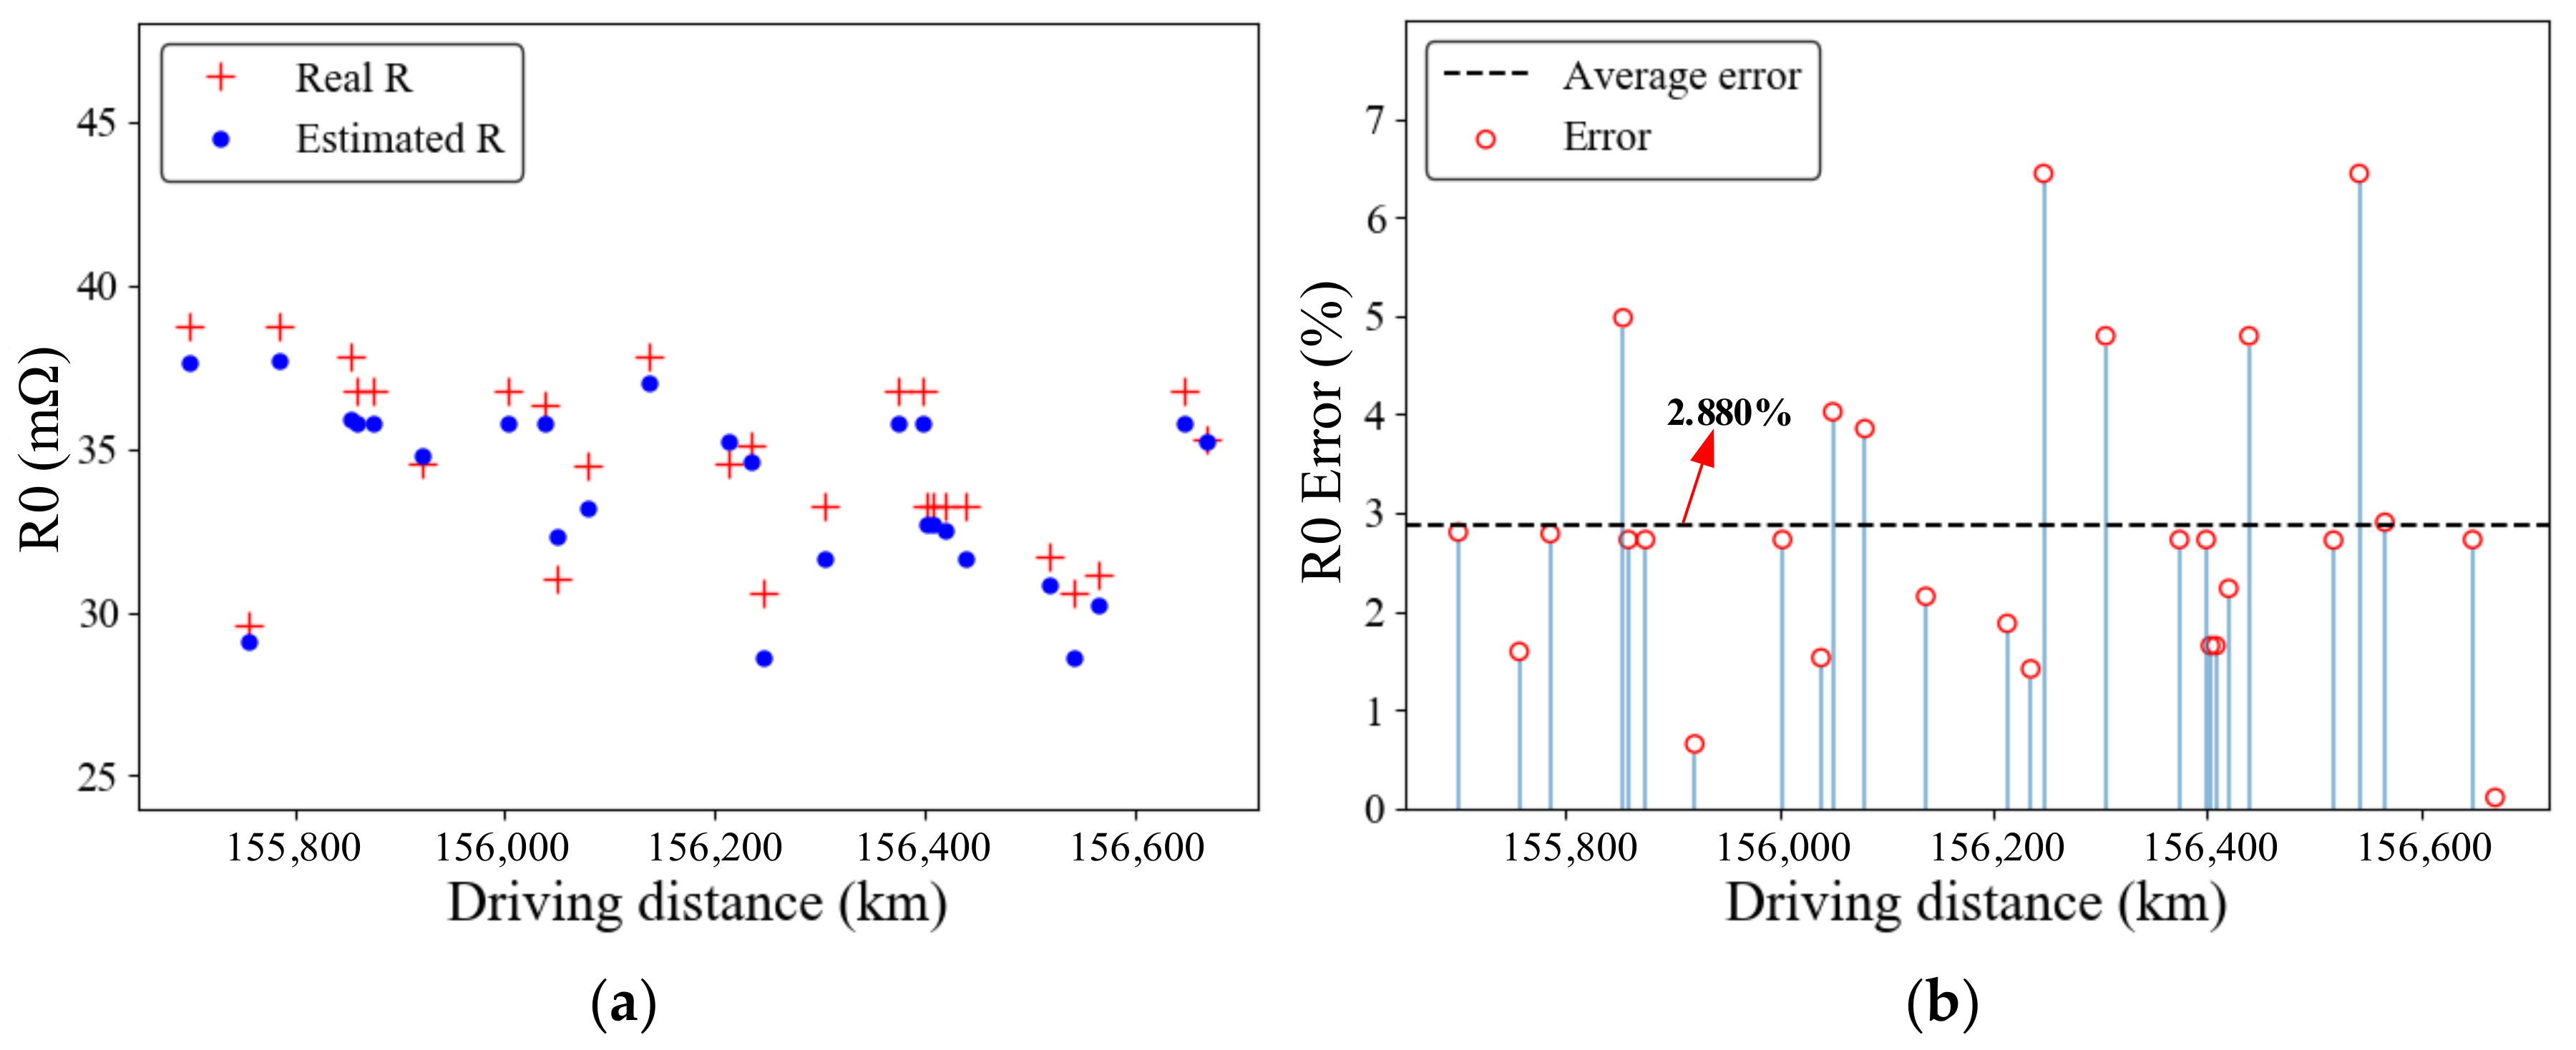
Figure 13.
Long-term ohmic resistance estimation. (a) The long-term estimation results for battery ohmic resistances; and (b) the relative errors of long-term estimation for battery ohmic resistances.
Figure 13.
Long-term ohmic resistance estimation. (a) The long-term estimation results for battery ohmic resistances; and (b) the relative errors of long-term estimation for battery ohmic resistances.

Table 1.
The collection format of the data.
| Data Item | Unit | Precision |
|---|---|---|
| Data collection time | Y-M-D-h-m-s | Sampling period: 10 s |
| Speed | km/h | 0.1 km/h |
| Driving distance | Km | 0.1 km |
| Voltage | V | 0.1 V |
| Current | A | 0.1 A |
| SOC | 1% | 1% |
| Temperature | °C | 1 °C |
Table 2.
The detailed data of the electric vehicle (EV).
| Start Time | End Time | Start Driving Distance (km) | End Driving Distance (km) |
|---|---|---|---|
| 2017-06-13 | 2018-11-19 | 85,454.0 | 172,748.0 |
Table 3.
The results of correlation analysis and statistical significance for the five feature variables.
Table 3.
The results of correlation analysis and statistical significance for the five feature variables.
| Feature Variable | Temperature | Average Current | DOD | Usage Time | Voltage Difference |
|---|---|---|---|---|---|
| Correlation coefficient | −0.818 | 0.152 | −0.089 | 0.060 | 0.164 |
| Statistical significance | 0 | 1.604 × 10⁻¹³ | 1.265 × 10⁻²⁰ | 0.801 | 9.976 × 10⁻⁴ |
Table 4.
Root mean square error (RMSE) and mean absolute percentage error (MAPE) results of ohmic resistance verification.
Table 4.
Root mean square error (RMSE) and mean absolute percentage error (MAPE) results of ohmic resistance verification.
| Test Data | ||
|---|---|---|
| First 1000 km | Last 1000 km | |
| RMSE (mΩ) | 1.101 | 3.663 |
| MAPE (%) | 2.880 | 5.205 |
© 2019 by the authors. Licensee MDPI, Basel, Switzerland. This article is an open access article distributed under the terms and conditions of the Creative Commons Attribution (CC BY) license (http://creativecommons.org/licenses/by/4.0/).
Share and Cite
MDPI and ACS Style
Liang, K.; Zhang, Z.; Liu, P.; Wang, Z.; Jiang, S. Data-Driven Ohmic Resistance Estimation of Battery Packs for Electric Vehicles. Energies 2019, 12, 4772. https://doi.org/10.3390/en12244772
AMA Style
Liang K, Zhang Z, Liu P, Wang Z, Jiang S. Data-Driven Ohmic Resistance Estimation of Battery Packs for Electric Vehicles. Energies. 2019; 12(24):4772. https://doi.org/10.3390/en12244772
Chicago/Turabian StyleLiang, Kaizhi, Zhaosheng Zhang, Peng Liu, Zhenpo Wang, and Shangfeng Jiang. 2019. "Data-Driven Ohmic Resistance Estimation of Battery Packs for Electric Vehicles" Energies 12, no. 24: 4772. https://doi.org/10.3390/en12244772
Note that from the first issue of 2016, this journal uses article numbers instead of page numbers. See further details here.