Article

Factors Affecting the Corrosive Behavior of Used Cooking Oils and a Non-Edible Fish Oil That Are in Contact with Ferrous Metals

Johan Gadolin Process Chemistry Centre, Åbo Akademi University, Piispankatu 8, FI-20500 Turku, Finland
*
Author to whom correspondence should be addressed.
Energies 2019, 12(24), 4812; https://doi.org/10.3390/en12244812
Submission received: 1 November 2019 / Revised: 10 December 2019 / Accepted: 16 December 2019 / Published: 17 December 2019
(This article belongs to the Collection Bioenergy and Biofuel)

Abstract

:
The corrosion behavior of three used cooking oils and one non-edible fish oil was experimentally investigated by the immersion test of iron rods at room temperature. The corrosivity of the tested oils was indirectly determined from the amount of the dissolved iron in the tested oils after the immersion test. Different factors that affect the corrosive behavior of the tested oils were assessed. Among the tested oils, the fish oil showed the highest amount of dissolved iron owing to its chemical properties such as high water content and acid number. In general, water content and acid number have direct effects on the amount of dissolved iron. The addition of oleic acid to the used cooking oil resulted in a 60% less amount of dissolved iron. It was suggested that the addition of oleic acid prompted the formation of a monolayer, which inhibited the permeation of oxygen and water to the surface of the iron rod. Moreover, the addition of glycerol gave the lowest amount of dissolved iron in the oil sample owing to its ability to bind water molecules and form microemulsions in the presence of a surfactant (for example, oleic acid).

1. Introduction

The need for an alternative fuel source is becoming increasingly apparent mainly due to environmental concerns and depletion of fossil fuel reserves. In this context, liquid biofuel, such as bio-oil, has become more attractive as an alternative fuel owing to its environmental benefits as CO2 neutral fuel and the fact that it is obtained from renewable sources [1]. Bio-oils can be used in either processed form, as in car and airplane engines [2,3], or in their crude form for conventional combustors [4] and marine engines [5].
Despite several advantages of bio-oils, their corrosiveness during storage and use are two of the concerns related to compatibility issues, thus limiting the potential of direct substitution of bio-oils for petroleum fuels. Several characteristics of bio-oils can cause corrosion of metals, but the most common ones include pre-existing organic acids (such as acetic, formic, glycolic, and fatty acids), water content, and any possible sediment present in the bio-oil. Besides its ability to produce additional free fatty acids out of any glyceride present in the bio-oil, water enhances the growth of microorganisms, which in turn results in increased corrosion and a high risk of engine malfunction [6,7,8].
Oxidation of biodiesel is also an important factor that needs to be taken into consideration as it reconverts esters into different mono-carboxylic acids such as formic acid, acetic acid, propionic acid, and caproic acid, which increase corrosion of metals [9]. According to Barabás and Todorut [10], the composition of a bio-oil or biodiesel determines how well it can withstand oxidation, polyunsaturated fatty acids being more susceptible to oxidation in the presence of a suitable catalyst [10]. Therefore, the rate at which any degradation (aging or oxidation) occurs must be kept to a minimum since the degradation affects the quality of bio-oil or biodiesel while prompting corrosion as a result of introduced peroxides and fatty acids [11]. In addition to oxidation, hydrolytic degradation can take place when the bio-oil/biodiesel reacts with water [10].
It has also been reported that the corrosiveness of biodiesel depends on its feedstock [12,13]. According to Diaz-Ballote et al. [14], the corrosiveness of biodiesel was found to decrease when decreasing the impurities remaining after processing. In addition, the corrosive nature of biodiesel was increased by the presence of free water and free fatty acids. Compared to conventional diesel, biodiesel is more prone to water absorption, which in turn leads to an increased risk of corrosion when water is condensed on the metallic surfaces that are in contact with the biodiesel. The composition of the metal in contact with fuel has also its own characteristics that would affect the corrosiveness of the fuel [15].
In general, biodiesels tend to show a much higher affinity for corrosion than the conventional petroleum-based fuels, predominantly because of their much higher tendency to absorb water [11]. Despite the corrosive behavior of bio-oils and the mechanisms for the observed corrosion that might be very complex to understand, the corrosion itself can be measured using different techniques. In our previous work [16], the physicochemical, as well as thermal properties of fish oils and used cooking oils, were investigated to determine their applicability as alternative fuels for marine engines. The objective of this work, which is a continuation from our previous publication [16], was to experimentally examine the corrosive properties of crude bio-oils (used cooking oils and non-edible fish oil) that are in contact with ferrous metals.

2. Materials and Methods

2.1. Materials

The composition and properties of fish oil (FO1/18), which was obtained from gutting remains of rainbow trout after edible oil was extracted, and three used cooking oils (UCO1/18, UCO2/18, and UCO3/18) delivered by VG EcoFuel Oy in Finland were studied in detail. In the abbreviations of the oils, numbers are given to identify different types of oils, and the number 18 indicates the year 2018 (in which the oils were prepared).
All the used cooking oils (filtered) had vegetable sources and they were obtained from fast food companies. The used cooking oils (UCO), as well as the fish oil, were stored in a refrigerator before experimental use. For both oils, a commercially available product (COref) was used as a reference.
The iron rod used in the immersion tests was an H44 all-round welding rod with a diameter 1.6 mm obtained from AGA (Finland). It was manufactured according to SFS 2369 G-132, and is composed of (in wt.%) 98.64 Fe, 1.00 Mn, 0.21 Si, 0.11 C, 0.03 P, and 0.02 S. It is a brightly drawn welding wire intended for unalloyed construction steel and some pressure vessel steel with the highest minimum breaking strength of 430 N/mm2. The rods were cut in 85 mm long pieces, and the ends of the iron rod were polished to a similar roughness (visually) as the surfaces of the rod. The rods were cleaned ultrasonically for 2 min using a mixture of toluene and 2-propanol (1:1 v/v), and cleaned for 1 min with acetone ultrasonically. The rods were dried with compressed air before each immersion test.
All chemicals and solvents used in the experiments were of analytical reagent grade. Ferrozine iron reagent (>95%) and monosodium monohydrate (95%) were purchased from Hach Lange GmbH, Dȕsseldorf, Germany. L-Ascorbic acid (99%) was obtained from Sigma-Aldrich, Saint Louis, MO, USA. Acetic acid (98%) was supplied by Merck, Darmstadt, Germany. Sodium acetate (99%), sulfuric acid (95%), potassium hydrogen phthalate (>99.5%), and glycerol (99.5%) were purchased from VWR International, Helsinki, Finland. Toluene (HPLC grade) was obtained from Fisher Scientific, Kandel, Germany. Hydranal Coulomat for Karl Fischer titration was supplied by Fluka, Bucharest, Romania. Oleic acid (97%) was purchased from Acros Scientific, Geel, Belgium.

2.2. Methods

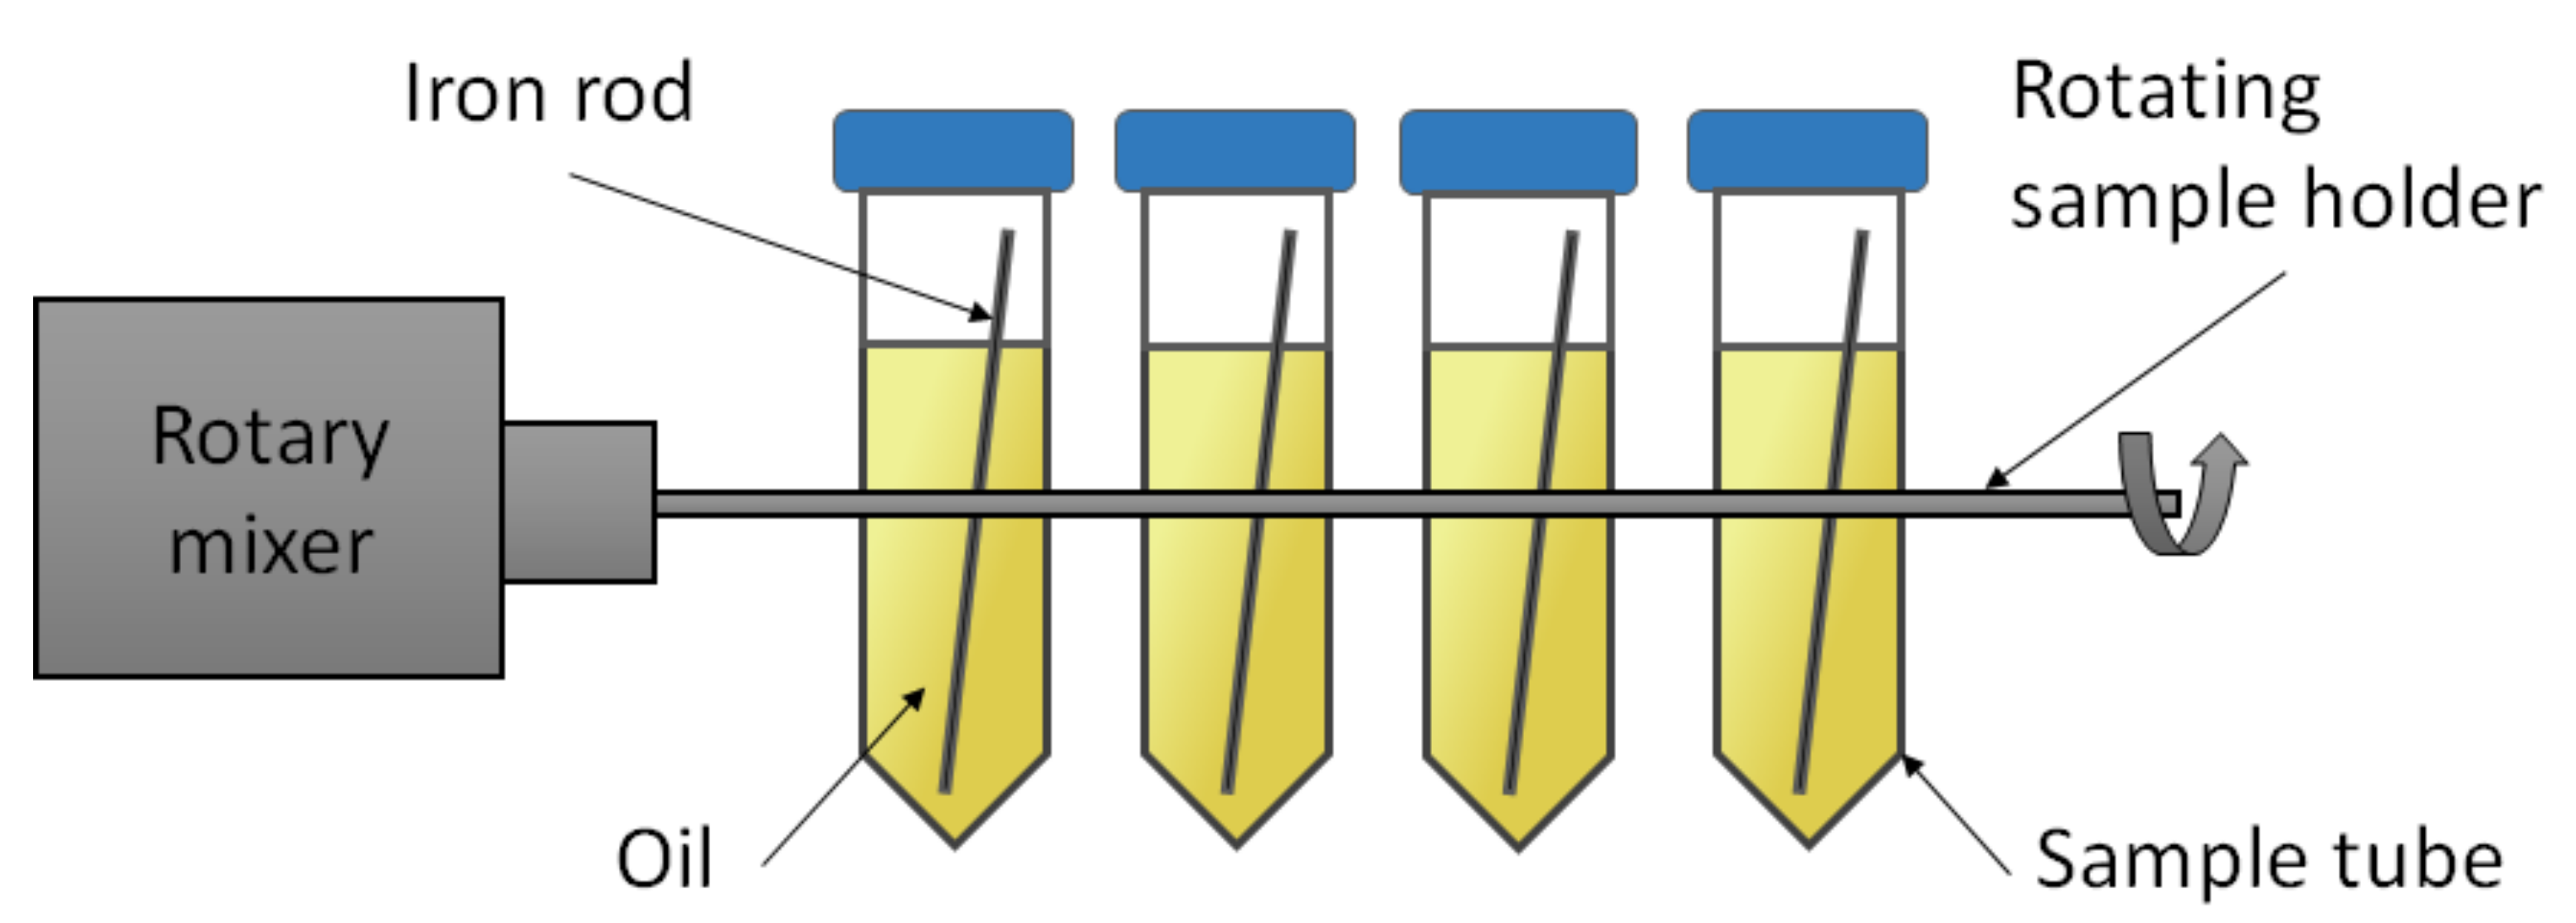
2.2.1. Experimental Setup and Procedure

A room temperature immersion test was applied to investigate the corrosion behavior of used cooking oils and non-edible fish oil on an iron rod (length 85 mm and diameter 1.6 mm). The experiments were conducted in test tubes (15 mL) mounted on a rotary mixer, rotating at a constant speed of 56 rpm. The iron rod was placed in a 7 mL oil sample and the test was conducted over a period of 1, 3, 5, and 10 days. During the experiments, the samples were wrapped around with duct tape in order to avoid exposure to light. After the immersion test, the iron rod was separated from the oil and cleaned ultrasonically using a mixture of toluene and 2-propanol (1:1 v/v). The oils from each experiment were subjected to liquid–liquid extraction using 1 mL of sulfuric acid (95%) and 8 mL of deionized water in a test tube, which was then vigorously shaken for 1 min. After the extraction, the mixture was filtered using WhatmanTM quantitative filter paper grade No 42 (ashless, Whatman International Ltd, Maidstone, England) and the aqueous solution was taken for subsequent spectrophotometric analysis. Each experiment was repeated in triplicates. The experimental setup developed in this work for the immersion test is shown in Figure 1.

2.2.2. Analytical Methods

Iron Content Measurement
The amount of iron dissolved in the oils during the experiment was determined using a spectrophotometer (Spectronic Genesys 2PC) by analyzing the amount of total dissolved iron in the aqueous phase after the liquid–liquid extraction step. Prior to spectrophotometric analysis, the iron in the water solution was reduced to Fe2+ with the aid of ascorbic acid. The solution was then allowed to react with an excess of ferrozine-reagent to form a magenta-colored complex. A buffer solution containing sodium acetate and acetic acid was used to adjust the pH to 5. The red complex had a maximum absorption peak at 562 nm. The molar absorptivity used for the analysis was 27 , 900 mol l 1 cm 1 , which was selected according to the report by Stookey [17]. It is known that the red complex follows the Beer–Lambert law [18] up to the absorbance value 1. The final solutions were made to achieve an absorbance value between 0.5 and 1.
In addition to the spectrophotometric analysis, the amount of the dissolved iron in the oil was measured using inductively coupled plasma-optical emission spectrometry (ICP-OES, Perkin Elmer Optima 5300 DV) and inductively coupled plasma-mass spectrometry (ICP-MS, PerkinElmer, ELAN 6100 DRC). Prior to the analysis, 65% HNO3 and 30% H2O2 were added to the samples and digested in a microwave oven (Anton Paar, Multiwave 3000). In the ICP-MS analysis, a commercial multi-element standard was used for the calibration and ammonia was used as a reaction gas. A minimum of five replications per each sample were performed in each case.
Acid Number Measurement
The acid number (AN) of the crude bio-oil was measured by the ASTM D 664 method using Metrohm 888 Titrando titrator with the Solvotrode glass electrode. Samples of the crude bio-oils were dissolved in 125 mL solution of toluene, propan-2-ol, and deionized water (500:495:5 v/v/v), and then titrated with 0.1 M KOH in propan-2-ol. The amount of KOH in propan-2-ol was determined by titration of potassium hydrogen phthalate. The blank test was done three times.
Water Content Analysis
Karl Fischer (KF) titration with an automatic coulometric titrator (Metrohm 851 Titrando instrument) was used to measure the water content of the samples. The KF titrator was connected to an oven (860 KF Thermoprep), which was adjusted to 110 °C. About 0.1 g of the sample sealed in a glass bottle was placed in the sample holder. In the KF measurements, a dry N2 (gas) with a flow rate of 90 mL/min was used. During the measurement of the water content of the reference commercial product, about 0.5 g of the sample was injected into the reactor, since the flashpoint of the sample is relatively low (about 60 °C). Three runs were performed for each sample and no dry N2 (gas) was used.
SEM-EDS Analysis
The surface of the iron rod was analyzed with a scanning electron microscopy (SEM) LEO Gemini 1530 with a Thermo Scientific UltraDry Silicon Drift Detector (SDD) coupled to an elemental X-ray detector (EDS, Energy Dispersive X-Ray Spectroscopy, Thermo Scientific, Madison, WI, USA).
Oil Composition Measurements
A capillary gas chromatography–flame ionization detector (GC-FID) (Perkin Elmer Autosystem XL) was used to quantify the number of monoglycerides and free fatty acids in the oil samples. All samples were silylated before the GC analysis. The column used was an Agilent J&W HP-1, 25 m (L) × 0.200 mm (ID) with film thickness 0.11 μm. Hydrogen was used as a carrier gas with a flow rate of 0.8 mL/min. The temperature of the oven was increased at a rate of 6 °C/min from 120 °C (1 min hold) to 320 °C (15 min hold), and with an injector program at a rate of 8 °C/min from 160 °C to 260 °C (10 min hold). The detector temperature was 320 °C. The identification of individual components was performed by GC-MS analysis with an HP 6890-5973 GC-MSD instrument, using a similar GC column, but using helium as the carrier gas.
A wide-bore short column GC-FID (PerkinElmer Clarus 500, Shelton, CT, USA) was used to analyze the diglycerides. The column parameters were: Agilent HP-1/SIMDIST, ~6 m (length) × 0.530 mm (inner diameter), film thickness 0.15 µm. The hydrogen carrier gas was fed at 7 mL/min. The wide-bore GC-oven temperature program was increased from 100 °C (after a 0.5 min hold) at a rate of 12 °C/min to 340 °C (5 min hold), and with an injector program from 80 °C (0.1 min hold) at a rate of 50 °C/min to 110 °C, and at a rate of 15 °C/min to 330 °C (7 min hold), while the temperature of the detector was maintained at 340 °C.
A high-performance size exclusion chromatography with an evaporative light scattering detector (HPSEC-ELSD, Shimadzu 10A series modular HPLC, Shimadzu Corporation (Shimadzu, Japan), and ELSD detector, Sedex 85 LT-ELSD, S.E.D.E.R.E. S.A.) was used to detect polymerized triglycerides.

3. Results and Discussion

3.1. Physicochemical Properties

The physical and chemical properties of the bio-oils were experimentally studied to evaluate the suitability of the oils for fuel applications.
It is well known that the density of fuel affects the dispersion of the fuel injected into the cylinder, whereas the viscosity of the fuel plays a significant role when the fuel is sprayed into the chamber or while mixing it with other fuels [19,20]. High water content and acidity in bio-oils can substantially increase the risk of corrosion during the storage and the use of the oils [21,22,23]. Moreover, the presence of water in a bio-oil decreases the heating value of the oil [16]. The measured physicochemical properties of the bio-oils are summarized in Table 1.
According to the results in Table 1, the density of the fish oil and used cooking oils were on the same level, but slightly denser than the commercial product used as a reference. All the values were apparently lower than the density of water or the density of heavy fuel oil, 940 kg/m3 [24]. The fuel density affects the design of an engine since the higher the density, the better the penetration is in the combustion chamber. A lower density facilitates mixture formation and atomization to be attained [19]. It has been reported that the density of the liquid biofuel for the marine engine should be lower than 991 kg/m3 [25]. Our results indicate that the densities of the studied oils are lower than 991 kg/m3 and are between the values for the heavy fuel oil and the reference commercial product, thus avoiding the need for engine modification due to density values.
On the other hand, the used cooking oils showed the highest kinematic viscosity (40.7 mm²/s) compared to the fish oil (26.6 mm²/s) or reference product (9 mm²/s). The high kinematic viscosity of the used cooking oils can be attributed to the presence of some impurities like starch, polymerized triglycerides, and meat traces in the used cooking oils. In general, a very high viscosity (>100 mm²/s) is not desirable as it causes high operating temperature and the fuel in the injection pumps starts to boil [20]. However, the higher viscosity of the used cooking oils relative to conventional fuels can be lowered by changing the temperature of the oil.
Among the tested oils, FO1/18 had the highest water content (2473 ppm) while the water content of UCO1/18, UCO2/18, and UCO3/18 was between 1403 and 1662 ppm. The commercial product has the lowest water content (37 ppm) among the tested oils. It is important to consider the possibility of water accumulation in tanks when using the bio-oils with relatively high water content. Consequently, careful dewatering operation might be needed to alleviate such problems.
With regard to the acidity of the bio-oils, FO1/18 had the highest acid number (24.8 mg KOH/g oil) while UCO1/18, UCO2/18, and UCO3/18 had an acid number (AN) between 6.5 and 8.2 mg KOH/g oil. The reference product had the lowest AN (0.02 mg KOH/g oil) compared to the rest of the oils. The acid number of a bio-oil is an important property that directly affects the expected lifetime of engine components by increasing the risk of corrosion. For example, according to marine engine designers and producers, an acid number above 100 mg KOH/g oil is regarded as highly corrosive [23]. According to the oil delivered to these laboratory tests, UCO1/18, UCO2/18, and UCO3/18 have been successfully tested for marine engines without the requirement for any modification of engine components. In contrast, the AN of the fish oil (FO1/18) was above the limit of 15 mg KOH/g oil set by the engine manufacturer, hence testing was not permitted [16]. The content of free fatty acids in the tested oils can have a profound effect on increasing the acid number of the oils.

3.2. Oil Composition

The amount of total free fatty acids and diglycerides in the oil samples were analyzed using gas chromatography (GC). High-performance size exclusion chromatography with an evaporative light scattering detector (HPSEC-ELSD) was used to measure the amount of polymerized triglycerides in the oil samples. In addition, the changes in the composition of the oil samples after 10 days of immersion test were investigated. The results are summarized in Table 2.
The GC results, presented in Table 2, indicate that during the 10 days of immersion test, the amount of total free fatty acids and diglycerides for the UCO1/18 sample increased approximately by 16% and 7%, respectively. In addition, the HPSEC-ELSD results showed that the amount of polymerized triglycerides in the UCO1/18 sample significantly increased (28%) during the 10-day test period. For the UCO2/18 sample, the total FFA increase was as low as 4%, for the diglycerides 2.3% and for the polymerized triglycerides 9.4%. For UCO3/18, the amounts of diglycerides and polymerized triglycerides did not markedly change at all during the 10-day test period, whereas the change in the amount of total FFA was insignificant (<1%). Analysis with GC showed that fish oil has the highest total free fatty acid content compared to the used cooking (vegetable) oils. However, unlike UCO1/18, UCO2/18, and UCO3/18, the total amount of FFA in FO1/18 decreased as much as 6% during the 10-day period. This could be explained by the fact that the FFA in the fish oil had quickly undergone autoxidation with an iron rod catalyzing the reaction. On the other hand, the amount of diglyceride in the fish oil increased by almost 6% during the test period of 10 days. Compositional analysis of the COref was also performed using GC-FID and GC-MS. The result indicated that the sample mainly composed of aliphatic hydrocarbons predominantly composed of linear saturated hydrocarbons up to C30 with the largest compounds in the C14 to the C26 range [16]. Detailed oil composition results can be found in Tables S1 and S2.

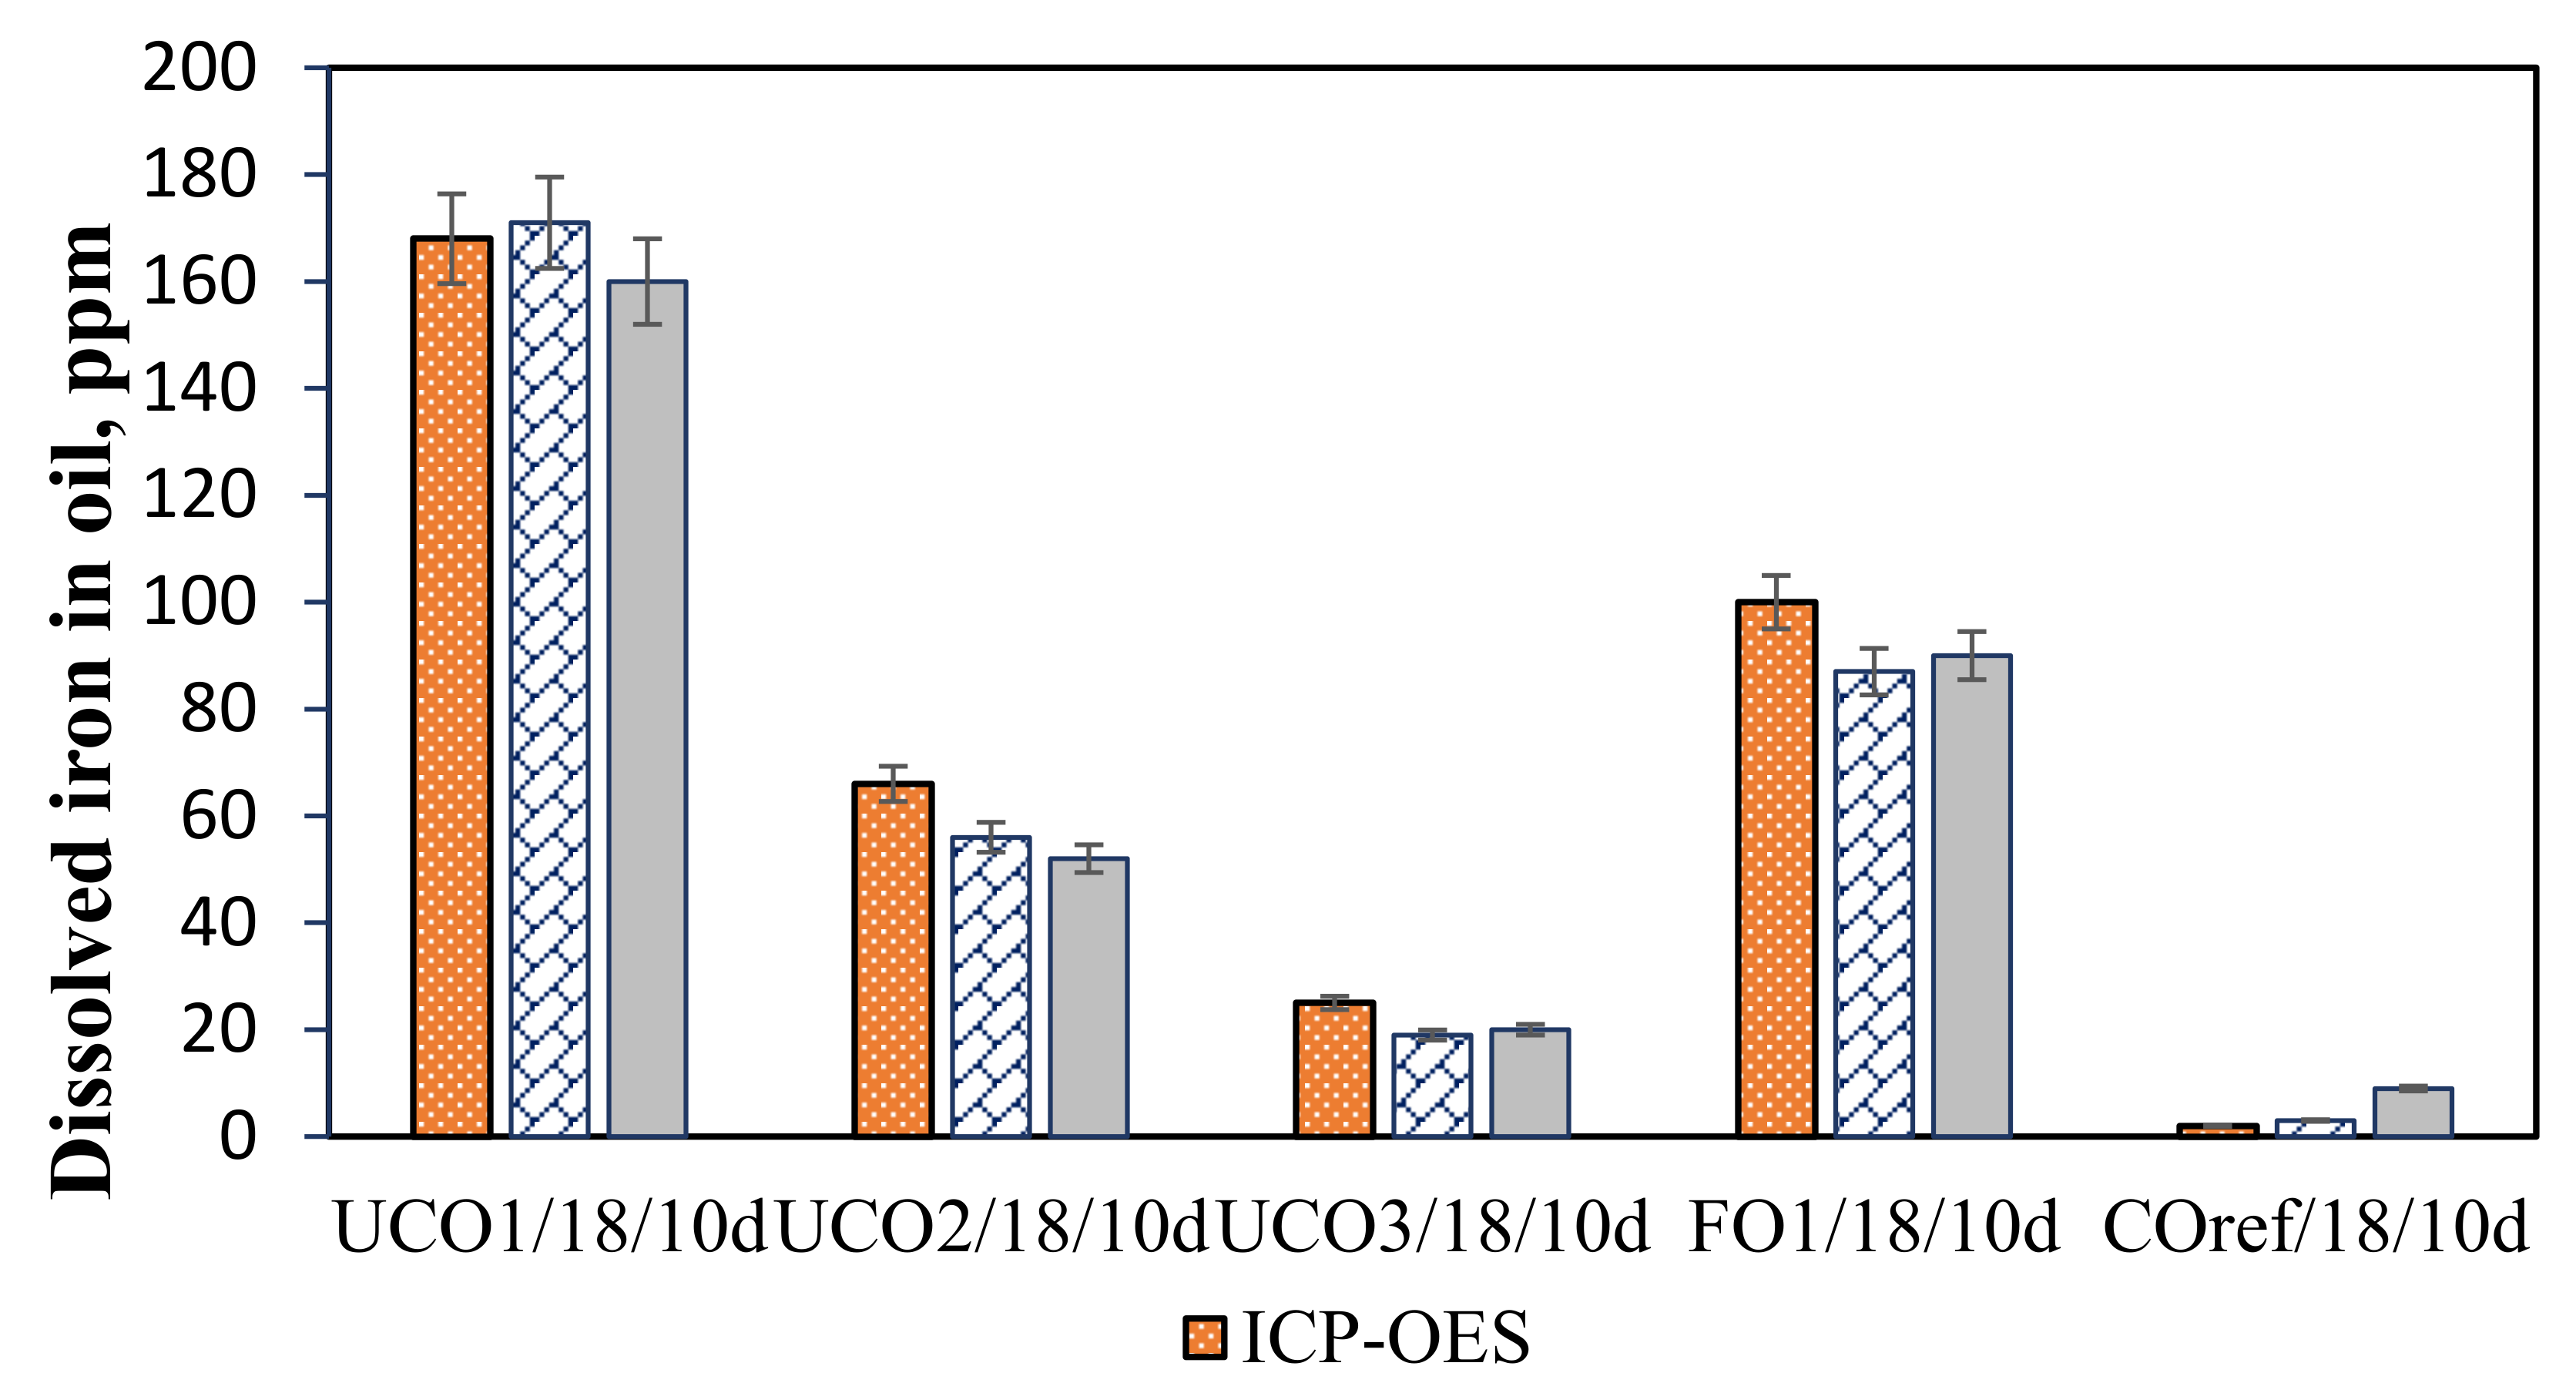
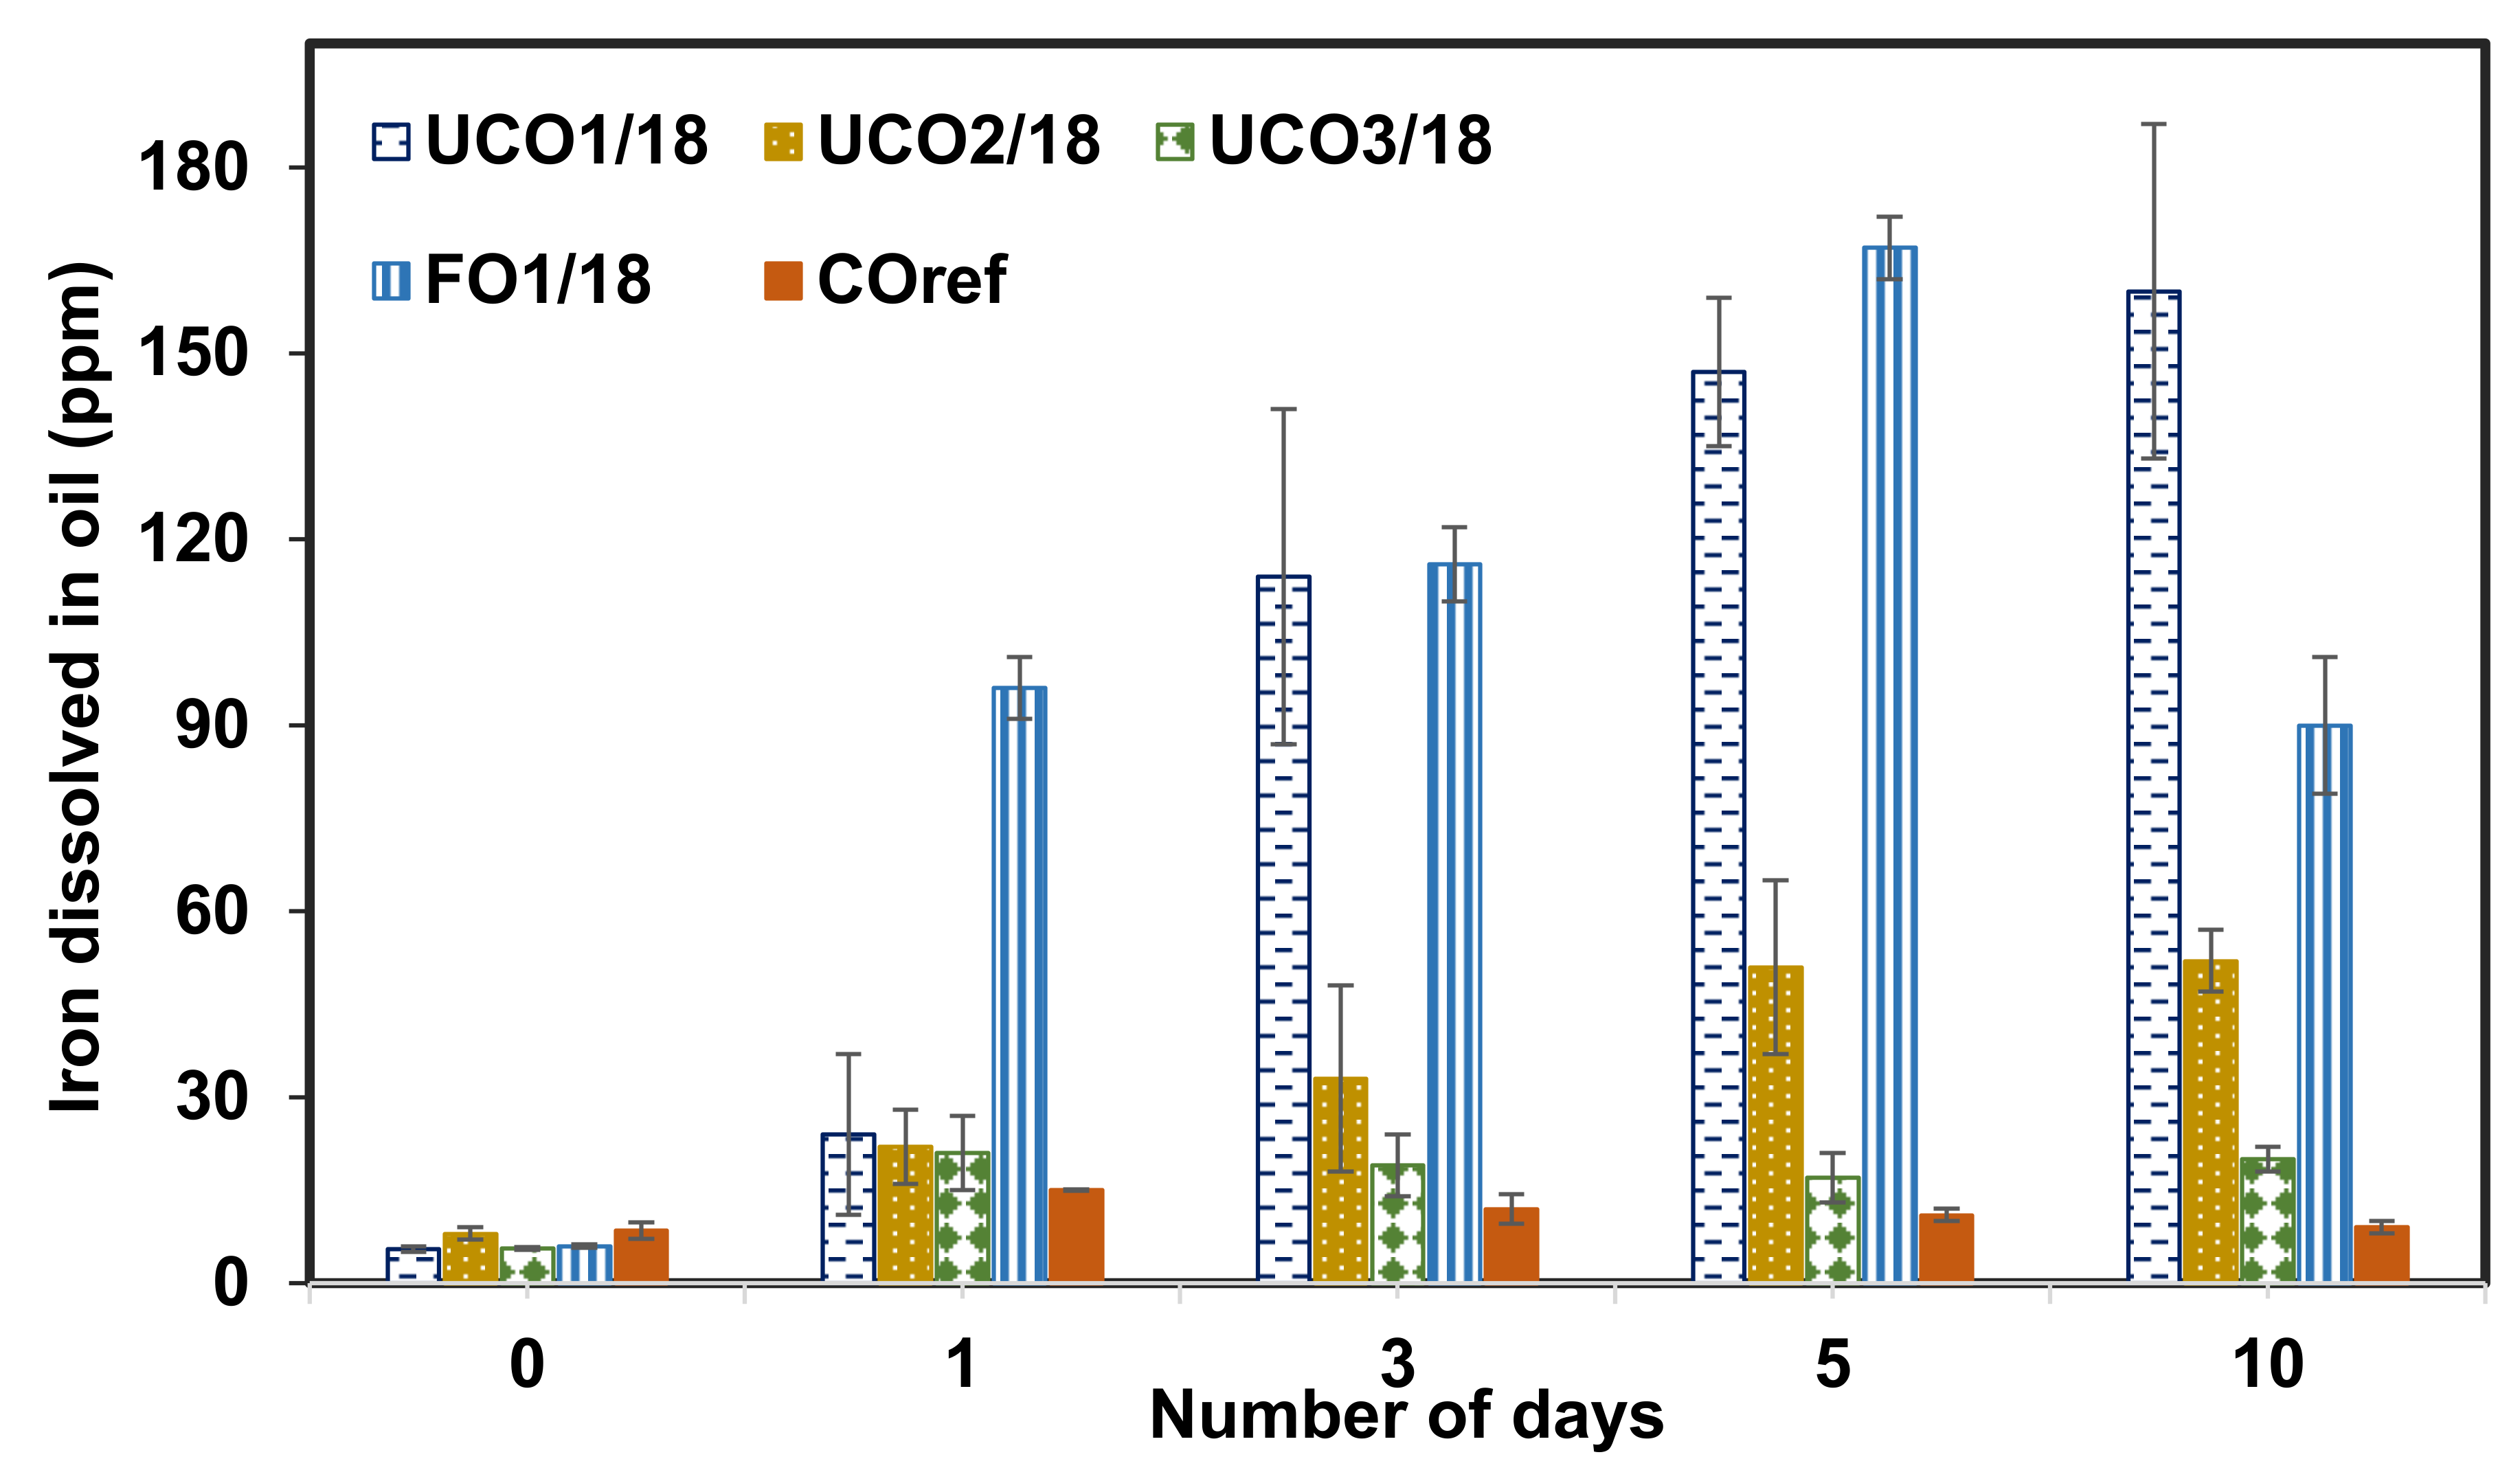
3.3. Effect of Immersion Time

The effect of the immersion time on the total amount of dissolved iron was tested over a period of 0–10 days. As shown in Figure 2, the amount of iron in the cooking oils seems to increase with increasing immersion time. Among the cooking oils, the maximum effect was exhibited by UCO1/18 and UCO2/18, with the highest content of dissolved iron analyzed at 10 days. On the other hand, for UCO3/18 and COref, the amount of dissolved iron did not show any significant change over the course of 1–10 days. The fish oil sample had the highest amount of dissolved iron (170 ppm, 5 days) compared to all the tested oils; however, the iron content started to decrease when increasing the reaction period beyond five days. The relatively high amounts of dissolved iron the fish oil at all time points could be attributed to the chemical properties of the oil; i.e., the high water content and AN (see Table 1). Water content and acid number typically affect the corrosive behavior of oils.
A comparison of iron concentrations in the oil samples after 10 days of immersion was made using spectrophotometry, inductively coupled plasma-optical emission spectrometry (ICP-OES), and inductively coupled plasma-mass spectrometry (ICP-MS). As shown in Figure 3, the iron concentrations measured with the spectrophotometric method corresponded well with those measured with ICP-OES and ICP-MS. Since the results for one and the same oil using the three methods were of the same level, the spectrophotometric method was selected for the subsequent experiments as it is a relatively cheap method and, according to the two other methods, provided reliable results.

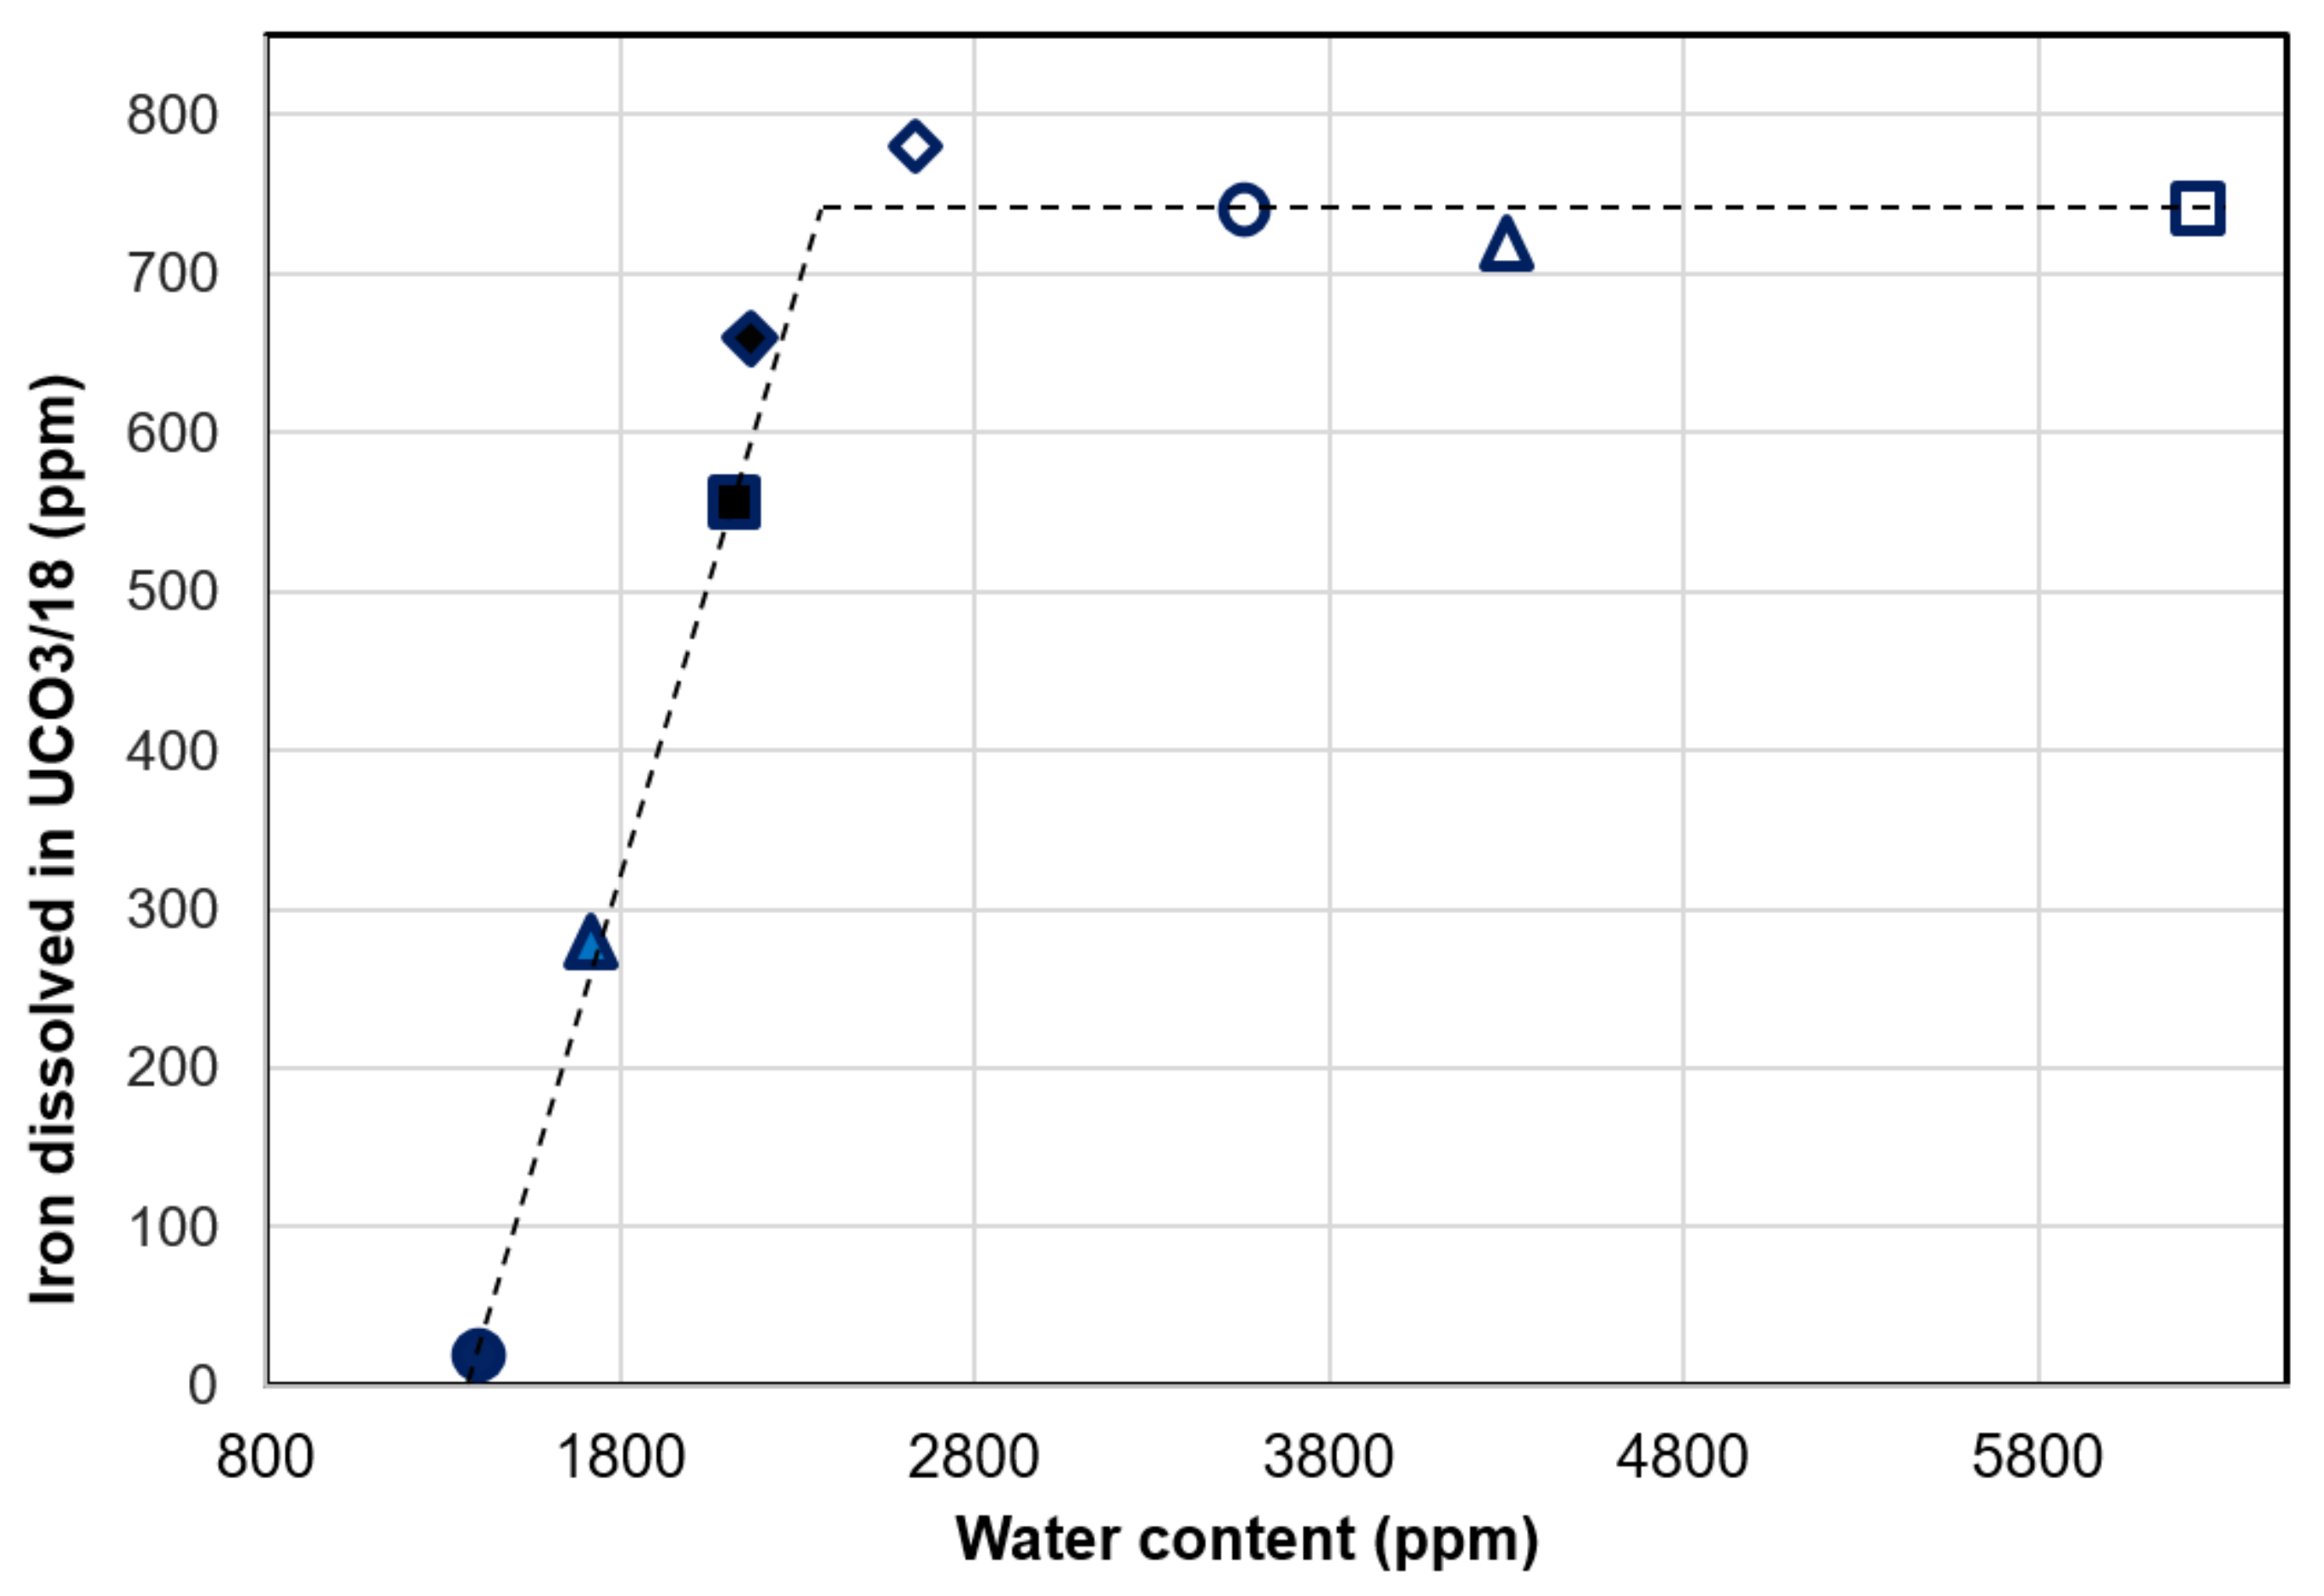
3.4. Effect of Water Content

The effect of water content of the bio-oils on the concentration of dissolved iron was investigated using the UCO3/18 sample. An amount of 240–5130 ppm water was added to an oil sample of 50 g and the concentration of dissolved iron was measured spectrophotometrically after three days of immersion. Water content measurements were conducted using the Karl Fischer (KF) titration method. The concentration of iron as a function of the water content in the oil is shown in Figure 4. Iron in the oil increased with the water content up to around 2600 ppm, after which the iron concentration was constant, thus indicating saturation as shown in Figure 4. In general, the water content of the bio-oils has shown to have a direct effect on the amount of iron dissolved, thus enhancing the corrosive property of the bio-oils.

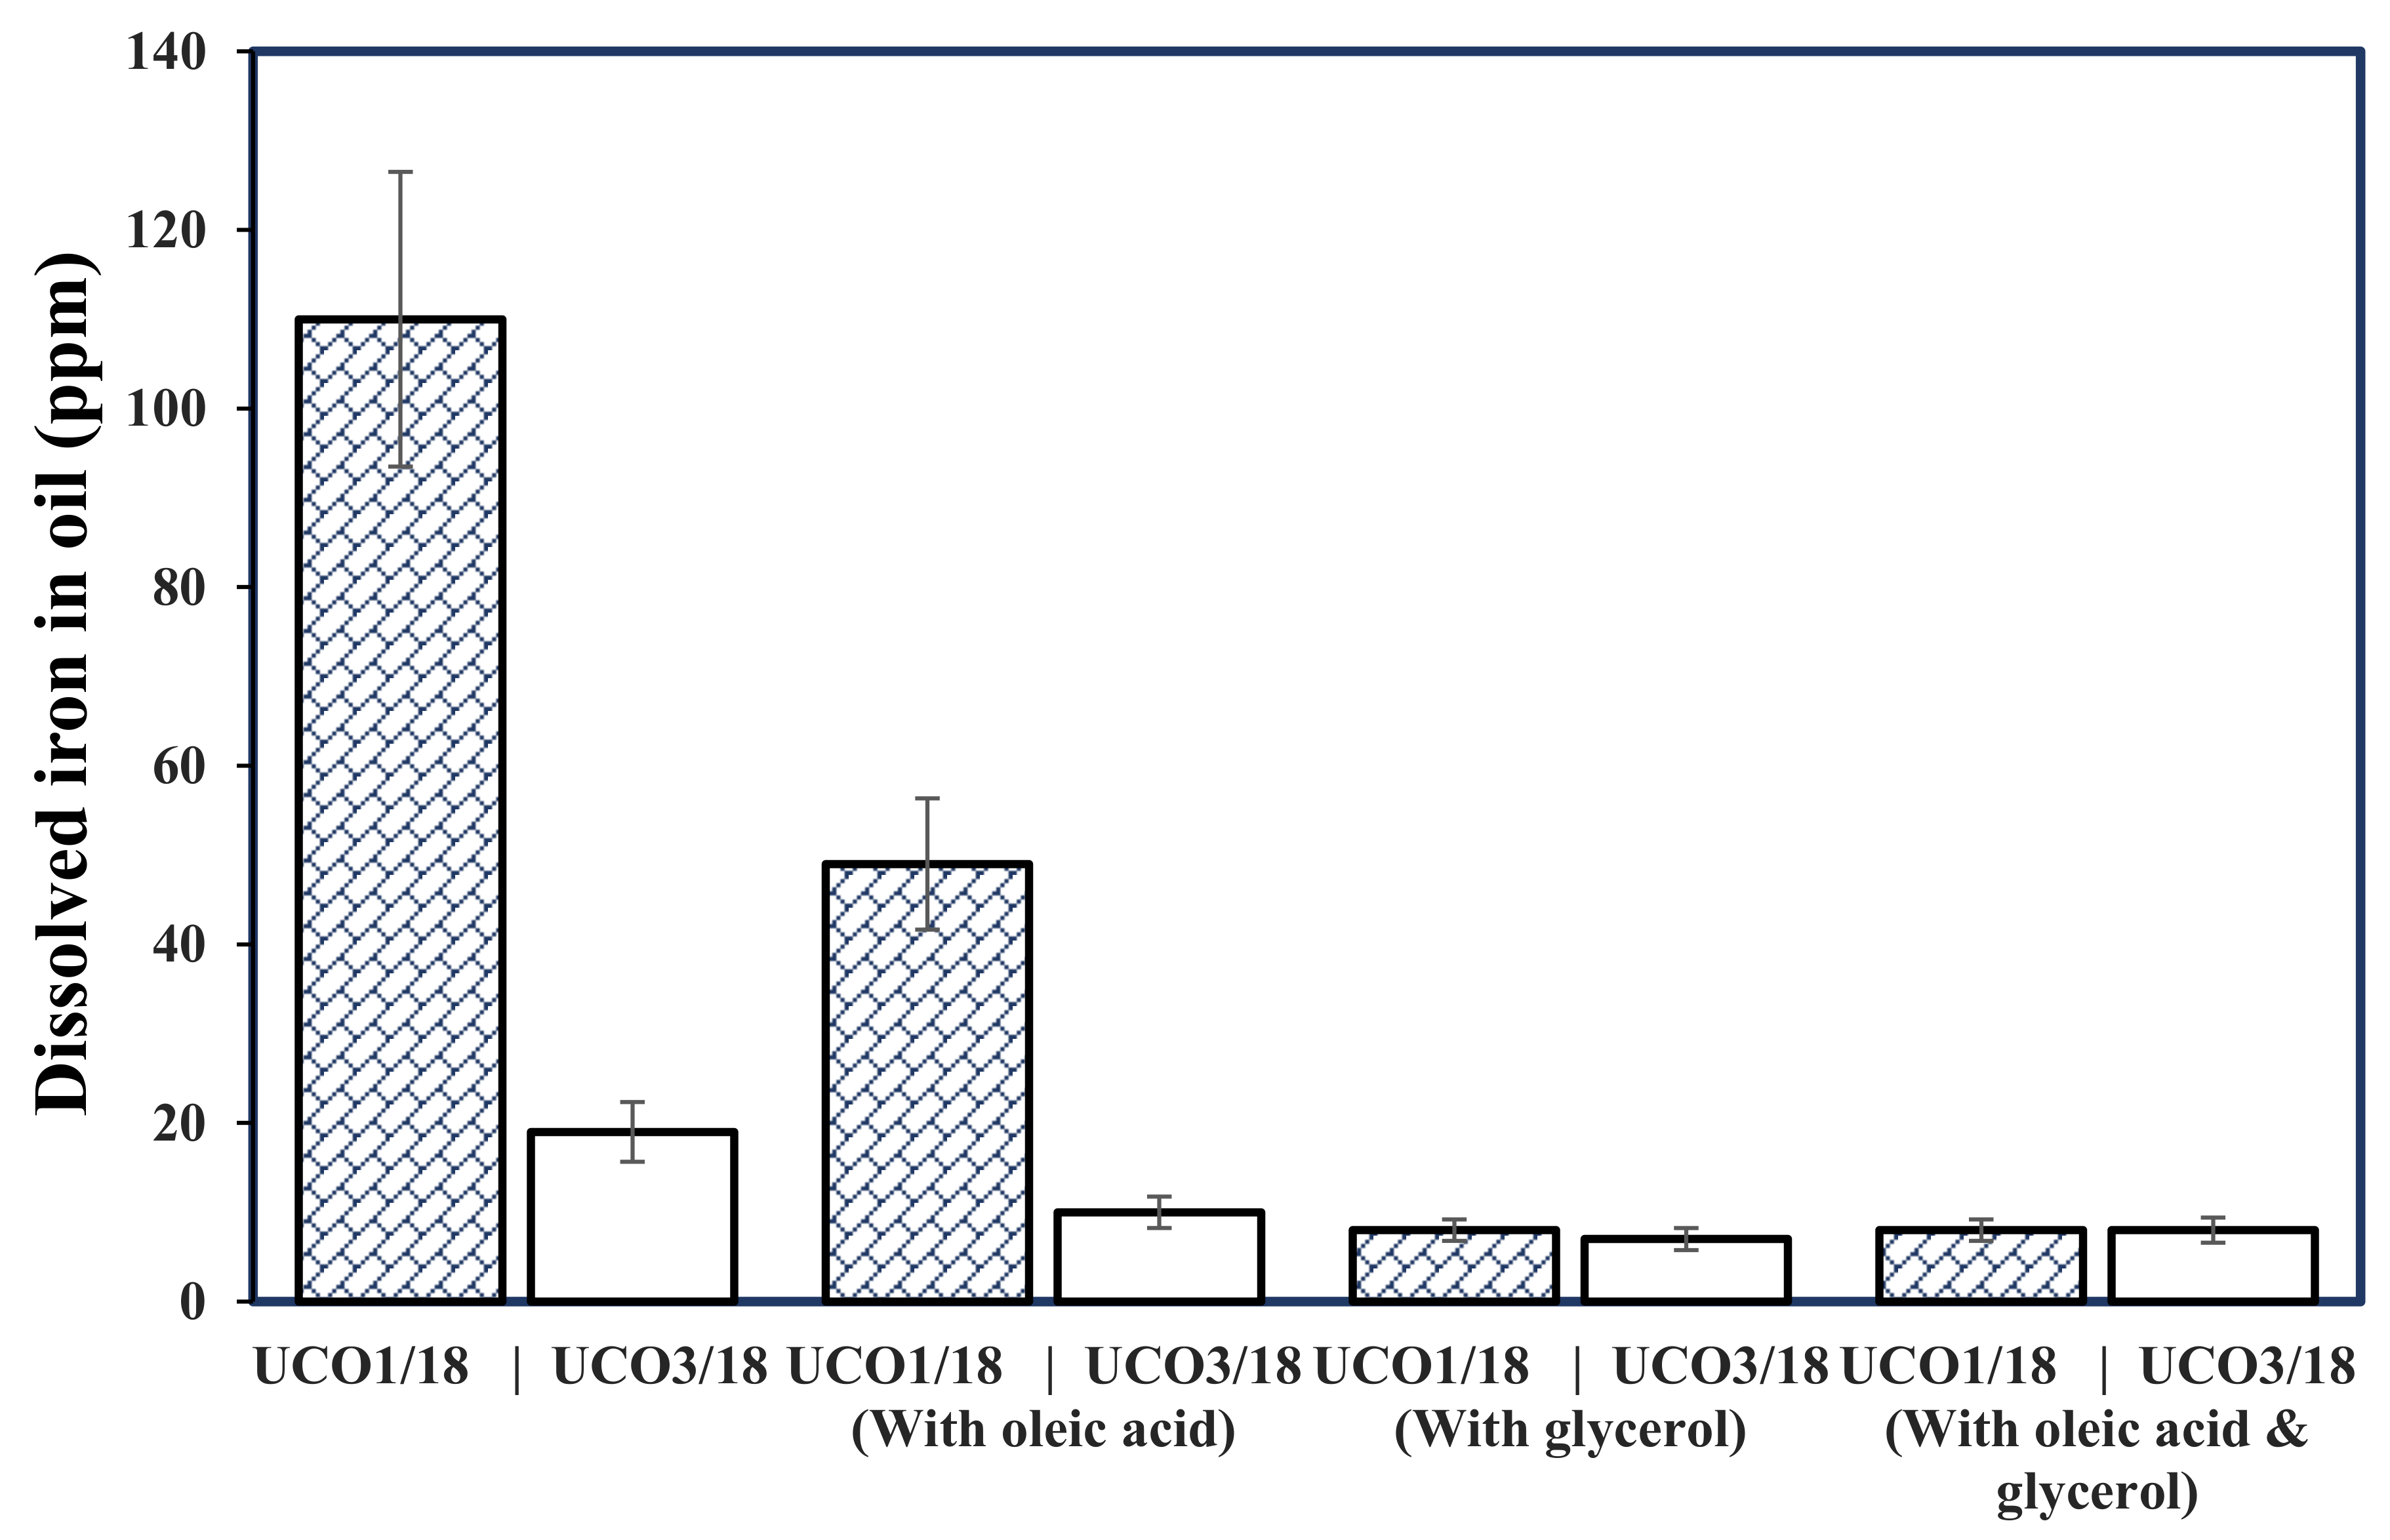
3.5. Effect of Oleic Acid and Glycerol

The effect of oleic acid and glycerol on the amount of dissolved iron after three days of immersion of iron was investigated using the UCO1/18 and UCO3/18 oils (see Figure 5). For this study, oleic acid (21 mg/g oil) and glycerol (2.31 mg/g oil) were added to give the total units 50 mg/g oil of free fatty acids for UCO1/18 and 68 mg/g oil for UCO3/18. In addition, the combined effect of oleic acid and glycerol (3:1 molar ratio) on the amount of dissolved iron in the UCOs was investigated. According to Figure 5, the addition of oleic acid resulted in a 57% reduction of dissolved iron in both UCOs. Despite a significant reduction in the concentration of iron, the acid number of the used cooking oils was found to increase by almost 50% due to the addition of oleic acid. In contrast to the trends seen for the acid number and water content of the original oils (Table 1), an increase in the acid number did not enhance the dissolution of iron in the oils with added oleic acid. It was assumed that the active surface group in oleic acid had formed a protective film layer at the surface of the iron rod (see Figure 6). The self-assembled monolayer might furthermore prevent corrosion by inhibiting the permeation of both water and oxygen, thus protecting the metal surface from the exposure to the corrosive environment. This is also in agreement with results from the literature according to which surfactants such as oleic acid can be used for protection against corrosion, owing to their ability to form monolayers on the surface of metals [26]. However, it is worth noting that at very low concentrations of oleic acid/surfactants, adsorption of the corrosion inhibitor might be insufficient to form a monolayer, thus allowing corrosion to occur.
The addition of glycerol showed a more profound effect than oleic acid, resulting in 92% and 63% reduction in the amount of dissolved iron in UCO1/18 and UCO3/18, respectively, as shown in Figure 5. This can be due to the fact that glycerol is miscible in water and through microemulsions keeping the water away from the iron rod [27]. The combined effect of oleic acid and glycerol resulted in comparable values of dissolved iron to those obtained when glycerol was used without oleic acid. Besides its binding effect toward water molecules, glycerol can form microemulsion in the presence of a surfactant such as oleic acid [27]. The formation of a microemulsion produces a thermodynamically stable dispersion system that might have less risk of phase separation in the long term use of bio-oils. It has also been reported that blending glycerol into diesel or gasoline through microemulsification reduced problems associated with stand-alone glycerol fuel use [28,29]. Moreover, glycerol-in-diesel emulsion performed well without fail while showing positive effects on the reduction of unwanted combustion emissions [28,29]. In general, both oleic acid and glycerol considerably reduced the amount of iron dissolved in the oil phase; however, a more predominant effect was observed with glycerol than with oleic acid when protecting the iron rod from corrosion.

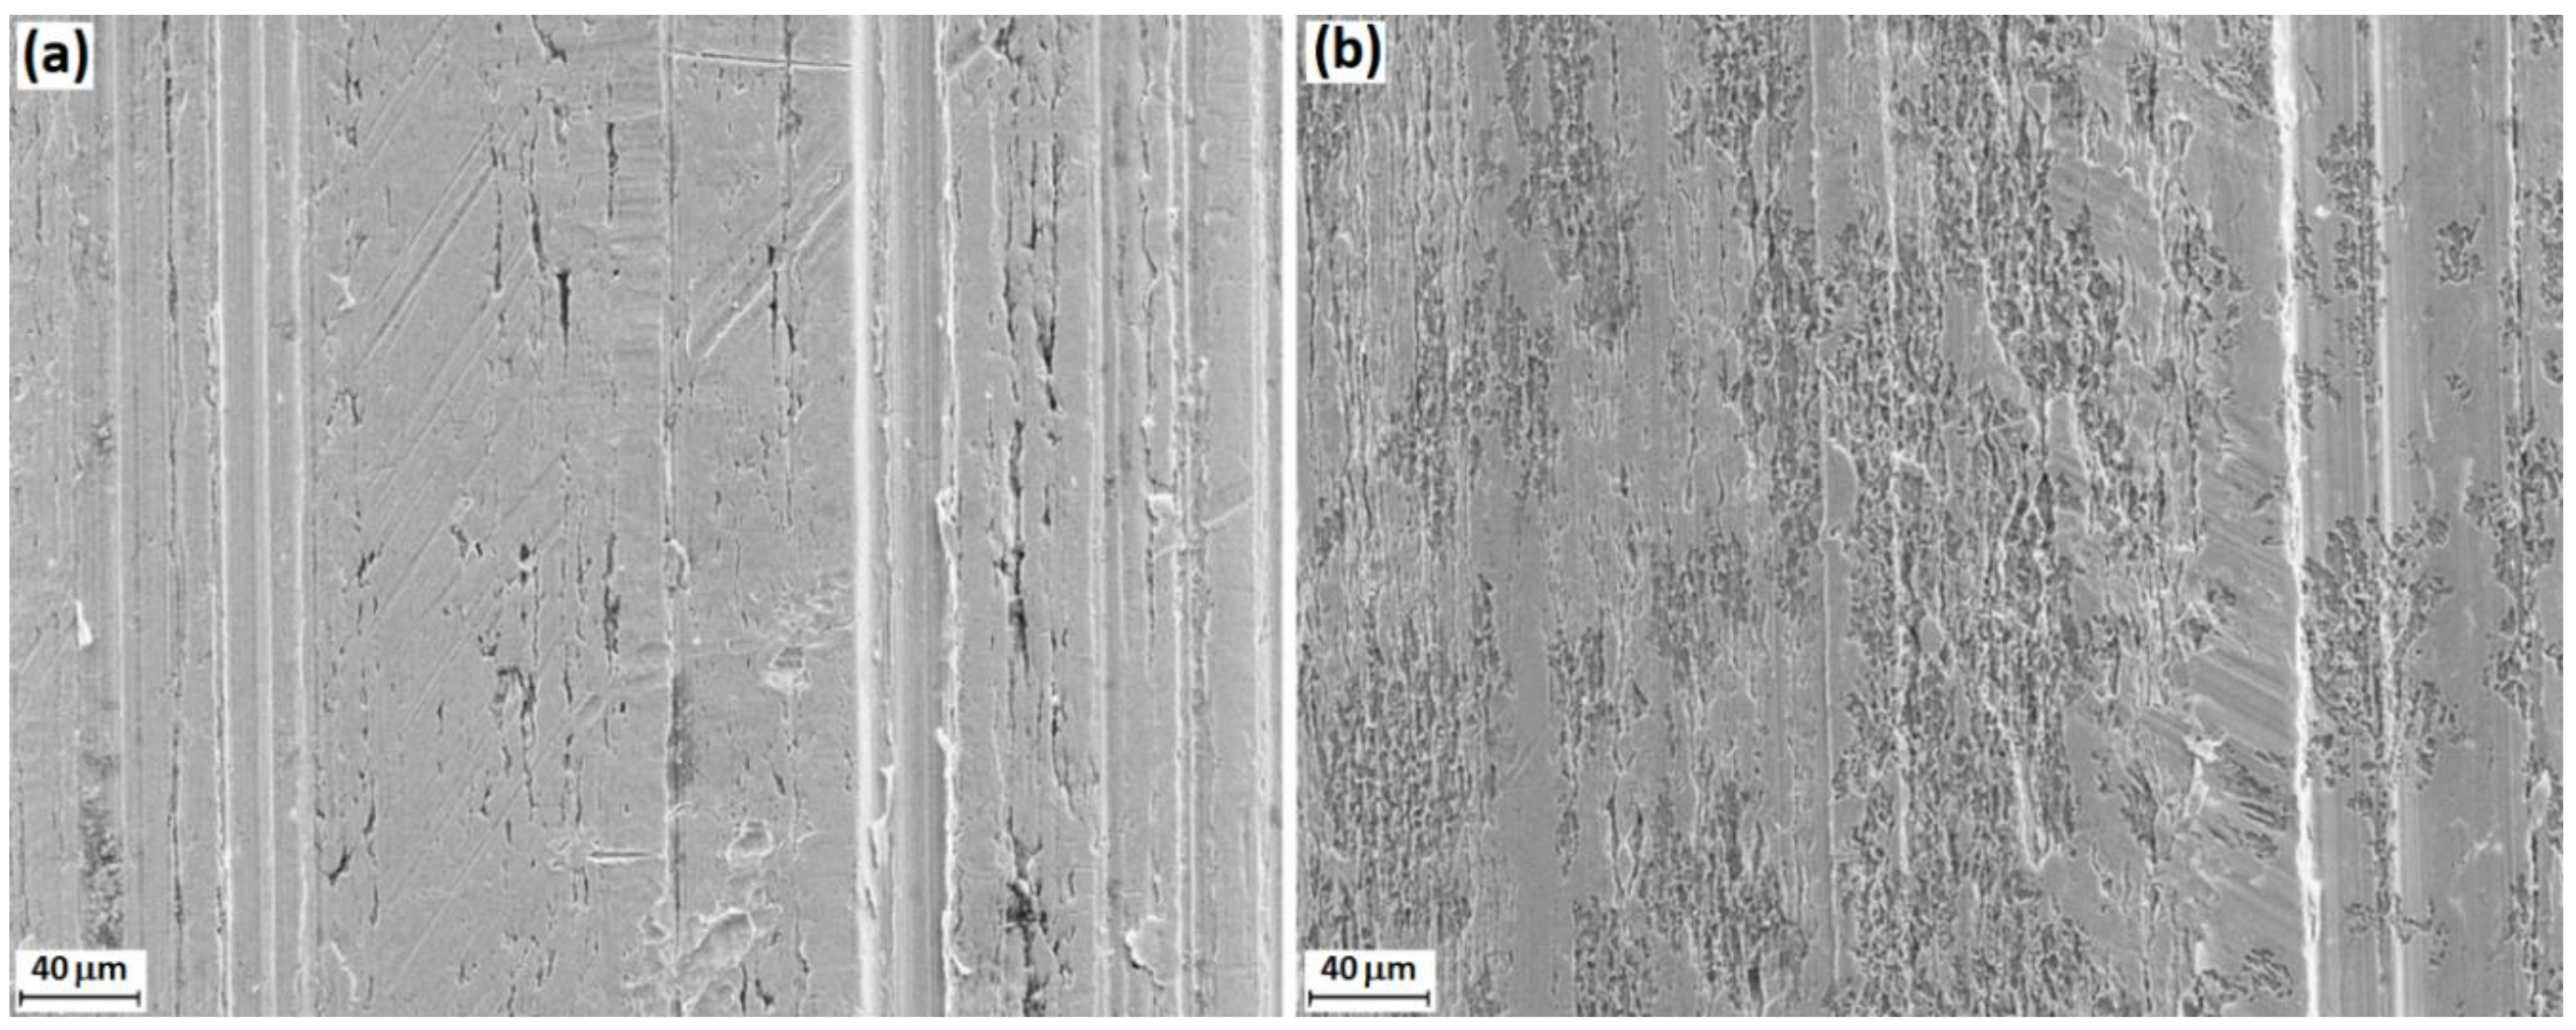
3.6. SEM-EDS Analysis

The SEM images in Figure 7 shows the surface morphology of the original rod and the corroded iron rod after 10 days of exposure to UCO1/18. Figure 7b does not show any large pits and thus suggests a rather uniform corrosion of the rod surface. The iron rod used is a common low carbon steel with a composition of 98.64 wt.% Fe. Future experimental investigations may reveal the effects of different compositions of the test rod on the corrosivity of the bio-oils.

4. Conclusions

The corrosion behavior of used vegetable cooking oils and a non-edible fish oil was investigated by an immersion test with an iron rod at room temperature. A prolonged immersion time, in general, resulted in an increased amount of dissolved iron. The effect of increased water content of the bio-oils on the concentration of dissolved iron was investigated using one of the bio-oils with added water between 240 and 5130 ppm. The results from three days of immersion testing indicated that the amount of dissolved iron in the oil increased with the water content up to 2600 ppm, after which more iron did not dissolve further.
The addition of oleic acid and glycerol had a clear effect in preventing the iron dissolving into the oil. However, the addition of glycerol showed a more profound effect than oleic acid, resulting in up to a 92% reduction in the amount of dissolved iron in the different samples of the used cooking oils. This can be attributed to the characteristics of glycerol to bind water molecules and keep them away from the iron rod surface, thus preventing corrosion. The results also suggest that the blending of glycerol through microemulsification could be a promising approach for reducing problems associated with the corrosive properties of the crude bio-oils.
Water content, acid number, and the overall oil composition were observed to have substantially affected the corrosive behavior of the oils. Among the tested oils, the fish oil and the reference commercial product showed the highest and lowest amounts of dissolved iron, respectively. In general, the dissolved iron concentrations measured spectrophotometrically were in good agreement with those measured by the ICP-OES and ICP-MS techniques. The results observed in this work imply that the immersion test of a low carbon iron rod can be used as a reliable and cost-effective method to compare the corrosive properties of crude bio-oils as well as other biofuels.

Supplementary Materials

The following are available online at https://www.mdpi.com/1996-1073/12/24/4812/s1: Table S1: Composition of used cooking oil samples (0 d and 10 d samples) measured with gas chromatography (mg/g oil). n.d. is not detected (<0.02 mg/g oil); Table S2: Composition of fish oil samples (FO1/18/0 d, FO1/18/10 d), measured with gas chromatography (mg/g oil). n.d. is not detected (<0.02 mg/g oil).

Author Contributions

Conceptualization, N.B. and L.H.; methodology, N.B. and J.H.; formal analysis, N.B., A.G.D. and J.H.; investigation, N.B., A.G.D., J.H. and F.T.; writing—original draft, N.B. and A.G.D.; writing—review & editing, F.T. and L.H.; supervision, F.T. and L.H.; project administration, L.H.; funding acquisition, N.B., L.H. and F.T.

Funding

This research was funded by the Swedish Cultural Foundation in Finland, Business Finland, the European Regional Development Fund INKA SmartResearch project (decision no. 4690/31/2014), the scholarship programme by the Johan Gadolin Process Chemistry Centre at Åbo Akademi University, and the Academy of Finland project “Thermodynamic investigation of complex inorganic material systems for improved renewable energy and metals production processes” (decision no. 311537). The APC was funded by Åbo Akademi University. VG EcoFuel Oy and Neste Oyj are gratefully acknowledged for providing the oil samples.

Conflicts of Interest

The authors declare no conflicts of interest.

References

  1. Haseeb, A.S.M.A.; Masjuki, H.H.; Ann, L.J.; Fazal, M.A. Corrosion characteristics of copper and leaded bronze in palm biodiesel. Fuel Process. Technol. 2010, 91, 329–334. [Google Scholar] [CrossRef]
  2. Ma, F.; Hanna, M.A. Biodiesel production: A review. Bioresour. Technol. 1999, 70, 1–15. [Google Scholar] [CrossRef]
  3. Daggett, D.; Hadaller, O.; Hendricks, R.; Walther, R. Alternative Fuels and Their Potential Impact on Aviation; (Technical Memorandum; NASA/TM-2006-214365); NASA: Cleveland, OH, USA, 2006. [Google Scholar]
  4. Preto, F.; Zhang, F.; Wang, J. A study on using fish oil as an alternate fuel for conventional combustors. Fuel 2008, 87, 2258–2268. [Google Scholar] [CrossRef]
  5. Ushakov, S.; Valland, H.; Aesoy, V. Combustion and emissions characteristics of fish oil fuel in a heavy duty diesel engine. Energy Convers. Manag. 2013, 65, 228–238. [Google Scholar] [CrossRef]
  6. Munoz, R.A.A.; Fernandes, D.M.; Santos, D.Q.; Barbosa, T.G.G.; Sousa, R.M.F. Biodiesel: Production, Characterization, Metallic Corrosion and Analytical Methods for Contaminants. Biodiesel Feed. Prod. Appl. 2012, 48. [Google Scholar] [CrossRef] [Green Version]
  7. Johnston, P.A.; Brown, R.C. Evaluation of Bio-oil Corrosion Characteristics. In Proceedings of the 2012 AIChE Annual Meeting, Pittsburg, PA, USA, 28 October–2 November 2012. [Google Scholar]
  8. Hau, J.L.; Yepez, O.J.; Torres, L.H.; Vera, J.R. Measuring naphthenic acid corrosion potential with the Fe powder test. Rev. Metal. 2003, 39, 116–123. [Google Scholar] [CrossRef]
  9. Tsuchiya, T.; Shiotani, H.; Goto, S.; Sugiyama, G.; Maeda, A. Japanese standards for diesel fuel containing 5% fame blended diesel fuels and its impact on corrosion. SAE Tech. Pap. 2006, 1, 3303. [Google Scholar] [CrossRef]
  10. Barabás, I.; Todorut, I.-A. Biodiesel Quality, Standards and Properties. In Biodiesel Quality, Emissions and By-Products; InTech: Rijeka, Croatia, 2011; pp. 5–12. [Google Scholar]
  11. Kovács, A.; Tóth, J.; Isaák, G.; Keresztényi, I. Aspects of storage and Determination of bio-oil induced corrosion characteristics of biodiesel. Fuel Process. Technol. 2015, 134, 59–64. [Google Scholar] [CrossRef]
  12. Kaul, S.; Saxena, R.C.; Kumar, A.; Negi, M.S.; Bhatnagar, A.K.; Goyal, H.B.; Gupta, A.K. Corrosive behaviour of biodiesel from seed oils of Indian origin on diesel engine parts. Fuel Process. Technol. 2007, 88, 303–307. [Google Scholar] [CrossRef]
  13. Maru, M.M.; Lucchese, M.M.; Legnani, C.; Quirino, W.G.; Balbo, A.; Aranha, I.B.; Costa, L.T.; Vilani, C.; DeSena, L.A.; Damasceno, J.C.; et al. Biodiesel compatibility with carbon steel and HDPE parts. Fuel Process. Technol. 2009, 90, 1175–1182. [Google Scholar] [CrossRef]
  14. Diaz-Ballote, L.; Lopez-Sansores, J.F.; Maldonado-Lopez, L.; Garfias-Mesias, L.F. Corrosion behaviour of aluminium exposed to a biodiesel. Electrochem. Commun. 2009, 11, 41–44. [Google Scholar] [CrossRef]
  15. Fazal, M.A.; Haseeb, A.S.M.A.; Masjuki, H.H. Comparative corrosive characteristics of petroleum diesel and palm biodiesel for automotive materials. Fuel Process. Technol. 2010, 91, 1308–1315. [Google Scholar] [CrossRef]
  16. Bruun, N.; Khazraie Shoulaifar, T.; Hemming, J.; Willför, S.; Hupa, L. Characterization of waste bio-oil as an alternate source of renewable fuel for marine engines. J. Biofuels 2019, 1–10. [Google Scholar] [CrossRef]
  17. Stookey, L.L. Ferrozine—A new spectrophotometric reagent for iron. Anal. Chem. 1970, 42, 779–781. [Google Scholar] [CrossRef] [Green Version]
  18. Swinehart, D.F. The Beer-Lambert Law. J. Chem. Educ. 1962, 39, 333–335. [Google Scholar] [CrossRef]
  19. Canakci, M.; Sanli, H. Biodiesel Production from various feedstocks and their effects on the fuel properties. J. Ind. Microbiol. Biotechnol. 2008, 35, 431–441. [Google Scholar] [CrossRef] [PubMed]
  20. Choi, C.Y.; Reitz, R.D. A numerical analysis of the emissions characteristics of biodiesel blended fuels. J. Eng. Gas Turb. Power 1999, 121, 31–37. [Google Scholar] [CrossRef]
  21. Wexler, H. Polymerization of drying oils. Chem. Rev. 1964, 64, 591–611. [Google Scholar] [CrossRef]
  22. European Biomass Industry Association. Transformation of used cooking oil into biodiesel: From waste to resource. In UCO to Biodiesel 2030; EUBIA: Brussels, Belgium, 2015. [Google Scholar]
  23. Ollus, R.; Juoperi, K. Alternative Fuels Experiences for Medium-Speed Diesel Engines. In Proceedings of the 25th CIMAC Congress on Combustion Engine Technology, Vienna, Austria, 21–27 May 2007; International Council on Combustion Engines: Frankfurt, Germany, 2007. [Google Scholar]
  24. Mohan, D.; Pittman, C.U., Jr.; Steele, P.H. Pyrolysis of wood/biomass for bio-oil: A critical review. Energy Fuels 2006, 20, 848–889. [Google Scholar] [CrossRef]
  25. Juoperi, K.; Ollus, R. Alternative fuels for medium-speed diesel engines. Wärtsilä Tech. J. 2008, 1, 24–28. [Google Scholar]
  26. Komatsu, D.; Souza, E.C.; de Souza, E.C.; Canale, L.C.F.; Totten, G.E. Effect of Antioxidants and Corrosion Inhibitor Additives on the Quenching Performance of Soybean Oil. Stroj. Vestn. J. Mech. Eng. 2010, 56, 121–130. [Google Scholar]
  27. Leng, L.; Yuan, X.; Zeng, G.; Chen, X.; Wang, H.; Li, H.; Fu, L.; Xiao, Z.; Jiang, L.; Lai, C. Rhamnolipid based glycerol-in-diesel microemulsion fuel: Formation and characterization. Fuel 2015, 147, 76–81. [Google Scholar] [CrossRef]
  28. Eaton, S.J.; Harakas, G.N.; Kimball, R.W.; Smith, J.A.; Pilot, K.A.; Kuflik, M.T. Formulation and combustion of glycerol–diesel fuel emulsions. Energy Fuels 2014, 28, 3940–3947. [Google Scholar] [CrossRef]
  29. Mize, E.; Lucio, A.J.; Fhaner, C.J.; Pratama, F.S.; Robbins, L.A.; Karpovich, D.S. Emulsions of crude glycerin from biodiesel processing with fuel oil for industrial heating. J. Agric. Food Chem. 2013, 61, 1319–1327. [Google Scholar] [CrossRef] [PubMed]
Figure 1. Experimental setup of the immersion test.
Energies 12 04812 g001
Figure 2. The effect of immersion time on the amount of iron dissolved in the oil samples. Iron concentration was measured spectrophotometrically.
Energies 12 04812 g002
Figure 3. Comparison of dissolved iron from the rods in the experimental and reference oils after 10 days of immersion using different analysis methods.
Energies 12 04812 g003
Figure 4. The amount of dissolved iron versus different water contents of used cooking oils (UCO) 3/18 sample after three days of immersion test. The initial water content of the UCO3/18 sample was 1400 ppm.
Energies 12 04812 g004
Figure 5. The effect of addition of oleic acid and glycerol on the amount of dissolved iron in the UCO1/18 and UCO3/18 oils during three days of immersion test.
Energies 12 04812 g005
Figure 6. Formation of a monolayer on a ferrous surface. Adapted from [26].
Energies 12 04812 g006
Figure 7. SEM images of (a) original surface and (b) corroded surface of the iron rod after 10 days of exposure to UCO1/18.
Energies 12 04812 g007
Table 1. Physicochemical properties of the bio-oils and a commercially available product.
SampleDensity 21 °C (kg/m3)Kinematic Viscosity 40 °C (mm²/s)Water Content (ppm)Acid Number (mg KOH/g Oil)
UCO1/1891640.716626.5
UCO2/1891740.714498.2
UCO3/1891640.314038.1
FO1/1891626.6247324.8
COref8738.9370.02
COref *8799.1<100<0.10
* From manufacturer’s specification.
Table 2. Comparison of changes in the composition of the original used cooking oils and fish oil samples after 10 days of contact with an iron rod. n.d. is not detected. FFA is free fatty acid.
SampleTotal FFA (mg/g Oil)Diglycerides (mg/g Oil)Polymerized Triglycerides (%)
UCO1/18/0 d29.17.081.17
UCO1/18/10 d33.77.551.50
UCO2/18/0 d43.37.651.28
UCO2/18/10 d45.27.831.40
UCO3/18/0 d46.87.651.34
UCO3/18/10 d47.07.751.34
FO1/18/0 d99.79.70n.d.
FO1/18/10 d93.910.30n.d.

