Defining and Evaluating Use Cases for Battery Energy Storage Investments: Case Study in Croatia


1
Faculty of Electrical Engineering and Computing, University of Zagreb, Unska 3, 10000 Zagreb, Croatia
2
Croatian Power Utility (Hrvatska Elektroprivreda d.d.), Ulica grada Vukovara, 10000 Zagreb, Croatia
*
Author to whom correspondence should be addressed.
Energies 2019, 12(3), 376; https://doi.org/10.3390/en12030376
Submission received: 31 December 2018
/
Revised: 21 January 2019
/
Accepted: 21 January 2019
/
Published: 24 January 2019
(This article belongs to the Special Issue 10 Years Energies - Horizon 2028)
Abstract
:Battery energy storage systems (BESS) and renewable energy sources are complementary technologies from the power system viewpoint, where renewable energy sources behave as flexibility sinks and create business opportunities for BESS as flexibility sources. Various stakeholders can use BESS to balance, stabilize and flatten demand/generation patterns. These applications depend on the stakeholder role, flexibility service needed from the battery, market opportunities and obstacles, as well as regulatory aspects encouraging or hindering integration of storage technologies. While developed countries are quickly removing barriers and increasing the integration share of BESS, this is seldom the case in developing countries. The paper identifies multiple case opportunities for different power system stakeholders in Croatia, models potential BESS applications using real-world case studies, analyzes feasibility of these investments, and discusses financial returns and barriers to overcome.
1. Introduction
Renewable energy sources (RES) have been the backbone of the power system transition over the past two decades. Currently, their integration and connection at the transmission level could be seen as a well-established and mature technology. However, since the economics of RES ineffectiveness of curtailing their output to provide flexibility [1], most of the systems still rely on centralized fossil-fueled or hydro-power plants to provide services required to maintain stable power system operation. The arising question is how to uphold their further growth in the coming period of decommissioning the old and large power plants. The idea is to find the missing flexibility through the usage of new flexible sources, i.a. energy storage. Although there are various energy storage technologies being developed, this paper focuses on battery energy storage systems (BESS).
BESS is experiencing a flourishing implementation thorough multiple stakeholders ranging from private end-users, through distribution and transmission system operators to large power plant operators. Governments worldwide stimulate new investments into BESS to preserve security of the future power system. Different strategies and different applications push the BESS market. The State of California is one of the pioneers when it comes to public support of energy storage technologies. Energy storage and RES policies are coupled [2] and 2045 is set as the target year where the entire state will be carbon-free. However, at the moment the carbon-free operation creates new challenges to power system operation, such as the famous duck curve caused by massive solar penetration [3], where steep ramp requirements occur during morning increase of PV generation, as well as during the evening decrease of PV generation accompanied with the increase in end-user demand. These technical challenges could be smoothed by integration of BESS units. There are many other where developed countries are embracing BESS to improve system flexibility and enhance the integration of RES. In Germany there is a significant number of newly installed BESS dedicated to provision of primary reserve control [4]. In United Kingdom generation adequacy poses a significant challenge, which created an investment opportunity for BESS to take part in the capacity market [5]. Specific stability and adequacy requirements in Australian power system, where high integration of RES combined with several weather conditions caused blackouts over the past couple of years, created the need for alternative solutions such as BESS. The largest li-ion battery (100 MW/129 MWh) was installed in 2017 and coupled with a wind power plant providing security of supply, reserves, and balancing services [6]. An interesting example of BESS being used for voltage support, frequency support, reserves, and black start can be found in Fairbanks, Alaska [7]. A nickel-cadmium battery can provide 27 MW power during 15 minutes until the backup diesel generators starts up.
1.1. Literature Review
A significant number of research papers over the past decade study and analyze potential cases for integration of BESS. In general, they can be classified in two categories. The more common one is where BESS models are analyzed on artificial test systems considering different power networks, from 6-bus test systems [8] to a well-known IEEE RTS–96 system [9] that considers three areas with 24 buses. These artificial systems were developed due to the need for a standardized database to test and evaluate the developed methodologies at the global level. With a considerable integration of RES these test systems are modified to adopt specific policy targets, e.g., [10]. These modifications are usually performed to realistically model integration of new technologies and their capability to increase the flexibility of the power system [11]. The other type are the models tested on real power system data, often referred to as business case models or real-world models.
Even though the research results suggest there are many benefits that can be provided with integration of BESS, their widespread use has been limited due to high investment costs, regulatory barriers, and market design. These problems are analyzed at the global level in [12], where the authors provide an international overview of policies, regulations, and market challenges on the integration of BESS. The importance of making significant changes to the current regulatory and electricity market arrangements are recognized as the main obstacle for increasing the integration of BESS. A similar comprehensive review, but at a national level, and possible framework for integration of BESS into the power system of the Netherlands is presented in [13]. The authors explain the most relevant regulatory barriers, such as lack of net metering, lack of legal classification of BESS, double taxation, no definition for BESS as an RES, prohibition of Transmission System Operator (TSO) and Distribution System Operator (DSO) ownership, lack of regulatory framework for provision of network investments deferral, as well as market barriers, such as minimum capacity of 1 MW to be able to make bids, availability requirements, and limiting the price spread. The authors also show an average feasibility scores for locations, applications, and technologies in the Dutch electricity sector. Finally, they conclude that the increase in profitability when stacking multiple applications depends on the synergy and lack of conflicts among the bundled applications.
BESS applications can be classified as: (i) system-level applications, (ii) network-level applications, (iii) end-user applications, as in [14].
The most researched system-level application of BESS is energy arbitrage. The methodology in [15] presents a determination of the size and location of BESS devices modeled for spatio-temporal energy arbitrage. The results are obtained on a realistic 240-bus 448-line model of the Western Electricity Coordinating Council (WECC) and indicate that the profitability of investment in BESS depends on the proportion of renewable generation, penalties for curtailing RES and investment costs. Potential of energy arbitrage was investigated in [16] during the period 2009–2013 for the balancing market in Finland due to price peaks three to six times higher than at Elspot. However, even in those scenarios the authors could not find an economically sound case by using only energy arbitrage at both markets. They concluded that pumped hydro storage benefits more than battery (up to 64% in the balancing market). Their models show that the optimal storage size of pumped hydro storage is 6 h of discharge time while for batteries this is reduced to only 2 h. Impacts of different storage use strategies on the future power systems of Morocco and Egypt are analyzed in [17], where pumped hydro storage plant was selected as the representative storage technology. The results show a clear benefit of adding storage, both in terms of economics and reduction of wind curtailment. Another approach, in which a BESS is coordinated with wind power plants, is presented in [18] for Italian region of Sicily. The methodology aims to maximize revenue of the wind farm owners. This region is specific due to high volatility of the daily prices, which made energy arbitrage an interesting strategy for wind power plant owners coupled with energy storage. However, after considering degradation, the revenue becomes significantly lower and performing load shifting using energy storage is no longer profitable. A framework in [19] answers the fundamental question of whether society is better off after making an investment into energy storage, focusing on a case study from United Kingdom. The study included the local and system-wide benefits for grid-scale energy storage system at the Leighton Buzzard Primary substation. The cost streams are evaluated through a Monte Carlo simulation. The results are then arranged based on a discounted cash flow to represent a Net Present Social Value (NPSV) of the investment. Almost all energy storage projects installed in 2013 had a negative NPSV, meaning that the battery investment costs should continue to decrease for the projects to have a positive NPSV. This also needs to be supported by technological improvements (such of increased lifespan), reformation of market designs and supportive long-term financial contracts.
Network-level applications are considered in both transmission and distribution networks. BESS connected to the medium-level grid (10 kV) is investigated in [20] to test stacked battery applications, such as frequency control, control of reactive power and voltage, and peak shaving functionality, for the grid of Finland. The results show promising application in frequency control due to the BESS ability to provide a fast response and flexible modification of the control curves. However, the results also show that the BESS could not always perform the desired frequency regulation, which would result in lost revenue in ancillary market services. On the other side, in [21] the authors investigate the effects integration of RES (small solar or wind power plant), hydrogen, and BESS have on security of supply and system stability in small islands. Case study is performed on an Italian small island of Favignana. The results indicate that such BESS can be an adequate and reliable option for increasing energy independence of small islands.
One of the most promising options is the model of an end-user owning the energy storage and this concept is expected to grow exponentially in the future. A simple and effective operation strategy is proposed in [22] for a medium-scale public facility (University of Palermo campus) within the Real-Time Pricing framework (RTP electricity tariffs). The aim of the proposed strategy is to manage electric bills by using load shifting performed with a BESS. The results show that the annual electric bill is decreased by 1000 EUR. Very similar approach is presented in [23] where optimal energy and power capacity of energy storage are determined to minimize electricity bills. A comparison of deterministic, stochastic, and robust formulations is performed using real input data for a hotel in Croatia. It is shown that deterministic and stochastic models result in slightly better investment decisions than the robust model. Other applications of an energy storage connected to non-residential buildings are investigated in [24]. Case studies are tested for the case of UK and the results show that buildings with integrated energy storage could provide balancing services to the grid and respond to real-time electricity prices. The impact of different energy storage strategies was examined for commercial and industrial consumers in [25]. The operation of a BESS is optimized to decrease the peak power and to shift load into off-peak hours. The tests are performed on real data provided by the Hungarian DSO. The results suggest that smaller battery capacity installations have a chance of creating a business opportunity with a single application use. However, larger size battery units should combine other applications, such as reserve supply, power quality support, and ancillary services. Investments in a small photovoltaic (PV) power plant coordinated with a BESS in distribution grid in the city of Belem in Brazil is analyzed in [26]. The case study compares the operation of the PV plant with and without the BESS and shows that investment in ES is still not cost-beneficial. Net present values are negative and cash flow and payback analyses indicate that the investment in any project is up to 17 years, which is not encouraging.
1.2. Paper Positioning and Contributions
Different aspects of energy storage integration have been substantially investigated in the scientific community, especially from the theoretical viewpoint. Also, it can be noticed that case studies have been created for many countries, e.g., UK, the Netherlands, Italy. In developed countries and states, e.g., California, Germany, Australia, the integration of energy storage has already entered the phase of mass deployment. The applications for which the energy storage is used or is planned to be used differ mostly due to local and national requirements and their long-term policies. The above-mentioned countries mostly have highly developed electricity and ancillary services markets and supporting schemes both for RES technologies and energy storage. However, the results of the case studies or real projects cannot be easily translated to developing countries such as Croatia. Numerous features are different from one region to another: grid tariff policies, wholesale electricity price volatility, level of market liberalization, transparency of power system related processes, regulation harmonization, etc. Through discussions with relevant stakeholders of the Croatian and South-East European power system it was noticed that there is a lack of adequate guidelines for planning, operation, ownership, and integration of energy storage. This paper bridges this gap and addresses the potential applications for BESS in Croatia. The paper identifies, from investors perspective, only those applications which could be provided within the existing market and regulatory setup, i.e., addresses currently feasible BESS applications with questionable financial returns. All possible use cases are taken into account and their likelihood and financial merit is identified through collaboration with different stakeholders. It is important to emphasize that the battery prices used in the paper are much higher than the prices found in the literature, e.g., [27], as they are based on actual offers gathered from battery suppliers in Croatia.
Similar to paper [18], one of the cases in this paper (Section 2.1) presents an installation of a BESS near to an existing power plant that could be replaced with a PV power plant in the future. The paper approach in [21] is similar to our cases in Section 2.2 and Section 2.3 with the addition that we contribute with: (i) Section 2.2 targets to ensure N-1 security criterion by installing a BESS, and (ii) Section 2.3 aims at increasing power evacuation from the observed geographical area during the high production of power plans and an outage of a power line. Papers [22,23] deal with a usage of the end-user applications of BESS, very similar as in Section 2.4. However, our paper additionally analyzes collocation of a BESS and a PV under two price scenarios, similar to paper [26]. Finally, decreasing peak power in paper [25] is partially similar to Section 2.5, which actually investigates how BESS minimizes power payments at charging spots of electric vehicles.
2. Battery Energy Storage System Case Studies in Croatia
BESS can be used in a wide range of applications. Some of these can be procured as services through market mechanisms, while others can be a part of grid infrastructure or merchant installations. All these applications can be categorized in three main groups: system-level applications, transmission and distribution grid applications and end-user applications.
System-level applications are services that a BESS can provide to the power system regardless of its location in the system. They are usually analyzed in the context of electricity and ancillary services market participation or power balancing issues. Possible system-level applications are: energy arbitrage, system adequacy, grid balancing, balancing of balance responsible parties, footroom, flexiramp, and virtual inertia. Croatian power system does not have issues with system adequacy, mostly because of its strong grid and interconnections. Power balancing services procurement is still not an open market process and these services are negotiated with large power plants bilaterally. In Section 2.1 the revenues from ancillary services are observed only as fixed revenues that an old thermal power plant Jertovec achieved in the last couple of years. Footroom (in UK) and flexiramp (in US) are novel services in some countries and their implementation is not yet considered in Croatia. The only possible system-wide application in Croatia is energy arbitrage through Croatian Power Exchange CROPEX. The case study of energy arbitrage (Section 2.1) in this paper is positioned at the location of an old power plant and coupled with a PV plant to lower the investment costs. The location was chosen after the discussion with the largest Croatian power generation company HEP.
Network-level applications are services specific to the location of the BESS in the grid. BESS can be connected to the transmission or distribution network, depending on its size, function, and local regulations. For example, California ISO (CAISO) in its initiative “Storage as a Transmission Asset” proposed to enable energy storage connected to the transmission network to offer transmission services under a cost-of-service framework. A list of possible network-level applications of BESS acting as a part of the network infrastructure, similar to a line or a transformer, is the following: congestion management in transmission system, grid infrastructure investment deferral, supporting the (N-1) criterion for system stability, voltage and reactive power compensation, black start capability, and minimization of network losses. After the discussion with grid operators (both TSO and DSO), several guidelines have been adopted. In normal grid conditions, the Croatian transmission system does not have noticeable congestion issues. The grid deferral using BESS is not a valid option since most of the grid is oversized and the reconstruction of the grid happens for maintenance reasons when equipment’s end-of-life is near. Voltage issues are mostly dealt with synchronous generators and capacitor banks and there is little interest in doing this by using batteries. Network losses minimization would require in-depth knowledge of real-time grid conditions and Croatian distribution network operator lacks adequate monitoring equipment. An interesting case study for the Croatian grid operators, when it comes to the BESS implementation, is the security of supply increase in the terms of (N-1) criterion or black start capabilities. Two case studies are presented, both dealing with security of supply issues at remote locations: Section 2.2 deals with integration of BESS on an island, while Section 2.3 addresses the integration of a BESS at the peninsula.
End-users in power system include: households (both passive consumers and prosumers), industry, electric vehicle charging stations or battery-swapping stations, conventional power plants, and RES. All of them can benefit from installation of a BESS in terms of cost reduction or increase of the quality and reliability of their power supply. Possible useful applications for a BESS at end-user level are: peak shaving, retail arbitrage, power quality, backup power, hybrid systems (demand/RES balancing and conventional power plant constraint relaxation). Power quality and backup power are often used behind-the-meter BESS applications. Their implementation is not a novel aspect of battery integration and is therefore not discussed in this paper. Section 2.4 analyzes retail arbitrage and peak shaving for a series of different end-users integrated with PVs and batteries. Section 2.5 observes only one specific user, electric vehicle charging spot, where we observe retail arbitrage, peak shaving in operation, and reduction in connection costs. The data and specific notes were acquired from one of the suppliers in Croatia as well as from the Croatian DSO. Overview of the observed case studies is provided in Table 1.
2.1. BESS and PV Collocation at the Location of an Existing Power Plant Jertovec
2.1.1. Power Plant Description
Combined-cycle power plant Jertovec was commissioned in 1954 with the installed capacity of 40 MW. In period from 1954 to 1967 it operated as a base power plant and produced 30% of Croatia’s electricity demand. During the seventies it became a gas turbine power plant acting as an emergency power plant that starts up/ramps up depending on the needs of the system. Power plant Jertovec today consists of two blocks, each with installed capacity of 42 MW (total 84 MW). Each block consists of one gas turbine (30 MW), a gas turbine exhaust boiler, a boiler and a steam turbine driven by a hot steam produced by a boiler (12 MW). Jertovec power plant is fueled by natural gas, while the replacement fuel is extra light oil. Electricity is transmitted by a double 110 kV transmission line connecting three 110 kV transmission lines (Nedeljanec, Resnik, Rakitje) and a 35 kV distribution line to Zelina and Zabok.
Location of Jertovec is interesting due to its proximity to the main consumption center (the capital city of Croatia—Zagreb) to the south, and a three hydro-power plants on river Drava to the north. In periods of higher production, the mentioned network area can become congested. A possible solution to this problem can be installation of a BESS. Since the owner of the three hydro-power plants to the north is HEP Proizvodnja d.o.o., they are the most likely potential investor into a BESS. With the reduction of congestion in the network, the produced energy can be offered in electricity market and sold when it is more profitable for the owner.
On the other side, one of the possible future plans is the installation of a PV power plant at the location of the existing power plant Jertovec, with an addition of a BESS at the same location, as shown in Figure 1. One of the applications of the BESS installed within the PV power plant would be arbitrage. Additionally, the profit can be increased by providing ancillary services.
2.1.2. Cost-Benefit Analysis
Cost-benefit analysis is an important indicator of profitability of the investment in BESS. The technology considered is a lithium-ion battery. The advantage of location Jertovec over any other location is due to decreased initial costs of an installation of the BESS. The total BESS installation costs consist of: (i) cost of connection (direction of production), and/or cost of capacity (direction of consumption); (ii) costs of land; (iii) costs of new transformer station (TS); (iv) costs of BESS. Costs under (i), (ii), and (iii) are avoided if the BESS is installed at location Jertovec since the land, connection point, and TS already exist and do not cause any expenditure. According to Croatian Article 22 from Official Gazette NN 51/2017 (31 May 2017): Remuneration for connection of system for end-user at distribution network is calculated as a product of the base price at the distribution network and installed power according to formula , where is the base price at distribution voltage (HRK/kW), P is an installed power of a new end-user or an amount of added installed power for an existing end-user (kW), and is a remuneration in (HRK) for the connection of a system of end-user to the distribution network. Initial price for location Jertovec is 1350 HRK/kW, which is 181 EUR/kW, while the total costs for different installed capacities of the BESS are shown in Table 2.
The red circle in Figure 1 shows a possible location for installation of the BESS. This location is 73 m long and 55 m wide, which is around 3869 m. If investment options into BESS are 5 MWh, 10 MWh or 20 MWh, this location will be large enough. However, an additional 1200 m are required to install a 50 MWh BESS. We assume discharging/charging rate 1C, meaning that a battery of any size can theoretically be charged or discharged within an hour. Profitability of the BESS is calculated according to the Net Present Value (NPV) using Equation (1) and is shown in Table 2 for case when BESS is/is not located at location Jertovec. The analysis includes possible revenue accumulated by performing arbitrage according to electricity prices in the wholesale electricity market in 2017 in Croatia, and providing ancillary services using BESS instead of the existing power plant Jertovec. These ancillary services include tertiary reserve, black start, and operation on the island mode. Cumulative profit from ancillary services is listed in the third column in Table 3. Assumed BESS efficiency is 0.91. The second column in Table 3 shows cumulative profit from arbitrage in period of next 20 years based on the referent year 2017, while the third column lists revenue from ancillary services. Fourth and fifth columns respectively show the results of NPV if the BESS is not at location Jertovec and when it is at location Jertovec. NPV values are calculated as: total revenue minus the investment costs. As can be seen, all NPV values are negative which means that there is no profitability for investment in the BESS, neither at undefined location, neither at location Jertovec. However, location Jertovec provides significant improvement of the NPV as compared to an undefined location. The assumed price of lithium-ion batteries for this investment is 817 EUR/kWh (this price was obtained by actual vendor offers during 2018). Predictions are that the price will fall in the future, which should make the BESS investment profitable at location Jertovec much sooner than at an undefined location.
2.1.3. Sensitivity Analysis
This section investigates how the price of BESS affects the NPV. The installation cost of BESS is decreased by: (i) 25%, (ii) 50%, and (iii) 75%.
If the price of the BESS is reduced by 25%, it amounts 612 EUR/kWh. With reduction of the BESS installation cost, the NPV values are improved (Table 4), which means that investing in BESS are more beneficial in comparison to the current price. However, the NPVs are still negative even for location Jertovec.
With 50% reduction of the BESS installation cost, the NPV values are further improved. However, only the 50 MW BESS at location Jertovec is profitable as its NPV value is positive (last row in Table 5). The NPV improvement over 100% indicates that the NPV became positive, i.e., that the investment at location Jertovec is profitable while at an undefined location it is not.
The results for 75% reduction in the BESS installation costs are shown in Table 6. The NPVs at an undefined location are still negative, but the NPVs at location Jertovec are all positive, regardless on the BESS capacity. This indicates the value of the reduced investment costs due to the existing infrastructure at location Jertovec.
To sum up this use case, installation of BESS at location Jertovec will significantly decrease installation costs due to an already existing equipment and assets, i.e., TS, location, and connection point. However, after stacking of BESS applications (arbitrage and ancillary service provision) BESS installation still demands significant financial investment. A positive effect is evident after a drop of battery prices, where a positive NPV for a 50 MW battery is achieved at battery cost around 410 EUR/kWh, while smaller installed capacities require further decrease to around 220 EUR/kWh.
2.2. BESS to Ensure N-1 Security Criterion at the Island of Lošinj
2.2.1. Location and Problem Description
Generally, a TSO has a role of ensuring reliable power system operation, as well as performing maintenance, construction, and development of its transmission network. Due to high importance of providing energy supply in power system network, TSO has an obligation to assure that a criterion of N-1 security is met at all times.
The island of Lošinj is in the northern Adriatic Sea, in the Kvarner Gulf, and is a part of the Cres-Lošinj archipelago. What is interesting about this location are specifics in terms of electricity supply, more precisely the extremes that pose challenges to the TSO: high wind speeds of up to 230 km/h, frequent thunderstorms, wind coats of salt sediments on insulation of transmission lines, and large voltage deviations. Very often the island connection with the mainland is menaced or even interrupted. Connections of the island of Lošinj to the mainland and to the surrounding islands (submarine cable connection) is shown in Figure 2. Lošinj is located to the far south-west by a radial line, which indicates that the N-1 criterion is not satisfied.
The analysis of blackouts at the island Lošinj are performed to investigate the economic value of installing a BESS to ensure the N-1 security criterion. The valuation is based on the reduction of both the unserved electricity and the duration of interruption time. These values are quantified using SAIFI and SAIDI indices. SAIFI denotes System Average Interruption Frequency Index and shows the number of interruptions of supplying the end-users. SAIDI is System Average Interruption Duration Index and presents average time of interruptions of supply to an end-user.
Demand curves of the island Lošinj are shown using three representative Wednesdays in Figure 3b: (i) April (minimum load), (ii) July (maximum load), (iii) November (average load). Maximum load occurs during summer, when demand is almost doubled as compared to the winter load. The blackouts are more critical during this period as they impact the touristic season.
The island of Lošinj is connected to the mainland by two radial submarine cables: a 110 kV transmission line and a 35 kV distribution line. If the 110 kV transmission line goes out of the operation, the supply is only possible through the 35 kV distribution submarine cable which whose maximum power rating is 8 MVA. In case when there is no supply through transmission network (110 kV not operational), the security criterion N-1 is not satisfied. However, if the BESS is installed at location Lošinj, the N-1 criterion could be satisfied depending on the capacity of the BESS. TS Lošinj, which supplies the island, is connected to TS Krk by a 5-segmented line (shown in Figure 2): (i) overhead line Krk-Mali Bok, (ii) submarine cable Mali Bok-Merag, (iii) overhead line Merag-Osor 1, (iv) submarine cable Osor 1-Osor 2, (v) overhand line Osor 2-Lošinj.
2.2.2. Cost-Benefit Analysis
The analysis focuses on period between 2011 and 2017. The unplanned blackouts in this period are shown in Table 7 in the second column (base case). Since there is a need to ensure longer period of power supply, the considered type of BESS is sodium-sulfur battery (NaS battery). This type of BESS is often called “energy-intensive” due to their possibility of discharging up to 6 h. The case study analyzes two scenarios: (a) a small capacity BESS and (b) a large capacity BESS. All cases consider possibility of supplying a part of the load using the 35 kV distribution network cable. Small BESS contains one block of NaS battery with power rating 1.2 MW and capacity of 8.6 MWh. This one block can ensure supply of the island Lošinj during short outages of the 110 kV transmission line. The larger BESS includes 7 blocks of NaS batteries with 8.6 MW of power and 60 MWh of capacity. This battery can ensure supply of the island over longer periods of outage of the 110 kV transmission line. The largest unserved load of 210 MWh occurred in 2012 and the second worst year was 2017 with 87 MWh of unserved load. In case of installation of the large BESS, the only energy not served occurs during the long-lasting outages in 2012 and 2017, which result in 45 MWh of unserved energy in 2012 and 24 MWh in 2017. In case of the small BESS, all short-lasting outages in period 2011, 2013–2016 are avoided as well. However, the long-lasting outages are less covered, with amounts of unserved energy in the range of 180 MWh in 2012 and 86 MWh in 2017. As can be seen in Table 7, after the BESS installation, SAIFI indicator is significantly reduced. The larger BESS reduces the number of interruption from 18 to only 4 (small BESS) and 2 (large BESS). However, the small BESS can only marginally improve the SAIDI indicator due to long outages which cannot be dealt with using short-term storage. Even the large BESS cannot avoid one long outage in 2012 and the other in 2017.
The assumed cost of NaS BESS installation is 450 EUR [28]. This results in the small BESS cost around 3.88 million EUR, while for the large BESS costs 27.21 million EUR. The lifetime of batteries is 15 years. If the cost of unserved energy is calculated for the period 2011–2017, it accounts for 3.10 million EUR. Already this can cover the investment cost for the installation of the small BESS. However, the capacity of this BESS unit will not suffice to supply all the unserved demand in this period, as can be seen in Table 7. On the other hand, the large BESS can cover more interruptions, but it costs significantly more. Putting this into the context of investing into a new 110 kV transmission line which can cover all interruptions and costs around 17.77 million EUR, it seems that BESS is not a financially favorable option. However, building a transmission line in this area is very challenging due to demanding type of land, meaning that the installation of BESS in this case can serve as investment deferral to maintain the obligatory N-1 criterion.
In summary, N-1 criterion cannot be entirely satisfied by installation of either the small or the large BESS due to the limited capacity of batteries insufficient to supply the energy during the long-lasting blackouts. However, a BESS could provide investment deferral during the planning period for installation of a new transmission line due to long construction period.
2.3. BESS to Increase Security of Supply in the Region of Istria
2.3.1. Location and Problem Description
Croatian power system is very well connected with the neighboring power systems, namely the power systems of Bosnia and Herzegovina, Slovenia, Hungary, and Serbia. During high discrepancies between production and load, these interconnections may help by evacuating the excess or supplying the deficit of power. Term evacuation here means that the produced power needs to be transferred over the border if it is bought through the electricity market. On the other hand, the term supply here means that power needs to be imported from aboard. The western part of Croatia, Istrian peninsula, is very interesting case for research of ensuring security of supply. Primarily due to a weak connection with Italy. This connection is achieved through a 110 kV transmission line, whose rated power is 70 MW. Italy has a massive consumption that cannot be self-supplied. It is well-known that power flow directions are always towards Italy, and from Croatian point of view these flows go through Istrian peninsula across a 110 kV transmission line. During most of the year this part of power subsystem is stable. However, in periods of high demand, usually during the summer when tourism season has its peaks, and if the local production is very low, there are cases when the operation of Istrian power subsystem may become unstable or even blackouts may occur. We therefore conduct research on the possible application of a BESS to mitigate those concerns. The reason a BESS can be a good solution is that it can consume energy from the grid by process of charging or inject energy into the grid by the discharging process. Furthermore, a BESS consuming energy is equivalent to the process of power evacuation using power lines, and a BESS injecting energy is equivalent to the import of power using power lines. The role of a BESS would be to assist the dispatcher operating the system, who can reconfigure the network and give command to the local power plants in Istria to produce more or less power. The starting point for this theory is a very fast response of the BESS, which needs to play its role in preserving the system operation by the time the power plants start ramping up or down. This type of BESS is called power-intensive batteries and their main representative considered in this use case is a lithium-ion battery due to its fast-response ability [28].
2.3.2. Cost-Benefit Analysis
Table 8 shows the results of eight scenarios simulated in PSS®E software. In the region of Istria, thermal power plant Plomin is under operation. Power plant has two blocks: (i) TEP 1 with maximum power 105 MW, and (ii) TEP 2 with maximum power 210 MW. The exception is the last scenario in which the generation expansion in TEP 1 is considered due to potential adding of a new, which results in its increased capacity of 500 MW. All scenarios are performed when the main double 220 kV line connecting Istria with the rest of Croatia is out of operation. Other two auxiliary ways to evacuate/supply power from/to the Istrian peninsula are: 110 kV Buje-Koper (limited to 70 MW), and 110 kV Plomin-TS Lovran-TS Matulji-TS Pehlin (limited to 90 MW). Location of the BESS installation is not clearly defined, but it can be near the seaside in the western part of the peninsula due to its high consumption during the tourist season. The final capacity of the BESS depends on the considered scenarios in which BESS could help to the system. The scenarios of power injection are III, V, VI, and VII. Each of them results in a blackout of Istria when there is no BESS installed. However, a BESS with installed capacities assigned as in Table 8 prevent blackouts. On the other side, scenarios of power evacuations are I, II, and IV. In the first scenario, a blackout will happen without the installation of battery, while in the second and the fourth scenario the subsystem of Istria will be under critical operation state. Installation of the BESS of assigned capacities will help dispatcher to reconfigure the network and return power system to its normal operating state. Scenario VIII simulates large production in TEP 1, due to assumptions that power production TEP 1 will be increased. In this scenario, because of large amounts of power that needs to be evacuated, only installation of a new transmission line is a real option. Further details and discussion on this case study can be found in [29].
To conclude, installation of a 30 MW power-intensive battery is an optimal solution that could assist the dispatcher when a critical line goes down and during the most of the considered demand/ production scenarios. The installed BESS provides enough time to the dispatcher to change the topology of the power network and take additional actions, i.e., changing the operating points of the local generators, and avoid thus blackout of the power subsystem.
2.4. BESS Behind the Meter
2.4.1. Description of the Case Study
Integration of a BESS behind the meter could provide different services to the end-users. In this use case, the retail arbitrage is chosen as the service with the highest financial gains. End-users have different consumption patterns and inclusion of a BESS inclusion within their installations could be profitable for some while for others it could result in a negative NPV. Also, it is very important how the end-users pay/get paid for their electricity. If retailers provide fixed tariffs, the arbitrage possibilities are lower than in the case where they forward dynamic wholesale prices to their consumers. The last option which could be observed is the possibility for end-users to install PV systems on rooftops. PV generation changes end-users net consumption pattern. In this case, study we investigate eight end-user patterns, seven consumers patterns and one renewable generation pattern (wind power). Each consumer pattern is tested in four configuration cases: (i) demand only, (ii) demand + battery, (iii) demand + PV, and (iv) demand + PV + battery. Also, each of those four configurations will be tested for the fixed retail tariff and the forwarded dynamic wholesale price. The wind power plant will be tested without and with integrated BESS for the case of dynamic wholesale price. The eight observed end-users are:
- (i)
- Household—Measured,
- (ii)
- Household—Equivalent Load,
- (iii)
- Elementary School,
- (iv)
- Shopping Mall,
- (v)
- Water Supply,
- (vi)
- Heavy Industry—Daytime,
- (vii)
- Heavy Industry—Nighttime,
- (viii)
- Wind Power Plant.
2.4.2. Input Data—Consumption and Generation
All calculations in Section 2.4 are conducted for four characteristic seasons and then scaled up to the whole year. PV generation was taken form a real PV system installed in Croatia with installed capacity 11,76 kW. The four-season daily PV curves scaled to 1 kW peak power are displayed in Figure 4a. For each consumer, PV generation is scaled according to their peak demand. Each day in the representative week has the same daily PV generation pattern. Wind power generation for was taken form an actual wind farm in Croatia. Since the wind generation does not have repeating daily patterns, it is been modeled using weekly historic data for four seasons as displayed in Figure 4b. The wind power plant’s peak power is 5 MW.
For the household demand we use two curves: measured and equivalent load. Measured data is from a 10/0.4 kV substation scaled down to a single household, while equivalent load corresponds to the load used by Croatian public supplier to forecast load when no measured data are available. Both have different patterns for four seasons and each season has three curves for different days of week: Workday, Saturday, and Sunday. Peak installed power at households is 5 kW. Figure 5a displays measured data and Figure 5b for equivalent load, autumn period.
All the other observed end-consumers are modeled with real measured data obtained from the Croatian DSO for winter period for three representative days of the week: Workday, Saturday, and Sunday. School, Mall, Water Supply, Industry daytime, and Industry nighttime are chosen because each of them have different features in consumption patterns, which can have strong effect on profitability of a BESS integration. Elementary School is a consumer up to 100 MWh yearly connected to the low-voltage network. Peak installed capacity is 140 kW, while the maximal measured power is 30.21 kW. School demand spans from 5 kW at night to 30 kW in the morning on workday. Workday is characterized with one shift, Saturday with half shift (till noon), and Sunday with minimal consumption. Shopping Mall features annual consumption up to 8000 MWh with connection to the low-voltage network. Peak load is 124.45 kW and demand ranges from 60 kW at night to 120 kW at daytime. The Mall operates in two shifts Monday-Saturday and one morning shift at Sunday. Both the daily work-shift and off-work demand is almost constant with step change at shift/off-shift transition. Figure 6a,b display the patterns for School and Mall end-consumers.
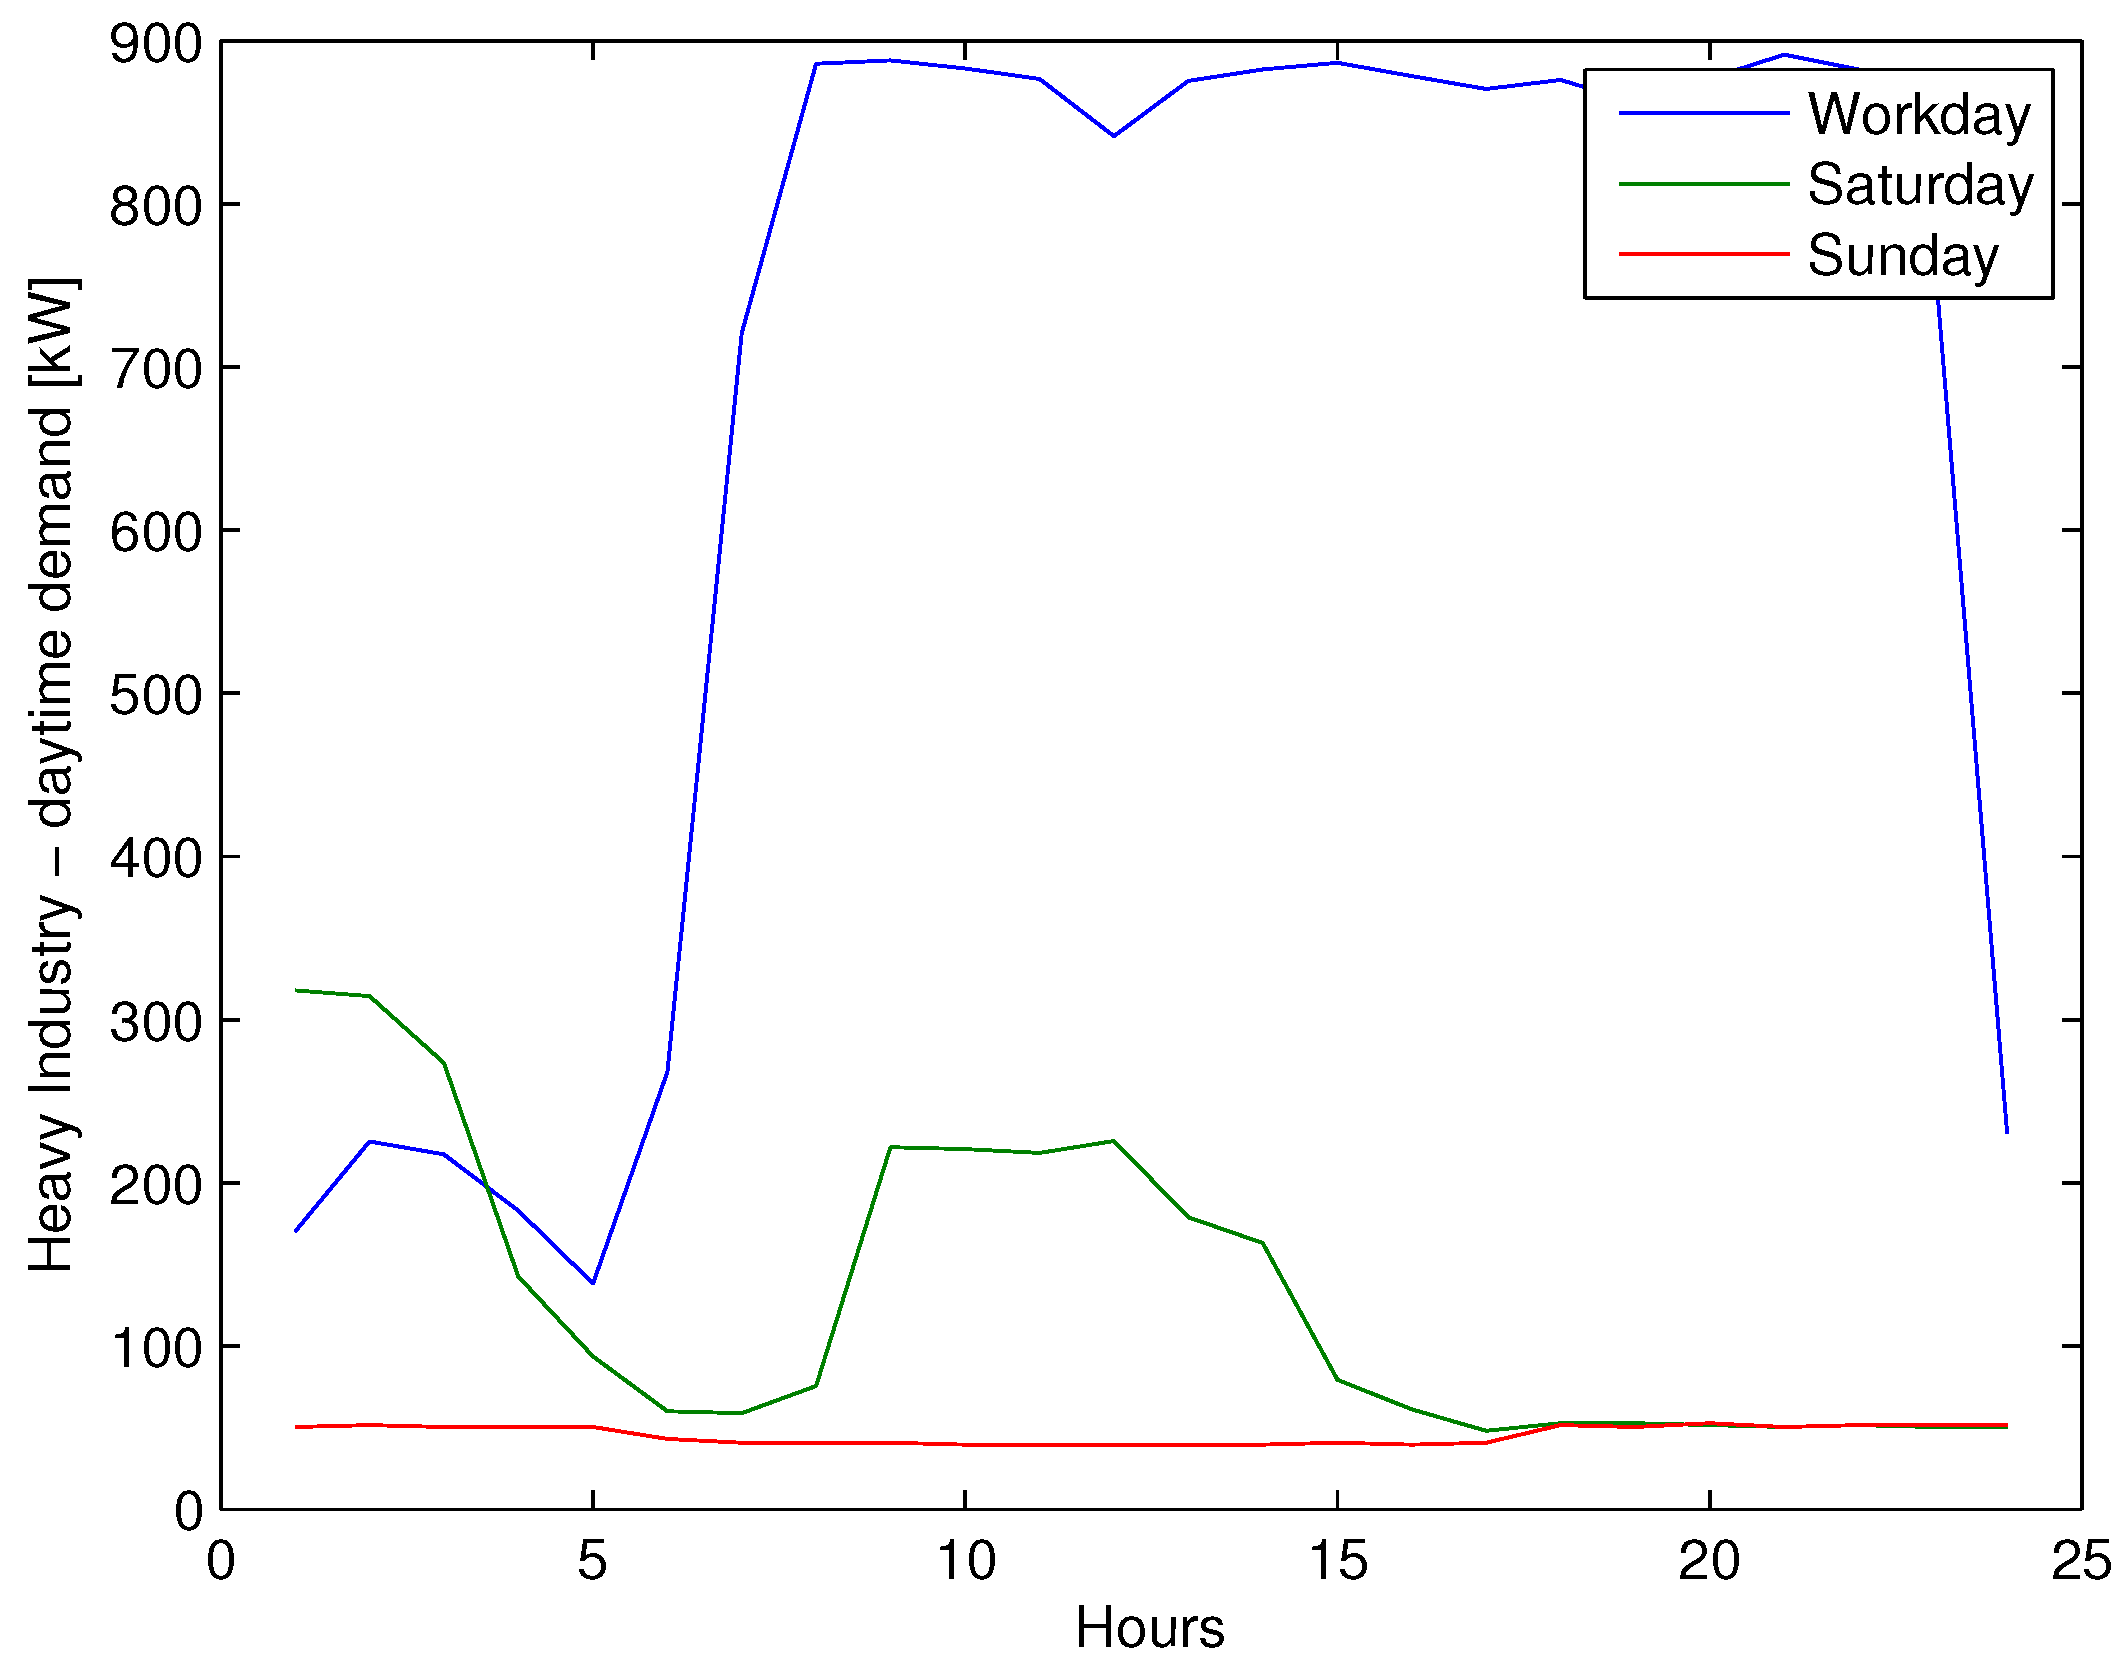
Water Supply company operates with almost constant demand (with short-term variations 100–200 MW) Monday-Sunday. Annual consumption is around 1200 MWh and the connection point is also in the low-voltage network. Installed capacity is 314.16 kW and peak measured power is 195.59 kW. Heavy Industry—Daytime is an industrial plant with annual consumption over 4 GWh connected to the 10 kV medium-voltage network, installed capacity is 1171.81 MW and measured peak power is 891.36 kW. The used hourly average power spans from 50 kW Sunday to 900 kW on workdays. The operation of the plant takes place from Monday to Friday through two shifts, while during the weekends the demand is at minimum level. Workday demand is constant from 06:00–23:00. Heavy Industry—Nighttime is a metallurgic industry operating at high power through the night. Its annual consumption is around 4 GWh and it is connected to the 10 kV medium-voltage network. Installed capacity is 3500 kW, while the measured peak is 1962.19 kW. Consumption ranges from almost 0 kW during the day to almost 2000 kW at night. Figure 7, Figure 8 and Figure 9 display consumption patterns for Water Supply and Heavy Industry.
2.4.3. Input Data—Prices and Tariffs
All end-consumers who have a possibility to buy and sell electricity can be referred to as prosumers. Electricity purchase is conducted through the retail price composed of: active energy per kWh (using suppliers’ tariffs or CROPEX prices), active energy per kWh as a part of the grid tariffs paid to the TSO and DSO, monthly active peak power per kW (households are excluded), renewable subside fee (in all cases 0.014 EUR/kWh), monthly fixed fees (for supplier, TSO and DSO), and VAT as percentage (13%). Suppliers offer a two-tariff system (day and night) or they forward dynamic day-ahead prices from CROPEX to their end customers. Price of the energy sold by the prosumers is aligned with the current Croatian law. This means that suppliers are obliged to buy all power injections from their prosumers at 90% of the price the prosumers pay to the suppliers when they consume energy. Wind power plant sells energy only using the wholesale CROPEX prices. Figure 10 displays CROPEX day-ahead market (DAM) prices for four characteristic seasons.
Different consumers are subject to different tariff systems. In the case of households, prices from the Croatian universal supplier “HEP Elektra” have been used for active energy. The household tariff model is used for grid tariffs. For School, Mall and Water Supply the medium enterprise tariffs are used. Both Heavy Industries are modeled using the industry tariffs. Supplier tariffs are taken from one of the private suppliers in Croatia, while grid tariff models named “red” and “white” are taken for the low-voltage and medium-voltage connected enterprises, respectively. All the tariffs are displayed in Table 9.
2.4.4. Model and Results
To assess profitability of battery integration within the above-mentioned end customers’ facilities, a linear program was created where the objective function minimizes the operating costs defined using prices and tariffs from Section 2.4.3. The main equation in linear model is the energy balance at the point of common coupling between the end-user and grid. The equation balances end-user demand, end-user PV generation (except in the wind farm case), energy injected into the grid and withdrawn from the grid, energy used for battery charging/discharging and RES/load curtailment (for feasibility reasons). Energy injected into/withdrawn from the grid is bounded by the installed capacity. Energy charged/discharged from the battery is bounded by installed capacity of an AC/DC power converter. Energy accumulated within the battery is bounded by its capacity and minimum state-of-energy. Additionally, battery has its own energy balance equation spanning through several time-steps. Battery converter installed capacity is set to half the value of the measured peak power (except for the Wind Power Plant which is set to 1 and 2 MW), while the converter power capacity to battery energy capacity ration is 1:2. All simulations are run for four representative weeks and scaled to the entire year. To see a trend related to battery investment cost, three different battery prices are considered: 600 EUR/kWh, 300 EUR/kWh and 150 EUR/kWh.
The obtained results are presented in the form of NPV—total investment ratio and displayed in Figure 11 and Figure 12. A positive ratio means that the investment is profitable over the observed horizon. Several conclusions can be made when observing results:
- (i)
- When comparing the results from the models with supplier tariffs and prices from CROPEX, it can be noticed that CROPEX prices entail higher total costs for end customers without a BESS. However, when batteries are included, the total costs are lower for the case with CROPEX prices. In other words, CROPEX price volatility could be mitigated with batteries in case of good price forecasting algorithm. A conclusion could be made that enabling the end-users to use the volatile DAM prices could be seen as a battery installation subsidy.
- (ii)
- For the highest battery installation cost integration of BESS is not profitable for none of the modeled end-users. With the capital cost drops down to 300 EUR/kW, few end-users could have a positive NPV (School and Water Supply). However, the lowest capital cost of batteries makes a BESS investment profitable for all the considered end-users. Capital cost of small-scale batteries today (>700 EUR/kW) is still too high for investment in behind-the meter BESS when observing retail arbitrage only.
- (iii)
- In this paper, only retail arbitrage is observed, while other potential battery applications for end-users are ignored due to modeling difficulties and case-specific needs. If other applications, such as backup supply, power quality increase, or PV balancing, the batteries could turn out to be profitable.
2.5. BESS Collocated with an Electric Vehicle Charging Station
Electric vehicles (EV) charging infrastructure is rapidly growing. In Croatia, most of the EV charging spots are AC with power ranging from 11 to 40 kW and they are connected to the LV network under the enterprise grid tariffs. Such tariffs take into account both energy and power fees as it can be seen in Table 9. Since EVs are still rare on Croatian roads, EV charging spots are usually unoccupied, occasionally charging EV. Therefore, EV charging spots usually do not provide continuous power throughout day but several instantaneous spikes. If such chargers are paying tariff fees with peak power item, they end up paying a lot more for peak power than for energy during a month. The idea of this case study is to minimize power payments for charging spots integrating batteries nest to EV chargers. We use the data for a charging spot in Croatia for 2017, which is displayed in Figure 13. The average charging power is 11.66 kW. In total, three major benefits could be harvested with BESS integration: decrease of connection capacity, decrease of monthly peak power, and retail arbitrage. The first benefit relates to initial payments to the grid operator to provide connection to the grid. The second one reduces the monthly peak power payments, and the last one provides night-day energy arbitrage. The optimization algorithm minimizes operating costs while choosing the optimal power and energy capacity of a BESS. Five different connection power cases were considered: 20 kW, 25 kW, 30 kW, 40 kW, and 50 kW. Assumed battery price is 600 EUR/kW, and expected lifetime is 20 years.
The results are presented in Table 10. The installed battery power and energy capacities are the highest for the 20 kW power limit. Since there is a large battery, the decrease in connection and monthly peak costs, as well as arbitrage revenues are the highest. However, extremely high investment costs position the NPV to the negative side meaning that installation of the BESS is not profitable. relaxing the connection power boundary to 25 kW drastically lowers battery’s installed capacity to 76 kWh (from 304 kWh) and the investment cost falls to around 51 thousand Euros (from 202 thousand Euros). The benefits are reduced, but the NPV is ten times improved, and still negative. The NPV becomes positive for smaller batteries where the allowed connection power is higher than 40 kW. For the higher connection power, the fixed connection rate has a greater impact resulting in a positive NPV.
To summarize, integration of BESS into EV charging stations could be profitable for smaller batteries (<13 kW) thus slightly reducing connection and peak power. Take in mind that these results are for the EV charging station without continuous charging where peak power fees are higher than energy supply cost.
3. Conclusions
This paper presents the results for five case studies related to the installation of BESS by different stakeholders, at different voltage levels and for different services. The first case study examines the installation of a BESS which provides energy arbitrage and ancillary services to the TSO. The analysis indicates that the cost of this investment is too high to make it profitable. However, if additional costs, i.e., connection costs, TS, and cost of land, could be avoided by using an existing power plant location (in our case thermal power plant Jertovec), this investment becomes economically feasible already at around 400 EURO/kWh.
The second case study considers a TSO investment in energy storage to provide N-1 criterion for a limited amount of time to radially supplied loads (in our case the island of Lošinj). Although no storage can provide N-1 supply for a long time, SAIDI and SAIFI indices are greatly reduced with installation of a BESS. However, this investment is generally too expensive for the BESS to just stay idle and wait for an outage of the radial line. In this case, if possible, a parallel transmission line is a better option in the long run.
The third case study is focused on security of supply in the power subsystem of Istria, which is not well connected to the rest of the power system. The simulations indicate that a large-scale BESS would have a great positive influence on stability since its extremely quick charging/discharging actions provide enough time to the dispatcher to take slower, but longstanding actions to preserve the system stability.
The fourth case study is an extensive analysis of behind-the-meter installation of BESS at different consumers and a wind farm. The results of the case study show that the battery cost is still for most of the network users, but the most promising results are obtained for the School + PV setting. Generally, installation of a BESS is more reasonable when the prosumer already has PV installed.
The final case study addresses the issue of reducing power and energy payments, as well as connection cost for an EV charging station coupled with a BESS. Here, small BESS provide best results due to peak shaving services they provide.
Case studies in this paper are intended for potential BESS investors, ranging from private companies to the TSOs and DSOs. Also, the presented results could help energy regulatory agencies to better understand the issues the investors face, which could lead to regulatory settings more attractive for integration of energy storage.
The future research will address the BESS possibilities providing services that are currently not allowed in Croatia, such as primary frequency response, secondary and tertiary reserve, voltage support, grid deferral, congestion management etc. The aim of such research would further push responsible institutions to work on new laws and regulatory schemes.
Author Contributions
Conceptualization, H.P.; methodology, I.P., Z.L., H.P.; software, I.P., Z.L; validation, H.P., T.C. and I.A.; formal analysis, I.P., Z.L.; investigation, I.P., Z.L.; resources, H.P., T.C., and I.A.; data curation, I.P., Z.L., H.P., I.A.; writing—original draft preparation, I.P., Z.L., and T.C.; writing—review and editing, I.P., Z.L., H.P., and T.C.; visualization, I.P., Z.L.; supervision, H.P., T.C., and I.A.; project administration, H.P., T.C., and I.A.; funding acquisition, H.P., T.C., and I.A.
Funding
This work was supported in part by the Croatian Environmental Protection and Energy Efficiency Fund under the project Microgrid Positioning (uGRIP) from the ERA Net Smart Grids Plus funding scheme and by Croatian Science Foundation (HRZZ) through Climate change research program for period 2015–2016 supported by Government of Croatia project SUCCESS—Sustainable Concept for Integration of Distributed Energy Storage Systems.
Conflicts of Interest
The authors declare no conflict of interest.
References
- Pavic, I.; Capuder, T.; Kuzle, I. Low Carbon Technologies as Providers of Operational Flexibility in Future Power Systems. Appl. Energy 2016, 168, 724–738. [Google Scholar] [CrossRef]
- State of California. SB-100 California Renewables Portfolio Standard Program: Emissions of Greenhouse Gases; State of California: Los Angeles, CA, USA, 2018.
- Denholm, P.; O’connell, M.; Brinkman, G.; Jorgenson, J. Overgeneration from Solar Energy in California: A Field Guide to the Duck Chart; Technical Report; NREL: Golden, CO, USA, 2013. [Google Scholar]
- Zeh, A.; Müller, M.; Naumann, M.; Hesse, H.; Jossen, A.; Witzmann, R.; Zeh, A.; Müller, M.; Naumann, M.; Hesse, H.C.; et al. Fundamentals of Using Battery Energy Storage Systems to Provide Primary Control Reserves in Germany. Batteries 2016, 2, 29. [Google Scholar] [CrossRef]
- UK. Capacity Market Consultation-Improving the Framework Government Response; Technical Report; UK Government: London, UK, 2017.
- Electrek. Tesla’s Giant Battery in Australia Made Around $1 Million in Just a Few Days—Electrek. Available online: https://electrek.co/2018/01/23/tesla-giant-battery-australia-1-million/ (accessed on 31 December 2018).
- DeVries, T.; McDowall, J.; Umbricht, N.; Linhofer, G. Cold Storage; Technical Report; ABB: Zürich, Switzerland, 2004. [Google Scholar]
- Garver, L.L. Transmission Network Estimation Using Linear Programming. IEEE Trans. Power Appar. Syst. 1970, 1688–1697. [Google Scholar] [CrossRef]
- Grigg, C.; Wong, P.; Albrecht, P.; Allan, R.; Bhavaraju, M.; Billinton, R.; Chen, Q.; Fong, C.; Haddad, S.; Kuruganty, S.; et al. The IEEE Reliability Test System-1996. IEEE Trans. Power Syst. 1999, 14, 1010–1020. [Google Scholar] [CrossRef]
- Pandžić, H.; Wang, Y.; Qiu, T.; Dvorkin, Y.; Kirschen, D.S. Near-Optimal Method for Siting and Sizing of Distributed Storage in a Transmission Network. IEEE Trans. Power Syst. 2015, 30, 2288–2300. [Google Scholar] [CrossRef]
- Price, J.E.; Goodin, J. Reduced Network Modeling of WECC as a Market Design Prototype. In Proceedings of the Power and Energy Society General Meeting, Detroit, MI, USA, 24–29 July 2011; pp. 1–6. [Google Scholar] [CrossRef]
- Anuta, O.H.; Taylor, P.; Jones, D.; McEntee, T.; Wade, N. An International Review of the Implications of Regulatory and Electricity Market Structures on the Emergence of Grid Scale Electricity Storage. Renew. Sustain. Energy Rev. 2014, 38, 489–508. [Google Scholar] [CrossRef]
- Kooshknow, S.M.M.; Davis, C. Business Models Design Space for Electricity Storage Systems: Case study of the Netherlands. J. Energy Storage 2018, 20, 590–604. [Google Scholar] [CrossRef]
- Mileti´c, M.; Luburi´c, Z.; Pavi´c, I.; Capuder, T.; Pandži´c, H.; Androcec, I.; Marusi´c, A. A Review of Energy Storage Systems Applications. In Proceedings of the 2018 Mediterranean Conference on Power Generation, Transmission, Distribution and Energy Conversion (MEDPOWER), Dubrovnik, Croatia, 12–15 November 2018; pp. 1–7. [Google Scholar]
- Fernández-Blanco, R.; Dvorkin, Y.; Xu, B.; Wang, Y.; Kirschen, D.S. Optimal Energy Storage Siting and Sizing: A WECC Case Study. IEEE Trans. Sustain. Energy 2017, 8, 733–743. [Google Scholar] [CrossRef]
- Zakeri, B.; Syri, S. Economy of Electricity Storage in the Nordic Electricity Market: The Case for Finland. In Proceedings of the 2014 11th International Conference on the European Energy Market (EEM), Krakow, Poland, 28–30 May 2014; pp. 1–6. [Google Scholar] [CrossRef]
- Svendsen, H.G.; Shetaya, A.A.; Loudiyi, K. Integration of Renewable Energy and the Benefit of Storage from a Grid and Market Perspective-Results from Morocco and Egypt Case Studies. In Proceedings of the Renewable and Sustainable Energy Conference (IRSEC), Marrakech, Morocco, 14–17 November 2016; pp. 1164–1168. [Google Scholar] [CrossRef]
- Frate, G.F.; Carro, P.P.; Ferrari, L.; Desideri, U. Techno-economic Sizing of a Battery Energy Storage Coupled to a Wind Farm: an Italian Case Study. Energy Procedia 2018, 148, 447–454. [Google Scholar] [CrossRef]
- Sidhu, A.S.; Pollitt, M.G.; Anaya, K.L. A social cost benefit analysis of grid-scale electrical energy storage projects: A case study. Appl. Energy 2018, 212, 881–894. [Google Scholar] [CrossRef]
- Hellman, H.P.; Pihkala, A.; Hyvärinen, M.; Heine, P.; Karppinen, J.; Siilin, K.; Lahtinen, P.; Laasonen, M.; Matilainen, J. Benefits of Battery Energy Storage System for System, Market, and Distribution Network–Case Helsinki. CIRED-Open Access Proc. J. 2017, 2017, 1588–1592. [Google Scholar] [CrossRef]
- Groppi, D.; Garcia, D.A.; Basso, G.L.; Cumo, F.; De Santoli, L. Analysing Economic and Environmental Sustainability Related to the Use of Battery and Hydrogen Energy Storages for Increasing the Energy Independence of Small Islands. Energy Convers. Manag. 2018, 177, 64–76. [Google Scholar] [CrossRef]
- Telaretti, E.; Dusonchet, L.; Massaro, F.; Mineo, L.; Milazzo, F. A Simple Operation Strategy of Battery Storage Systems under Dynamic Electricity Pricing: An Italian Case Study for a Medium-scale Public Facility. In Proceedings of the 3rd Renewable Power Generation Conference (RPG 2014), Naples, Italy, 24–25 September 2014. [Google Scholar]
- Pandžić, H. Optimal Battery Energy Storage Investment in Buildings. Energy Build. 2018, 175, 189–198. [Google Scholar] [CrossRef]
- Georgakarakos, A.D.; Mayfield, M.; Hathway, E.A. Battery Storage Systems in Smart Grid Optimised Buildings. Energy Procedia 2018, 151, 23–30. [Google Scholar] [CrossRef]
- Hartmann, B.; Divényi, D.; Vokony, I. Evaluation of Business Possibilities of Energy Storage at Commercial and Industrial Consumers–A Case Study. Appl. Energy 2018, 222, 59–66. [Google Scholar] [CrossRef]
- Da Silva, G.D.P.; Branco, D.A.C. Modelling Distributed Photovoltaic System with and without Battery Storage: A Case Study in Belem, Northern Brazil. J. Energy Storage 2018, 17, 11–19. [Google Scholar] [CrossRef]
- Song, Z.; Li, J.; Hou, J.; Hofmann, H.; Ouyang, M.; Du, J. The battery-supercapacitor hybrid energy storage system in electric vehicle applications: A case study. Energy 2018, 154, 433–441. [Google Scholar] [CrossRef]
- Luo, X.; Wang, J.; Dooner, M.; Clarke, J. Overview of Current Development in Electrical Energy Storage Technologies and the Application Potential in Power System Operation. Appl. Energy 2015, 137, 511–536. [Google Scholar] [CrossRef]
- Luburić, Z.; Pandžić, H.; Plavšić, T.; Teklić, L.; Valentić, V. Role of energy storage in ensuring transmission system adequacy and security. Energy 2018, 156, 229–239. [Google Scholar] [CrossRef]
Figure 1.
Geographical area of power plant Jertovec with red circle indicating the location of the potential BESS.
Figure 1.
Geographical area of power plant Jertovec with red circle indicating the location of the potential BESS.

Figure 2.
Electrical representation of the observed area.

Figure 3.
Demand at the island Lošinj in 2016. (a) Demand during peak and off-peak hours. (b) Characteristic Wednesdays: (i) minimum (April), (ii) average (November) and (iii) maximum (July).
Figure 3.
Demand at the island Lošinj in 2016. (a) Demand during peak and off-peak hours. (b) Characteristic Wednesdays: (i) minimum (April), (ii) average (November) and (iii) maximum (July).

Figure 4.
Four RES generation profiles: (i) Autumn, (ii) Winter, (iii) Spring, (iv) Summer. (a) PV generation on representative days; (b) Wind power generation on representative weeks.
Figure 4.
Four RES generation profiles: (i) Autumn, (ii) Winter, (iii) Spring, (iv) Summer. (a) PV generation on representative days; (b) Wind power generation on representative weeks.

Figure 5.
Household curves for three representative days of the autumn week: (i) Workday, (ii) Saturday and (iii) Sunday. (a) Household-Measured; (b) Household-Equivalent Load.
Figure 5.
Household curves for three representative days of the autumn week: (i) Workday, (ii) Saturday and (iii) Sunday. (a) Household-Measured; (b) Household-Equivalent Load.

Figure 6.
Elementary School and Shopping Mall curves for three representative days of week: (i) Workday, (ii) Saturday and (iii) Sunday. (a) Elementary School; (b) Shopping Mall.
Figure 6.
Elementary School and Shopping Mall curves for three representative days of week: (i) Workday, (ii) Saturday and (iii) Sunday. (a) Elementary School; (b) Shopping Mall.

Figure 7.
Water Supply curves for three representative days of the week.

Figure 8.
Heavy Industry—Daytime curves for three representative days of the week.

Figure 9.
Heavy Industry nighttime curve for three representative days of week.

Figure 10.
Weekly DAM Electricity prices for 4 representative seasons.

Figure 11.
NPV/Investment Ratio for different end-users and battery capital costs using suppliers’ tariffs.
Figure 11.
NPV/Investment Ratio for different end-users and battery capital costs using suppliers’ tariffs.

Figure 12.
NPV/Investment Ratio for different end-users and battery capital costs using CROPEX prices.
Figure 12.
NPV/Investment Ratio for different end-users and battery capital costs using CROPEX prices.

Figure 13.
Charging spot demand for 2017 at a charging station in Croatia.


Table 1.
Overview of selected case studies for battery implementation.
| Case Study | Power Plant Jertovec | Island of Lošinj | Region of Istria | Behind the Meter | EV Charging Station |
|---|---|---|---|---|---|
| Application Group | System-level | Grid-level | Grid-level | End-user level | End-user level |
| Primary Application | Wholesale arbitrage | N-1 Criteria | Security of Supply | Retail-arbitrage | Peak-shaving |
| Secondary Benefit | Using existing plant location | Submarine cable mitigation | Dispatcher support | Monthly peak shaving | Connection power decrease |
Table 2.
Costs of BESS installation (I) at location Jertovec.
| Installed Power BESS | Connecting Costs | Cost of New TS | Cost of land | Cost of BESS | Total Cost |
|---|---|---|---|---|---|
| (MW) | (EUR) | (EUR) | (EUR) | (EUR) | (EUR) |
| 5 | 904,825 | 2,634,946 | 19,772 | 3,351,206 | 6,910,750 |
| 10 | 1,809,651 | 3,110,884 | 39,544 | 6,702,412 | 11,662,493 |
| 20 | 3,619,302 | 3,479,266 | 79,088 | 10,723,860 | 17,901,518 |
| 50 | 9,048,257 | 3,910,422 | 197,721 | 20,107,238 | 33,233,639 |
Table 3.
Profit-20 years (): arbitrage and ancillary services; NPV values: undefined location and location Jertovec.
Table 3.
Profit-20 years (): arbitrage and ancillary services; NPV values: undefined location and location Jertovec.
| Installed Capacity | Profit- | Profit- | NPV- | NPV- | Savings at |
|---|---|---|---|---|---|
| BESS | Arbitrage | Ancillary Service | Undefined Location | Jertovec | Location Jertovec |
| (MWh) | (EUR) | (EUR) | (EUR) | (EUR) | (%) |
| 5 | 1,141,547 | 82,128 | −5,687,074 | −2,127,530 | 63 |
| 10 | 2,283,094 | 164,256 | −9,215,141 | −4,255,061 | 54 |
| 20 | 4,566,189 | 328,658 | −13,006,671 | −5,829,013 | 55 |
| 50 | 11,415,472 | 821,573 | −21,026,592 | −7,870,192 | 63 |
Table 4.
NPV indicators for 25% reduced BESS investment cost: undefined location and location Jertovec.
Table 4.
NPV indicators for 25% reduced BESS investment cost: undefined location and location Jertovec.
| Installed Capacity | NPV-Undefined | NPV-Jertovec | NPV Improvement at |
|---|---|---|---|
| BESS (MWh) | Location (EUR) | (EUR) | Location Jertovec (%) |
| 5 | −4,849,273 | −1,289,729 | 73 |
| 10 | −7,539,538 | −2,579,458 | 66 |
| 20 | −10,325,706 | −3,148,047 | 70 |
| 50 | −15,999,783 | −2,843,382 | 82 |
Table 5.
NPV indicators 50% reduced BESS investment cost: undefined location and location Jertovec.
| Installed Capacity | NPV-Undefined | NPV-Jertovec | NPV Improvement at |
|---|---|---|---|
| BESS (MWh) | Location (EUR) | (EUR) | Location Jertovec (%) |
| 5 | −4,011,471 | −451,927 | 89 |
| 10 | −5,863,935 | −903,854 | 85 |
| 20 | −7,644,740 | −467,082 | 94 |
| 50 | −10,972,973 | 2,183,427 | 120 |
Table 6.
NPV indicators for 75% reduced BESS investment cost: undefined location and location Jertovec.
Table 6.
NPV indicators for 75% reduced BESS investment cost: undefined location and location Jertovec.
| Installed Capacity | NPV-Undefined | NPV-Jertovec | NPV Improvement at |
|---|---|---|---|
| BESS (MWh) | Location (EUR) | (EUR) | Location Jertovec (%) |
| 5 | −3,173,670 | 385,873 | 112 |
| 10 | −4,188,332 | 771,748 | 118 |
| 20 | −4,963,775 | 2,213,882 | 145 |
| 50 | −5,946,163 | 7,210,236 | 221 |
Table 7.
SAIFI and SAIDI indices.
| Year | Base Case (min) | Small BESS (min) | Large BESS (min) |
|---|---|---|---|
| 2011 | 1 (3) | 0 (0) | 0 (0) |
| 2012 | 10 (1209) | 3 (1159) | 1 (537) |
| 2013 | 1 (7) | 0 (0) | 0 (0) |
| 2014 | 3 (115) | 0 (0) | 0 (0) |
| 2015 | 0 (0) | 0 (0) | 0 (0) |
| 2016 | 0 (0) | 0 (0) | 0 (0) |
| 2017 | 3 (215) | 1 (190) | 1 (65) |
| Overall | 18 (1434) | 4 (1349) | 2 (602) |
Table 8.
Scenarios generated using PSS®E software.
| Scenarios | TEP 1 | TEP 2 | Load | Inj. (+)/Evac. (−) | BESS (Size) | Critical/Blackout |
|---|---|---|---|---|---|---|
| (MW) | (MW) | (MW) | (MW) | |||
| I | 105 | 210 | 85 | −230 | Ch (30) | Blackout |
| II | 75 | 120 | 85 | −110 | Ch (30) | Critical |
| III | 105 | 0 | 230 | 125 | Disch (100) | Blackout |
| IV | 0 | 210 | 85 | −125 | Ch (30) | Critical |
| V | 0 | 0 | 230 | 230 | Disch (>120) | Blackout |
| VI | 0 | 120 | 230 | 110 | Disch (30) | Blackout |
| VII | 105 | 0 | 230 | 125 | Disch (20) | Blackout |
| VIII | 500 | 210 | 230 | −480 | New line added | Normal |
Table 9.
Tariffs in Croatia: Supplier, DSO, and TSO.
| Tariff Items | Household | Enterprise | Industry |
|---|---|---|---|
| Tariff Fees | Tariff Fees | Tariff Fees | |
| Suppliers | |||
| High Tariff [EUR/kWh] | 0.0653 | 0.0700 | 0.0633 |
| Low Tariff [EUR/kWh] | 0.0320 | 0.0467 | 0.0450 |
| Monthly fixed fee [EUR/month] | 0.9867 | 4,6667 | 4.6667 |
| DSO “HEP ODS” | |||
| High Tariff [EUR/kWh] | 0.0320 | 0.02667 | 0.0160 |
| Low Tariff [EUR/kWh] | 0.0160 | 0.0133 | 0.0080 |
| Monthly peak power fee [EUR/kW] | - | 4 | 2 |
| Monthly fixed fee [EUR/month] | 1.3333 | 5.507 | 8.8000 |
| TSO “HOPS” | |||
| High Tariff [EUR/kWh] | 0.0147 | 0.0067 | 0.0067 |
| Low Tariff [EUR/kWh] | 0.0067 | 0.0027 | 0.0027 |
| Monthly peak power fee [EUR/kW] | - | 1.9333 | 1,9333 |
| Monthly fixed fee [EUR/month] | - | - | - |
Table 10.
Results of optimal battery collocation with an EV charging point for different connection power limits.
Table 10.
Results of optimal battery collocation with an EV charging point for different connection power limits.
| Connection Point Limit | 20 kW | 25 kW | 30 kW | 40 kW | 50 kW |
|---|---|---|---|---|---|
| Battery Installed Capacity (kWh) | 304 | 76 | 54 | 18 | 2 |
| Battery Installed Power (kW) | 35 | 30 | 24 | 13 | 2 |
| Battery Investment (EUR) | 202,388.17 | 50,974.36 | 36,322.34 | 12,073.26 | 1567.77 |
| Decreased Connection Peak Power Cost (EUR) | 11.787 | 10.653 | 9.520 | 7.253 | 4.987 |
| Decreased Monthly Peak Power Cost −1 year (EUR) | 3409.86 | 1662.74 | 1320.69 | 846.92 | 120.30 |
| Retail Arbitrage Revenue −1 year (EUR) | 566.57 | 454.27 | 334.84 | 112.78 | 14.85 |
| Total Revenue in 20 years (EUR) | 49,554.73 | 26,382.65 | 20,630.67 | 11,960.00 | 1683.20 |
| NPV | −141,046.77 | −13,938.38 | −6171.68 | 7140,07 | 5102.10 |
© 2019 by the authors. Licensee MDPI, Basel, Switzerland. This article is an open access article distributed under the terms and conditions of the Creative Commons Attribution (CC BY) license (http://creativecommons.org/licenses/by/4.0/).
Share and Cite
MDPI and ACS Style
Pavić, I.; Luburić, Z.; Pandžić, H.; Capuder, T.; Andročec, I. Defining and Evaluating Use Cases for Battery Energy Storage Investments: Case Study in Croatia. Energies 2019, 12, 376. https://doi.org/10.3390/en12030376
AMA Style
Pavić I, Luburić Z, Pandžić H, Capuder T, Andročec I. Defining and Evaluating Use Cases for Battery Energy Storage Investments: Case Study in Croatia. Energies. 2019; 12(3):376. https://doi.org/10.3390/en12030376
Chicago/Turabian StylePavić, Ivan, Zora Luburić, Hrvoje Pandžić, Tomislav Capuder, and Ivan Andročec. 2019. "Defining and Evaluating Use Cases for Battery Energy Storage Investments: Case Study in Croatia" Energies 12, no. 3: 376. https://doi.org/10.3390/en12030376
Note that from the first issue of 2016, this journal uses article numbers instead of page numbers. See further details here.