A Parametric Study and Performance Evaluation of Energy Retrofit Solutions for Buildings Located in the Hot-Humid Climate of Paraguay—Sensitivity Analysis


Abstract
:1. Introduction
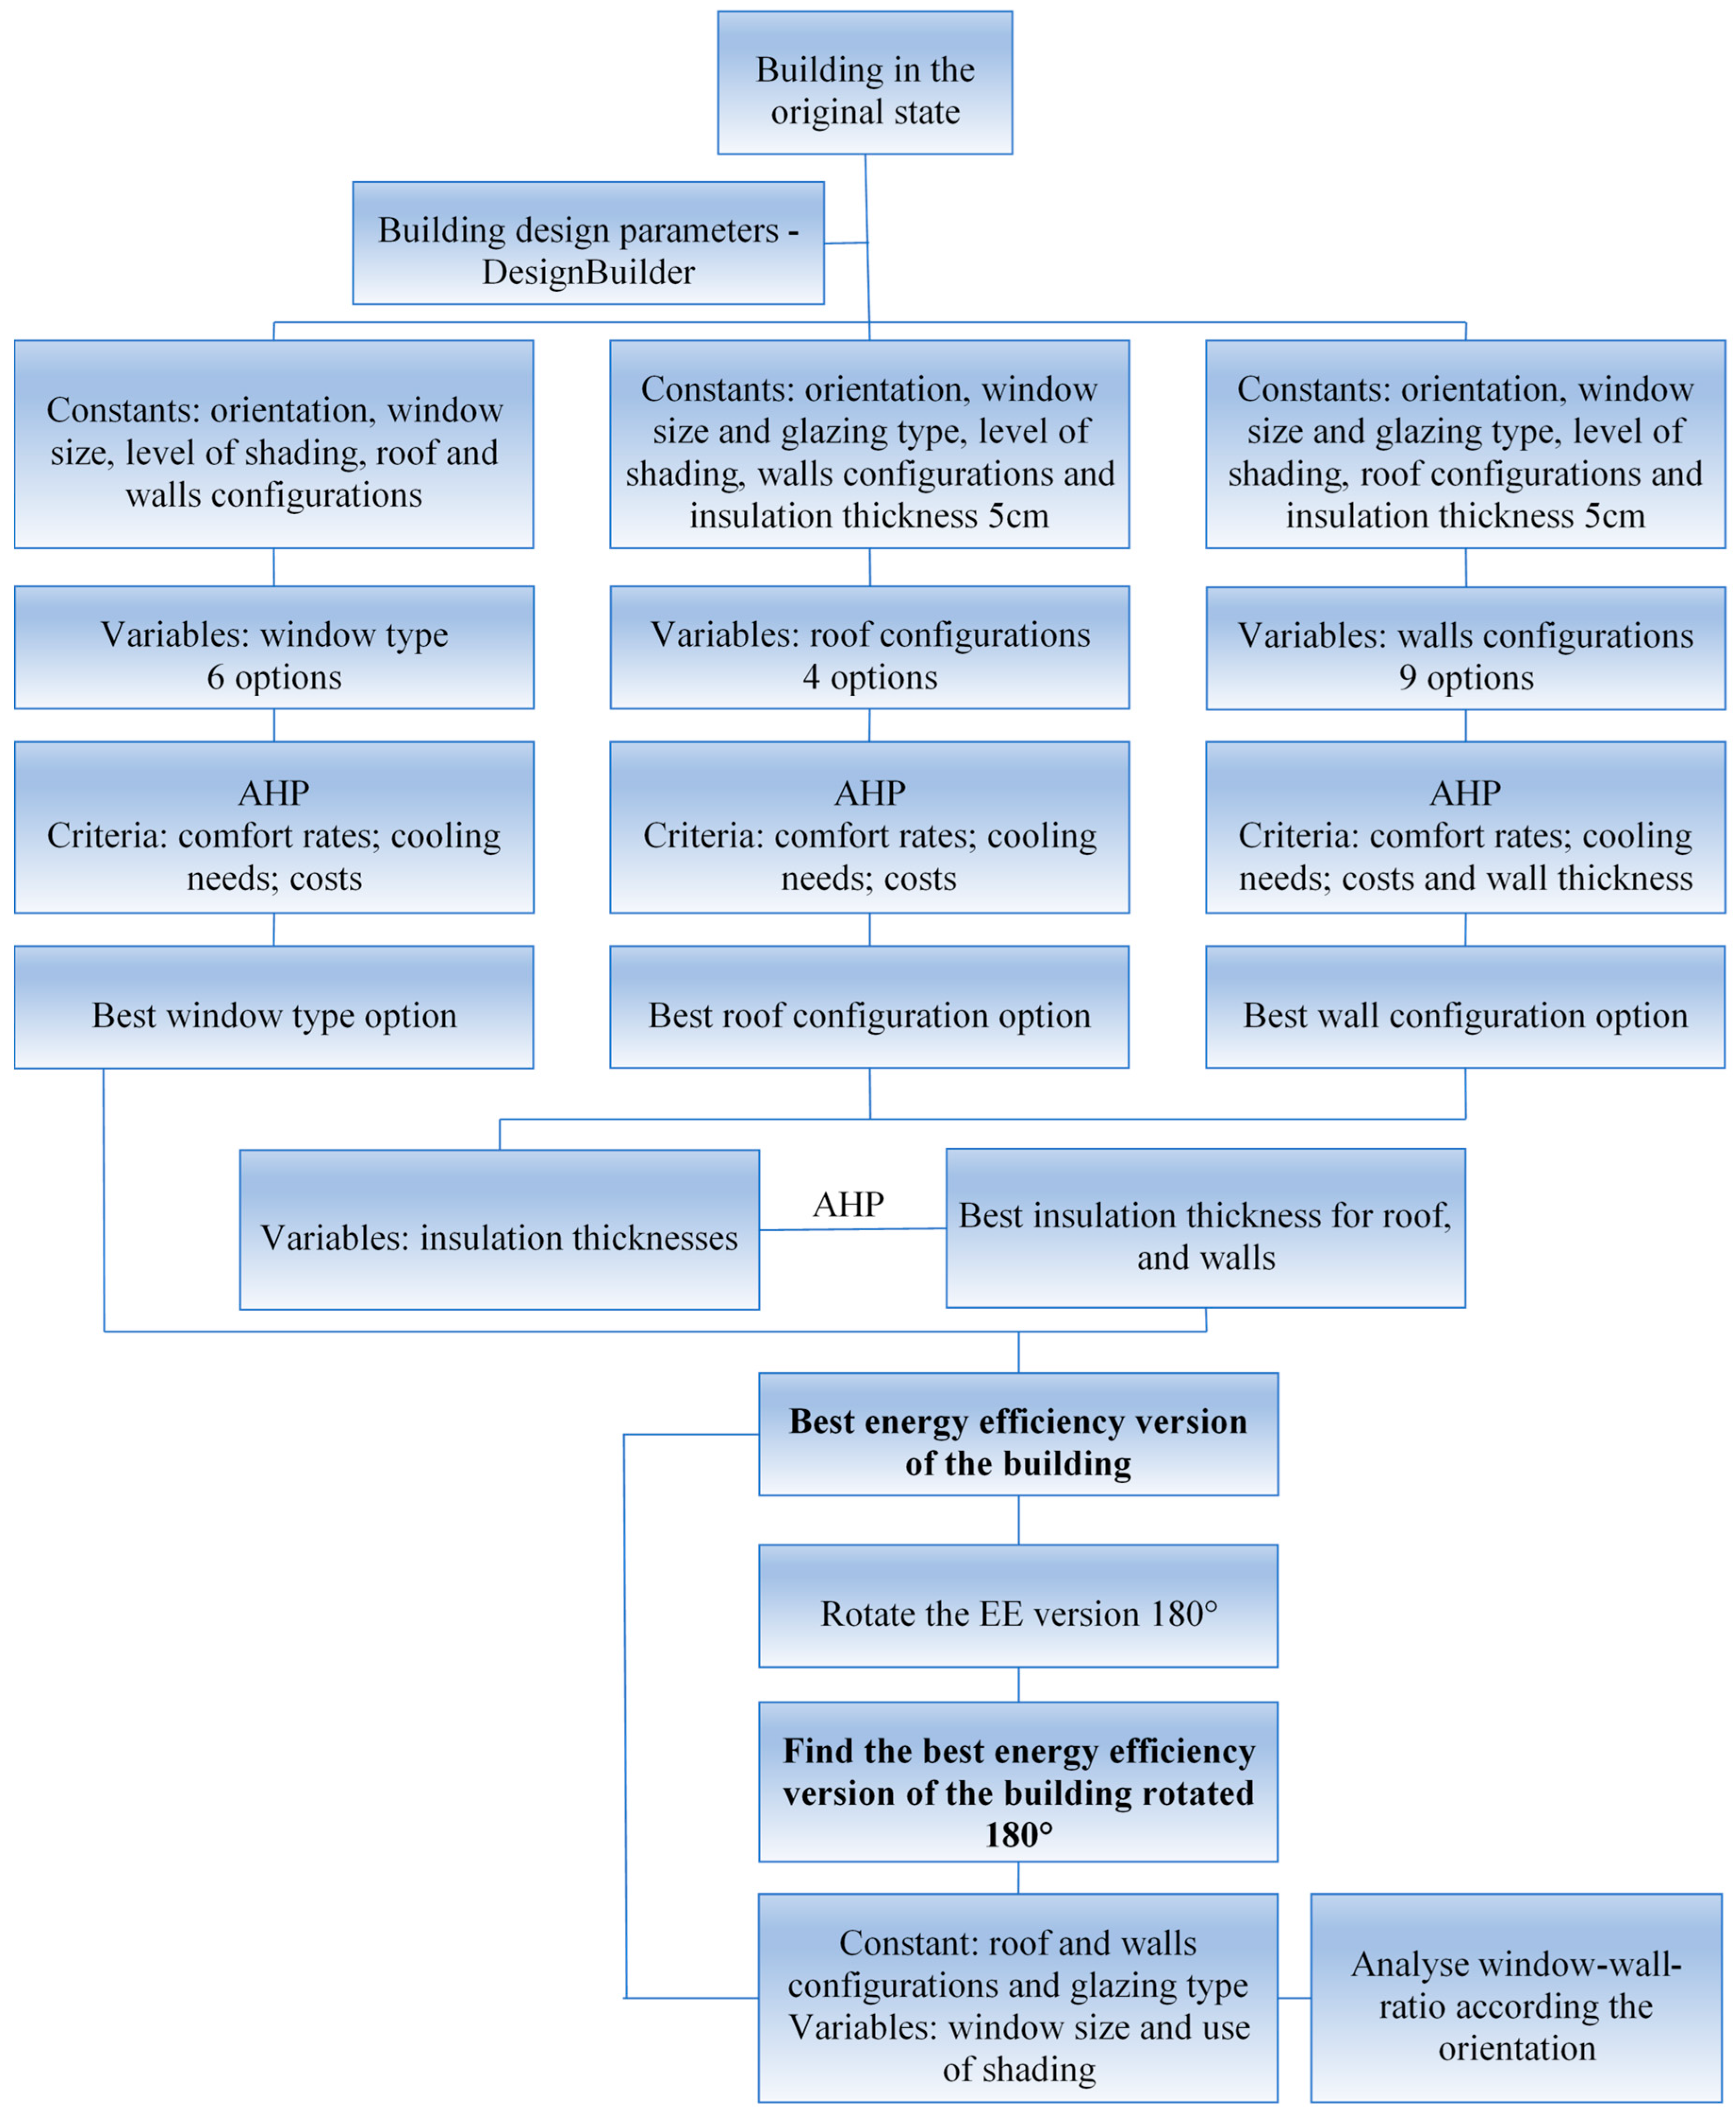
2. Methodology
- (a)
- Taking as a base the original state of the building, and holding constant orientation, window size, window shading and input parameters for the simulations, different window glazing types, and different configurations for roofs and walls were evaluated;
- (b)
- Considering the results in terms of comfort rates, cooling needs and the costs associated for each configuration evaluated in (a), the Analytic Hierarchy Process was applied to choose the best configuration for the roof, walls and glazing type;
- (c)
- Once figured out the most recommended configuration for the building envelope components, the sensitivity of the building under different insulation thicknesses for roofs and walls analysing comfort rates and cooling needs was assessed;
- (d)
- Considering the results in terms of comfort rates, cooling needs and the costs associated for each insulation thickness evaluated in (c), the Analytic Hierarchy Process was applied to choose the best insulation thickness for roof and walls;
- (e)
- The building employing the best configurations of roofs, walls and glazing to evaluate the energy efficiency version was simulated;
- (f)
- Taking as a base the energy efficiency version of the building used in (e), the building was rotated 180° to evaluate its performance with a different orientation, holding constant the configurations of walls and roof.
- (g)
- With the energy efficiency version of the building in the original orientation and rotated 180°, holding constant the glazing type and the walls and roofs configurations, and according to the orientation, using or not, window shading systems, different window-wall-ratio (WWR) were evaluated.
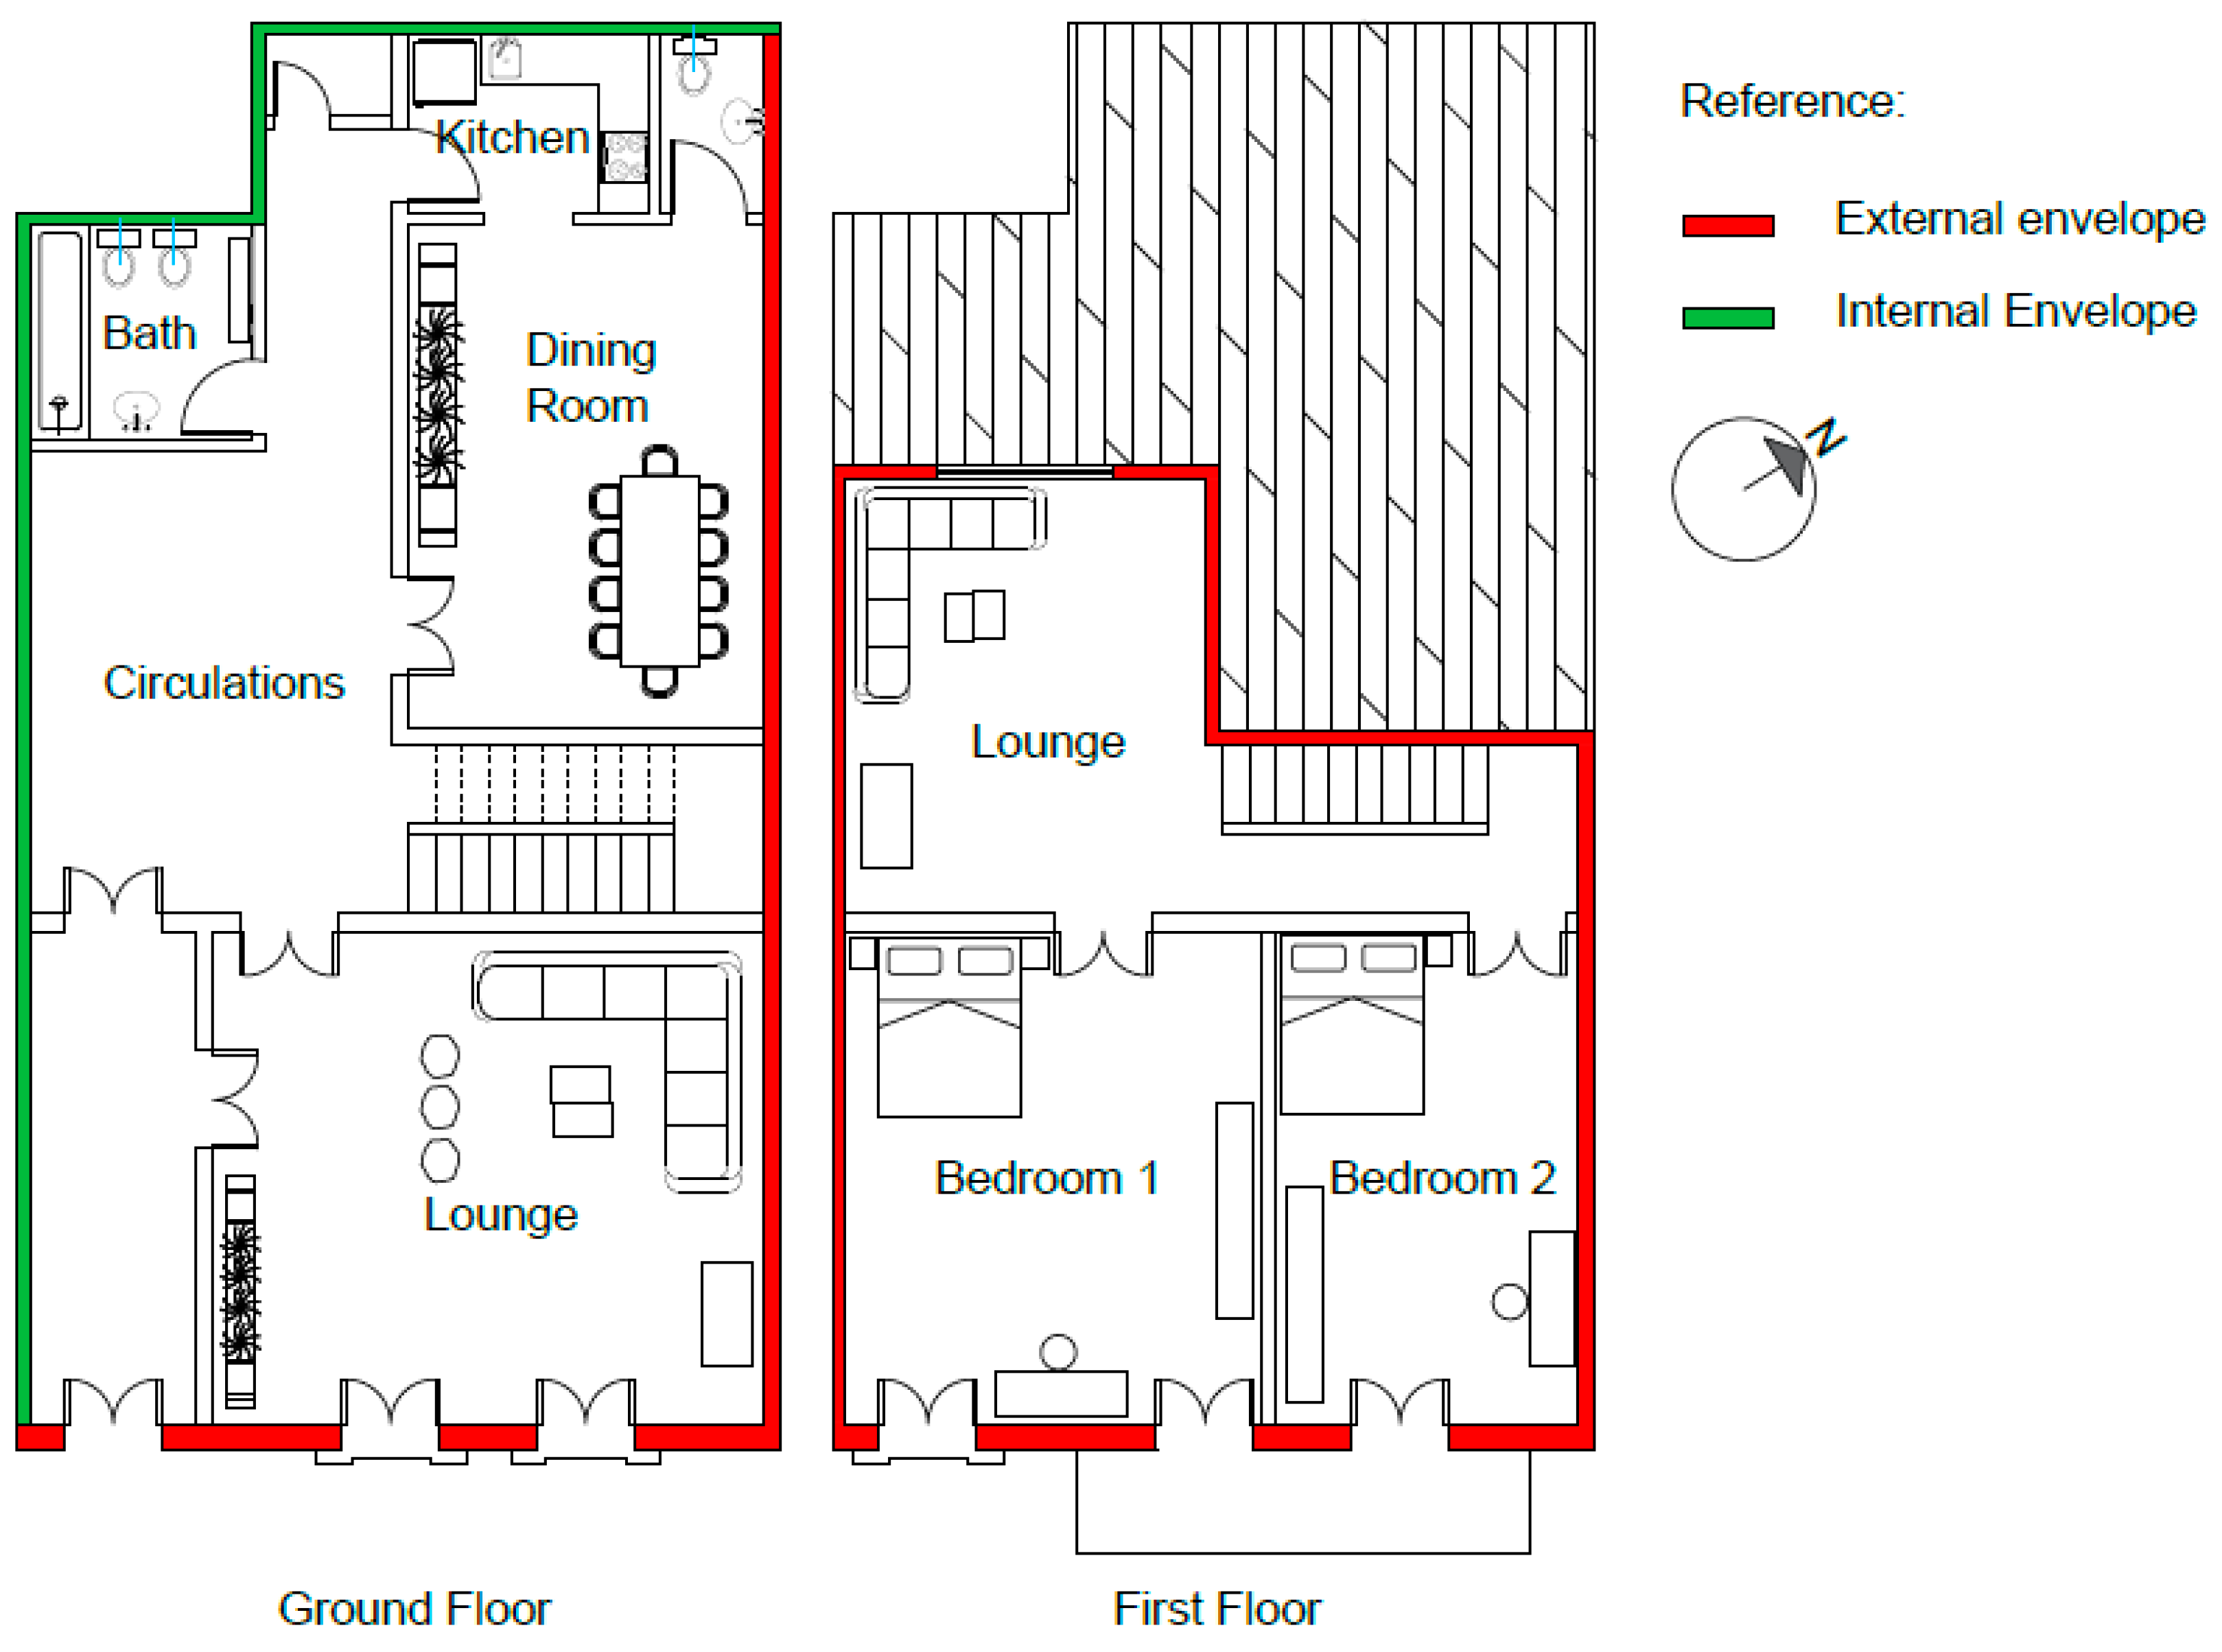
3. Case Study Characterisation
Energy Retrofit Solutions Configuration
4. Results and Discussion
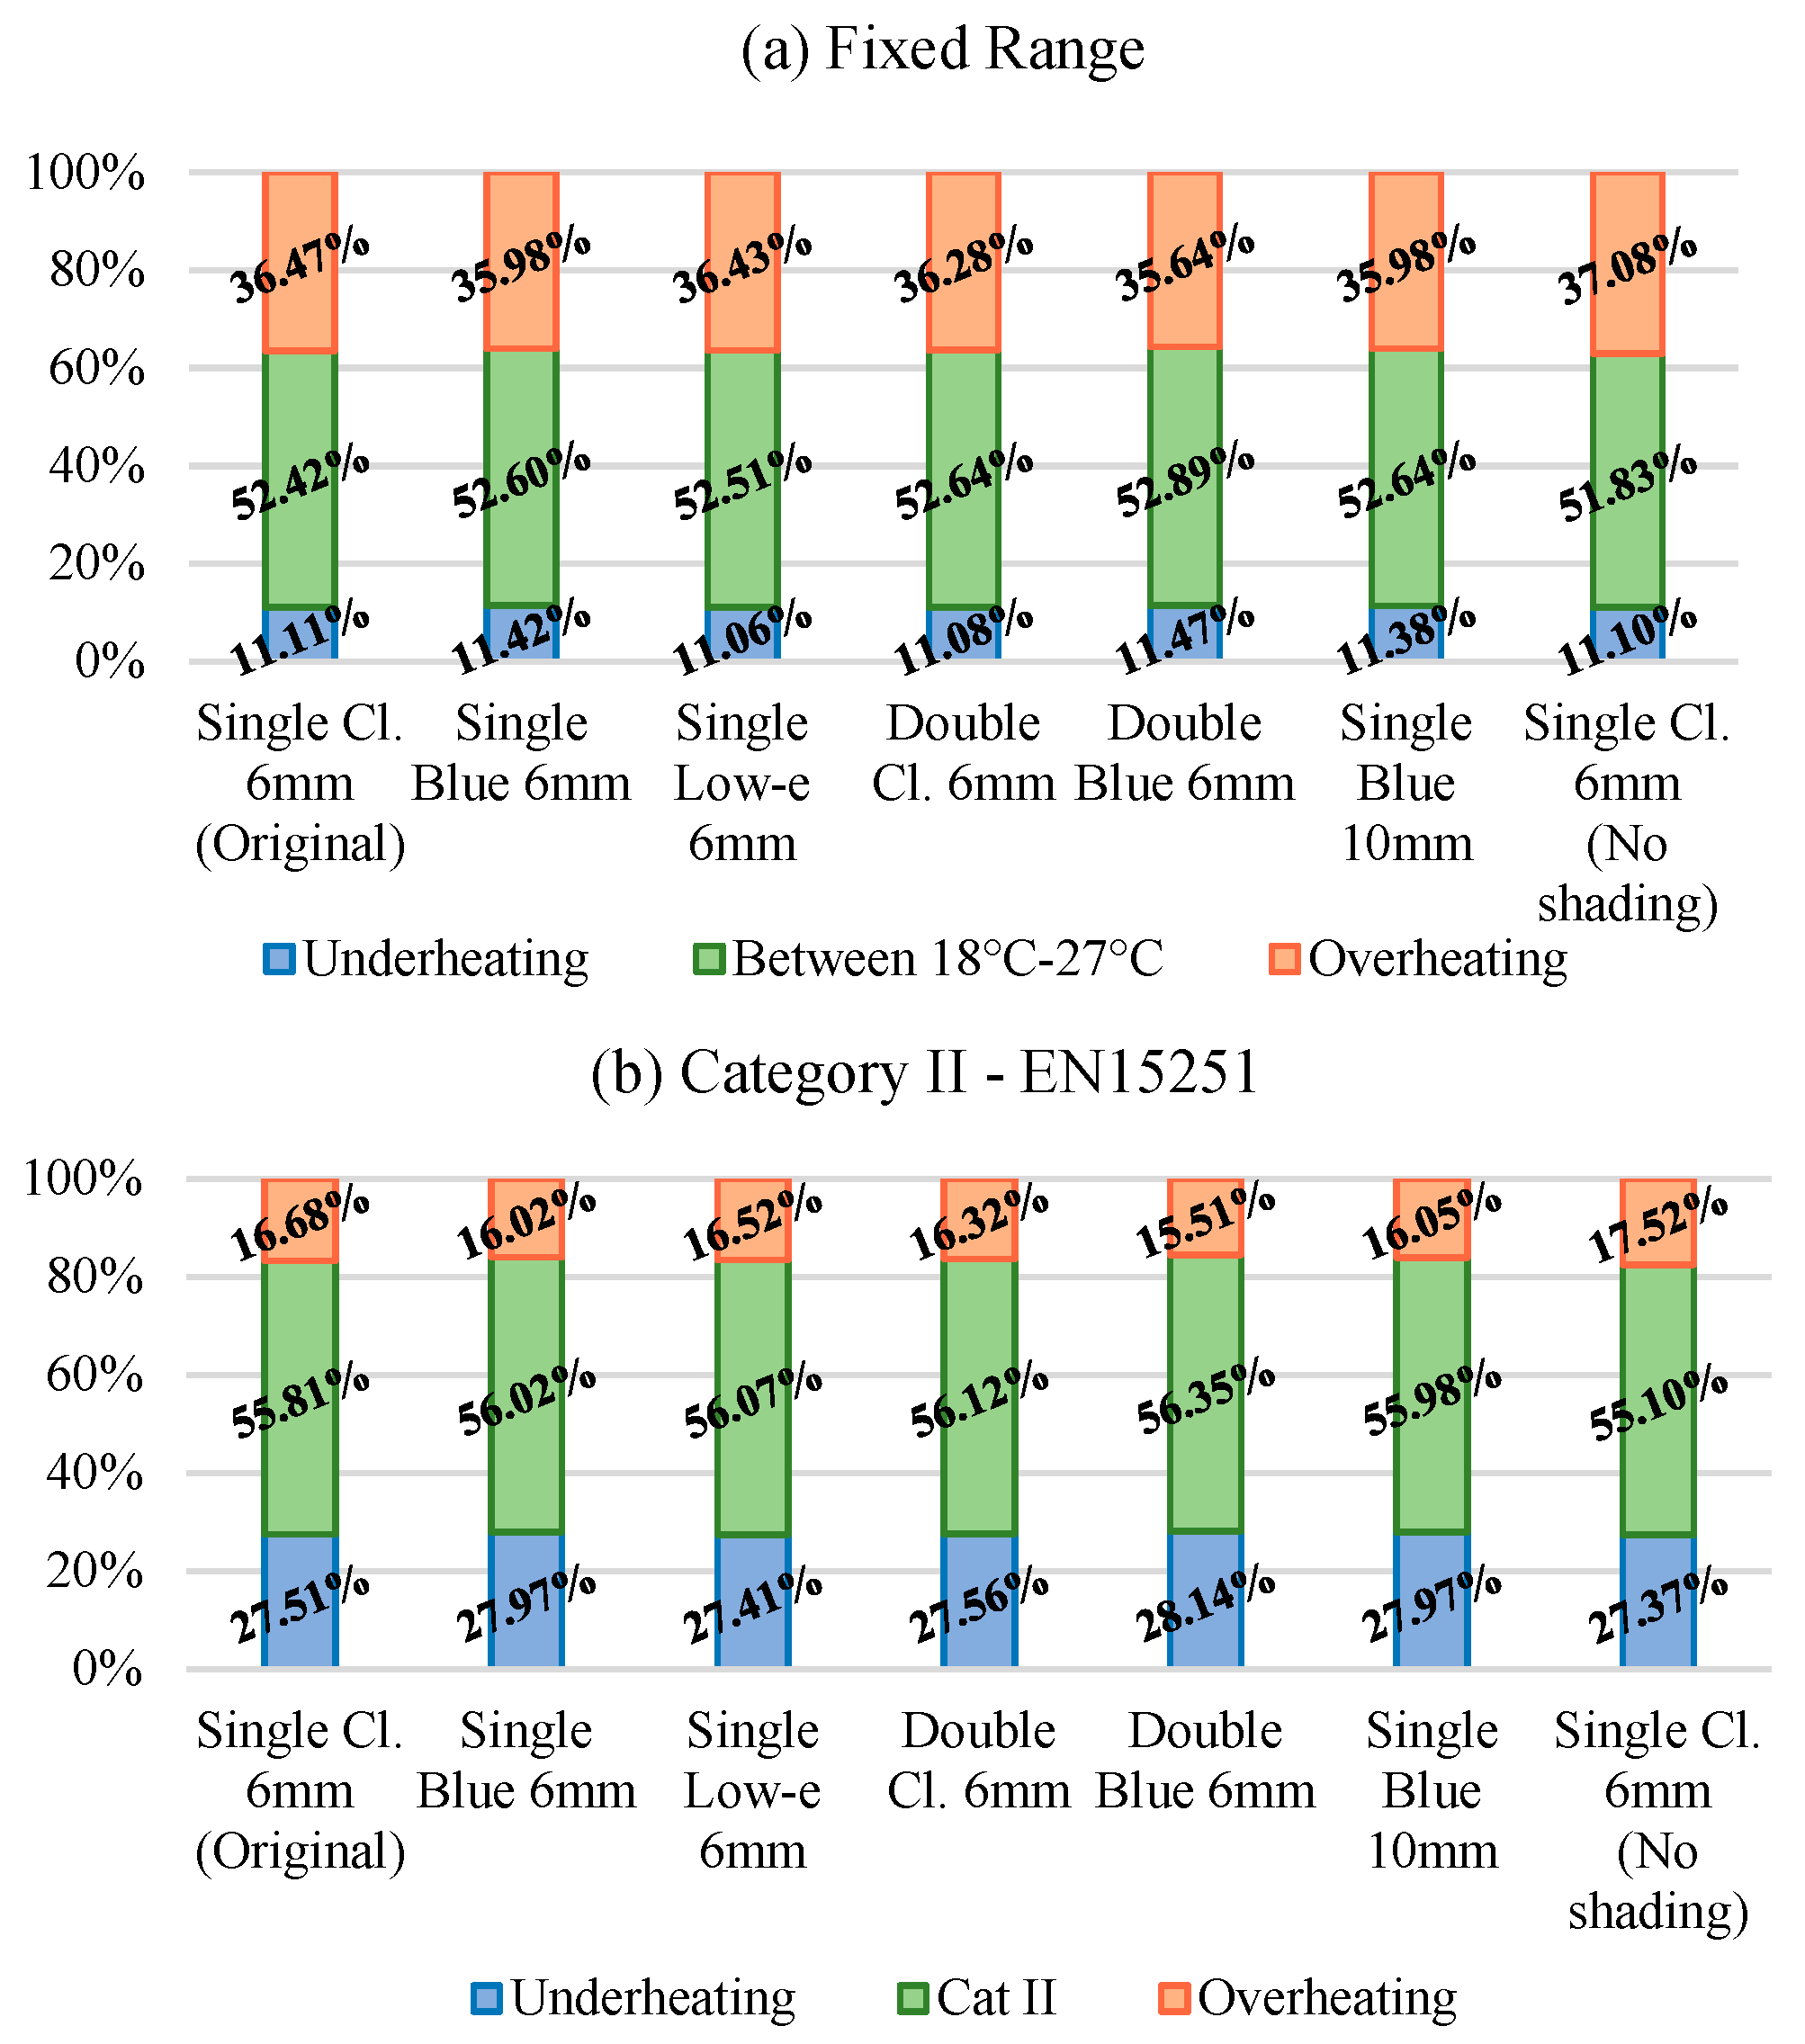
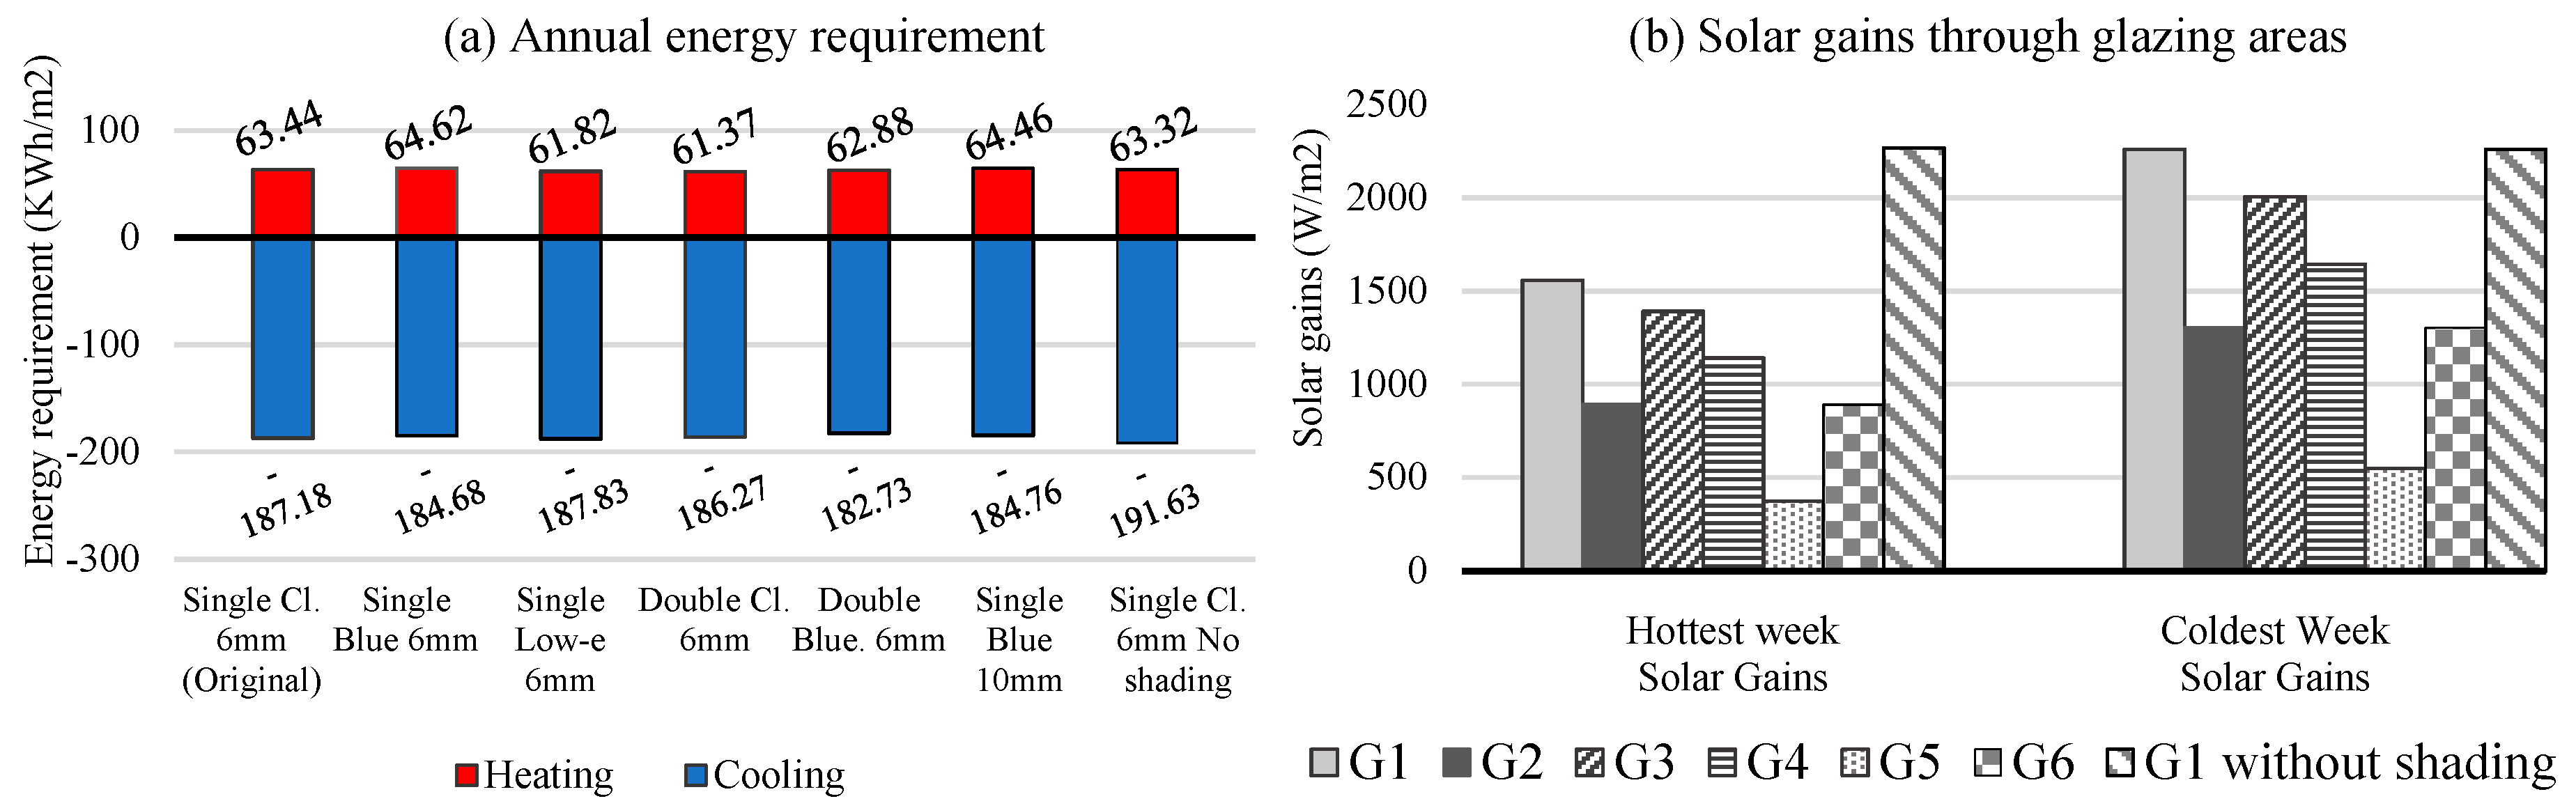
4.1. Configurations for Glazing Type
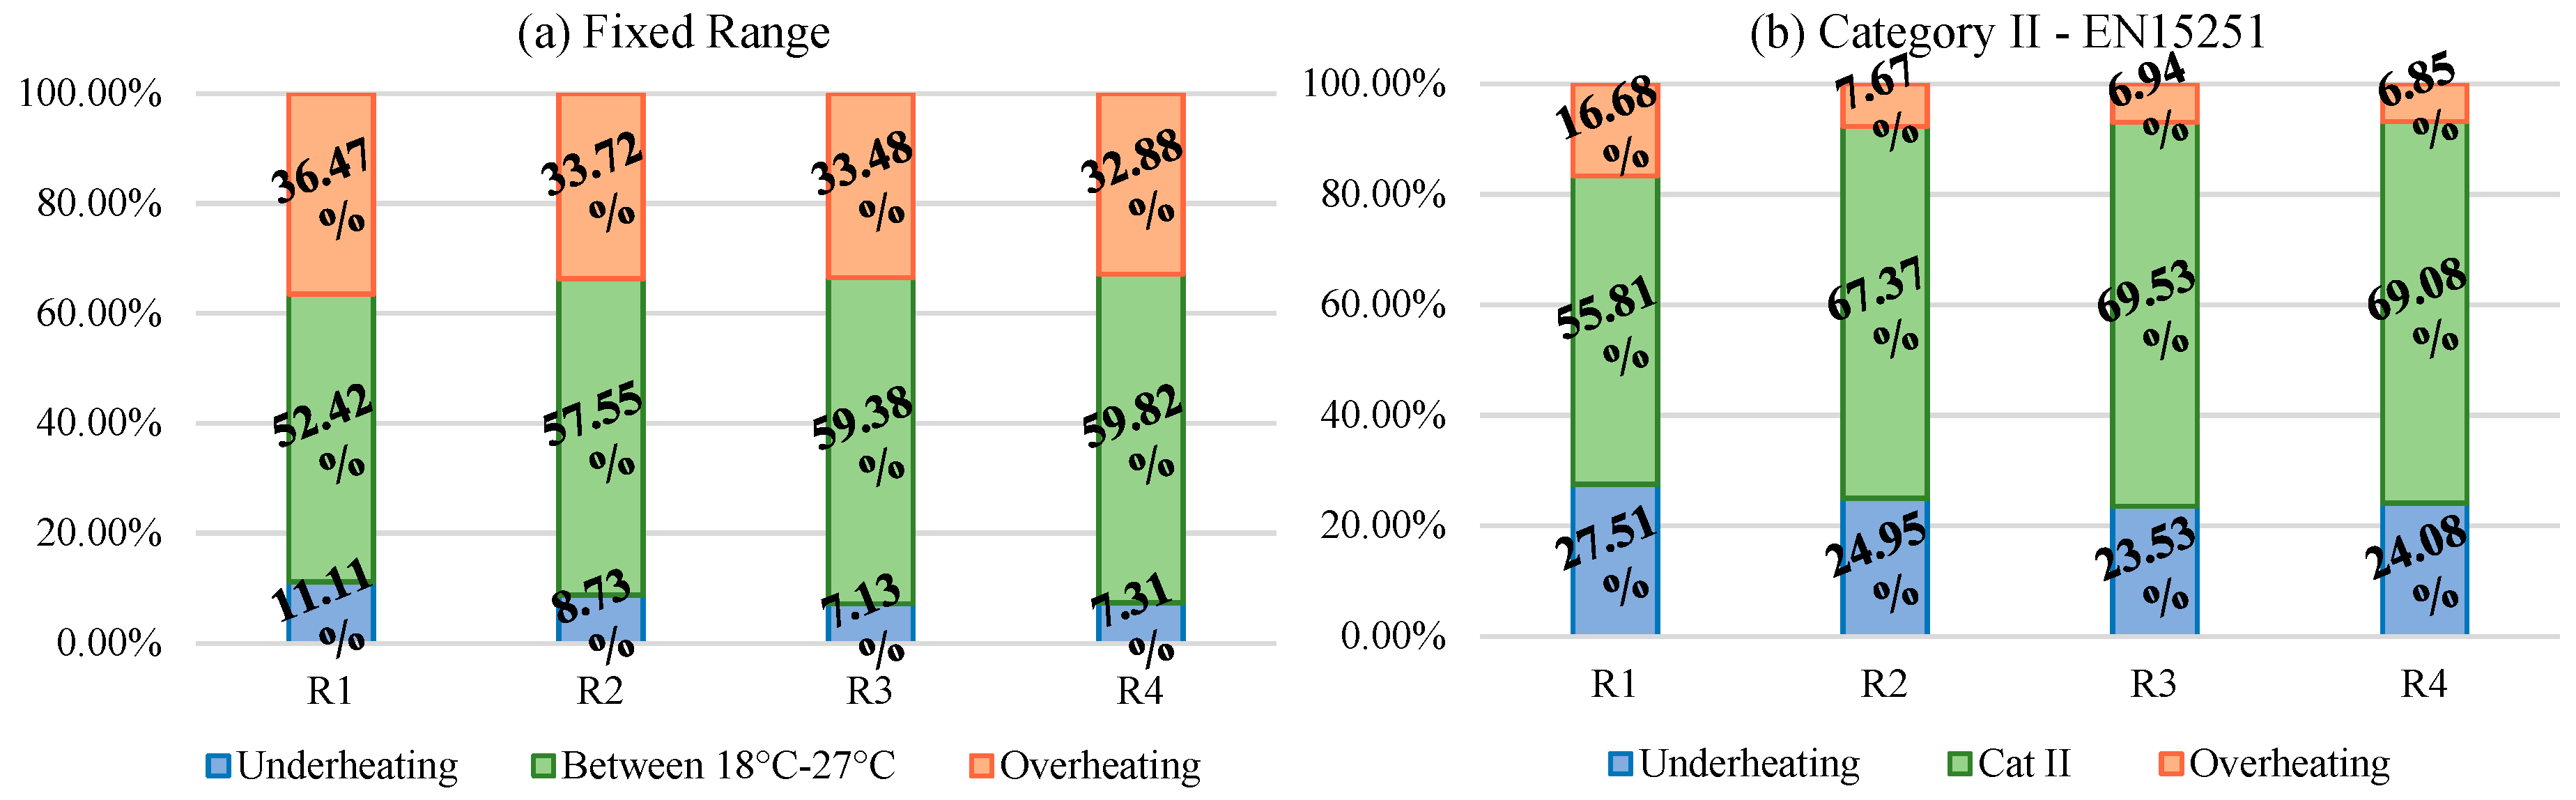
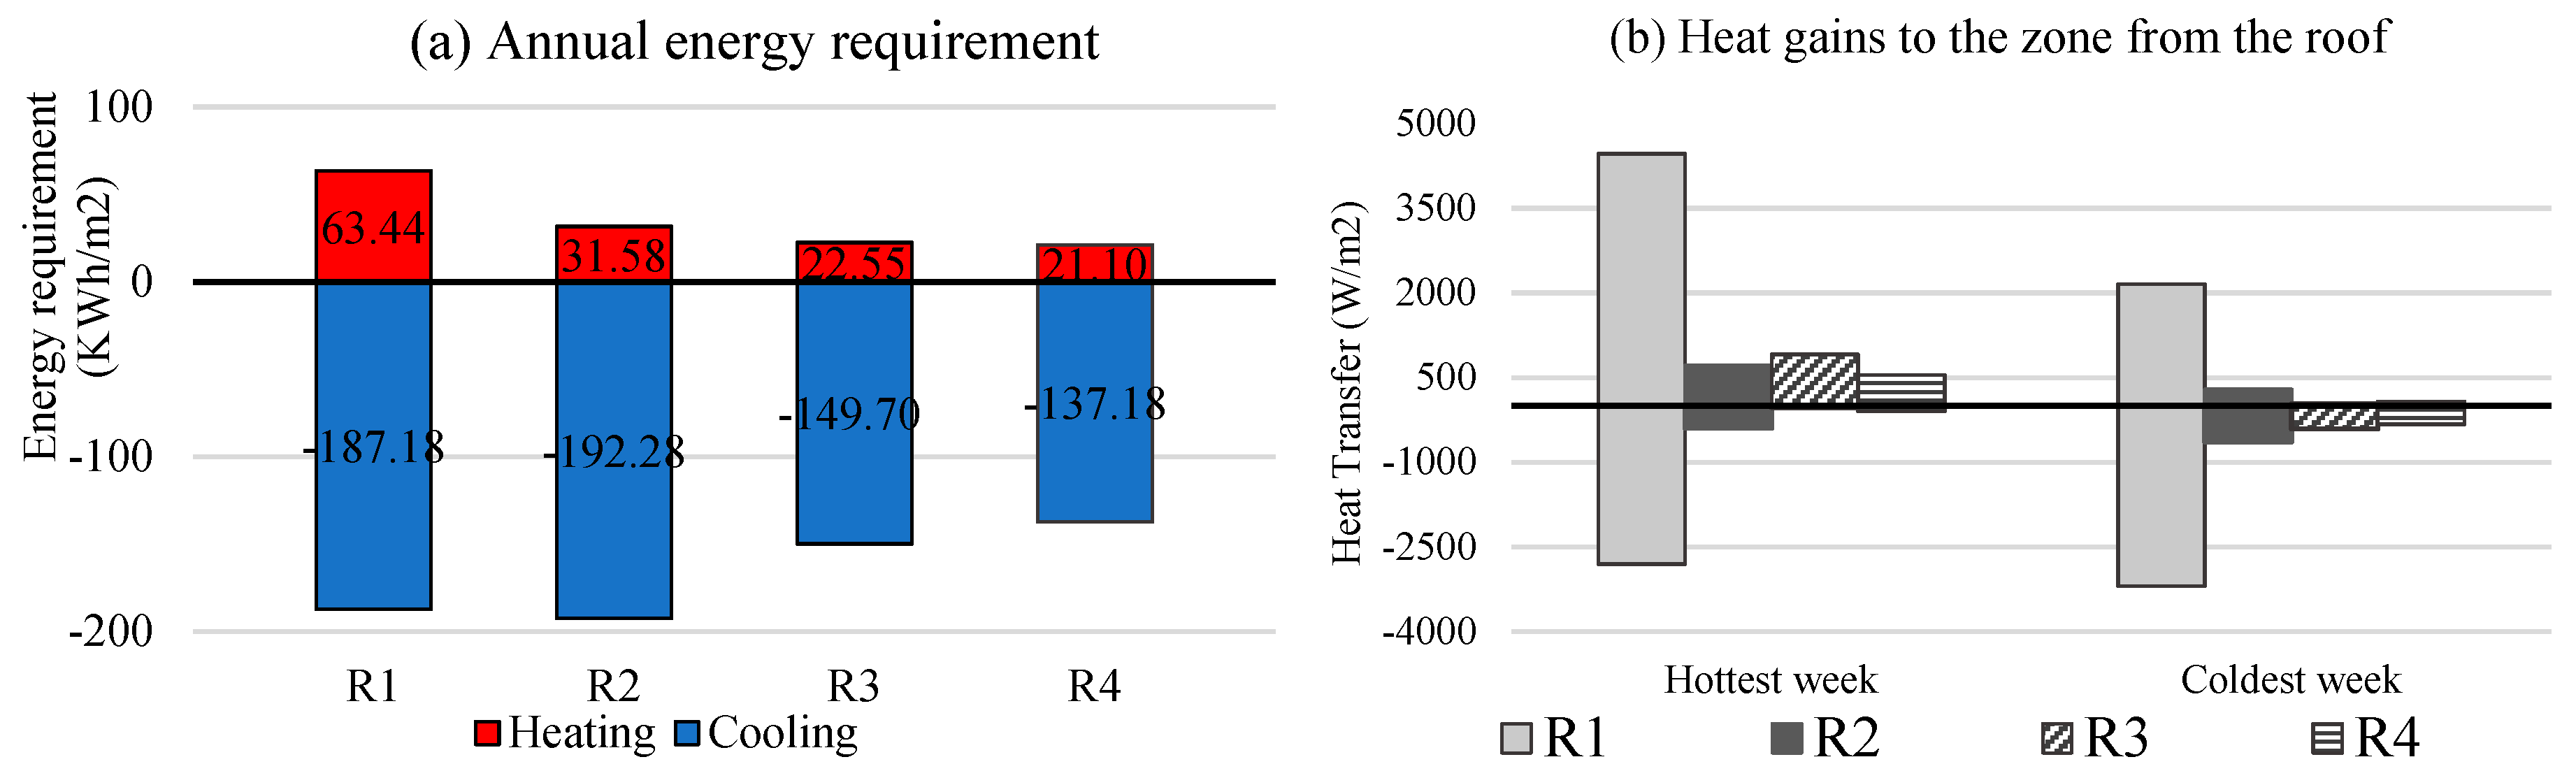
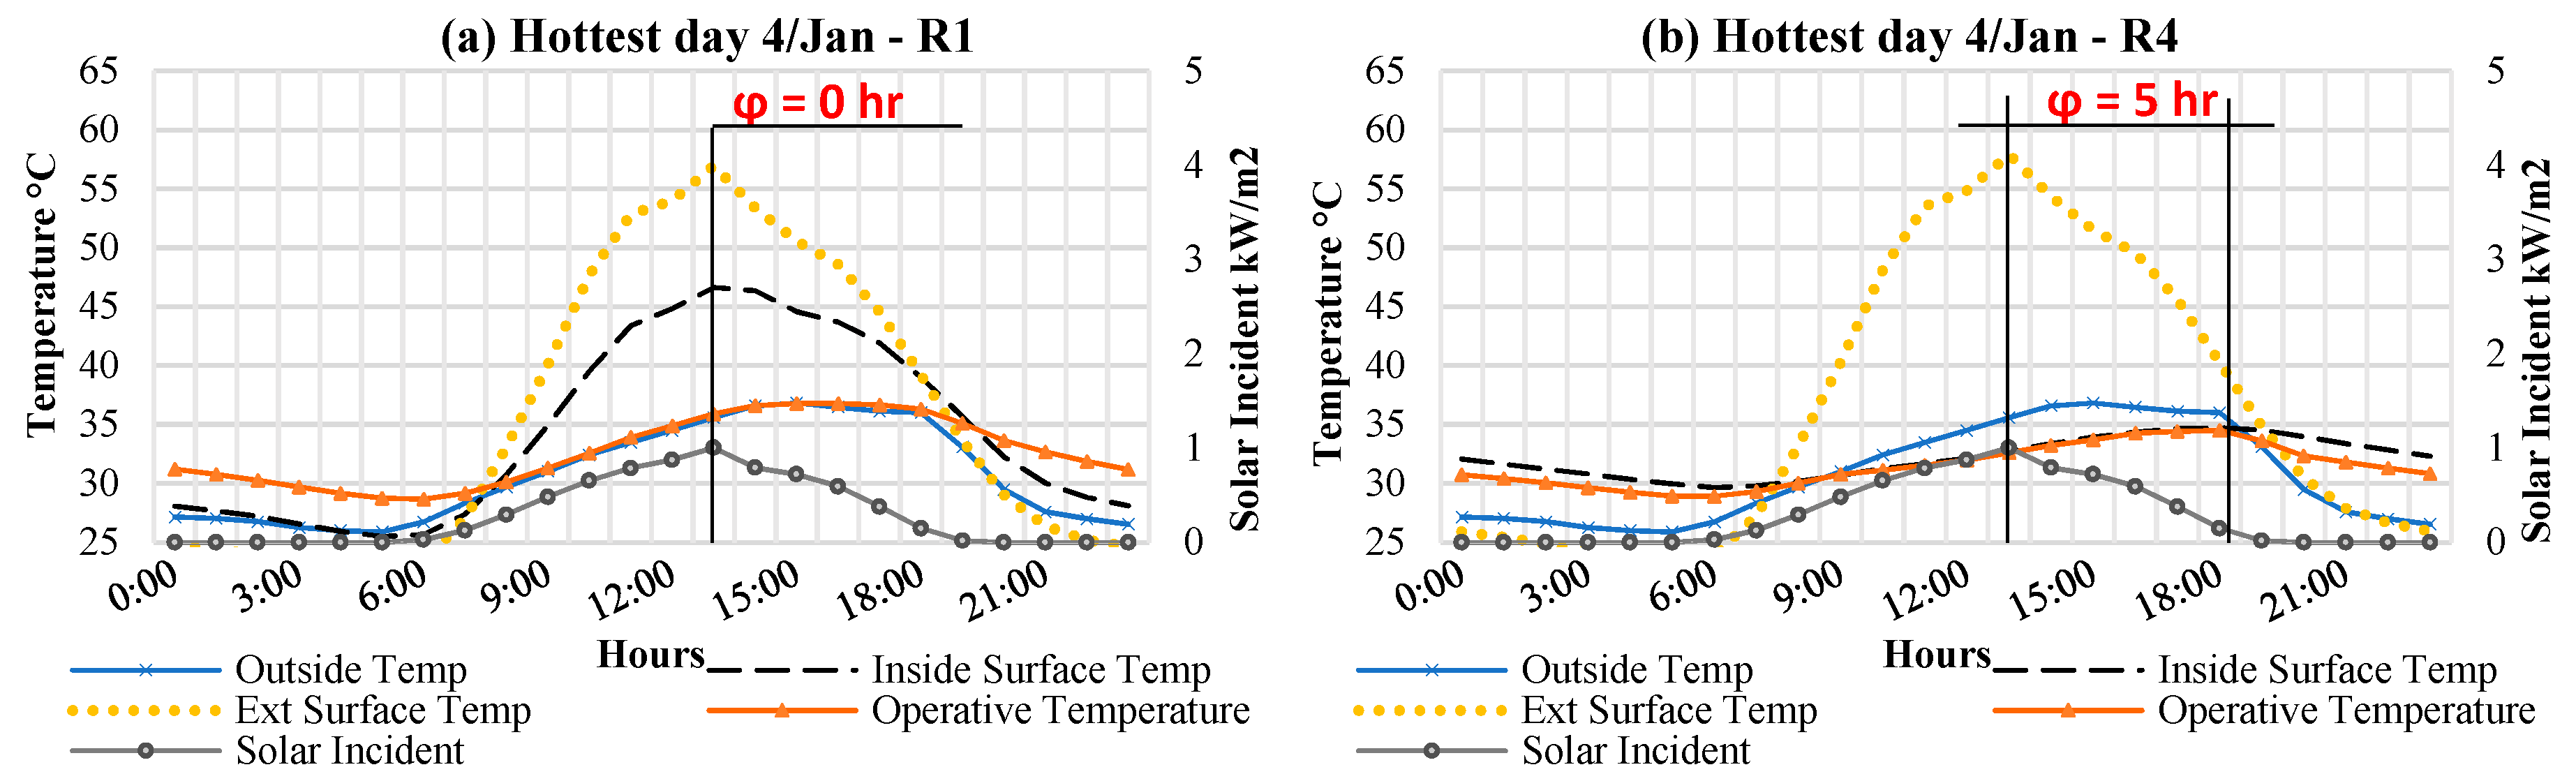
4.2. Configurations for the Roof
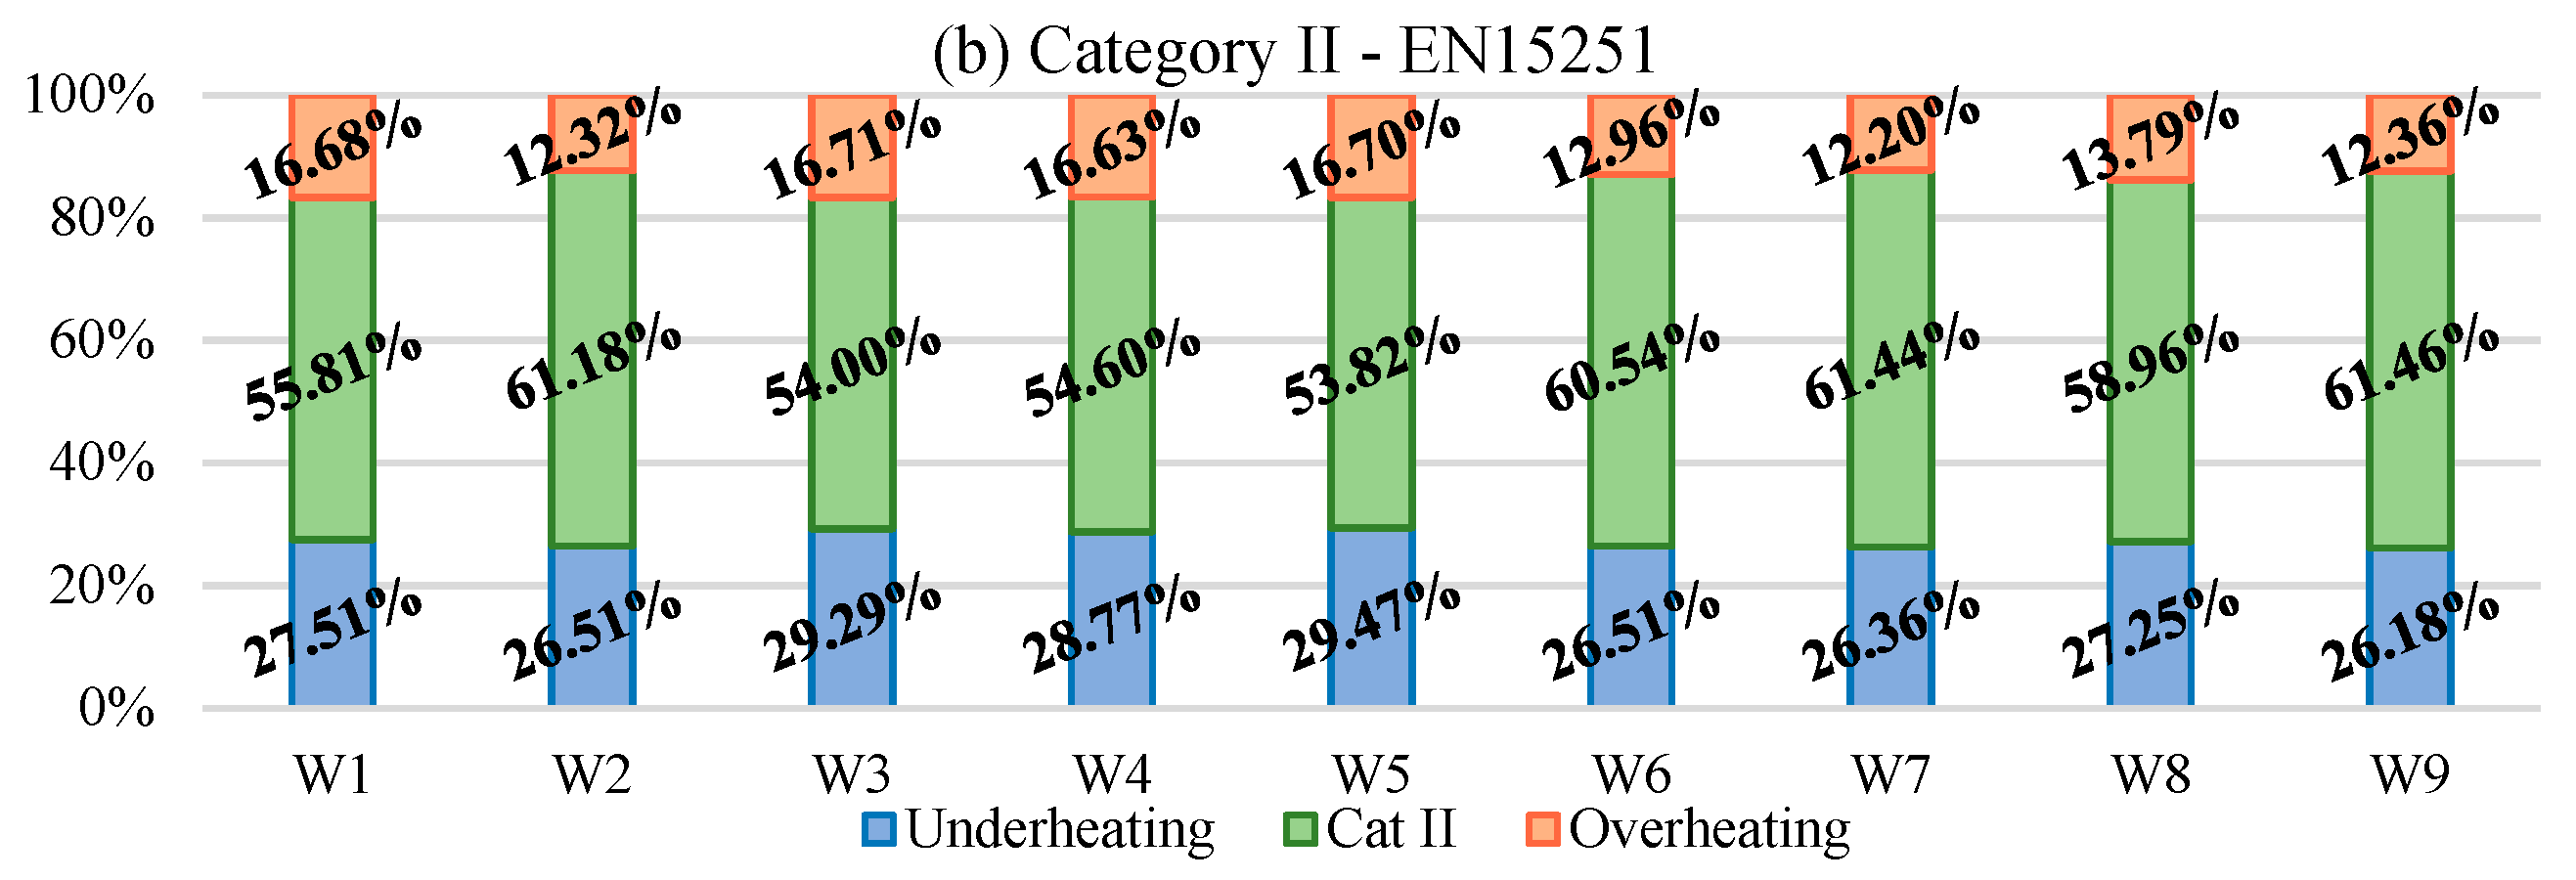
4.3. Configurations for the Walls
4.4. Application of the AHP Method to Choose the Most Recommended Configuration
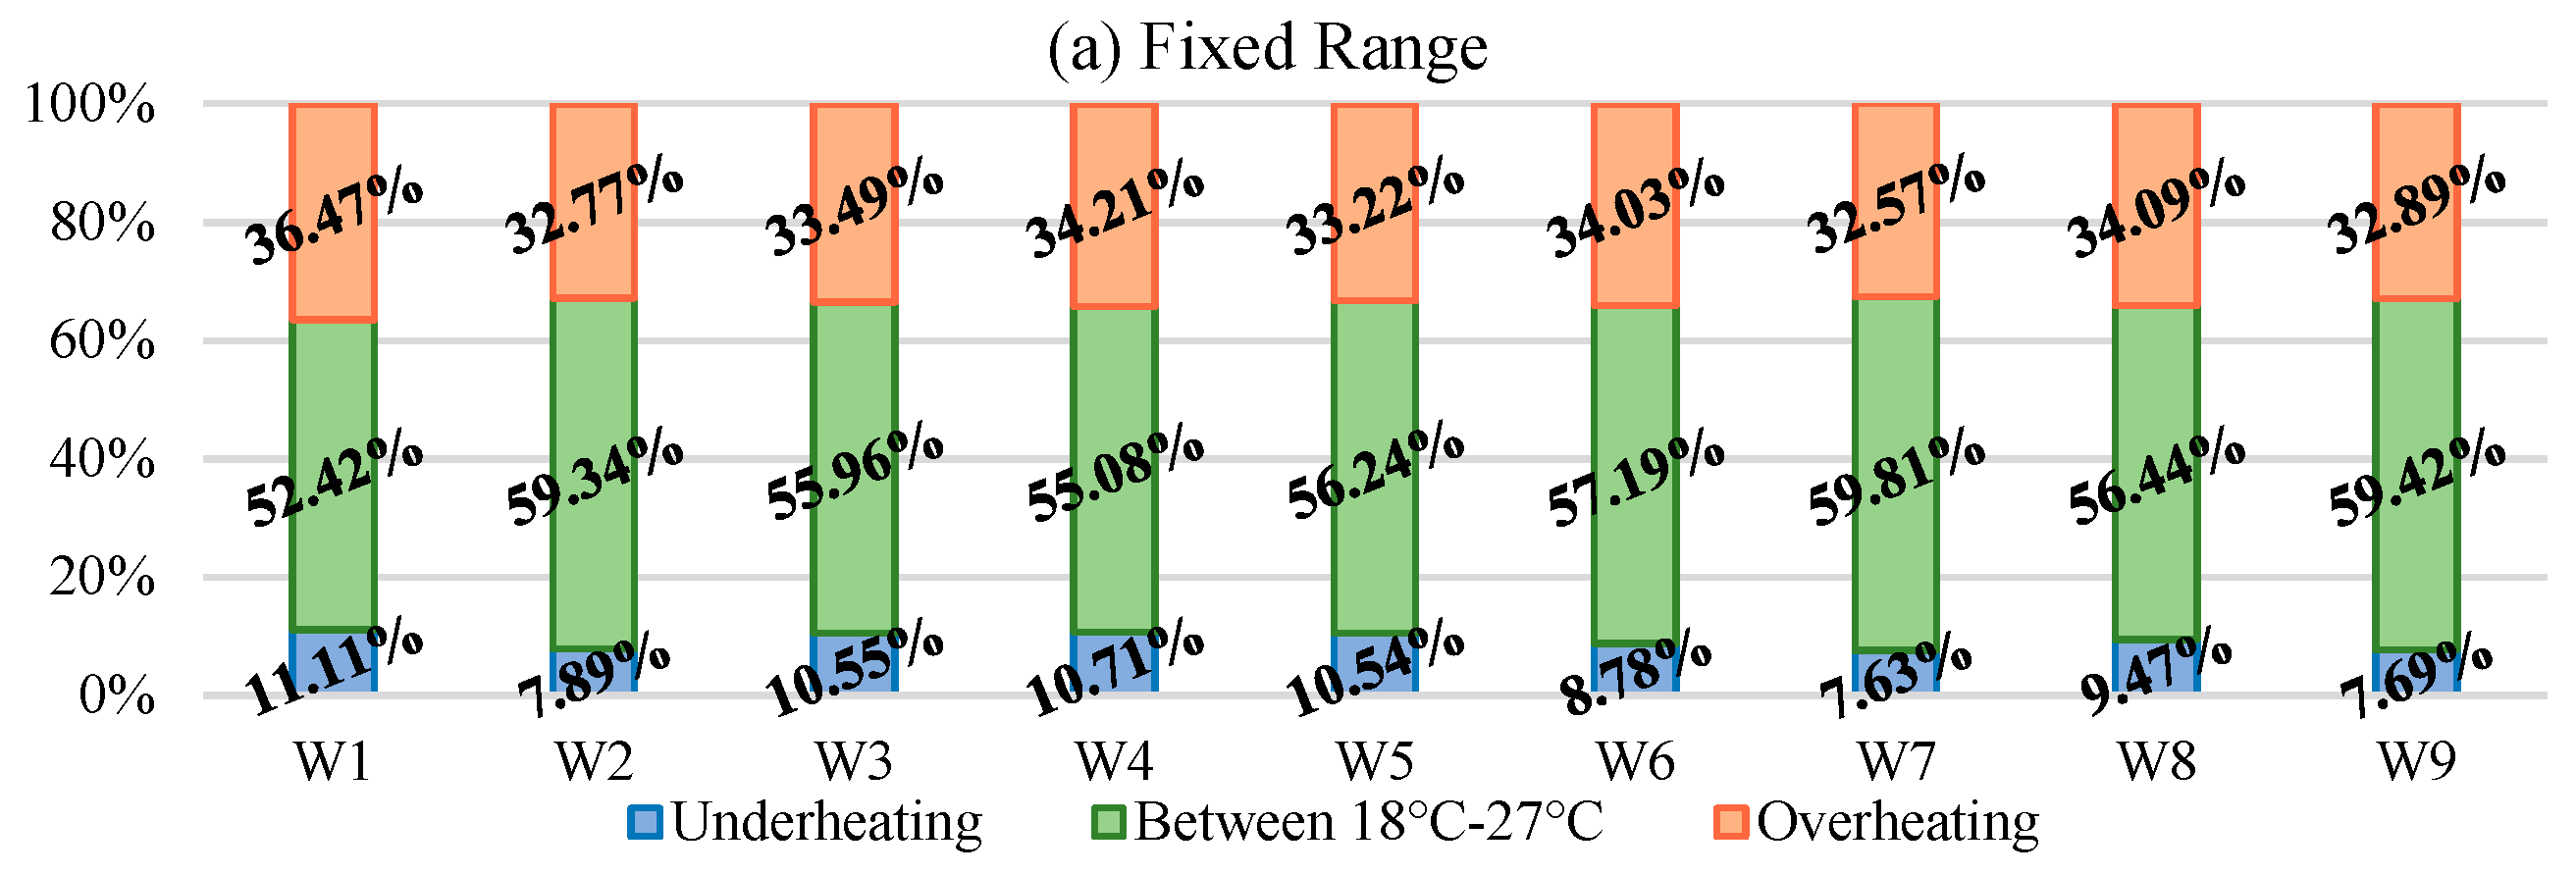
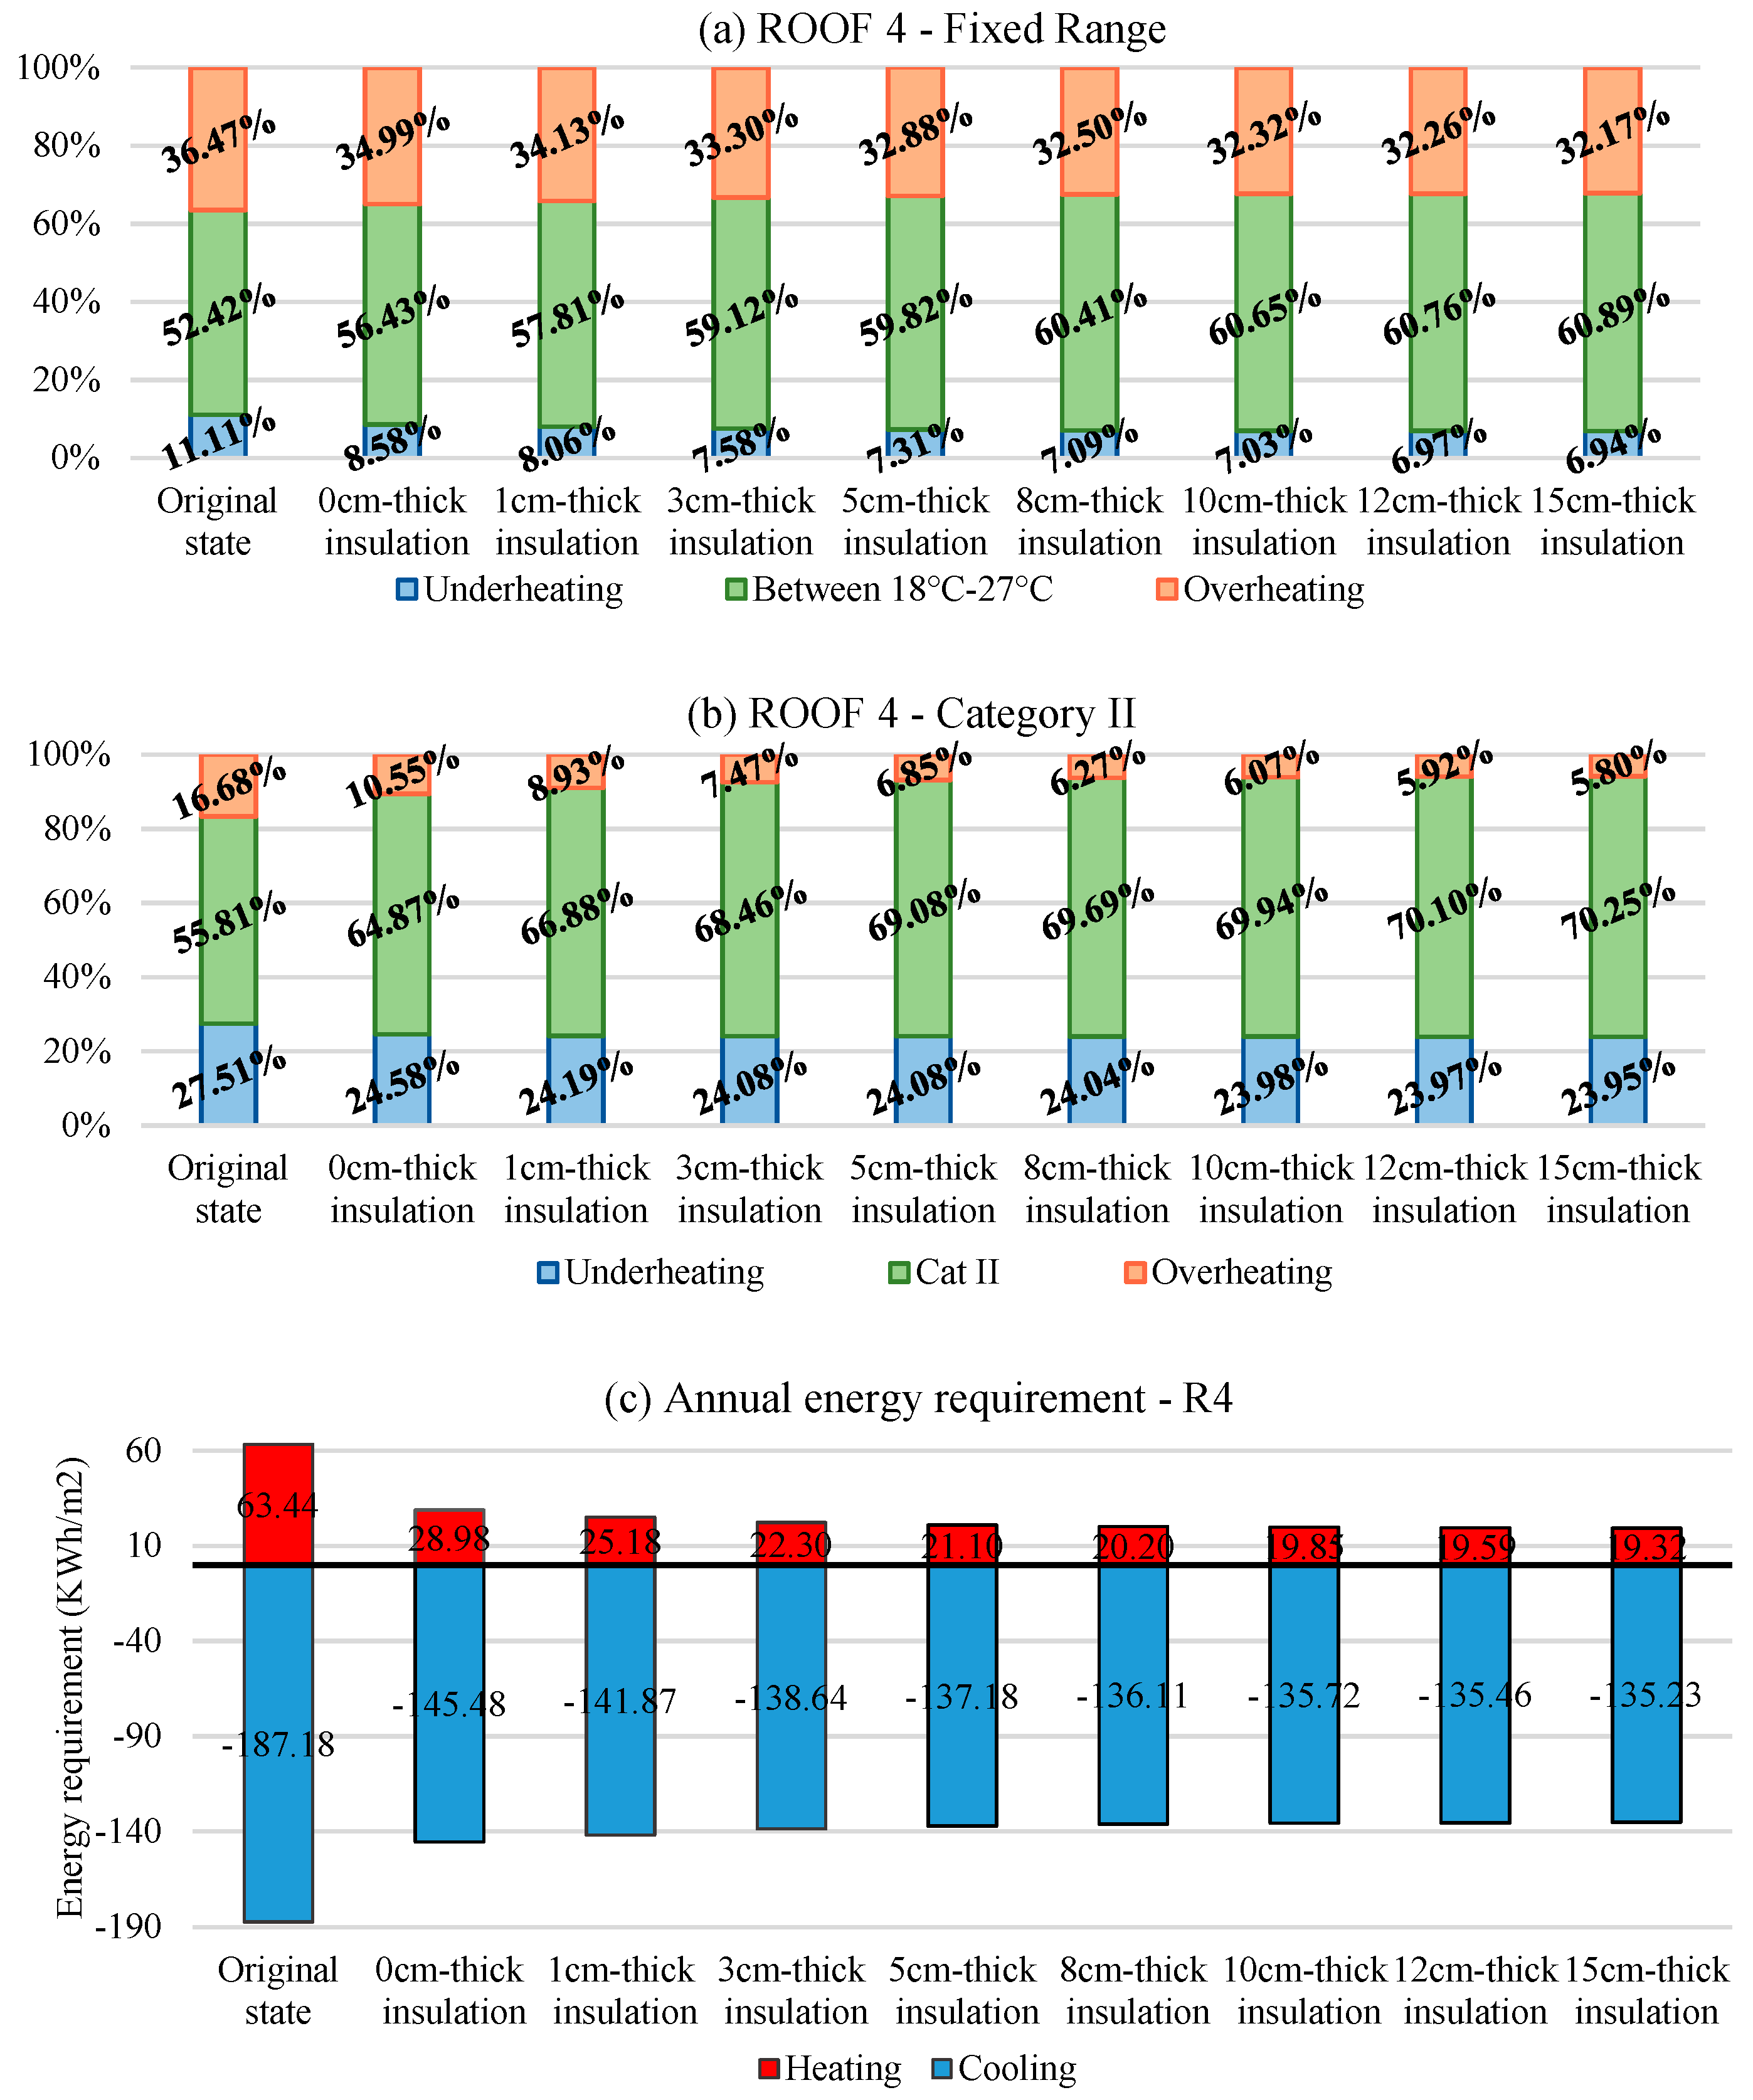
4.5. Evaluation of Different Insulation Thicknesses for the Roof
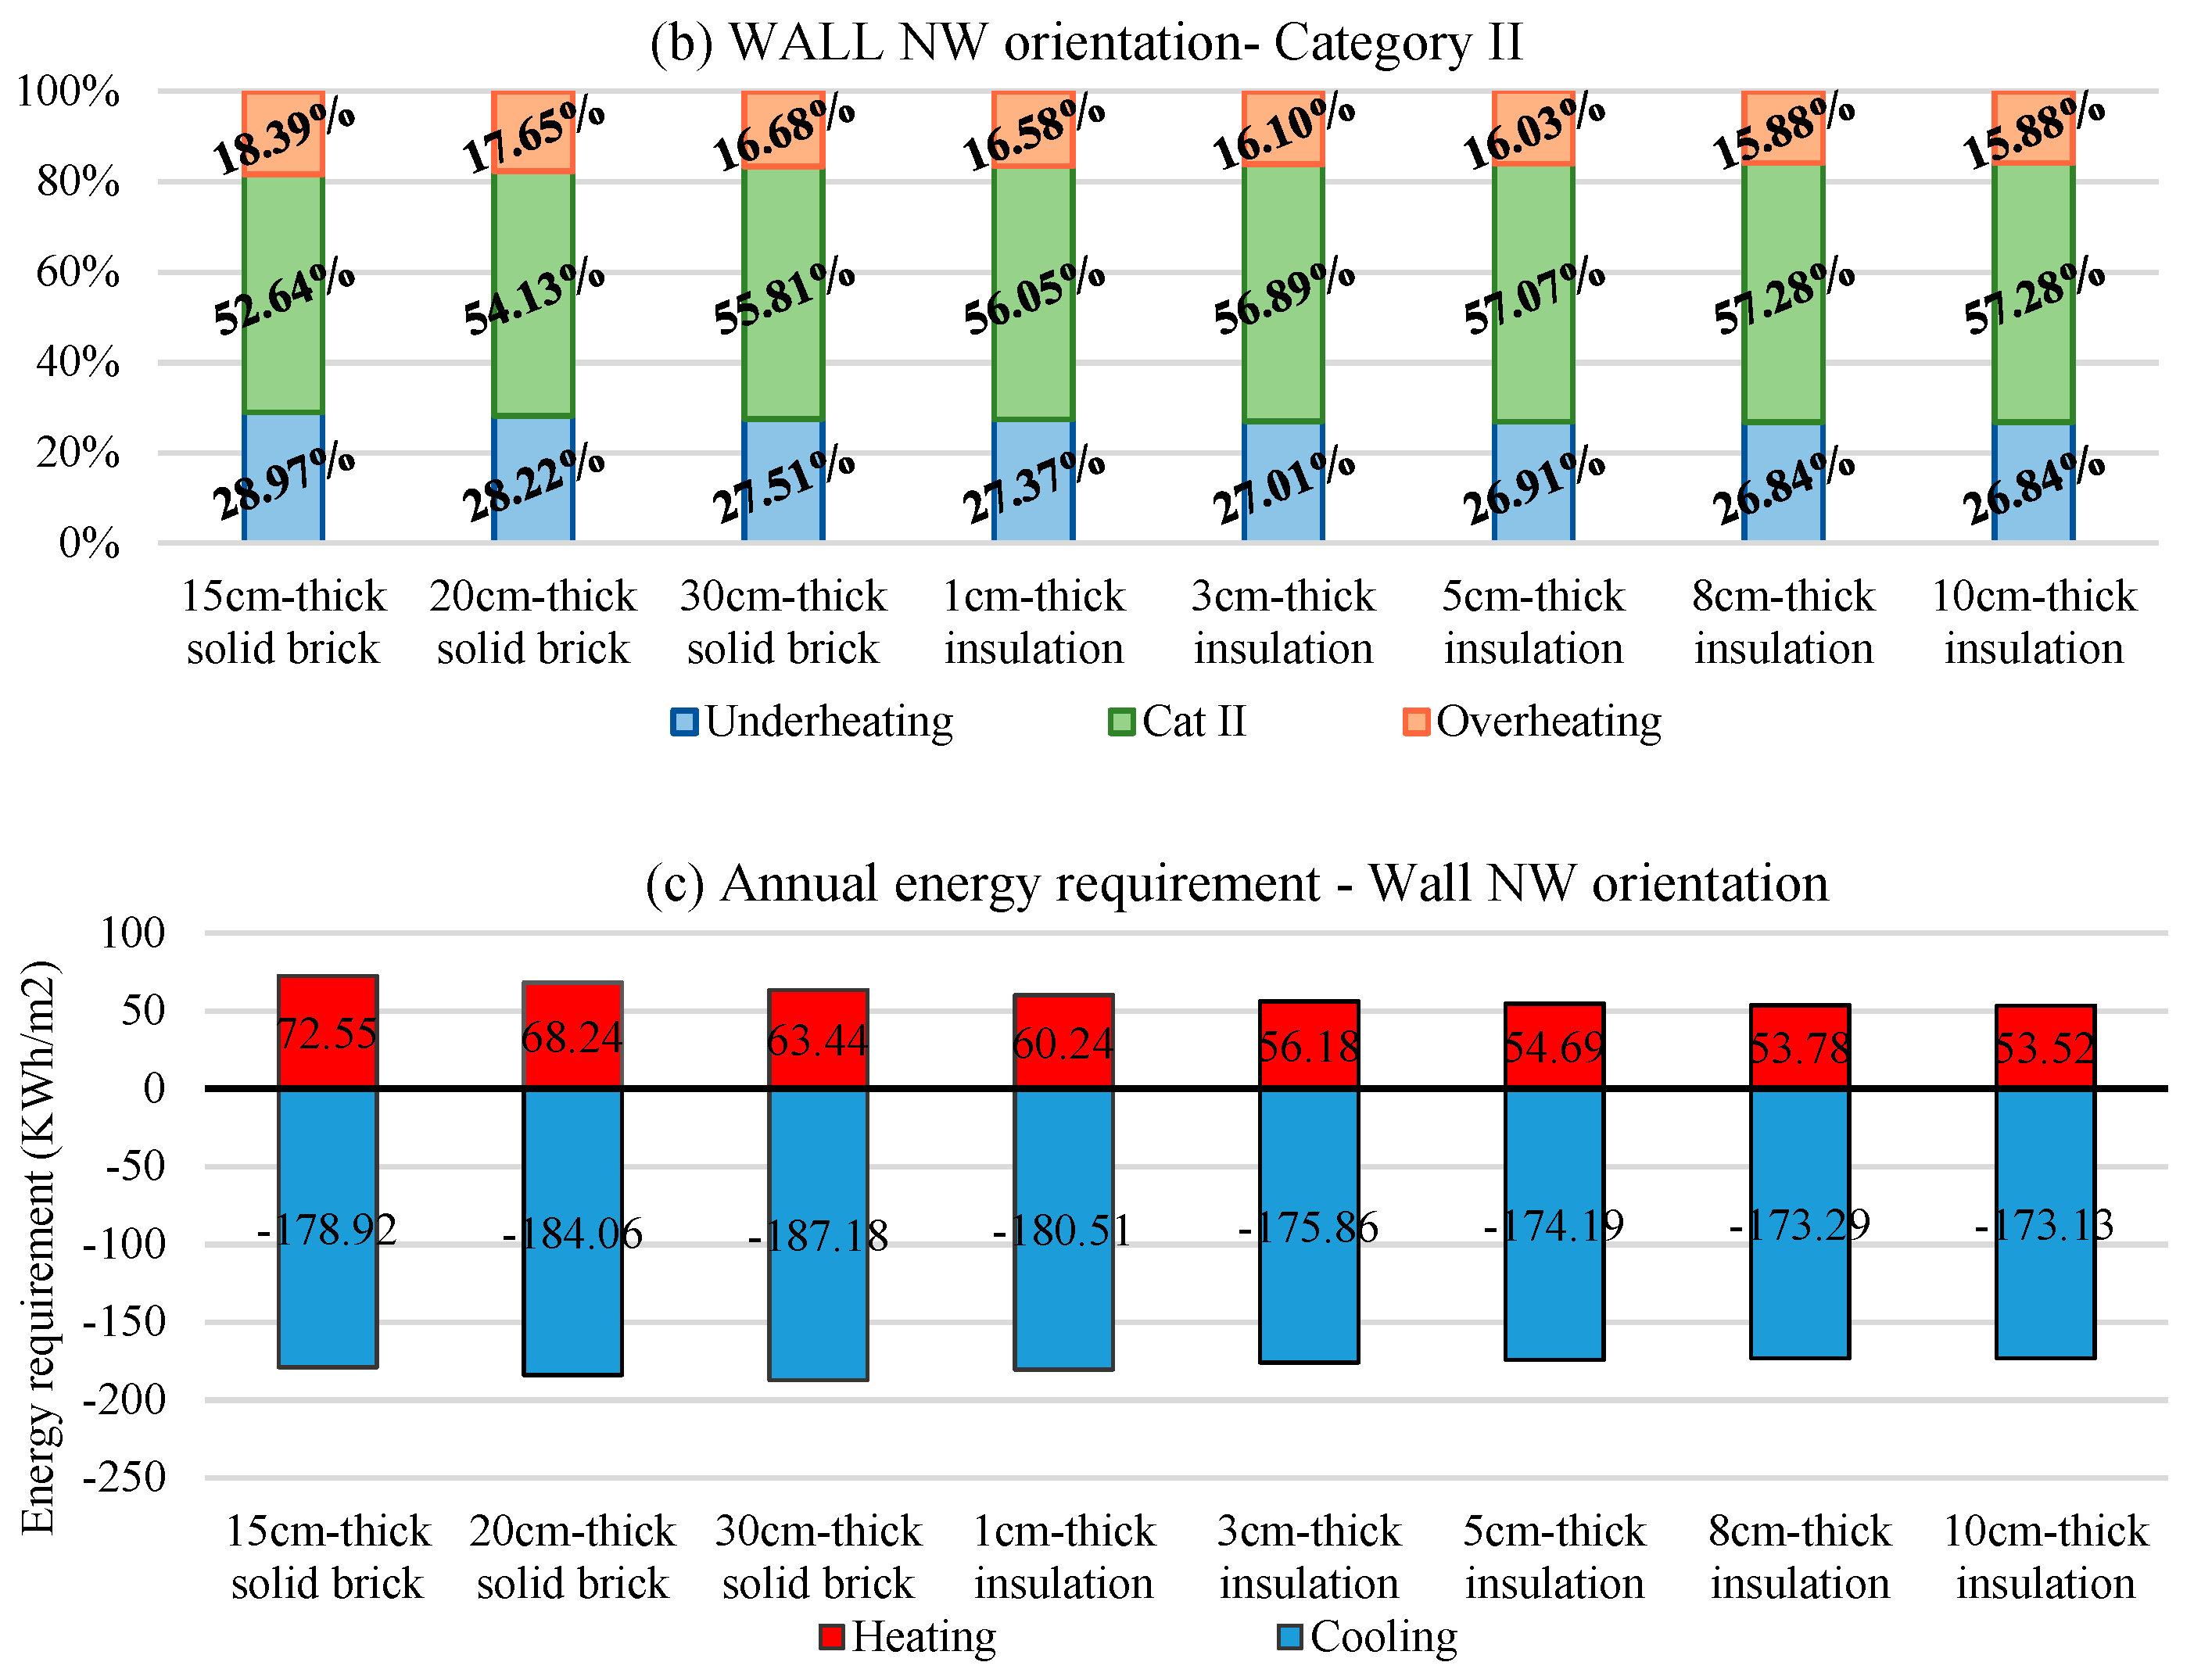
4.6. Evaluation of Different Insulation Thicknesses for Walls
4.7. Application of the AHP method to choose the most recommended insulation thickness
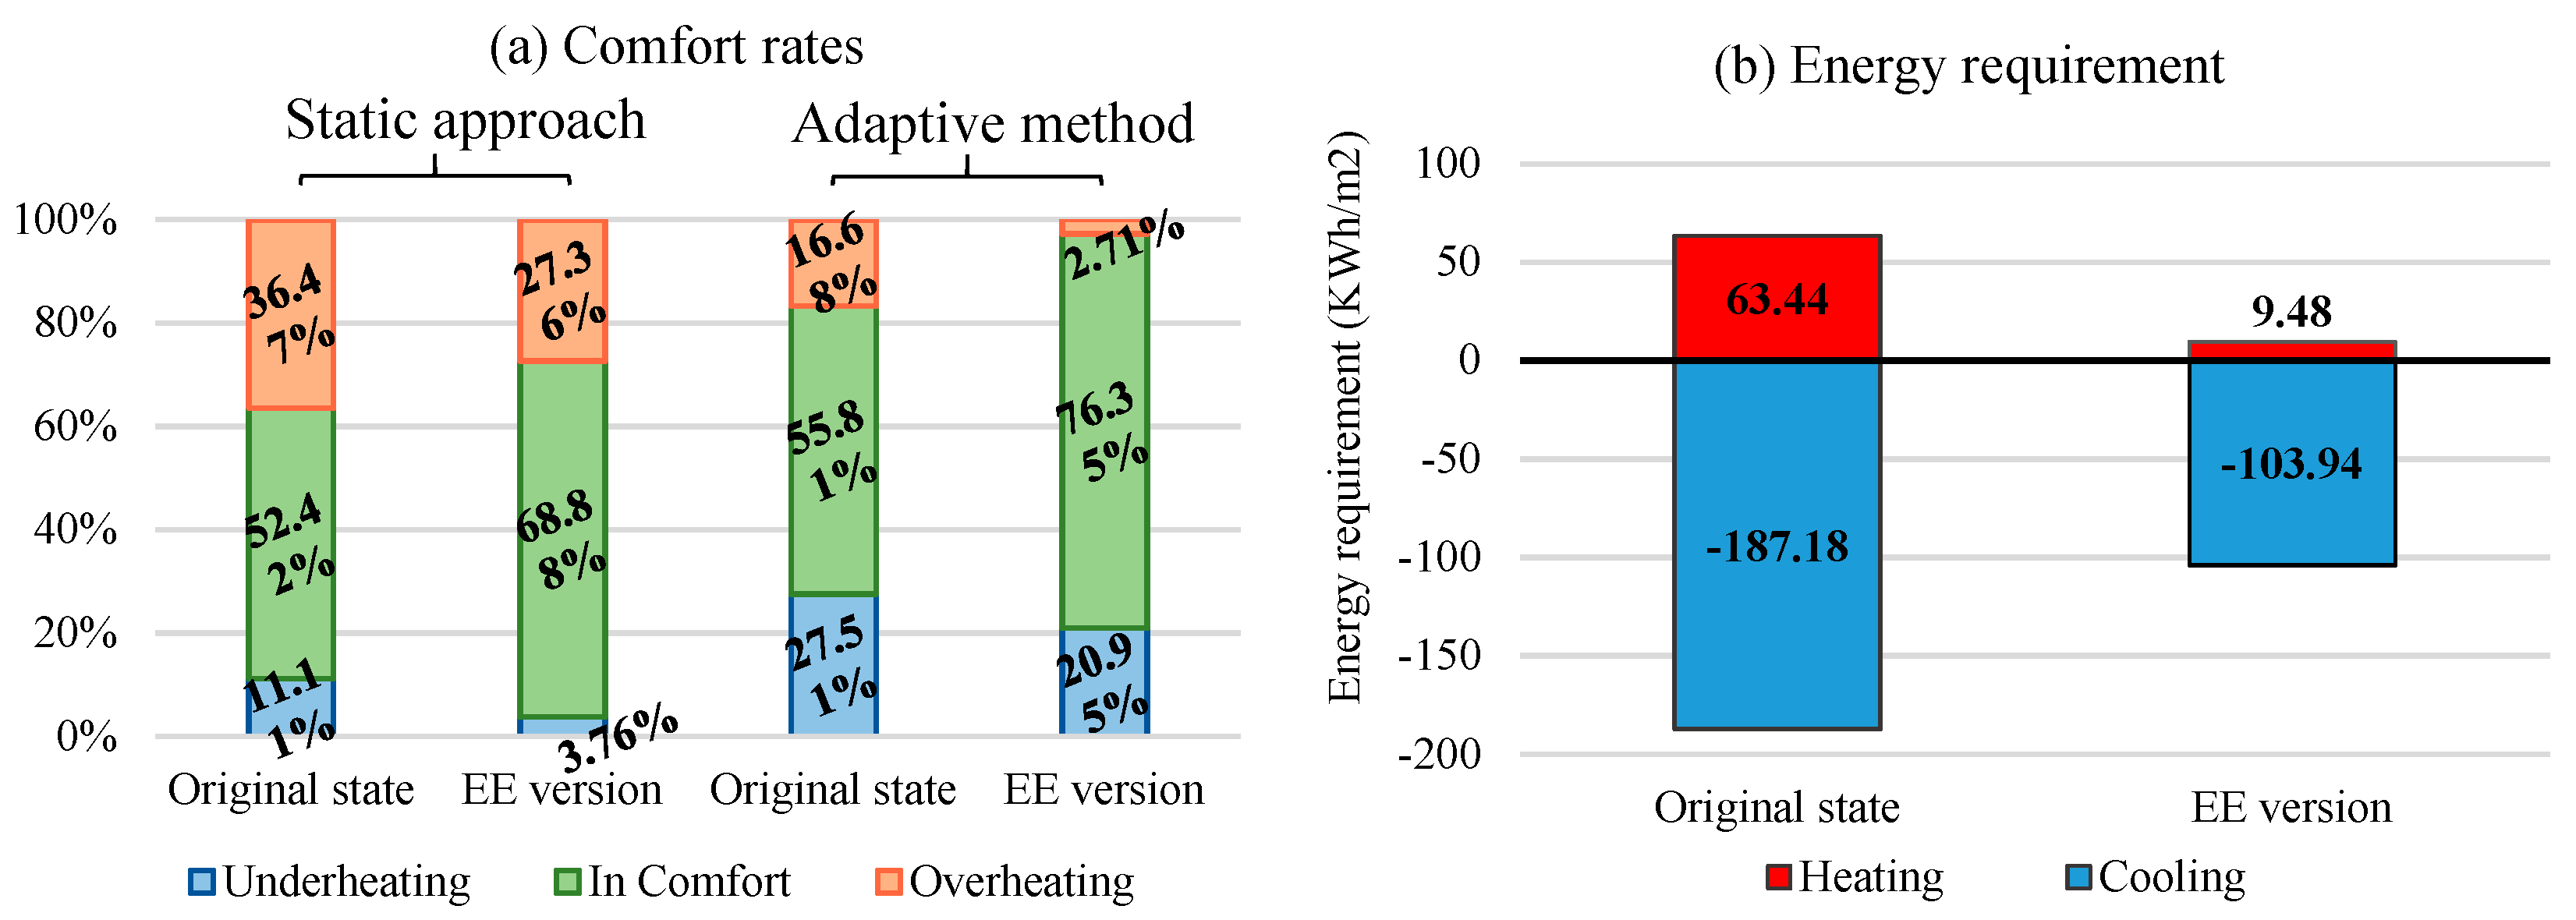
4.8. Thermal Performance Evaluation of the Energy Efficiency Version of the Building
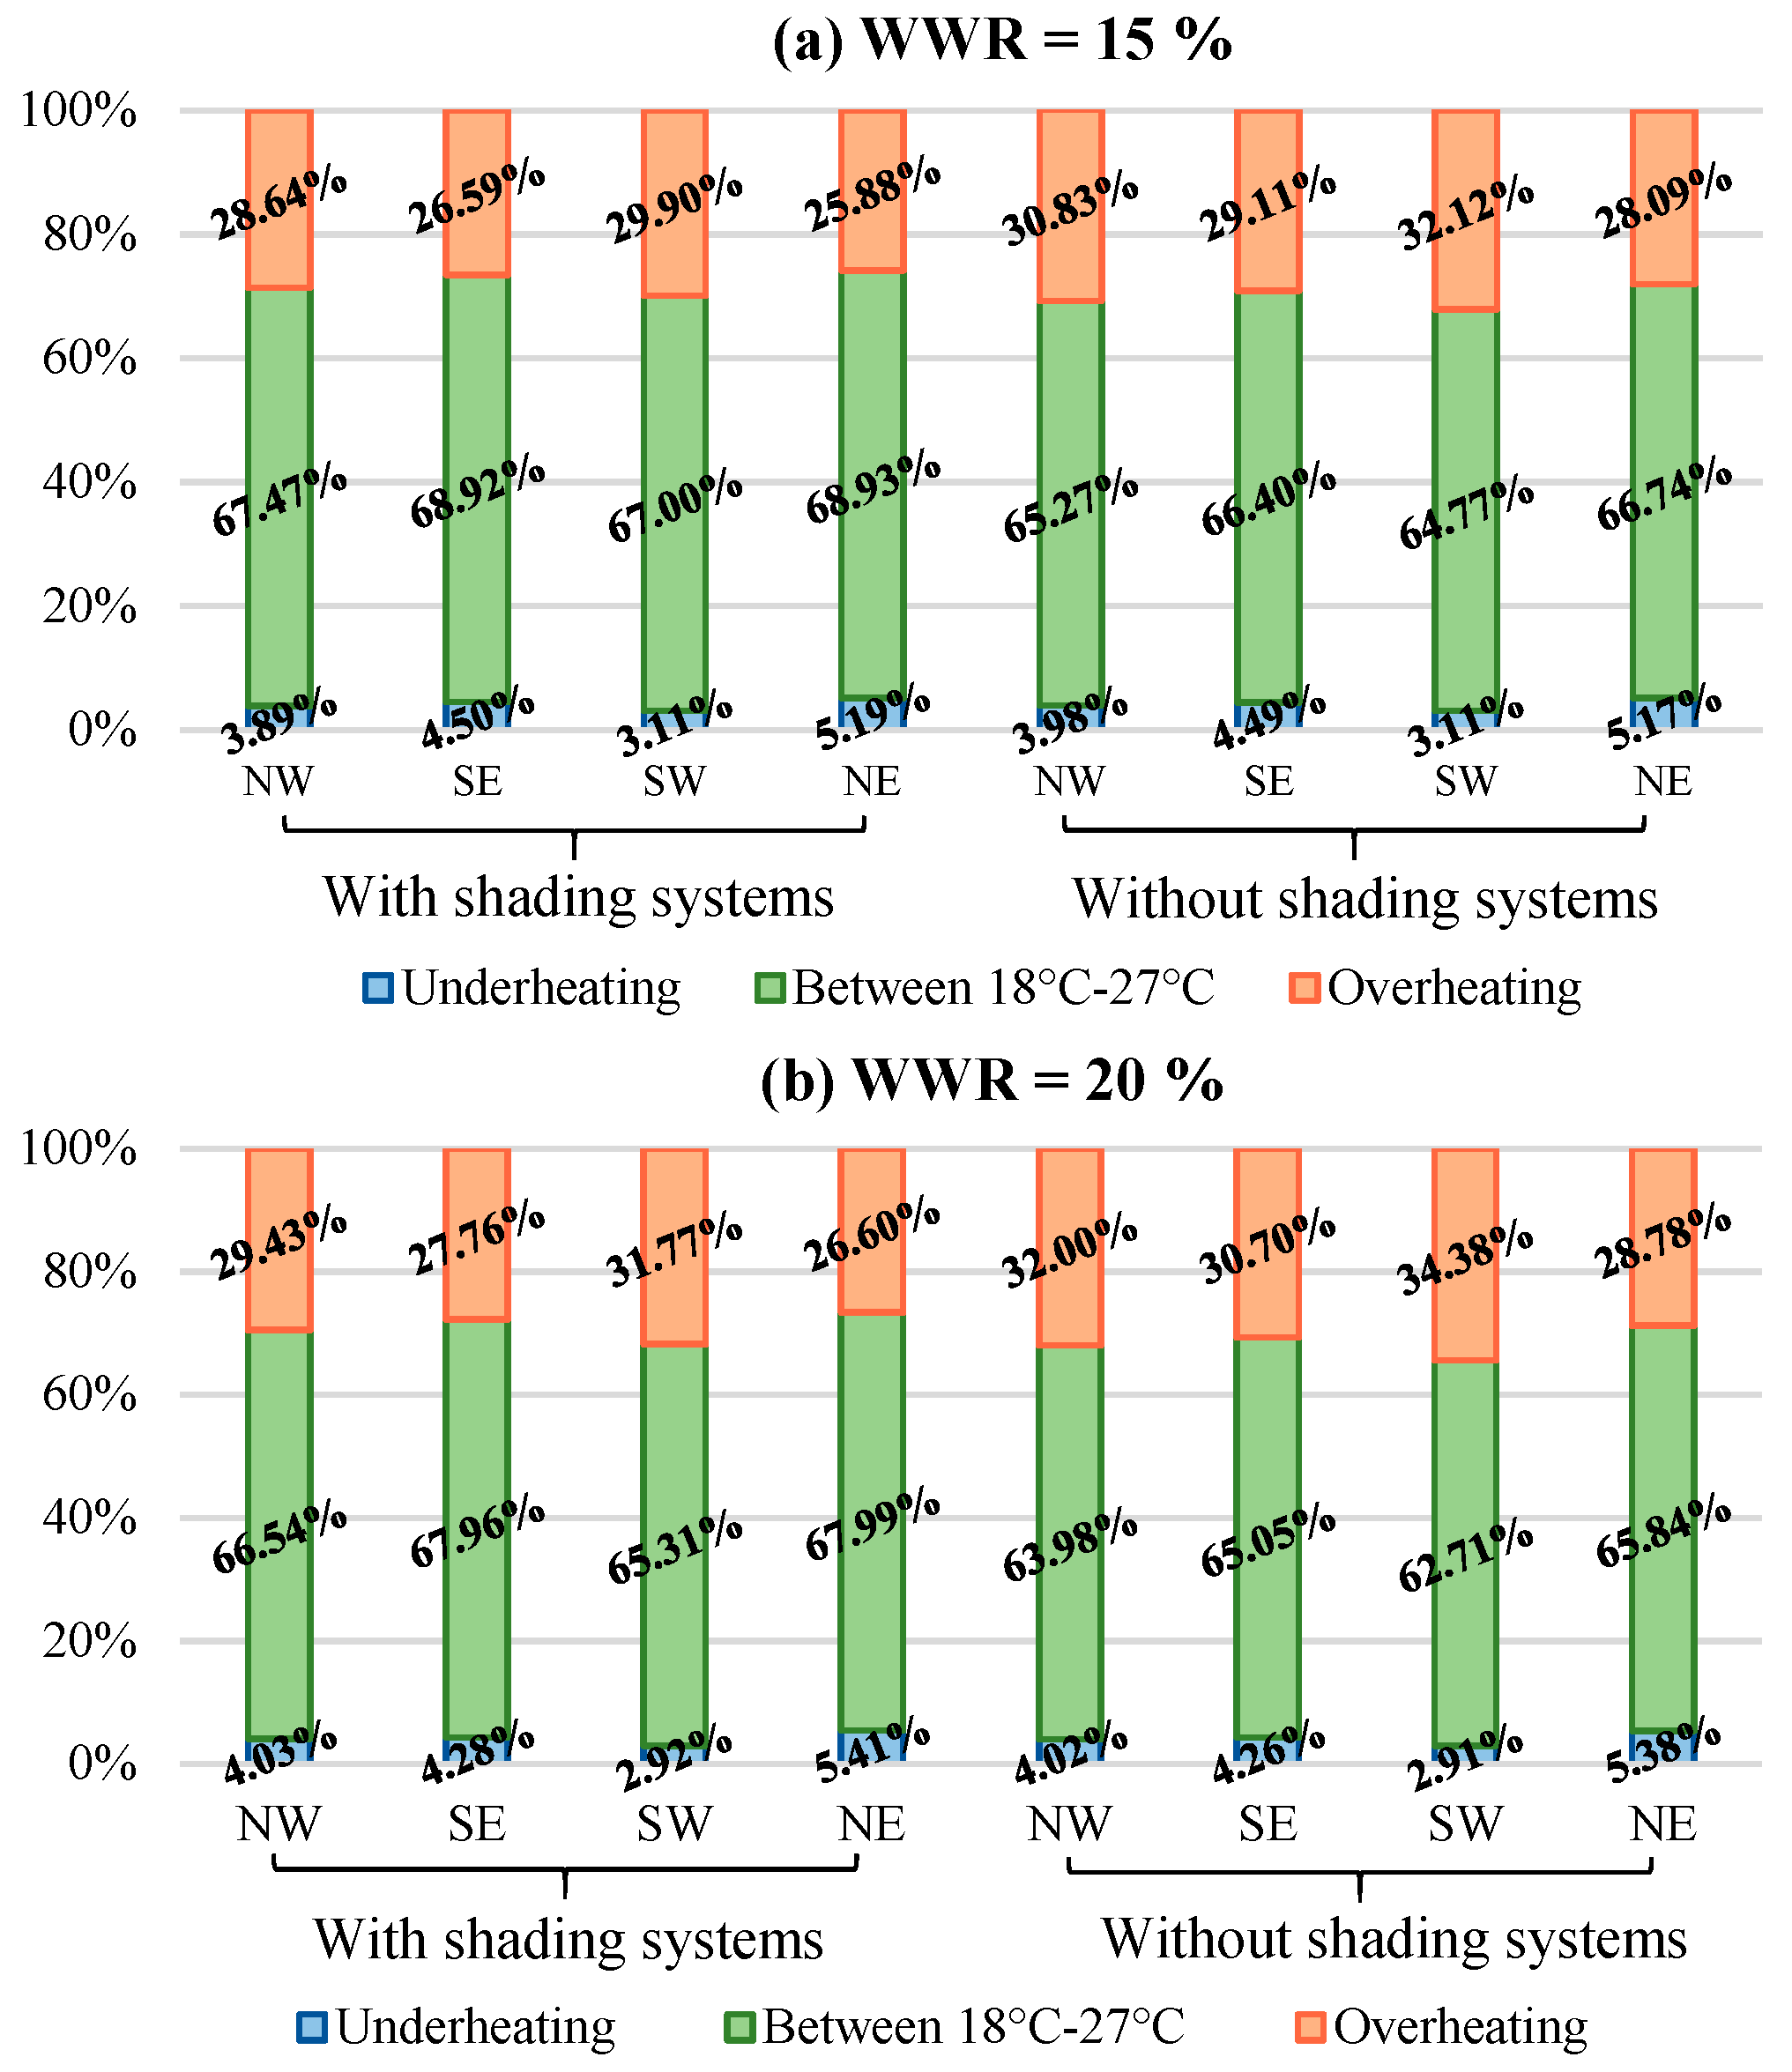
4.9. Evaluation of Different Window-to-Wall Ratios According to Orientation
5. Conclusions
- If the glazing areas are not significant (WWR lower than 10%), the intervention may not be justified since the incidence of glazing areas on thermal comfort and energy requirement is not meaningful, but not so, the costs involved in the interventions.
- With the intervention on the roof, the annual discomfort rates can decrease by 7.4% for the static approach, and the annual energy requirement can decrease by around 37% regarding the original state of the building. The AHP analysis suggests that the best option is the configuration R4, followed by the R3 and finally the R2, even though the costs differences among the alternatives were not significant, the differences in terms of comfort rates and cooling needs influence the results.
- With the intervention on the walls, the higher comfort rates were recorded by the configurations employing exterior claddings. In fact, an increase of almost 7% in the annual comfort rate can be achieved with an exterior reinforcement of exterior walls with 5cm insulation. The AHP analysis suggests that the configurations employing exterior and inner insulation plus a layer of plaster represents the best options since they delivered a good thermal performance at lower costs, besides allowing a greater indoor useful area of the thermal zone under analysis.
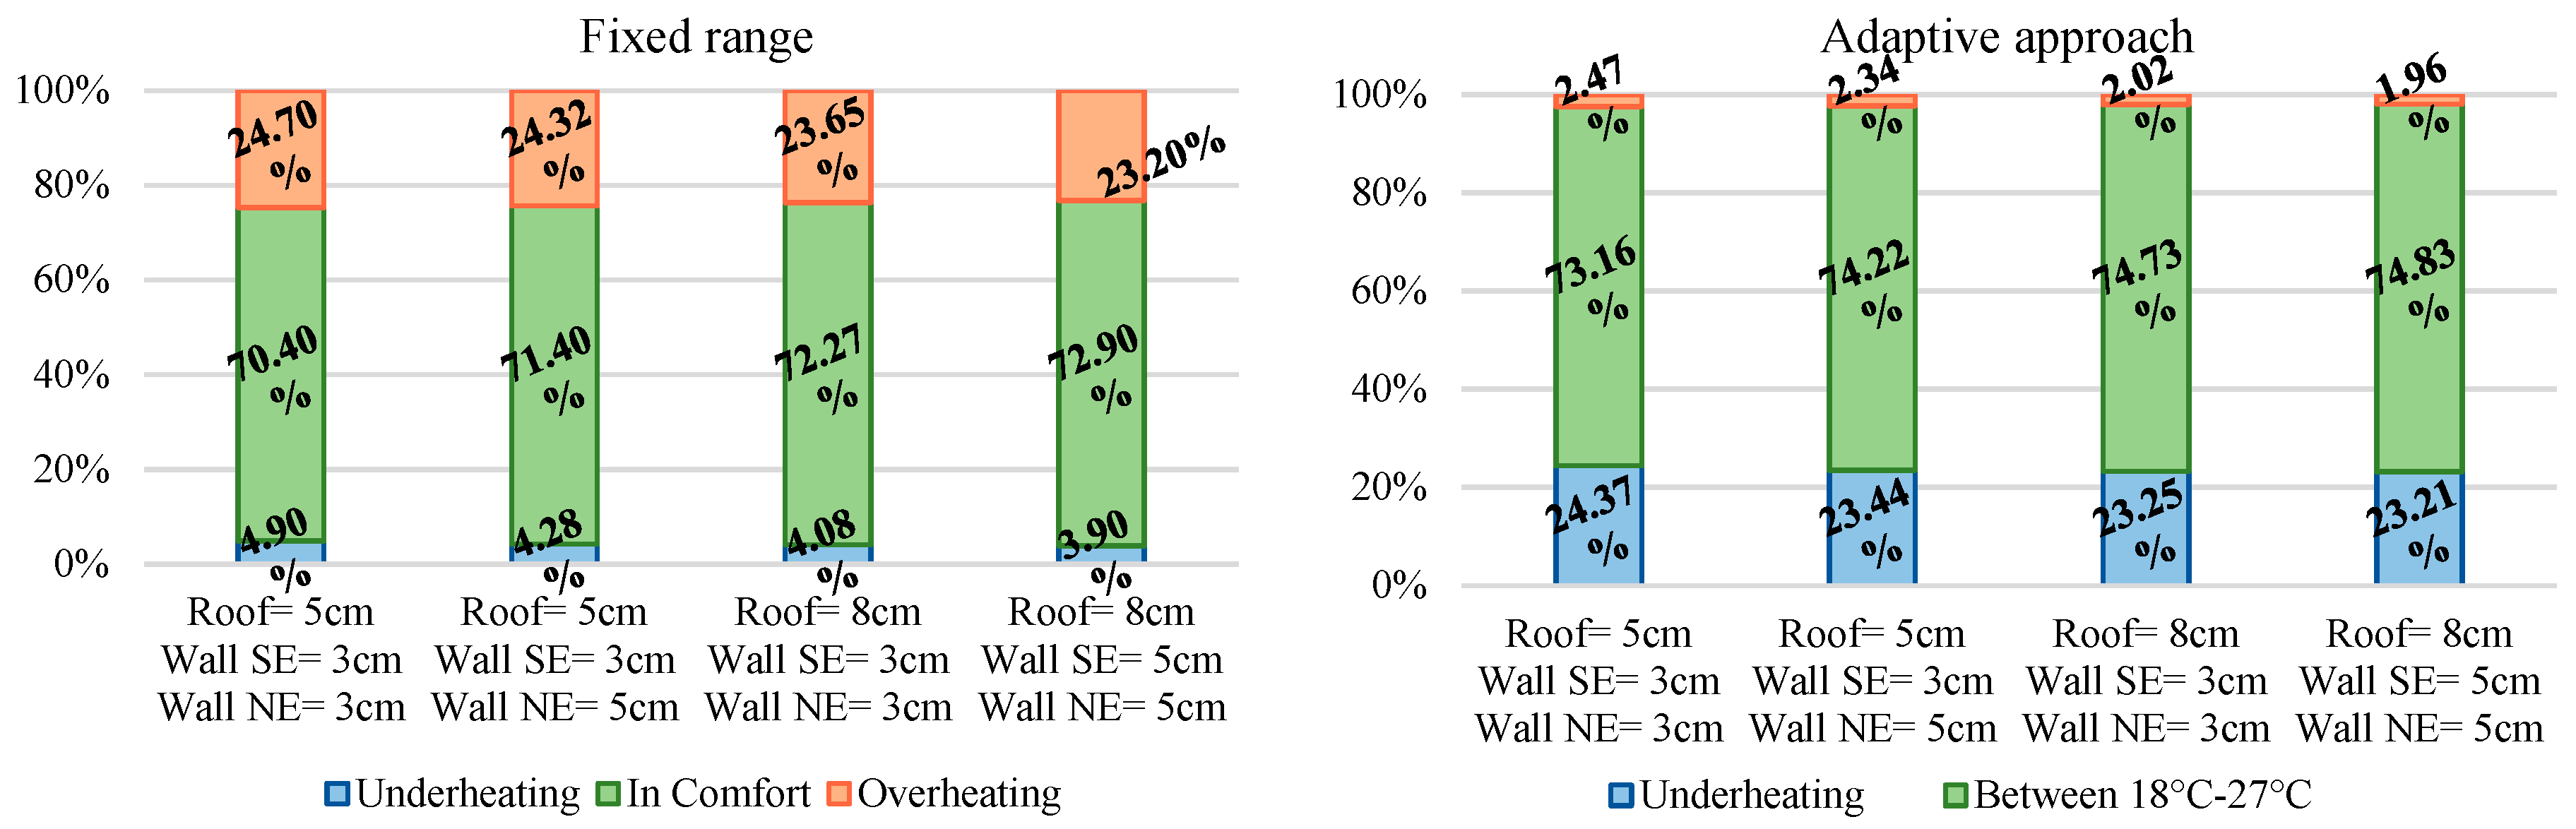
- Regarding the insulation thicknesses, in general, the most recommended insulation thicknesses are 3 cm, 5 cm and 8 cm, for both roofs and walls, employing an insulation material with 0.04 W/m.K of thermal conductivity. This means that for roofs, a thermal transmittance value between 0.79–0.34 W/m2K is recommended. For walls with an SW and NE orientation, those values between 0.86–0.41 W/m2K and for walls with an NW and SE orientation the values between 0.77–0.39 W/m2K (Table 15).
- Concerning window to wall ratios, a WWR up to 15% on the SE or NE orientation, with the use of shading systems, can help to increase natural ventilation rates improving comfort rates. Nonetheless, higher values of WWR can increase the overheating rates significantly, and this increase is accentuated without the use of shading systems, and mainly for glazing areas located on SW orientations.
Author Contributions
Funding
Conflicts of Interest
References
- Nematchoua, M.K.; Raminosoa, C.R.R.; Mamiharijaona, R.; René, T.; Orosa, J.A.; Elvis, W.; Meukam, P. Study of the Economical and Optimum Thermal Insulation Thickness for Buildings in a Wet and Hot Tropical Climate: Case of Cameroon. Renew. Sustain. Energy Rev. 2015, 50, 1192–1202. [Google Scholar] [CrossRef]
- Kolaitis, D.I.; Malliotakis, E.; Kontogeorgos, D.A.; Mandilaras, I.; Katsourinis, D.I.; Founti, M.A. Comparative Assessment of Internal and External Thermal Insulation Systems for Energy Efficient Retrofitting of Residential Buildings. Energy Build. 2013, 64, 123–131. [Google Scholar] [CrossRef]
- Noailly, J. Improving the Energy Efficiency of Buildings: The Impact of Environmental Policy on Technological Innovation. Energy Econ. 2012, 34, 795–806. [Google Scholar] [CrossRef]
- Verbeke, S.; Audenaert, A. Thermal Inertia in Buildings: A Review of Impacts across Climate and Building Use. Renew. Sustain. Energy Rev. 2017, 82, 2300–2318. [Google Scholar] [CrossRef]
- Kumar, A.; Sah, B.; Singh, A.R.; Deng, Y.; He, X.; Kumar, P.; Bansal, R.C. A Review of Multi Criteria Decision Making (MCDM) towards Sustainable Renewable Energy Development. Renew. Sustain. Energy Rev. 2017, 69, 596–609. [Google Scholar] [CrossRef]
- Wang, J.J.; Jing, Y.Y.; Zhang, C.F.; Zhao, J.H. Review on Multi-Criteria Decision Analysis Aid in Sustainable Energy Decision-Making. Renew. Sustain. Energy Rev. 2009, 13, 2263–2278. [Google Scholar] [CrossRef]
- Saaty, T. How to Make a Decision: The Analytic Hierarchy Process. Eur. J. Oper. Res. 1990, 48, 9–26. [Google Scholar] [CrossRef]
- Kablan, M.M. Decision Support for Energy Conservation Promotion: An Analytic Hierarchy Process Approach. Energy Policy 2004, 32, 1151–1158. [Google Scholar] [CrossRef]
- Mu, E.; Pereyra-Rojas, M. Understanding the Analytic Hierarchy Process. In Practical Decision Making; SpringerBriefs in Operations Research; Springer: Berlin, Germany, 2017. [Google Scholar]
- Khalil, N.; Kamaruzzaman, S.N.; Baharum, M.R. Ranking the Indicators of Building Performance and the Users’ Risk via Analytical Hierarchy Process (AHP): Case of Malaysia. Ecol. Indic. 2016, 71, 567–576. [Google Scholar] [CrossRef]
- Kamaruzzaman, S.N.; Lou, E.C.W.; Wong, P.F.; Wood, R.; Che-Ani, A.I. Developing Weighting System for Refurbishment Building Assessment Scheme in Malaysia through Analytic Hierarchy Process (AHP) Approach. Energy Policy 2018, 112, 280–290. [Google Scholar] [CrossRef]
- Kuzman, M.K.; Grošelj, P.; Ayrilmis, N.; Zbašnik-Senegačnik, M. Comparison of Passive House Construction Types Using Analytic Hierarchy Process. Energy Build. 2013, 64, 258–263. [Google Scholar] [CrossRef]
- Kljajić, M.; Andelković, A.S.; Mujan, I. Assessment of Relevance of Different Effects in Energy Infrastructure Revitalization in Non-Residential Buildings. Energy Build. 2016, 116, 684–693. [Google Scholar] [CrossRef]
- Liu, K.S.; Hsueh, S.L.; Wu, W.C.; Chen, Y.L. A DFuzzy-DAHP Decision-Making Model for Evaluating Energy-Saving Design Strategies for Residential Buildings. Energies 2012, 5, 4462–4480. [Google Scholar] [CrossRef] [Green Version]
- Lee, S.K.; Yoon, Y.J.; Kim, J.W. A Study on Making a Long-Term Improvement in the National Energy Efficiency and GHG Control Plans by the AHP Approach. Energy Policy 2007, 35, 2862–2868. [Google Scholar] [CrossRef]
- Yang, Y.; Li, B.; Yao, R. A Method of Identifying and Weighting Indicators of Energy Efficiency Assessment in Chinese Residential Buildings. Energy Policy 2010, 38, 7687–7697. [Google Scholar] [CrossRef]
- Garbuzova-Schlifter, M.; Madlener, R. AHP-Based Risk Analysis of Energy Performance Contracting Projects in Russia. Energy Policy 2016, 97, 559–581. [Google Scholar] [CrossRef]
- Mirjat, N.H.; Uqaili, M.A.; Harijan, K.; Mustafa, M.W.; Rahman, M.M.; Khan, M.W.A. Multi-Criteria Analysis of Electricity Generation Scenarios for Sustainable Energy Planning in Pakistan. Energies 2018, 11, 1–33. [Google Scholar] [CrossRef]
- Saaty, R.W. The Analytic Hierarchy Process-What It Is and How It Is Used. Math. Model. 1987, 9, 161–176. [Google Scholar] [CrossRef]
- Saaty, T.L. Relative Measurement and Its Generalization in Decision Making Why Pairwise Comparisons Are Central in Mathematics for the Measurement of Intangible Factors the Analytic Hierarchy/Network Process. Rev. Real Acad. Cienc. Exactas, Físicas Nat. Ser. A Mat. 2008, 102, 251–318. [Google Scholar] [CrossRef]
- DesignBuilder Software Ltd. DesignBuilder EnergyPlus Simulation Documentation for DesignBuilder V5; DesignBuilder Software Ltd.: Stroud, UK, 2015. [Google Scholar]
- European Committee for Standardization (CEN). EN 15251: Indoor Environmental Input Parameters for the Design and Assessment of Energy Performance of Buildings; STD Version 2.1c; European Comission: Brussels, Belgium, 2014; pp. 1–81. [Google Scholar]
- Carlucci, S.; Bai, L.; de Dear, R.; Yang, L. Review of Adaptive Thermal Comfort Models in Built Environmental Regulatory Documents. Build. Environ. 2018, 137, 73–89. [Google Scholar] [CrossRef]
- Alves, C.A.; Duarte, D.H.S.; Gonçalves, F.L.T. Residential Buildings’ Thermal Performance and Comfort for the Elderly under Climate Changes Context in the City of São Paulo, Brazil. Energy Build. 2016, 114, 62–71. [Google Scholar] [CrossRef]
- Figueiredo, A.; Figueira, J.; Vicente, R.; Maio, R. Thermal Comfort and Energy Performance: Sensitivity Analysis to Apply the Passive House Concept to the Portuguese Climate. Build. Environ. 2016, 103, 276–288. [Google Scholar] [CrossRef]
- Roetzel, A.; Tsangrassoulis, A. Impact of Climate Change on Comfort and Energy Performance in Offices. Build. Environ. 2012, 57, 349–361. [Google Scholar] [CrossRef]
- Figueiredo, A.; Vicente, R.; Lapa, J.; Cardoso, C.; Rodrigues, F.; Kämpf, J. Indoor Thermal Comfort Assessment Using Different Constructive Solutions Incorporating PCM. Appl. Energy 2017, 208, 1208–1221. [Google Scholar] [CrossRef]
- Roetzel, A.; Tsangrassoulis, A.; Dietrich, U. Impact of Building Design and Occupancy on Office Comfort and Energy Performance in Different Climates. Build. Environ. 2014, 71, 165–175. [Google Scholar] [CrossRef]
- Rubio-Bellido, C.; Pérez-Fargallo, A.; Pulido-Arcas, J.A.; Trebilcock, M. Application of Adaptive Comfort Behaviors in Chilean Social Housing Standards under the Influence of Climate Change. Build. Simul. 2017, 10, 933–947. [Google Scholar]
- Ministerio da Economia e do Emprego. Decreto Lei N° 118/2013 de 20 de Agosto—Regulamento de Desempenho Energetico Dos Edifícios de Habitaçao (REH); Diario de la Republica, N°159 1ra Serie.: Lisboa, Portugal, 2013; pp. 4988–5005.
- Ministerio de Vivienda y Urbanismo del Gobierno de Chile. Estándares de Construcción Sustentable Para Viviendas de Chile, Tomo I: Salud y Bienestar, 2nd ed.; División Técnica de Estudio y Fomento Habitacional, Ed.; Ministerio de Vivienda y Urbanismo: Santiago, Chile, 2018.
- Brazilian Association of Technical Standards (ABNT). NBR 16401:2008 Instalações de Ar-Condicionado—Sistemas Centrais e Unitários—Parte 2: ParâMetros de Conforto Térmico; Associação Brasileira de Normas Técnicas: Rio de Janeiro, Brazil, 2008. [Google Scholar]
- Chartered Institution of Building Services Engineers (CIBSE). Environmental Design, 7th ed.; CIBSE: London, UK, 2006. [Google Scholar] [CrossRef]
- Lu, S.; Pang, B.; Qi, Y.; Fang, K. Field Study of Thermal Comfort in Non-Air-Conditioned Buildings in a Tropical Island Climate. Appl. Ergon. 2018, 66, 89–97. [Google Scholar] [CrossRef]
- Djamila, H. Indoor Thermal Comfort Predictions: Selected Issues and Trends. Renew. Sustain. Energy Rev. 2017, 74, 569–580. [Google Scholar] [CrossRef]
- López, V.; Lucchese, J.R.; Andreasi, W.A. Thermal Comfort Assessment in the Hot and Humid Region of Paraguay: A Comparison Between Three Methodologies. Int. J. Civ. Environ. Eng. 2015, 15, 26–31. [Google Scholar]
- Wankanapon, P.; Mistrick, R.G. Roller Shades and Automatic Lighting Control with Solar Radiation Control Strategies. Built 2011, 1, 35–42. [Google Scholar]
- Alwetaishi, M. Impact of Glazing to Wall Ratio in Various Climatic Regions: A Case Study. J. King Saud Univ. Eng. Sci. 2018, 1–13. [Google Scholar] [CrossRef]
- Melgar, S.G.; Bohórquez, M.Á.M.; Márquez, J.M.A. UhuMEB: Design, Construction, and Management Methodology of Minimum Energy Buildings in Subtropical Climates. Energies 2018, 11, 2745. [Google Scholar] [CrossRef]
- Asdrubali, F.; Buratti, C.; Cotana, F.; Baldinelli, G.; Goretti, M.; Moretti, E.; Baldassarri, C.; Belloni, E.; Bianchi, F.; Rotili, A.; et al. Evaluation of Green Buildings’ Overall Performance through in Situ Monitoring and Simulations. Energies 2013, 6, 6525–6547. [Google Scholar] [CrossRef] [Green Version]
- Auzeby, M.; Wei, S.; Underwood, C.; Tindall, J.; Chen, C.; Ling, H.; Buswell, R. Effectiveness of Using Phase Change Materials on Reducing Summer Overheating Issues in UK Residential Buildings with Identification of Influential Factors. Energies 2016, 9, 605. [Google Scholar] [CrossRef]
- Rospi, G.; Cardinale, N.; Negro, E. Energy Performance and Economic Feasibility Study of Historical Building in the City of Matera, Southern Italy. Energies 2017, 10, 2009. [Google Scholar] [CrossRef]
- Rey-Hernández, J.M.; Velasco-Gómez, E.; San José-Alonso, J.F.; Tejero-González, A.; Rey-Martínez, F.J. Energy Analysis at a near Zero Energy Building. A Case-Study in Spain. Energies 2018, 11, 857. [Google Scholar] [CrossRef]
- Lin, Y.; Zhou, S.; Yang, W.; Shi, L.; Li, C.Q. Development of Building Thermal Load and Discomfort Degree Hour Prediction Models Using Data Mining Approaches. Energies 2018, 11, 1570. [Google Scholar] [CrossRef]
- Bhandari, M.; Hun, D.; Shrestha, S.; Pallin, S.; Lapsa, M. A Simplified Methodology to Estimate Energy Savings in Commercial Buildings from Improvements in Airtightness. Energies 2018, 11, 3322. [Google Scholar] [CrossRef]
- Yu, S.; Cui, Y.; Shao, Y.; Han, F. Research on the Comprehensive Performance of Hygroscopic Materials in an Office Building Based on EnergyPlus. Energies 2019, 12, 191. [Google Scholar] [CrossRef]


| Intensity of Importance on an Absolute Scale | Definition |
|---|---|
| 1 | The two criteria/alternatives are equally important and contribute equally to the objective |
| 3 | Moderate importance of one criterion/alternative over another |
| 5 | Essential or strong importance of one criterion/alternative over another |
| 7 | Very strong importance of one criterion/alternative over another |
| 9 | Extreme importance of one criterion/alternative over another |
| 2, 4, 6, 8 | Intermediate values (when compromise is needed) |
| Thermal Zone | Occupation | Fresh Air | Illuminance | Internal Gains | Schedule |
|---|---|---|---|---|---|
| Lounge | 53.32 | 4 | 200 | 3.90 |  |
| Circulations | 64.50 | 4 | 100 | 1.57 |  |
| Kitchen & Dining | 59.12 | 14 | 300 | 30.28 |  |
| Bedroom | 43.59 | 4 | 100 | 3.58 |  |
| Bathroom | 53.37 | 10 | 150 | 1.67 | 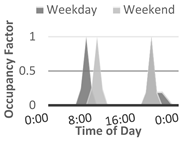 |
| Building Component | Material (Outer to Inner) | s (m) | λ (W/m K) | e (-) | ST (-) | U (W/m2K) |
|---|---|---|---|---|---|---|
G—Glazing | G1 - (a) Single Clear glazing G2 - (a) Reflectance glazing G3 - (a) Low-e glazing G6 - (a) Reflectance glazing | 0.006 0.006 0.006 0.010 | 0.90 0.90 0.90 0.90 | 0.84 0.84 0.20 0.84 | 0.77 0.48 0.68 0.33 | 5.78 5.78 3.78 5.63 |
G4—Double Glazing | (a) Single clear glazing (b) Air gap (c) Single clear glazing | 0.006 0.010 0.006 | 0.90 = 0.15 0.90 | 0.84 0.84 | 0.77 0.77 | 2.76 |
G5—Double Glazing | (a) Reflectance glazing (b) Air gap (c) Reflectance glazing | 0.006 0.010 0.006 | 0.90 = 0.15 0.90 | 0.84 0.84 | 0.48 0.48 | 2.76 |
| Building Component | Material (Outer to Inner) | s (m) | λ (W/m K) | U (W/m2K) | (Kg/m2) |
|---|---|---|---|---|---|
| ROOF | |||||
R1 - Without insulation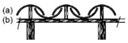 | (a) High density wood (b) Ceramic Clay Tile | 0.025 0.010 | 0.29 0.84 | 4.20 | 40 |
R2 - Pitched Roof Tile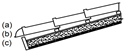 | (a) Ceramic clay tile (b) Glass wool felt (c) High density wood | 0.010 0.050 0.025 | 0.84 0.04 0.29 | 0.67 | 49 |
R3 - Pitched Roof Tile | (a) Ceramic clay tile (b) High density wood (c) Glass wool felt (d) Air gap (e) Plasterboard | 0.010 0.025 0.050 1.000 0.030 | 0.84 0.29 0.04 0.25 | 0.57 | 1276 |
R4 - Pitched Roof Tile | (a) Ceramic clay tile (b) High density wood (c) Air gap (d) Glass wool felt (e) Plasterboard | 0.010 0.025 1.000 0.050 0.030 | 0.84 0.29 0.04 0.25 | 0.57 | 1276 |
| WALLS | |||||
| W1: Without insulation (original state) | |||||
| W1a- SW orientation 20 cm Wall  | (a) Sand lime plaster (b) Solid Brick Burned (c) Sand-lime plaster | 0.015 0.170 0.015 | 1.15 0.85 1.15 | 2.53 | 309 |
| W1b - NW orientation 30 cm Wall 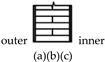 | (a) Sand lime plaster (b) Solid Brick Burned (c) Sand lime plaster | 0.015 0.270 0.015 | 1.15 0.85 1.15 | 1.95 | 459 |
| External (W2) and internal (W3) cladding with insulation | |||||
| W2a - SW orientation 26 cm Wall  | (a) Sand cement plaster (b) Glass wool felt (c) Sand-lime plaster (d) Solid brick burned (e) Sand-lime plaster | 0.010 0.050 0.015 0.170 0.015 | 0.42 0.04 1.15 0.85 1.15 | 0.60 | 348 |
| W2b - NW orientation 36 cm Wall  | (a) Sand cement plaster (b) Glass wool felt (c) Sand lime plaster (d) Solid brick burned (e) Sand lime plaster | 0.010 0.050 0.015 0.270 0.015 | 0.42 0.04 1.15 0.85 1.15 | 0.56 | 498 |
| Inner (W4) and exterior (W6) cladding with hollow brick leaving an air gap | |||||
| W4a - SW orientation 31.5 cm Wall 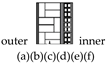 | (a) Sand lime plaster (b) Solid brick burned (c) Sand lime plaster (d) Air gap (e) Hollow brick (f) Sand cement plaster | 0.015 0.170 0.015 0.025 0.050 0.010 | 1.15 0.85 1.15 = 0.19 = 0.35 0.42 | 1.04 | 505 |
| W4b - NW orientation 41.5 cm Wall 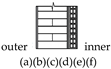 | (a) Sand lime plaster (b) Solid brick burned (c) Sand lime plaster (d) Air gap (e) Hollow brick (f) Sand cement plaster | 0.015 0.270 0.015 0.025 0.050 0.010 | 1.15 0.85 1.15 = 0.19 = 0.35 0.42 | 0.93 | 655 |
| Inner (W5) and exterior (W7) cladding with insulation and hollow brick | |||||
| W5a - SW orientation 34 cm Wall 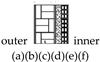 | (a) Sand lime plaster (b) Solid brick burned (c) Sand lime plaster (d) Glass wool felt (e) Hollow brick (f) Sand cement plaster | 0.015 0.170 0.015 0.050 0.080 0.010 | 1.15 0.85 1.15 0.04 = 0.35 0.42 | 0.49 | 484 |
| W5b - NW orientation 44 cm Wall  | (a) Sand lime plaster (b) Solid brick burned (c) Sand lime plaster (d) Glass wool felt (e) Hollow brick (f) Sand cement plaster | 0.015 0.270 0.015 0.050 0.080 0.010 | 1.15 0.85 1.15 0.04 = 0.35 0.42 | 0.47 | 634 |
| Inner (W8) and exterior (W9) cladding with insulation and solid brick | |||||
| W8a - SW orientation 31 cm Wall  | (a) Sand lime plaster (b) Solid brick burned (c) Sand lime plaster (d) Glass wool felt (e) Solid brick burned (f) Sand cement plaster | 0.015 0.170 0.015 0.080 0.050 0.015 | 1.15 0.85 1.15 0.04 0.85 0.35 | 0.58 | 433 |
| W8b- NW orientation 41 cm Wall  | (a) Sand lime plaster (b) Solid brick burned (c) Sand lime plaster (d) Glass wool felt (e) Solid brick burned (f) Sand cement plaster | 0.015 0.270 0.015 0.080 0.050 0.015 | 1.15 0.85 1.15 0.04 0.85 0.35 | 0.54 | 583 |
| Glazing | Roofs | Walls | |||
|---|---|---|---|---|---|
| Alternative | Costs | Alternative | Costs | Alternative | Costs |
| G1 | 1.00 | R1 | 1.00 | W1 | 1.00 |
| G2 | 1.98 | R2 | 0.32 | W2 | 0.31 |
| G3 | 1.20 | R3 | 0.38 | W3 | 0.31 |
| G4 | 2.00 | R4 | 0.38 | W4 | 0.54 |
| G5 | 3.42 | W5 | 0.64 | ||
| G6 | 2.67 | W6 | 0.54 | ||
| W7 | 0.64 | ||||
| W8 | 0.61 | ||||
| W9 | 0.61 |
| Roofs – Consistency Rate: 0.025 | ||||
|---|---|---|---|---|
| Criteria | Costs | Comfort Rate | Cooling Needs | Priority |
| Costs | 1 | 1/5 | 1/3 | 0.11 |
| Comfort rate | 5 | 1 | 1 | 0.48 |
| Cooling needs | 3 | 1 | 1 | 0.41 |
| Walls – Consistency Rate: 0.027 | |||||
|---|---|---|---|---|---|
| Criteria | Costs | Comfort Rate | Cooling Needs | Wall Thickness | Priority |
| Costs | 1 | 1/5 | 1/2 | 2 | 0.14 |
| Comfort rate | 5 | 1 | 2 | 4 | 0.51 |
| Cooling needs | 2 | 1/2 | 1 | 3 | 0.26 |
| Wall thickness | 1/2 | 1/4 | 1/3 | 1 | 0.09 |
| Glazing – Consistency Rate: 0.016 | ||||
|---|---|---|---|---|
| Criteria | Costs | Comfort Rate | Cooling Needs | Priority |
| Costs | 1 | 3 | 2 | 0.55 |
| Comfort rate | 1/3 | 1 | 1 | 0.21 |
| Cooling needs | 1/2 | 1 | 1 | 0.24 |
| Glazing | Roofs | Walls | ||||||
|---|---|---|---|---|---|---|---|---|
| Alternative | Weight | Rank | Alternative | Weight | Rank | Alternative | Weight | Rank |
| G1 | 0.246 | 1 | R2 | 0.141 | 3 | W2 | 0.200 | 1 |
| G2 | 0.135 | 4 | R3 | 0.258 | 2 | W3 | 0.185 | 2 |
| G3 | 0.210 | 2 | R4 | 0.601 | 1 | W4 | 0.068 | 6 |
| G4 | 0.121 | 5 | W5 | 0.124 | 5 | |||
| G5 | 0.186 | 3 | W6 | 0.067 | 7 | |||
| G6 | 0.101 | 6 | W7 | 0.162 | 3 | |||
| W8 | 0.055 | 8 | ||||||
| W9 | 0.139 | 4 |
| Description | U (W/m2K) |
|---|---|
| R1 - Original state | 4.20 |
| R4 - Without insulation | 1.97 |
| R4 - Insulation 1 cm- thick | 1.32 |
| R4 - Insulation 3 cm- thick | 0.79 |
| R4 - Insulation 5 cm- thick | 0.57 |
| R4 - Insulation 8 cm- thick | 0.34 |
| R4 - Insulation 10 cm- thick | 0.33 |
| R4 - Insulation 12 cm- thick | 0.28 |
| R4 - Insulation 15 cm- thick | 0.23 |
| Description | U (W/m2K) |
|---|---|
| W1a – 15 cm-thick | 2.97 |
| W1a - Original state | 2.53 |
| W1a - 30 cm-thick | 1.95 |
| W2a - Insulation 1 cm-thick | 1.49 |
| W2a - Insulation 3 cm-thick | 0.86 |
| W2a - Insulation 5 cm-thick | 0.60 |
| W2a - Insulation 8 cm-thick | 0.41 |
| W2a - Insulation 10 cm-thick | 0.34 |
| Description | U (W/m2K) |
|---|---|
| W1b - 15 cm-thick | 2.97 |
| W1b - 20 cm-thick | 2.53 |
| W1b - Original state | 1.95 |
| W2b - Insulation 1 cm-thick | 1.27 |
| W2b - Insulation 3 cm-thick | 0.77 |
| W2b - Insulation 5 cm-thick | 0.56 |
| W2b - Insulation 8 cm-thick | 0.39 |
| W2b - Insulation 10 cm-thick | 0.33 |
| Roof | Wall SW Orientation | Wall NW Orientation | |||
|---|---|---|---|---|---|
| Alternative | Costs | Alternative | Costs | Alternative | Costs |
| R1 - Original | 1.00 | W1a-15 cm | 0.72 | W1b-15 cm | 0.58 |
| R4-0 cm | 1.34 | W1a-20 cm | 1.00 | W1b-20 cm | 0.80 |
| R4-1 cm | 1.36 | W1a-30 cm | 1.25 | W1b-30 cm | 1.00 |
| R4-3 cm | 1.37 | W2a-1 cm | 1.07 | W2b-1 cm | 1.05 |
| R4-5 cm | 1.38 | W2a-3 cm | 1.09 | W2b-3 cm | 1.07 |
| R4-8 cm | 1.40 | W2a-5 cm | 1.13 | W2b-5 cm | 1.10 |
| R4-10 cm | 1.41 | W2a-8 cm | 1.18 | W2b-8 cm | 1.15 |
| R4-12 cm | 1.44 | W2a-10 cm | 1.21 | W2b-10 cm | 1.17 |
| R4-15 cm | 1.46 | ||||
| Roof | Wall SW Orientation | Wall NW Orientation | ||||||
|---|---|---|---|---|---|---|---|---|
| Alternative | Weight | Rank | Alternative | Weight | Rank | Alternative | Weight | Rank |
| R1 - Original | 0.076 | 9 | W1a-15 cm | 0.110 | 6 | W1b-15 cm | 0.143 | 5 |
| R4-0 cm | 0.080 | 8 | W1a-20 cm | 0.079 | 7 | W1b-20 cm | 0.091 | 7 |
| R4-1 cm | 0.114 | 7 | W1a-30 cm | 0.075 | 8 | W1b-30 cm | 0.066 | 8 |
| R4-3 cm | 0.122 | 3 | W2a-1 cm | 0.124 | 5 | W2b-1 cm | 0.092 | 6 |
| R4-5 cm | 0.125 | 2 | W2a-3 cm | 0.154 | 2 | W2b-3 cm | 0.157 | 2 |
| R4-8 cm | 0.133 | 1 | W2a-5 cm | 0.162 | 1 | W2b-5 cm | 0.159 | 1 |
| R4-10 cm | 0.118 | 4 | W2a-8 cm | 0.149 | 3 | W2b-8 cm | 0.147 | 3 |
| R4-12 cm | 0.117 | 5 | W2a-10 cm | 0.148 | 4 | W2b-10 cm | 0.145 | 4 |
| R4-15 cm | 0.116 | 6 | ||||||
| Building Component | Recommended Values of Thermal Transmittance U (W/m2K) |
|---|---|
| Roofs | 0.79–0.34 |
| Walls SW and NE | 0.86–0.41 |
| Walls NW and SE | 0.77–0.39 |
© 2019 by the authors. Licensee MDPI, Basel, Switzerland. This article is an open access article distributed under the terms and conditions of the Creative Commons Attribution (CC BY) license (http://creativecommons.org/licenses/by/4.0/).
Share and Cite
Silvero, F.; Rodrigues, F.; Montelpare, S. A Parametric Study and Performance Evaluation of Energy Retrofit Solutions for Buildings Located in the Hot-Humid Climate of Paraguay—Sensitivity Analysis. Energies 2019, 12, 427. https://doi.org/10.3390/en12030427
Silvero F, Rodrigues F, Montelpare S. A Parametric Study and Performance Evaluation of Energy Retrofit Solutions for Buildings Located in the Hot-Humid Climate of Paraguay—Sensitivity Analysis. Energies. 2019; 12(3):427. https://doi.org/10.3390/en12030427
Chicago/Turabian StyleSilvero, Fabiana, Fernanda Rodrigues, and Sergio Montelpare. 2019. "A Parametric Study and Performance Evaluation of Energy Retrofit Solutions for Buildings Located in the Hot-Humid Climate of Paraguay—Sensitivity Analysis" Energies 12, no. 3: 427. https://doi.org/10.3390/en12030427