System Analysis of Biogas Production—Part II Application in Food Industry Systems


1
Department of Management and Engineering, Division of Energy Systems, Linköping University, SE-581 83 Linköping, Sweden
2
Biogas Research Center, Linköping University, SE-581 83 Linköping, Sweden
3
Region Östergötland, SE-582 24 Linköping, Sweden
*
Author to whom correspondence should be addressed.
Energies 2019, 12(3), 412; https://doi.org/10.3390/en12030412
Submission received: 28 December 2018
/
Revised: 25 January 2019
/
Accepted: 26 January 2019
/
Published: 28 January 2019
(This article belongs to the Special Issue Production and Utilization of Biogas)
Abstract
:Biogas production from organic by-products is a way to recover energy and nutrients. However, biogas production is not the only possible conversion alternative for these by-products, and hence there is interest in studying how organic by-products are treated today and which alternatives for conversion are the most resource efficient from a systems perspective. This paper investigates if biogas production is a resource efficient alternative, compared to business as usual, to treat food industry by-products, and if so, under what circumstances. Five different cases of food industries were studied, all with different prerequisites. For all cases, three different scenarios were analysed. The first scenario is the business as usual (Scenario BAU), where the by-products currently are either incinerated, used as animal feed or compost. The second and third scenarios are potential biogas scenarios where biogas is either used as vehicle fuel (Scenario Vehicle) or to produce heat and power (Scenario CHP). All scenarios, and consequently, all cases have been analysed from three different perspectives: Economy, energy, and environment. The environmental perspective was divided into Global Warming Potential (GWP), Acidification Potential (AP), and Eutrophication Potential (EP). The results show, in almost all the systems, that it would be more resource efficient to change the treatment method from Scenario BAU to one of the biogas scenarios. This paper concludes that both the perspective in focus and the case at hand are vital for deciding whether biogas production is the best option to treat industrial organic by-products. The results suggest that the food industry should not be the only actor involved in deciding how to treat its by-products.
1. Introduction
In Europe, the food and drink industry is the largest manufacturing industry in terms of turnover, employment, and the value-added [1]. In Sweden, the food and drink industry is the fourth largest industry regarding employment (more than 55,000 employees) and the second largest regarding gross revenue [2]. Every year, large quantities of primary food products from the agricultural sector are refined into high-quality products (about 70% in Sweden) [3]. While the industry is efficient regarding energy and primary resources, it produces organic waste that needs treatment. For example, high protein by-products are used for animal feed [4] and fats are recovered as petroleum replacements [5]. However, organic by-products are still left for treatment as waste.
One process to treat organic by-products is anaerobic digestion to produce biogas, a process that not only provides a fossil fuel substitute, but also recovers nutrients to be used as fertilizers [6]. Anaerobic digestion is not the only possible conversion option for organic by-products, e.g., Dhillon [7] gives examples of (new) products from the food industry including, e.g., functional foods and bioactive ingredients, components of microbial media, animal feed, biodiesel, and biogas. However, given the potential for biogas to contribute to both nutrient recovery and the mix of renewable energy, it is important to understand how industrial organic by-products are treated today and which conversion options are most beneficial from a systems perspective.
Several studies have examined the conditions for using industrial by-products as substrates for biogas and alternative treatments. Using LCA, Berglund and Börjesson [8] calculated energy performance. Tufvesson et al. [9] compared the environmental performance of biogas production from food industry by-products with the production of animal feed, by using different methodologies. Using system analysis, Lantz et al. [10] compared different substrates used for a potential biogas plant. Viklund and Lindkvist [11] made a systems study of potential biogas production at a food company. Pöschl et al. [12] studied residues from the food industry as well as other feedstock material flows, such as agricultural by-products and energy crops, focusing on energy issues related to biogas production. In an analysis of biogas production, Van Dael et al. [13] evaluated techno-economic issues using residues from food, agriculture, and forest industries. Pierie et al. [14] compared biogas production, combined heat and power, and waste management using waste flows in a region in the Netherlands; however, waste flows from the food industry are not included in this inventory.
This paper assesses whether biogas production is a resource efficient alternative for treating food industry by-products compared to other treatment methods and, if so, under what circumstances. This paper uses the research design described by Lindkvist et al. [15].
This study focuses on five food industry cases of in Sweden; these cases have different prerequisites. For all cases, three scenarios were analysed. The first scenario is the business as usual scenario (Scenario BAU) where the by-products currently are either composted, incinerated, or used as animal feed. The second and third scenarios are potential biogas scenarios using biogas either as vehicle fuel (Scenario Vehicle) or to produce heat and power (Scenario CHP). All scenarios, and consequently, all systems, have been analysed from three different perspectives: Economy, energy, and environment. The environmental perspective was divided into Global warming potential (GWP), Acidification potential (AP), and Eutrophication potential (EP). This paper, the second of two papers, focuses on the application of the research design, which is described in detail in the first paper [15].
2. Research Approach
This paper was performed according to the research design described by Lindkvist et al. [15]. The purpose of the research design is to be able to assess the resource efficiency of biogas production from organic by-products, compared to alternative treatment methods. The research design includes the following steps: Identification of cases, defining scenarios, systems development, evaluation perspectives, and systems analysis. Detailed information about the different steps are found in the following sections. For more information about the research design, see Lindkvist et al. [15].
2.1. Identifiation of Cases
Statistical information about the food industry in Sweden was retrieved from Statistic Sweden (SCB) [16]. The statistics were divided according to the SNI code (the Swedish version of NACE Classification Codes) and sorted based on available statistics from SCB, which in this study is the number of employees for relevant industries. The number of employees was assumed to indicate the size of the company’s production and therefore an indication of the potential amount of by-products available for biogas production. All larger food companies in Sweden (companies with more than 49 employees) were identified and mapped together with all biogas plants treating organic by-products. From the map, eight areas with several food companies were identified with a potential for organic by-products that could potentially be used for biogas production. For each of the regional areas, the study was extended by one level from the SNI code (20–49 employees) to produce an accurate picture of the biogas potential in the area. Companies with fewer employees than 20 were considered too small to have a significant impact on the results.
The data collection was carried out by studying literature (papers and statistics), collecting data through interviews, and performing calculations. The data collection was made during the autumn of 2014, and the data behind the results in this study can be found to some extent in Alexandersson et al. [17].
All identified food companies (123 companies) were contacted by telephone and email. The companies were asked about the amounts of organic by-products originating from their processes and the current treatment methods used. When the information was compiled, three areas showed very small quantities of available substrate. Therefore, these were excluded. The theoretical biogas potential was calculated for all identified potential substrates in the five remaining food industry areas with help from the specific methane yield (Table A1 in Appendix A). These five areas form the five cases in this study.
2.2. Defining Scenarios
Three scenarios have been developed to analyse possible treatments of the organic by-products: (1) Scenario Business As Usual (Scenario BAU); (2) Scenario Combined Heat and Power (Scenario CHP); and (3) Scenario Vehicle. Since a natural gas grid is only found in south-western Sweden and not close to the selected systems, injection of biogas to the natural gas grid is not an option in this study. In Scenario BAU, the industrial by-products in the five cases are used as animal feed, for fuel in a CHP plant, or composted to be used as fertilizer. In Scenario CHP, the industrial by-products are transported to a biogas plant where it is digested. The biogas is used to produce heat for a District Heating System (DHS) and electricity for the grid, and the digestate is used as fertilizer. In Scenario Vehicle, industrial by-products are transported to a biogas plant where it is digested. The biogas is upgraded and used for vehicle fuel, and the digestate is used as fertilizer.
Transportation of the organic by-products from the food companies to the treatment facilities has been excluded from the study. As information about the actual transportation distances to the different current and future treatment facilities is missing, assumed distances have to be used. Assuming the same distances for all scenarios, the distance for transportation in all scenarios balance up.
2.3. System Development
Systems development is used to assess the resource efficiency of the different scenarios. For each case, a system is developed that is a simplification of the real case. The system only includes the processes interesting for the scope of the study. A generic overview of the system is shown in Figure 1. The focus of the systems are the treatment methods for the organic by-products. A number of end-products have been identified as results from the treatment methods. The demand for these end-products is assumed to be constant for the system regardless of the scenario. The end-products are animal feed, fertilizer, heat and electricity, digestate, and vehicle fuel. The Scenario BAU sets an assumed total demand for animal feed, as this is the only scenario where animal feed is produced from the organic by-products. For heat and electricity, the Scenario CHP regulates the level of demand for the systems, because the potential production of heat and electricity in the CHP Scenario is greater than the heat and electricity that is produced in the Scenario BAU. Scenario Vehicle regulates the level of demand for vehicle fuel, because no vehicle fuel is produced in any other scenario. The production of digestate is the same for both biogas scenarios and this amount regulates the level of demand for fertilizer in the system as this production is greater than the fertilizer produced in Scenario BAU. The total demand for each end-product is indicated with the index “total”, such as “Animal_feedtotal”, “Fertilizertotal”, “Heat_and electricitytotal”, and “Vehicle_fueltotal”.
A system expansion was made to include the environmental impacts and energy use from the production of the alternative fuel/fodder/fertilizer when not produced from the organic by-products. For fodder, the by-products used as animal feed is assumed to be replaced with conventional fodder based on grain or soya beans, depending on the composition of the by-product stream. The fertilizer resulting from the composting process as well as digestate is assumed to replace artificial fertilizer. In all systems, the produced heat is assumed to replace heat from biomass in DHSs, as it is the most common fuel for district heating in Sweden [18]. Electricity produced in the system is assumed to replace electricity in the Swedish national electricity grid. However, as the Swedish national electricity grid is connected to the surrounding national electricity grids, the production units in those countries also influence the production mix. To deal with the large differences of the origin of the electricity, this study assumes two extremes: (1) The produced electricity replaces electricity from a coal condensing power plant as it is assumed to be the current marginal electricity production in Europe [19] and (2) the produced electricity replaces electricity from an electricity system totally based on renewables. The produced vehicle fuel is assumed to increase the number of biogas vehicles and replace vehicles that use diesel, as diesel is the fuel most commonly used in the Swedish transport sector [18].
2.3.1. Scenario BAU
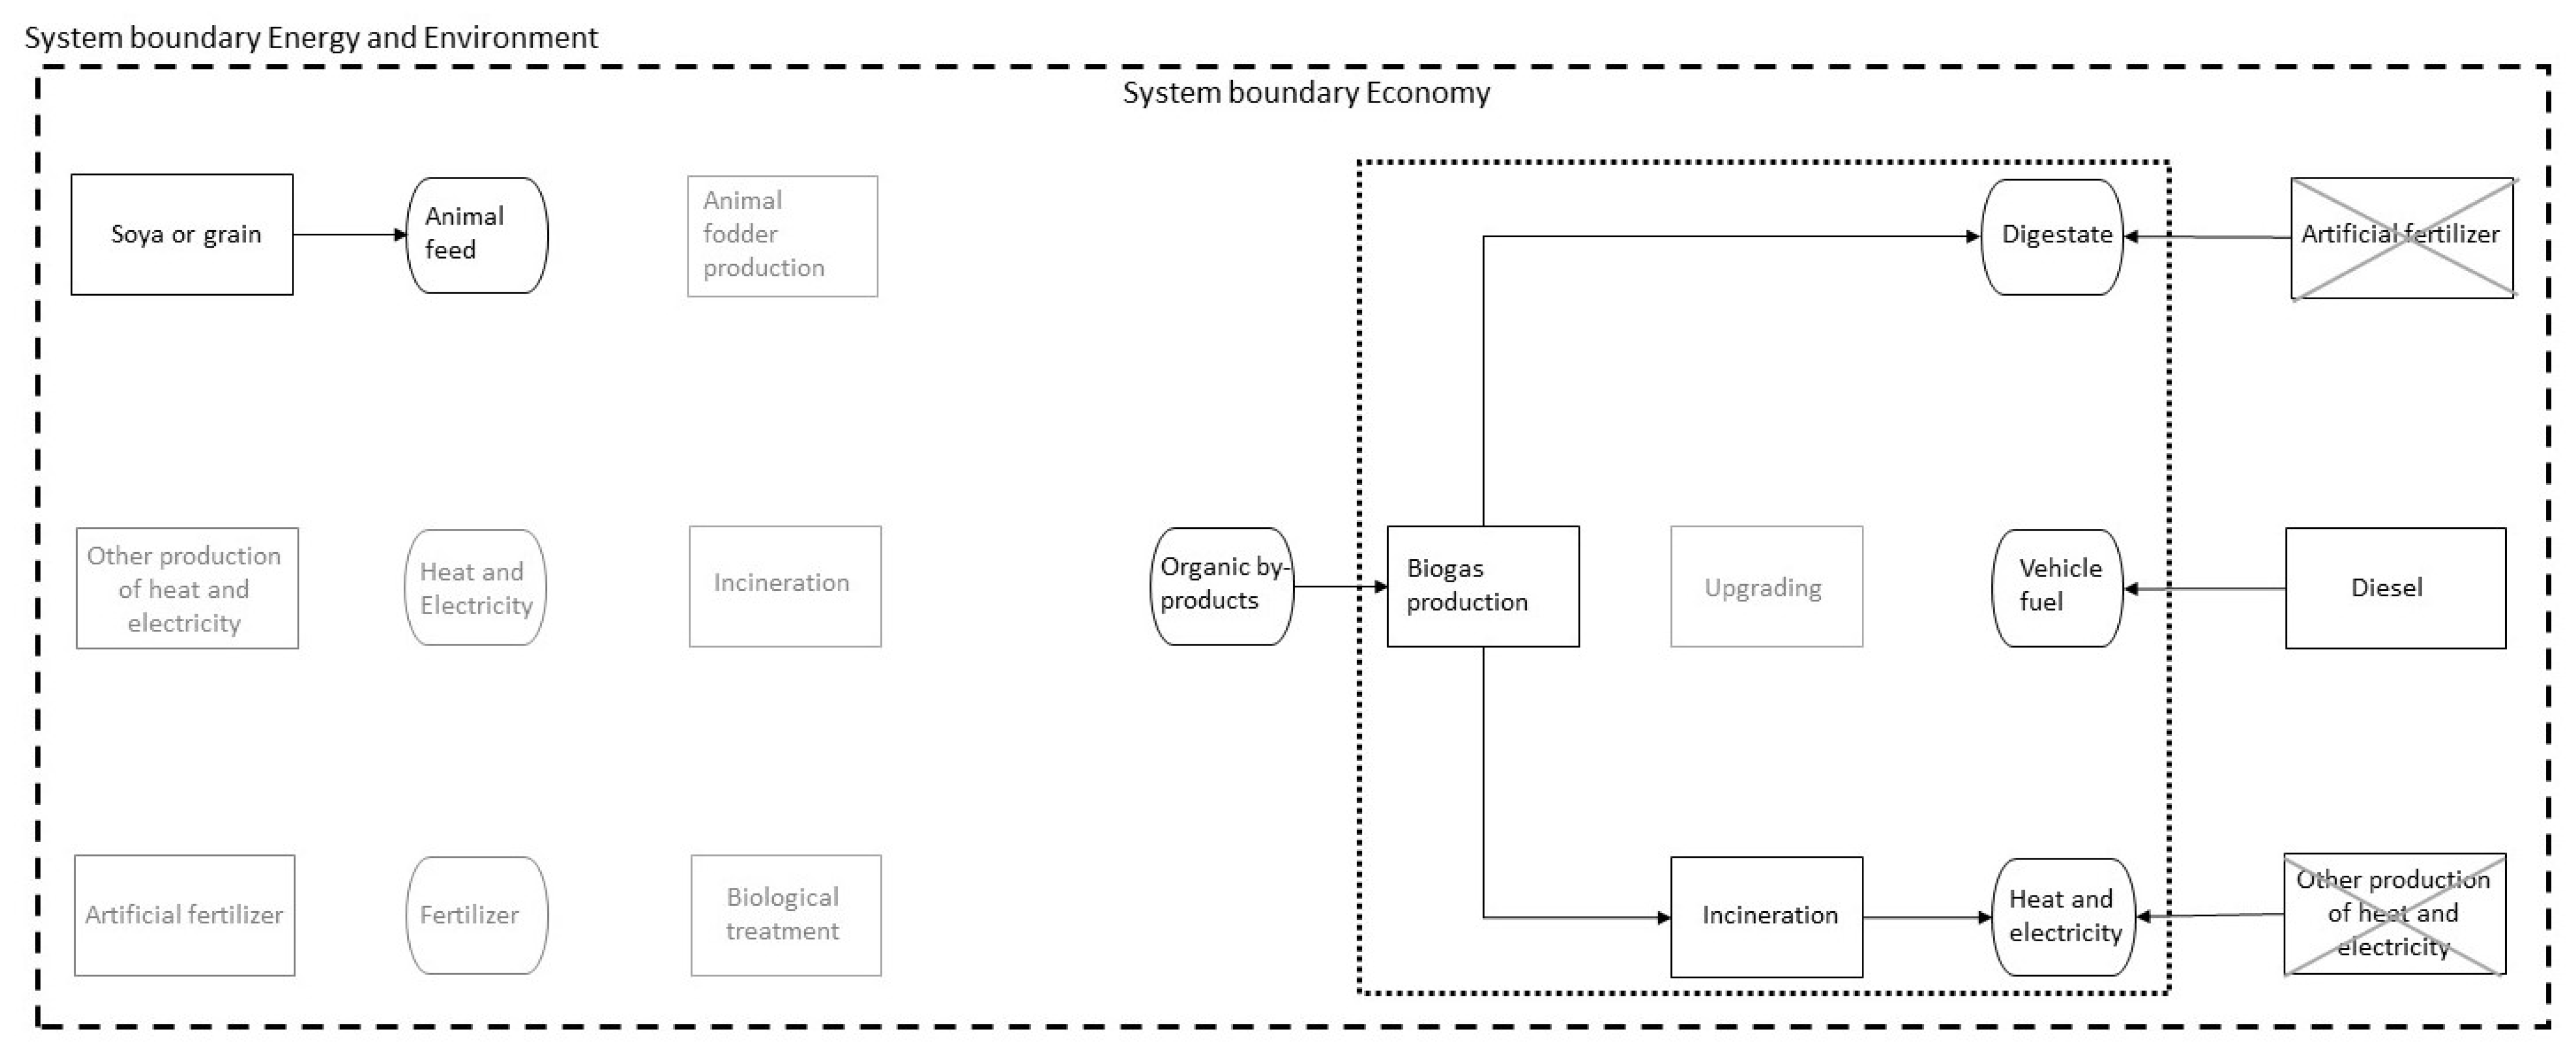
The scenario describing the current treatment methods for the systems studied is referred to as Scenario BAU, and an overview of the systems can be seen in Figure 2. The amounts of organic by-products differ between the systems; however, the overview can be applied to all systems. The economic system boundary was chosen to include the production of heat and electricity, fodder, and fertilizer (see Section 2.4.1 for clarification). The environmental and energy system boundary was set to include the system expansion. In Scenario BAU, the end-products produced from the organic by-products replace soya or grain (animal feed), artificial fertilizer (fertilizer), and other production of heat and electricity. Moreover, the demand for vehicle fuel (Vehicle_fueltotal) is met by diesel, the additional demand for fertilizer (digestate), to fulfil the demand for fertilizer (Fertilizertotal), is met by artificial fertilizer, and the demand for heat and electricity (Heat_and_electricitytotal) is met by other production of heat and electricity (see the right side of Figure 2).
2.3.2. Scenario CHP
An overview of the biogas scenario, Scenario CHP, is found in Figure 3. The economic system boundary is set to include the production of digestate (fertilizer) as well as the production and use of raw biogas (see Section 2.4.1 for clarification). The environmental and energy system boundaries are set to include the system expansion. The end-products produced from the organic by-products replace artificial fertilizers and other production of heat and electricity. The demand for vehicle fuel and animal feed is met by diesel and soya or grain to fulfil the demand for vehicle fuel (Vehicle_fueltotal) and animal feed (Animal_feedtotal), respectively. As the total demand for fertilizer (Fertilizertotal), as well as heat and electricity (Heat_and_electricitytotal), is regulated by Scenario CHP, there is no need for the alternative production of these end-products in this scenario. Therefore, these boxes are grey in Figure 3.
2.3.3. Scenario Vehicle
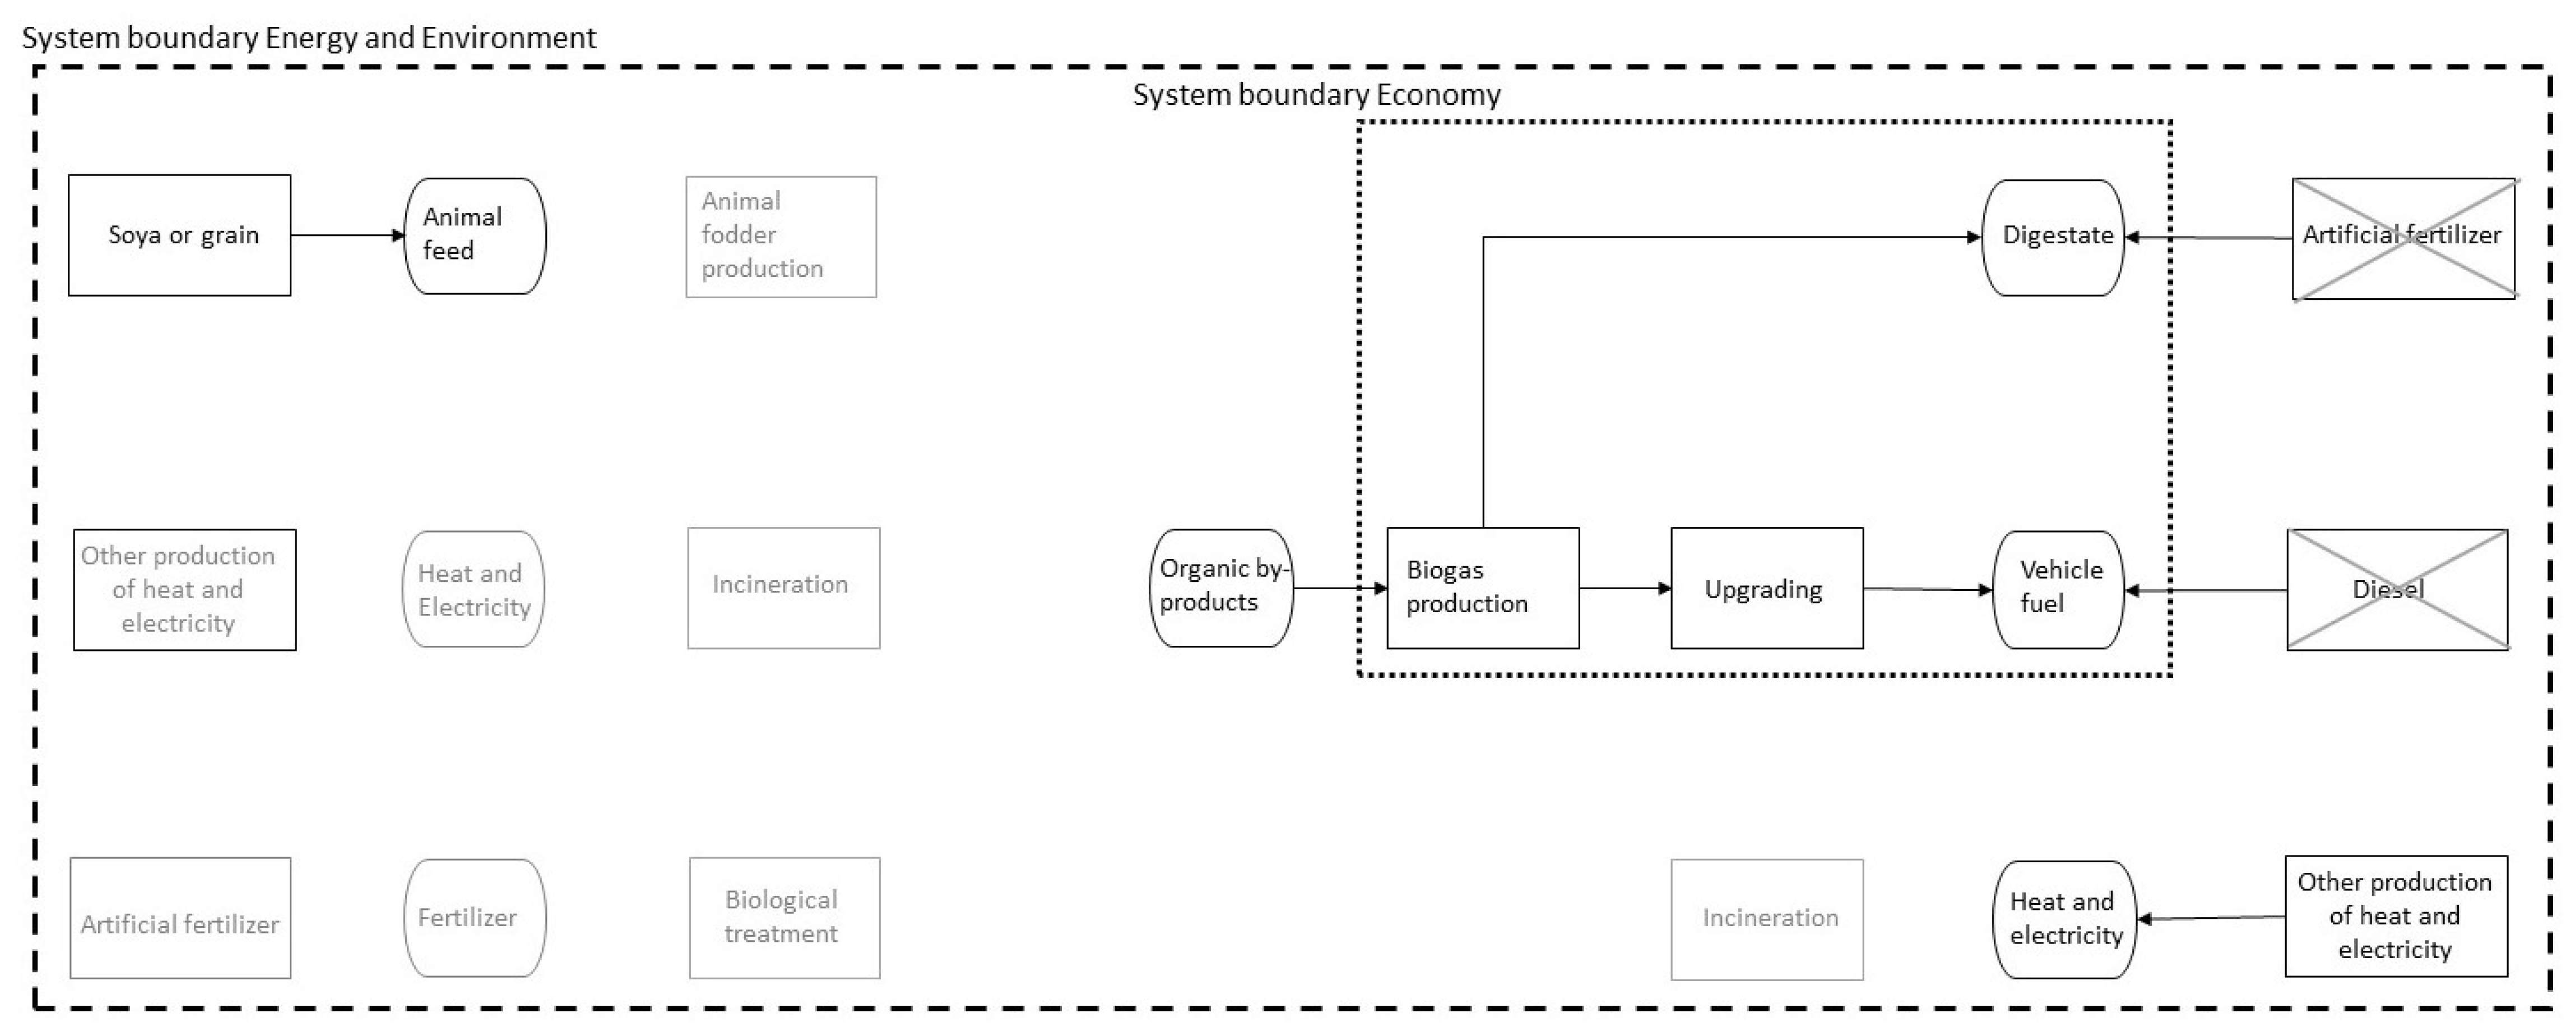
An overview of the biogas scenario, Scenario Vehicle, is provided in Figure 4. The economic system boundary is set to include the production of digestate (fertilizer), as well as the production and use of the raw biogas (see Section 2.4.1 for clarification). The environmental and energy system boundary is set to include the system expansion. The end-products produced from the organic by-products replace artificial fertilizer and diesel. The demand for heat and electricity is met by other methods of producing heat and electricity, and the demand for animal feed in the system is met by soya or grain, to fulfil the demand for heat and electricity (Heat_and_electricitytotal) and animal feed (Animal_feedtotal), respectively. As the total demand for fertilizer (Fertilizertotal), as well as vehicle fuel (Vehicle_fueltotal), is regulated by Scenario Vehicle, there is no need for the alternative production of these end-products in this scenario, so these boxes are grey in Figure 4.
2.4. Evaluation Perspectives
The evaluation of the systems has been made from three different perspectives: Economy, energy, and environment. The environmental perspective is divided into Global Warming Potential (GWP), Acidification Potential (AP), and Eutrophication Potential (EP).
2.4.1. Economy
For each system, the total costs and revenues associated with the different systems have been calculated and summarized. The major costs have been identified by Alexandersson, Hultgren, and Nordström [17] as costs of energy and maintenance, and the major revenues are made by sales of different products (e.g., biogas, fodder, and electricity). Table A2 (in Appendix A) presents the prices for different products used or sold in the study. The animal feed produced in Scenario BAU has been assumed to cost as much as the corresponding feed (i.e., soya or grain) for the customer. The costs associated with production are found in Table A3 (in Appendix A). For Scenario BAU, no investment cost has been included because these treatment methods already exist. For Scenario CHP and Scenario Vehicle, the investment costs for production, incineration, and upgrading of biogas have been included, as these facilities need to be built if the organic by-products are to be used in biogas production. The calculations consider the different existing prices of district heating in the systems (Table A2 in Appendix A). In this study, the evaluation perspective “economy” has a slightly different system boundary than the other evaluation perspectives to be able to, for example, compare the costs for Scenario BAU to Scenario CHP and Scenario Vehicle, respectively.
2.4.2. Energy
The energy balance for each system was calculated. The system boundary for the energy perspective is the wider one, including the system expansion. The input and output of energy for all processes were included, and the energy balance for each scenario in the different systems was calculated. For the alternative production methods replaced by the treatment methods, the energy demand is viewed as saved, and hence, the energy demand for the alternative production methods decreases the total energy demand for the systems.
The energy demand for the different processes can be found in Table A4 (in Appendix A). Primary energy is used to compare high-quality and low-quality energy. The primary energy factors used are found in Table 1. In this study, the primary energy factor for wind power and incineration of the organic by-products is set to 0 since, according to Gode et al [19], the primary energy is set to zero if the fuel/energy is viewed as a rest (no new material needs to be added). The number included in the total in Table 1 is the energy demand for the conversion, therefore, wind power, and incineration organic by-products is not zero. For the other primary energy factors, the primary energy for fuel is set to one, and the energy demand for the transmission is added [20]. For example, for coal condensing power, the primary energy factor is three, of which, one is the primary energy for coal and two is the energy demand for the conversion of coal to electricity.
Just as the produced electricity is assumed to replace either electricity from coal condensing power or electricity from an electricity system totally based on renewables (here represented by wind power), the same applies for the electricity demand in the systems.
2.4.3. Environment
For the environmental perspective, the system boundary includes the system expansion. All emissions for the all different processes included in each scenario are included in the assessment. For the alternative production methods replaced by the treatment methods in the scenarios, the emissions are viewed as saved, so the emissions from these processes decrease the total emissions from the systems. Emissions connected to construction of the different facilities have not been included in the study.
Specific emissions factors related to energy conversion are found in Table A5 (in Appendix A), and other specific emissions factors used in this study are found in Table A6 (in Appendix A). The methane slip for the biogas production is estimated to be 2% of the produced biogas for the pre-treatment and the digester, and 1% of the produced biogas for the upgrading process [10]. The methane slip is included in the calculations, and hence, the emissions of CO2-eq from incineration of biogas is set to zero in Table A5.
2.5. Systems Analysis
The analysis is performed on the systems, i.e., the simplifications of the cases studied. In this study, the focus is the amount of industrial organic by-products, the treatment methods currently used in the different systems (Scenario BAU), and the possibility of using the available amount of industrial organic by-products to produce biogas instead (Scenario CHP and Scenario Vehicle). The evaluations of the systems were made from the perspectives presented (economy, energy, and environment), and the net results were calculated for each of the studied scenarios in each system. The economic perspective may be perceived as a business economic approach for the biogas scenarios, as the net results for the scenarios are calculated based on the costs and revenues treating the industrial organic by-products. Conversely, the energy and environmental perspectives have wider system boundaries, including the changes in the surrounding system. Therefore, these perspectives may be considered from a more societal perspective.
The biogas process includes pre-treatment, digestion, and incineration or upgrading of the biogas as well as refining of the digestate to fertilizer. For animal fodder production and composting of the by-product, energy demand has been considered for the processes included in the treatment of the by-products, as well as the energy demand for the alternative production methods replaced by the treatment methods. In the biogas processes, needs for electricity and heat have been included. Costs associated with these demands have been included in the calculations.
3. Results
As mentioned above, five cases were chosen for in-depth studies. In total, 102 companies were contacted, and of these, 75 participated. A compilation of the results from the interviews is found in Table 2. The amounts of by-products that are currently transported from the interviewed companies to biogas plants are considered not available and thus excluded from further analysis.
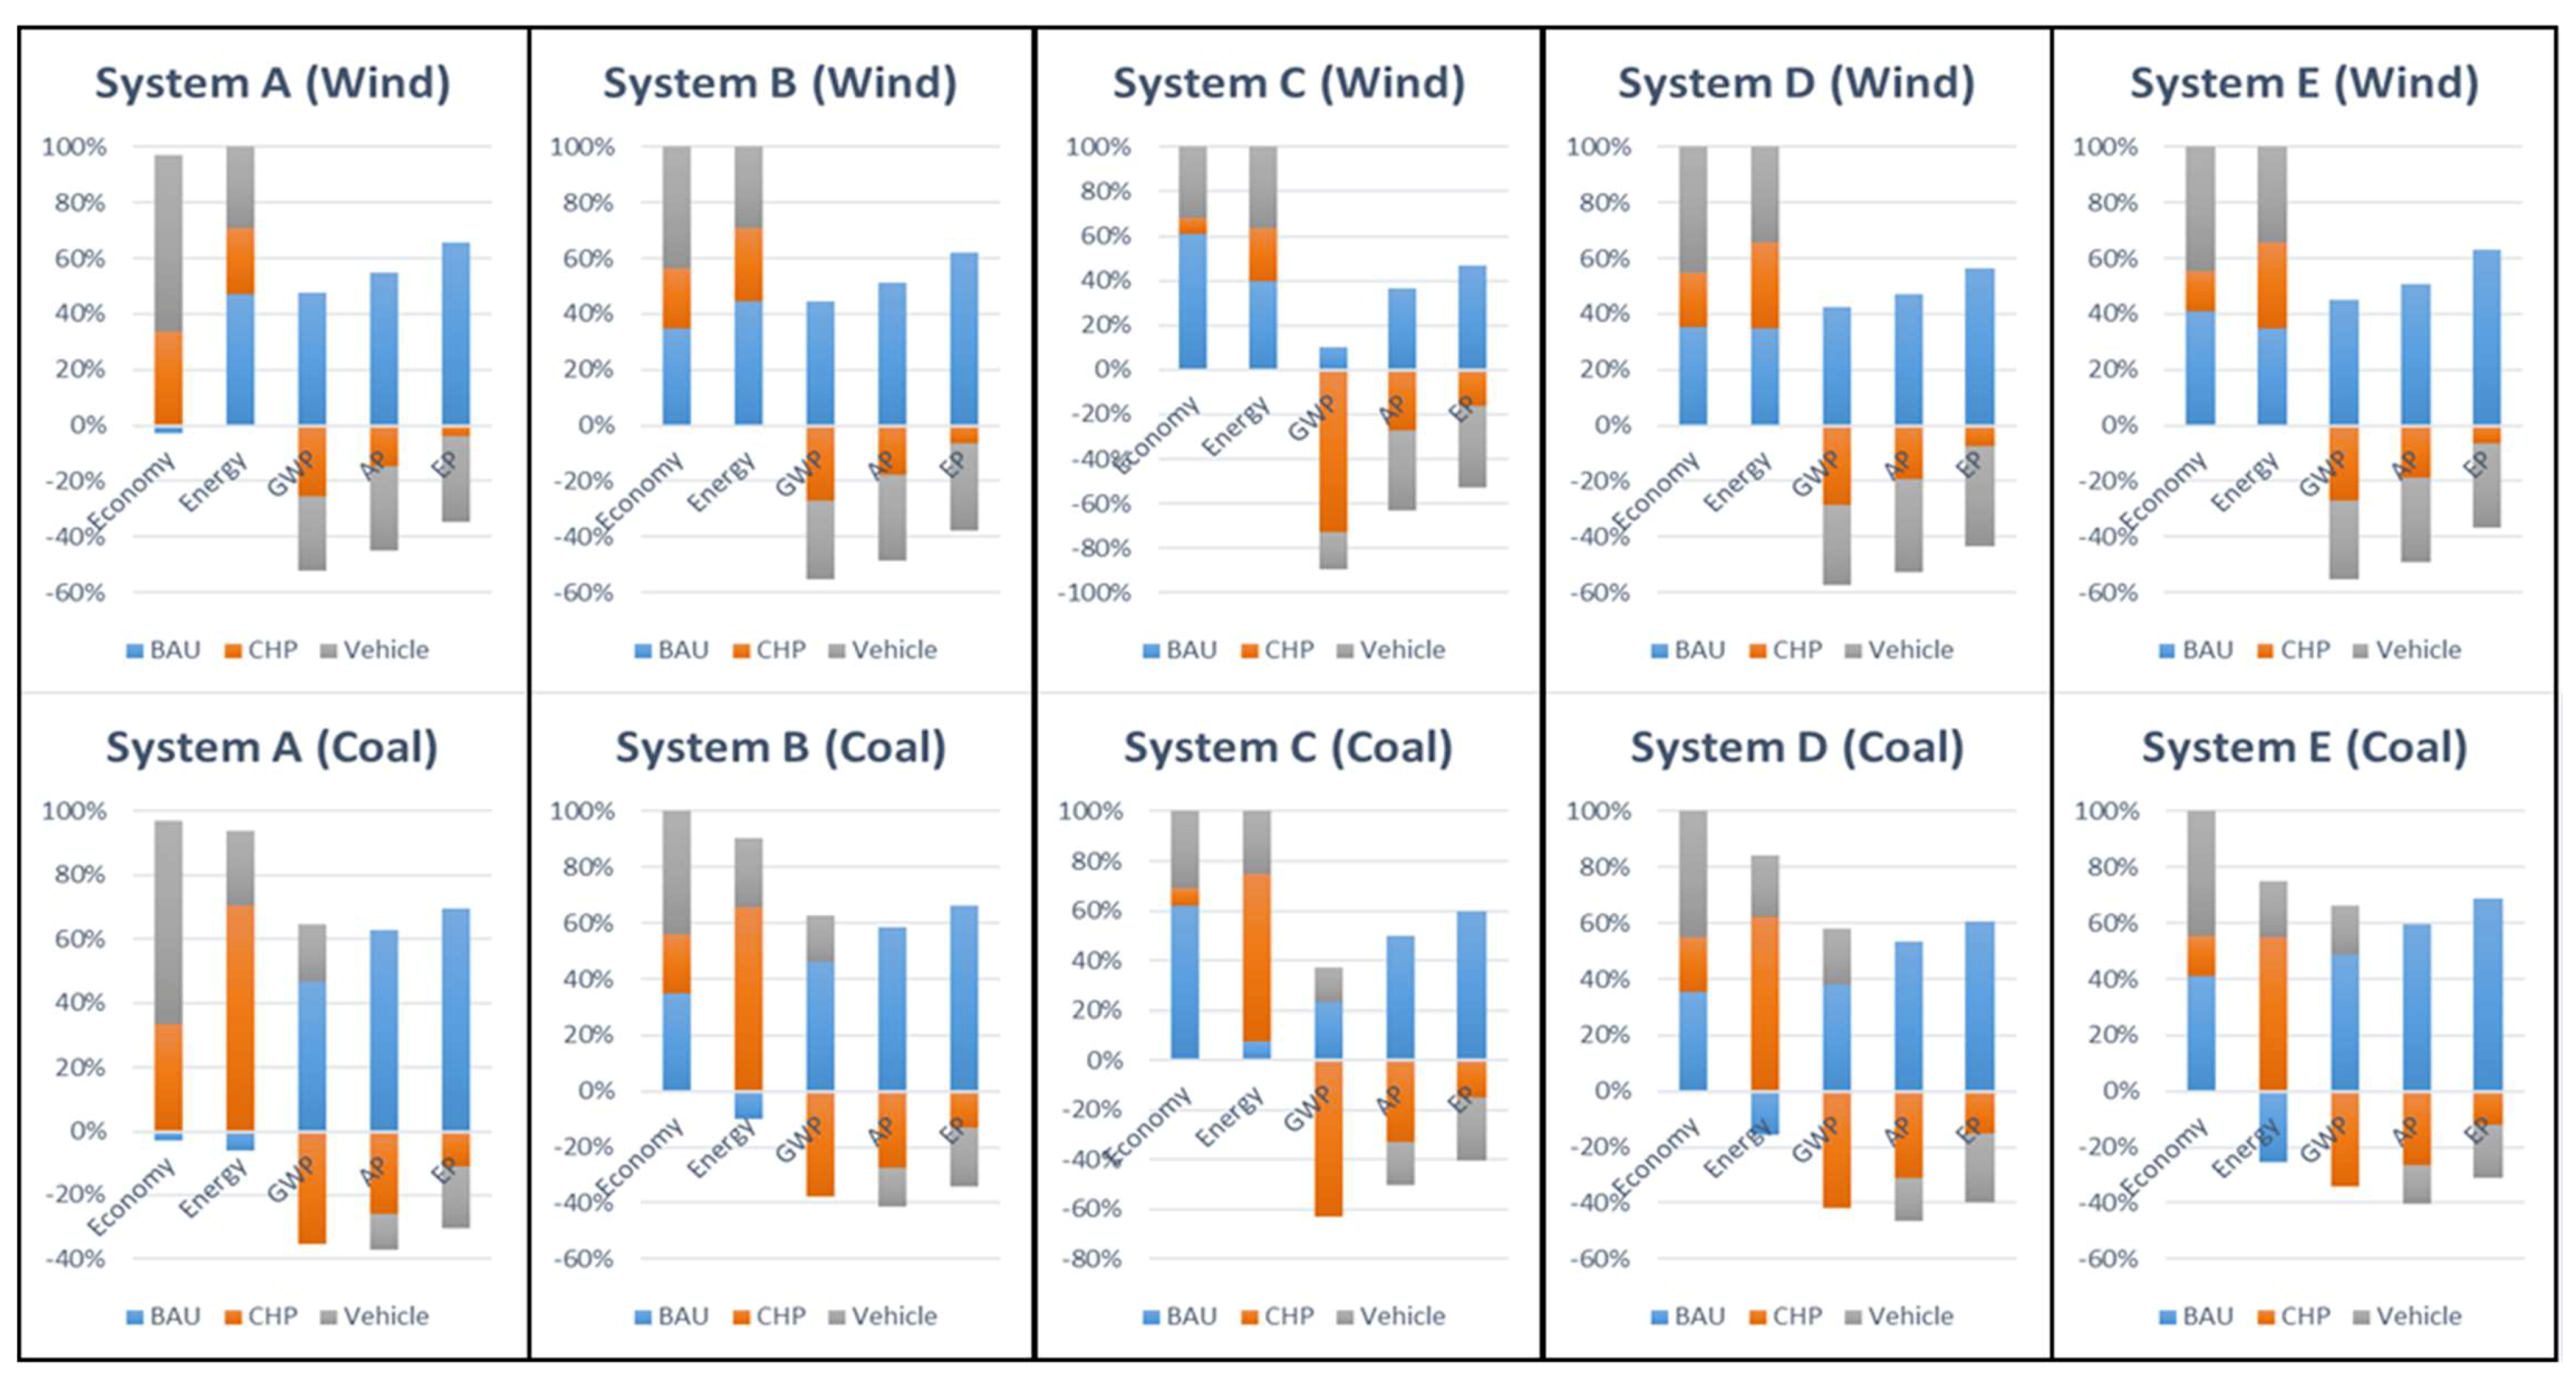
Results from the evaluation of the systems are presented in Figure 5, with the assumption that all electricity production in the systems originates from either wind power (top) or coal condensing power (bottom). All results shown are net results for the whole systems studied, i.e., all the treatment methods included in the systems are contributing to the total results for the systems.
The economic results presented in the figure show the net profit for the studied systems. As the generation of electricity in coal condensing power plants or wind power plants is outside the economic system boundary, the economic results are not affected by how the electricity is produced (coal or wind).
The alternative production methods replaced by the treatment methods are decreasing the total numbers for the systems, since energy demand and emissions from these alternative treatments methods are saved when the processes are not necessary to meet the total demand for the end products in the systems.
The energy results show the primary energy use for the systems. It is noteworthy that the whole system studied contributes to the net results and not a standalone biogas plant, i.e., the energy results, for example, show if the whole system studied has a net energy demand and not just the biogas plant (or the production facilities in Scenario BAU). For GWP, AP, and EP, the results show a total decrease or increase of the emissions; therefore, a large negative number is desirable for these perspectives.
As can be seen in Figure 5, Scenario BAU shows desirable results for the economy in all systems, but system A and for energy for all systems when the electricity system is based on wind power. When the electricity system is based on coal condensing power, the energy demand for Scenario BAU systems is higher than the delivered energy, except for system C. From the environmental perspectives, Scenario BAU increases the different potentials for all three perspectives in all systems.
The two biogas scenarios follow the same trend in the results, with desirable results from all perspectives (positive for economy and energy and negative for GWP, AP, and EP), except for Scenario Vehicle in the GWP perspective when electricity is based on coal condensing power. The reason for this exception is the high electricity demand for the upgrading process and the high emissions connected to GWP from coal condensing power (415 g CO2-eq. /kWh).
The results from the evaluation of the systems show some patterns. In Table 3, the most preferred scenario for each system and perspective is presented. For example, viewed from a strict energy perspective, the most efficient treatment method for the organic by-products are to produce biogas to be used in a CHP when the electricity originates from coal condensing power. This is due to the high energy demand for the transmission of coal to electricity. From a strict economic perspective, production of vehicle fuel from biogas is the most cost effective in all systems but System C, where Scenario BAU is the most cost efficient. A reason for this could be that the organic by-product in system C with the highest biogas potential is treated biologically, which is cheaper than animal fodder production, which is the case in the other systems.
From the economic perspective, Scenario BAU does not include any investment cost as the system describes the current situation. This gives the system an advantage towards the other two systems, because investments are included to produce biogas for CHP or an upgrading unit. However, from an economic perspective, the evaluation results for Scenario Vehicle are better for four of the five systems, even though the investment cost is included.
When considering the differences between Scenario CHP and Scenario Vehicle from the energy perspective, the primary energy factor is part of the explanation. Scenario Vehicle replaces diesel, which has a primary energy factor of 1.15 and requires electricity during the production of the vehicle fuel, while Scenario CHP replaces both electricity (3.0 or 0.05) and biomass (1.06). When the electricity is assumed to originate from coal condensing power (3.0), Scenario CHP has an advantage over Scenario Vehicle. However, when wind power (0.05) is assumed, the results are equal or Scenario Vehicle has an advantage. However, Scenario BAU is best in three out of five systems for the energy perspective, when wind power is assumed. For System D, Scenario BAU and Scenario Vehicle has the same result.
The results from the environmental perspective depend on the specific emissions factors, which in turn are connected to the current treatment methods of the organic by-products as well as the treatment in the two biogas systems. The composition of the by-products in the systems also affects the results, as well as which electricity production is considered.
As can be seen, the most beneficial scenarios for Systems A and B are the same for all perspectives, and the two biogas scenarios show better results in total compared to Scenario BAU, except for energy (wind). Both these systems currently send the organic by-products mainly to fodder production. When considering the biogas potential in the different systems, System A has the largest potential (513 GWh) and System B the lowest (4.3 GWh). Since the evaluation results for the two systems are similar, the biogas potential is not a key factor for the results.
When comparing the two biogas systems, some patterns are revealed (Table 3). For example, Scenario Vehicle is the most cost-efficient alternative. This could be due to the relatively low electricity price in Sweden during the studied period (2014). Scenario Vehicle requires electricity during the production of biogas, as well as for the upgrading of the raw biogas to vehicle fuel, whereas Scenario CHP only requires electricity to produce raw biogas. However, the price for the produced vehicle fuel is higher than the prices for the sold electricity and heat in Scenario CHP. Another pattern found in the evaluation results is that Scenario CHP has an advantage over Scenario Vehicle for the environmental perspectives (except for EP) when the electricity is assumed to originate from coal condensing power, whereas Scenario Vehicle has an advantage when the electricity is assumed to originate from wind power. The reason for this is the high differences in specific emission connected to coal condensing power and wind power, as shown in Table A5 in Appendix A.
4. Concluding Discussion
Several factors influence the results: the current treatment methods of the by-products, the biogas potential, the combination of by-products in the systems, the specific methane yield of the different by-products, as well as the specific emissions for energy conversion and fodder and fertilizer production. As the combination of all these factors produces complex interactions between the factors, it is difficult to distinguish the importance the different factors have on the results. To be able to establish the influence of a specific parameter on the results, sensitivity analysis is needed. This has not been included in this study, apart from the effects of different electricity systems on the results.
The results show in all of the systems that it would be more beneficial to change the treatment method from the current one to one of the two biogas options, except from an energy (wind) perspective in three systems and the economic perspective in system C. However, even if Scenario BAU shows more beneficial results in these perspectives, the biogas scenarios still have beneficial results. Whether to produce vehicle fuel from the raw biogas or to generate heat and electricity depends on the perspective in focus and the assumed electricity production in the surrounding electricity grid. Tufvesson et al. [9] compared biogas production to production of animal feed and found that biogas production from residues are a beneficial option. This is in line with the results found in this study as well. However, Tufvessson et al. [9] only looked at reduction of greenhouse gas emissions.
The different systems studied vary in size and biogas potential. However, since the results are presented in relation to each other within a system, these differences between the systems does not seem to influence the results. For example, systems A and B has the highest and lowest biogas potential, but the most preferred scenarios in the systems are the same for all perspectives.
The quality of the organic by-product has influenced the results. For example, system C has large amounts of organic by-products, however, the biogas potential is not as high. This is due to low biogas yield in the organic by-products. With different composition in the organic by-products, more biogas would be generated, and hence, the results would differ.
As mentioned earlier, transportation of the industrial by-products from the food companies are not included in the study. The transportations were excluded from the study because all transportation distances were unknown. Assumed distances would be needed and to be realistic both the treatment facilities and biogas production plants should be located in a larger city and approximately the same distance from the food companies. As the amounts of organic by-products are the same for all scenarios in the studied systems, the same amount of transportation would be applied for all scenarios, as well the same net results for the transportation for all scenarios. Moreover, according to Tufvesson, Lantz, and Börjesson [9], the transportation of substrates to the biogas plant is not of great importance for the results.
If the aim of the study is to compare different systems with each other, a functional unit is necessary. The functional unit could be either amount of organic by-products, or biogas potential. In this study, the aim is not to compare the numerical results for the different systems, and hence, no functional unit has been used. Homogeneity of the data used is of importance both within the different systems, but also between them to be able to draw relevant conclusions about the results. In this study, the input data on amount of by-products were delivered directly by the companies. For other input data, such as emission factors, the authors tried to find information in the same references, to the extent it was possible, to assure that the numbers were based on the same assumptions.
As can be seen in the results, deciding whether biogas is a preferable and resource efficient option is complex as many variables need to be considered. Additionally, quality and quantities of the biological by-products are decisive when it comes to the net benefits of the value chain. That is, world prices on fuels and feedstock as well as emission allocations to substituted fuels and materials largely influence what can be regarded as most beneficial. It is therefore of greatest importance that a larger systems perspective is applied when deciding how to use organic by-products in future value chains.
This research design enables an analysis of different uses of industrial organic by-products in the food industry. Although this paper includes studies of five food industry systems, the research design can be used when analysing more food industry systems, but the design also has the potential to include and integrate other industries in future analyses. The research design provides more comprehensive results compared to research designs, approaches, methods, and studies only producing results for single systems, single scenarios, or single perspectives. The use of the five systems in this study illustrates the strength of using the proposed research design.
The results suggest that the food industry should not be the only actor involved in deciding how to treat its by-products. On the contrary, using organic by-products from the food industry demands cooperation from both the public sector and the energy sector. The role of public sector is mainly to be active in spatial planning, resource planning, allocating local resources, and identifying local value chains, whereas the role of industry is to look for strategic alliances where the organic by-products can become resources for other entities, private, or public.
Author Contributions
J.I. and E.L. did the identification of cases. J.I. supervised the students responsible for the data collection. E.L. was responsible for writing the paper, with input from J.I. and M.K.
Funding
This research received no external funding.
Acknowledgments
This work was carried out within the Biogas Research Center (BRC). BRC is funded by the Swedish Energy Agency, Linköping University, and participating organizations. A special thanks to Anton Nordström, Elin Hultgren, and David Alexandersson for their help with data collection.
Conflicts of Interest
The authors declare no conflict of interest.
Appendix A

Table A1.
Biogas yield from different substrates [23]. TS means total solids.
Table A1.
Biogas yield from different substrates [23]. TS means total solids.
| Category of by-Products | TS (%) | Specific Methane Yield (m3 CH4/ton TS) |
|---|---|---|
| Slaughterhouse | 30 | 528 |
| Vegetable-based oil | 95 | 720 |
| Mixed food | 30 | 400 |
| Yeast | 30 | 465 |
| Cellulose | 100 | 230 |
| Charcuterie | 30 | 528 |
| Indigestible | 0 | 0 |
| Stillage | 9 | 314 |
| Fishery | 42 | 726 |
| Grease separator sludge | 4 | 518 |
| Fruit and vegetables | 15 | 506 |
| Potato | 20 | 330 |
| Flour/bread | 61 | 243 |
| Grains | 86 | 310 |
| Dairy | 8 | 395 |
| Fodder | 50 | 260 |
| Dry food | 80 | 210 |
| Sugar | 85 | 299 |
| Manure | 6 | 200 |
| Bones | 0 | 0 |
Table A2.
Prices for different products used or sold in this study.
| Products | Price | Reference |
|---|---|---|
| Electricity | 0.059 EUR/kWh | [24] |
| Diesel | 0.14 EUR/kWh | [25] |
| District Heating | [EUR/kWh] | |
| Case A | 0.082 | [26] |
| Case B | 0.075 | |
| Case C | 0.081 | |
| Case D | 0.082 | |
| Case E | 0.078 | |
| Vehicle fuel | 1.34 EUR/Nm3 | [27] |
| Water | 1.4 EUR/m3 | [28] |
| Animal Fodder (Soya) | 0.7 EUR/kg | [29] |
| Animal Fodder (Grain) | 0.3 EUR/kg | [29] |
| Digestate | 4.1 EUR/ton | [30] |
Table A3.
Costs associated with production in the study.
| Processes | Type of Cost | Price | Reference |
|---|---|---|---|
| Incineration Biogas | Operating cost | 15 EUR/MWh | [31] |
| Investment | 49 EUR/MWh | [31] | |
| Upgrading of Biogas | Operating cost | 0.041 EUR/m3 | [32] |
| Investment | 0.13 EUR/m3 | [33] | |
| Production Biogas | Operating cost | 21 EUR/ton | [34] |
| Investment | 6.3 EUR/ton | [34] | |
| Incineration Waste | Operating cost | 21 EUR/MWh | [35] |
| Composting | Operating cost | 70 EUR/ton | [36] |
| Animal Fodder Production | Operating cost | 0.13 EUR/kg | [37] |
Table A4.
Energy demand for different processes included in the study.
| Process | Kind | Energy Demand | Reference |
|---|---|---|---|
| Production of biogas | Heat Demand | 30.5 kWh/ton Substrate | [8] |
| Electricity Demand Pre-Treatment (kWh/ton) | 0–10 TS% | 3.4 | [38] |
| 11–20 TS% | 6.4 | ||
| 21–30 TS% | 9.5 | ||
| 31–40 TS% | 12.5 | ||
| 41–50 TS% | 15.5 | ||
| 51–60 TS% | 18.6 | ||
| 61–70 TS% | 21.6 | ||
| 71–80 TS% | 24.6 | ||
| 81–90 TS% | 27.7 | ||
| 91–100 TS% | 30.7 | ||
| Other electricity demand | 41.8 kWh/ton | [38] | |
| Upgrading of Biogas | Electricity demand | 0.2 kWh/Nm3 raw biogas | [33] |
| Compression of Upgraded Biogas | Electricity demand | 0.22 kWh/Nm3 upgraded biogas | [33] |
| Animal Fodder Production | Electricity demand | 420 kWh/ton | [37] |
| Composting | Electricity demand | 68 kWh/ton | [36] |
| Alternative Fodder Production | Soya (primary energy) | 2220 kWh/ton | [37] |
| Grain (primary energy) | 810 kWh/ton | [37] | |
| Alternative Fertilizer | Electricity demand | 14.7 kWh/kg N 8.5 kWh/kg P | [39] |
Table A5.
Specific emissions connected to energy conversion in the study [20].
Table A5.
Specific emissions connected to energy conversion in the study [20].
| Energy Conversion | GWP (g CO2 eq./kWh) | AP (g SO2 eq./kWh) | EP |
|---|---|---|---|
| Diesel (including usage) | 279 | 1.17 | 0.205 |
| Diesel (without usage) | 26.8 | 0.282 | 0.0413 |
| Coal condensing power | 415 | 0.715 | 0.0452 |
| Wind power | 47.6 | 0.167 | 0.0151 |
| Incineration of industrial organic waste | 0.105 | 0.00213 | 0.0000478 |
| Biofuel in DH | 9.48 | 0.188 | 0.0308 |
| Incineration biogas | 0 | 0.0198 | 0.00368 |
Table A6.
Other specific emissions used in the study.
| Process | GWP (g CO2 eq./kg) | AP (g SO2 eq./kg) | EP | References |
|---|---|---|---|---|
| Animal fodder production (from organic by-products) | 13.6 | 0.14 | 0.02 | [37] |
| Animal fodder production (soya based) | 850 | 7.1 | 4.8 | [37] |
| Animal fodder production (grain based) | 458 | 3 | 4.8 | [37] |
| Artificial fertilizer production (100% Nitrogen) | 3330 | 10.2 | 1.04 | [39] |
| Artificial fertilizer production (100% phosphorous) | 3100 | 62.6 | 2.34 | [39] |
| Composting | 23.2 | 2.44 | 0.457 | [39] |
References
- EU. Data & Trends eu Food and Drink Industry 2016; EU: Brussels, Belgium, 2017. [Google Scholar]
- Food Industries. Final Report of the Competition Investigation; Food Industries: Stockholm, Sweden, 2015. [Google Scholar]
- The Swedish Food Federation. Sweden’s Fourth Industry. Available online: https://www.livsmedelsforetagen.se/branschfakta/ (accessed on 19 September 2018).
- FAO. Protein Sources for the Animal Feed Industry; FAO: Rome, Italy, 2004. [Google Scholar]
- Wang, J.; Zhong, Z.; Zhang, B.; Ding, K.; Xue, Z.; Deng, A.; Ruan, R. Upgraded bio-oil production via catalytic fast co-pyrolysis of waste cooking oil and tea residual. Waste Manag. 2017, 60, 357–362. [Google Scholar] [CrossRef] [PubMed]
- Wellinger, A.; Murphy, J.D.; Baxter, D. The Biogas Handbook: Science, Production and Applications; Elsevier: New York, NY, USA, 2013. [Google Scholar]
- Dhillon, G.S. Protein Byproducts: Transformation from Environmental Burden into Value-Added Products; Academic Press: Cambridge, MA, USA, 2016. [Google Scholar]
- Berglund, M.; Börjesson, P. Assessment of energy performance in the life-cycle of biogas production. Biomass Bioenergy 2006, 30, 254–266. [Google Scholar] [CrossRef]
- Tufvesson, L.M.; Lantz, M.; Börjesson, P. Environmental performance of biogas produced from industrial residues including competition with animal feed–life-cycle calculations according to different methodologies and standards. J. Clean. Prod. 2013, 53, 214–223. [Google Scholar] [CrossRef]
- Lantz, M.; Ekman, A.; Börjesson, P. Optimized Production of Vehicle Gas—An Environmental and Energy System Analyses of Söderåsens Biogas Plant; 9188360954; Lund University: Lund, Sweden, 2009. [Google Scholar]
- Viklund, S.B.; Lindkvist, E. Biogas production supported by excess heat–a systems analysis within the food industry. Energy Convers. Manag. 2015, 91, 249–258. [Google Scholar] [CrossRef]
- Pöschl, M.; Ward, S.; Owende, P. Evaluation of energy efficiency of various biogas production and utilization pathways. Appl. Energy 2010, 87, 3305–3321. [Google Scholar] [CrossRef]
- Van Dael, M.; Van Passel, S.; Pelkmans, L.; Guisson, R.; Reumermann, P.; Luzardo, N.M.; Witters, N.; Broeze, J. A techno-economic evaluation of a biomass energy conversion park. Appl. Energy 2013, 104, 611–622. [Google Scholar] [CrossRef]
- Pierie, F.; Benders, R.; Bekkering, J.; van Gemert, W.T.; Moll, H. Lessons from spatial and environmental assessment of energy potentials for anaerobic digestion production systems applied to the netherlands. Appl. Energy 2016, 176, 233–244. [Google Scholar] [CrossRef]
- Lindkvist, E.; Karlsson, M.; Ivner, J. Systems analysis of biogas production—Part i research design. Energies 2018, in press. [Google Scholar]
- SCB. Statistical Database. Available online: http://www.statistikdatabasen.scb.se/pxweb/en/ssd/?rxid=d4b8a49b-d631-4f8e-b3e0-a743c6c9e53a (accessed on 20 September 2018).
- Alexandersson, D.; Hultgren, E.; Nordström, A. Biogas from New Substrates; Potential Study and System Analysis of Biogas Production in Industrial Clusters; LIU-IEI-WP-16/00007-SE; Linköping University: Linköping, Sweden, 2014. [Google Scholar]
- Swedish Energy Agency. The Energy Status 2015; Swedish Energy Agency: Stockholm, Sweden, 2015. [Google Scholar]
- Johansson, M.T. Effects on global CO2 emissions when substituting lpg with bio-sng as fuel in steel industry reheating furnaces—The impact of different perspectives on CO2 assessment. Energy Effic. 2016, 9, 1437–1445. [Google Scholar] [CrossRef]
- Gode, J.; Martinsson, F.; Hagberg, L.; Öman, A.; Höglund, J.; Palm, D. Estimated Emission Factors for Fuels, Electricity, Heat and Transport in Sweden; Värmeforsk: Stockholm, Sweden, 2011. [Google Scholar]
- Persson, T. Carbon Dioxide Rating of Energy Use—What Can You Do for the Climate; Energimyndigheten: Eskilstuna, Sweden, 2008. [Google Scholar]
- Öman, A.; Hallberg, L.; Rydberg, T. Lci for Petroleum Products Used in Sweden; Swedish Envrironmental Institute: Stockholm, Sweden, 2011. [Google Scholar]
- Carlsson, M.; Uldal, M. Substrathandbok för Biogasproduktion [Substrate Handbook for Biogas Production]; Svenskt Gastekniskt Center: Malmö, Sweden, 2009. [Google Scholar]
- Swedish Energy Agency. Prices of Electricity for Industrial Customers 2007. Available online: http://www.scb.se/hitta-statistik/statistik-efter-amne/energi/prisutvecklingen-inom-energiomradet/energipriser-pa-naturgas-och-el/pong/tabell-och-diagram/genomsnittspriser-per-halvar-2007/priser-pa-el-for-industrikunder-2007/ (accessed on 6 June 2018).
- Statoil. Fuel Price for Truck Diesel. Available online: https://www.statoil.se/sv_SE/pg1334072868904/foretag/Truck/Pris-truckdiesel.html (accessed on 21 October 2018).
- Svensk Fjärrvärme. District Heating Prices. Available online: https://www.svenskfjarrvarme.se/Statistik--Pris/Fjarrvarmepriser/ (accessed on 17 October 2018).
- SPBI. Branch Facts 2014; SPBI: Stockholm, Sweden, 2014. [Google Scholar]
- Tekniska Verken AB. Tariff/Price List 2014. Available online: https://www.tekniskaverken.se/siteassets/tekniska-verken/vatten-och-avlopp/prislistor/taxa_prislista_2014.pdf (accessed on 19 March 2018).
- Lantmännen. Customer service. 2014; Interview. [Google Scholar]
- Berglund, P. Bio-fertilizer manual-bio-fertilizer from large-scale biogas plants. Avfall Sver. Rapport 2010, U2010:11, 38–42. [Google Scholar]
- Lantz, M. Farm Based Biogas Production for Combined Heat and Power-Economy and Technology; Lund University: Lund, Sweden, 2004. [Google Scholar]
- Kovac, E. Biogas Upgrading in System Perspective with Respect to Environmental Impact and Economic Costs; Uppsala University: Uppsala, Sweden, 2013. [Google Scholar]
- Bauer, F.; Persson, T.; Hulteberg, C.; Tamm, D. Biogas upgrading–technology overview, comparison and perspectives for the future. Biofuels Bioprod. Bioref. 2013, 7, 499–511. [Google Scholar] [CrossRef]
- Jarvis, Å. Biogas from Manure, Waste nad Residues—Good Swedish Examples; Svenskt Gastekniskt Center: Malmö, Sweden, 2012; pp. 10–101. [Google Scholar]
- Nyström, O.; Nilsson, P.-A.; Ekström, C.; Wiberg, A.; Ridell, B.; Vinberg, D. Electricity from New and Future Facilities 2011; Elforsk: Stockholm, Sweden, 2011; p. 26. [Google Scholar]
- Starberg, K. Evaluation of Large Scale Systems for Composting and Digesting Source-Sorted Biofuel; Avfall Sverige (Swedish Waste Management): Malmö, Sweden, 2005. [Google Scholar]
- Flysjö, A.; Cederberg, C.; Strid, I. Lca-Database for Conventional Feed Materials: Environmental Impact Associated with Production; SIK Institutet för Livsmedel och Bioteknik, 2008. Available online: https://www.diva-portal.org/smash/get/diva2:943277/FULLTEXT01.pdf (accessed on 26 January 2019).
- Yngvesson, J.; Persson, E.; Fransson, M.; Olsson, O.; Henriksson, G.; Björkmalm, J. Benchmarking Energy and Cost for Biogas Production from Organic Waste Materials; SP Sveriges Tekniska Forskningsinstitut: Borås, Sweden, 2013. [Google Scholar]
- Börjesson, P.; Berglund, M. Environmental Analysis of Biogas Systems; IMES/EESS Report No. 45; Department of Environmental and Energy Systems Studies, Lund University: Lund, Sweden, 2003. [Google Scholar]
Figure 1.
A generic overview of the systems [15]. The system expansion is included (the alternative production methods). The currently used treatment methods are shown to the left in the figure and the possible new treatment methods are shown at the right side and the same arrangement is found in Figure 2, Figure 3 and Figure 4.

Figure 2.
Scenario BAU. The collected by-products are used for either incineration or animal fodder production or are treated biologically. The dotted line shows the system boundary for the economic perspective and the crosshatched line shows the system boundary for the energy and environmental perspectives. The boxes in grey are not included in the scenario and the crossed boxes are the alternative treatment methods replaced.

Figure 3.
Scenario CHP, produced biogas is incinerated to generate heat and electricity and fertilizer is produced. The dotted line shows the system boundary for the economic perspective and the crosshatched line shows the system boundary for the energy and environmental perspectives. The boxes in grey are not included in the scenario and the crossed boxes are the alternative treatment methods replaced.

Figure 4.
Scenario Vehicle produced biogas is upgraded to vehicle fuel and fertilizer is produced. The dotted line shows the system boundary for the economic perspective and the crosshatched line shows the system boundary for the energy and environmental perspectives. The boxes in grey are not included in the scenario and the crossed boxes are the alternative treatment methods replaced.

Figure 5.
The results for the systems studied. Negative numbers in AP, EP, and GWP indicate that the system contributes to a total reduction of the emission; therefore, a large negative number is desirable. For Economy and Energy, the net results are presented, so a large positive number is desirable for those perspectives.

Table 1.
Conversion factors for primary energy.
| Kind of Energy | Primary Energy Factor | References |
|---|---|---|
| Coal condensing power | 3.0 | [21] |
| Wind power | 0.05 | [20] |
| Biomass (wood chips) | 1.06 | [20] |
| Diesel (with 5% RME) | 1.09 | [22] |
| Incineration organic by-products | 0.04 | [20] |
Table 2.
Compilation of information about the cases studied.
| Information | Case A | Case B | Case C | Case D | Case E |
|---|---|---|---|---|---|
| Localization | Centralized around one of the major cities | Centralized around one of the major cities | Coastal area | Includes three smaller cities | Centralized around one smaller city |
| Identified/Interviewed companies | 43/35 | 14/12 | 24/14 | 14/9 | 7/5 |
| Kinds of interviewed companies | Bakeries, slaughterhouses, sugar manufacturers, etc. | Slaughterhouses, candy manufacturers, etc. | Smaller slaughterhouses and fisheries, manufacturers of vegetable oil and alcohol, etc. | Food manufacturers, breweries, etc. | Dairy manufacturers, breweries, etc. |
| Kinds of flows | Fruit and vegetable by-products, grain, flour/bread, yeast, etc. | Slaughterhouse by-products, sugar, etc. | Potato by-products, slaughterhouse by-products, stillage, cellulose, vegetable oil, etc. | Grain, yeast, etc. | Grain, dairy by-products, yeast, etc. |
| Total amount of organic by-products (ton/year) | 156,150 | 2300 | 559,000 | 14,000 | 23,000 |
| Animal fodder | 151,000 | 2100 | 301,000 | 8500 | 23,000 |
| Incineration | 1100 | 100 | 12,000 | 0 | 110 |
| Composting | 50 | 100 | 257,000 | 5700 | 0 |
| Biogas potential (MWh/Year) | 513,000 | 4300 | 270,000 | 12,500 | 13,000 |
| Animal fodder | 510,000 | 3900 | 85,000 | 8600 | 13,000 |
| Incineration | 2800 | 240 | 18,000 | 0 | 160 |
| Composting | 51 | 120 | 167,000 | 3900 | 0 |
Table 3.
The most preferred scenario in the different systems for each perspective.
| System | Economy | Energy | Environment | ||||||
|---|---|---|---|---|---|---|---|---|---|
| GWP | AP | EP | |||||||
| Coal | Wind | Coal | Wind | Coal | Wind | Coal | Wind | ||
| System A | Vehicle | CHP | BAU | CHP | Vehicle | CHP | Vehicle | Vehicle | Vehicle |
| System B | Vehicle | CHP | BAU | CHP | Vehicle | CHP | Vehicle | Vehicle | Vehicle |
| System C | BAU | CHP | BAU | CHP | CHP | CHP | Vehicle | Vehicle | Vehicle |
| System D | Vehicle | CHP | BAU/Vehicle | CHP | Vehicle | CHP | Vehicle | Vehicle | Vehicle |
| System E | Vehicle | CHP | Vehicle | CHP | Vehicle | CHP | Vehicle | Vehicle | Vehicle |
* The colors for the different scenarios correlate to the colors used in Figure 5 and is used to clarify the results.
© 2019 by the authors. Licensee MDPI, Basel, Switzerland. This article is an open access article distributed under the terms and conditions of the Creative Commons Attribution (CC BY) license (http://creativecommons.org/licenses/by/4.0/).
Share and Cite
MDPI and ACS Style
Lindkvist, E.; Karlsson, M.; Ivner, J. System Analysis of Biogas Production—Part II Application in Food Industry Systems. Energies 2019, 12, 412. https://doi.org/10.3390/en12030412
AMA Style
Lindkvist E, Karlsson M, Ivner J. System Analysis of Biogas Production—Part II Application in Food Industry Systems. Energies. 2019; 12(3):412. https://doi.org/10.3390/en12030412
Chicago/Turabian StyleLindkvist, Emma, Magnus Karlsson, and Jenny Ivner. 2019. "System Analysis of Biogas Production—Part II Application in Food Industry Systems" Energies 12, no. 3: 412. https://doi.org/10.3390/en12030412
Note that from the first issue of 2016, this journal uses article numbers instead of page numbers. See further details here.