Opportunities to Optimize the Palm Oil Supply Chain in Sumatra, Indonesia
by
 , , ,
, , ,
Fumi Harahap
1,2,* ,
,
Sylvain Leduc
2,
Sennai Mesfun
2,
Dilip Khatiwada
1 ,
,
Florian Kraxner
2 and
Semida Silveira
1 1
Energy and Climate Studies Unit, Department of Energy Technology, KTH Royal Institute of Technology, SE-100 44 Stockholm, Sweden
2
International Institute for Applied Systems Analysis (IIASA), A-2361 Laxenburg, Austria
*
Author to whom correspondence should be addressed.
Energies 2019, 12(3), 420; https://doi.org/10.3390/en12030420
Submission received: 17 December 2018
/
Revised: 22 January 2019
/
Accepted: 25 January 2019
/
Published: 29 January 2019
(This article belongs to the Special Issue Optimum Choice of Energy System Configuration and Storages for a Proper Match between Energy Conversion and Demands)
Abstract
:Significant amounts of biomass residues were generated in Indonesia. While untreated, residues emit greenhouse gases during the decomposition process. On the other hand, if efficiently utilized, these residues could be used to produce value-added products. This study investigates opportunities for harnessing the full potential of palm oil residues (i.e., empty fruit bunches, kernel shells, fiber, and mill effluent). As far as we are aware, the study is the first attempt to model the palm oil supply chain in a geographically explicit way while considering regional infrastructures in Sumatra Island, Indonesia. The BeWhere model, a mixed integer linear programming model for energy system optimization, was used to assess the costs and benefits of optimizing the regional palm oil supply chain. Different scenarios were investigated, considering current policies and new practices leading to improved yields in small-scale plantations and power grid connectivity. The study shows that a more efficient palm oil supply chain can pave the way for the country to meet up to 50% of its national bioenergy targets by 2025, and emission reductions of up to 40 MtCO2eq/year. As much as 50% of the electricity demand in Sumatra could be met if residues are efficiently used and grid connections are available. We recommend that system improvements be done in stages. In the short to medium term, improving the smallholder plantation yield is the most optimal way to maximize regional economic gains from the palm oil industry. In the medium to long term, improving electricity grid connection to palm oil mills could bring higher economic value as excess electricity is commercialized.
1. Introduction
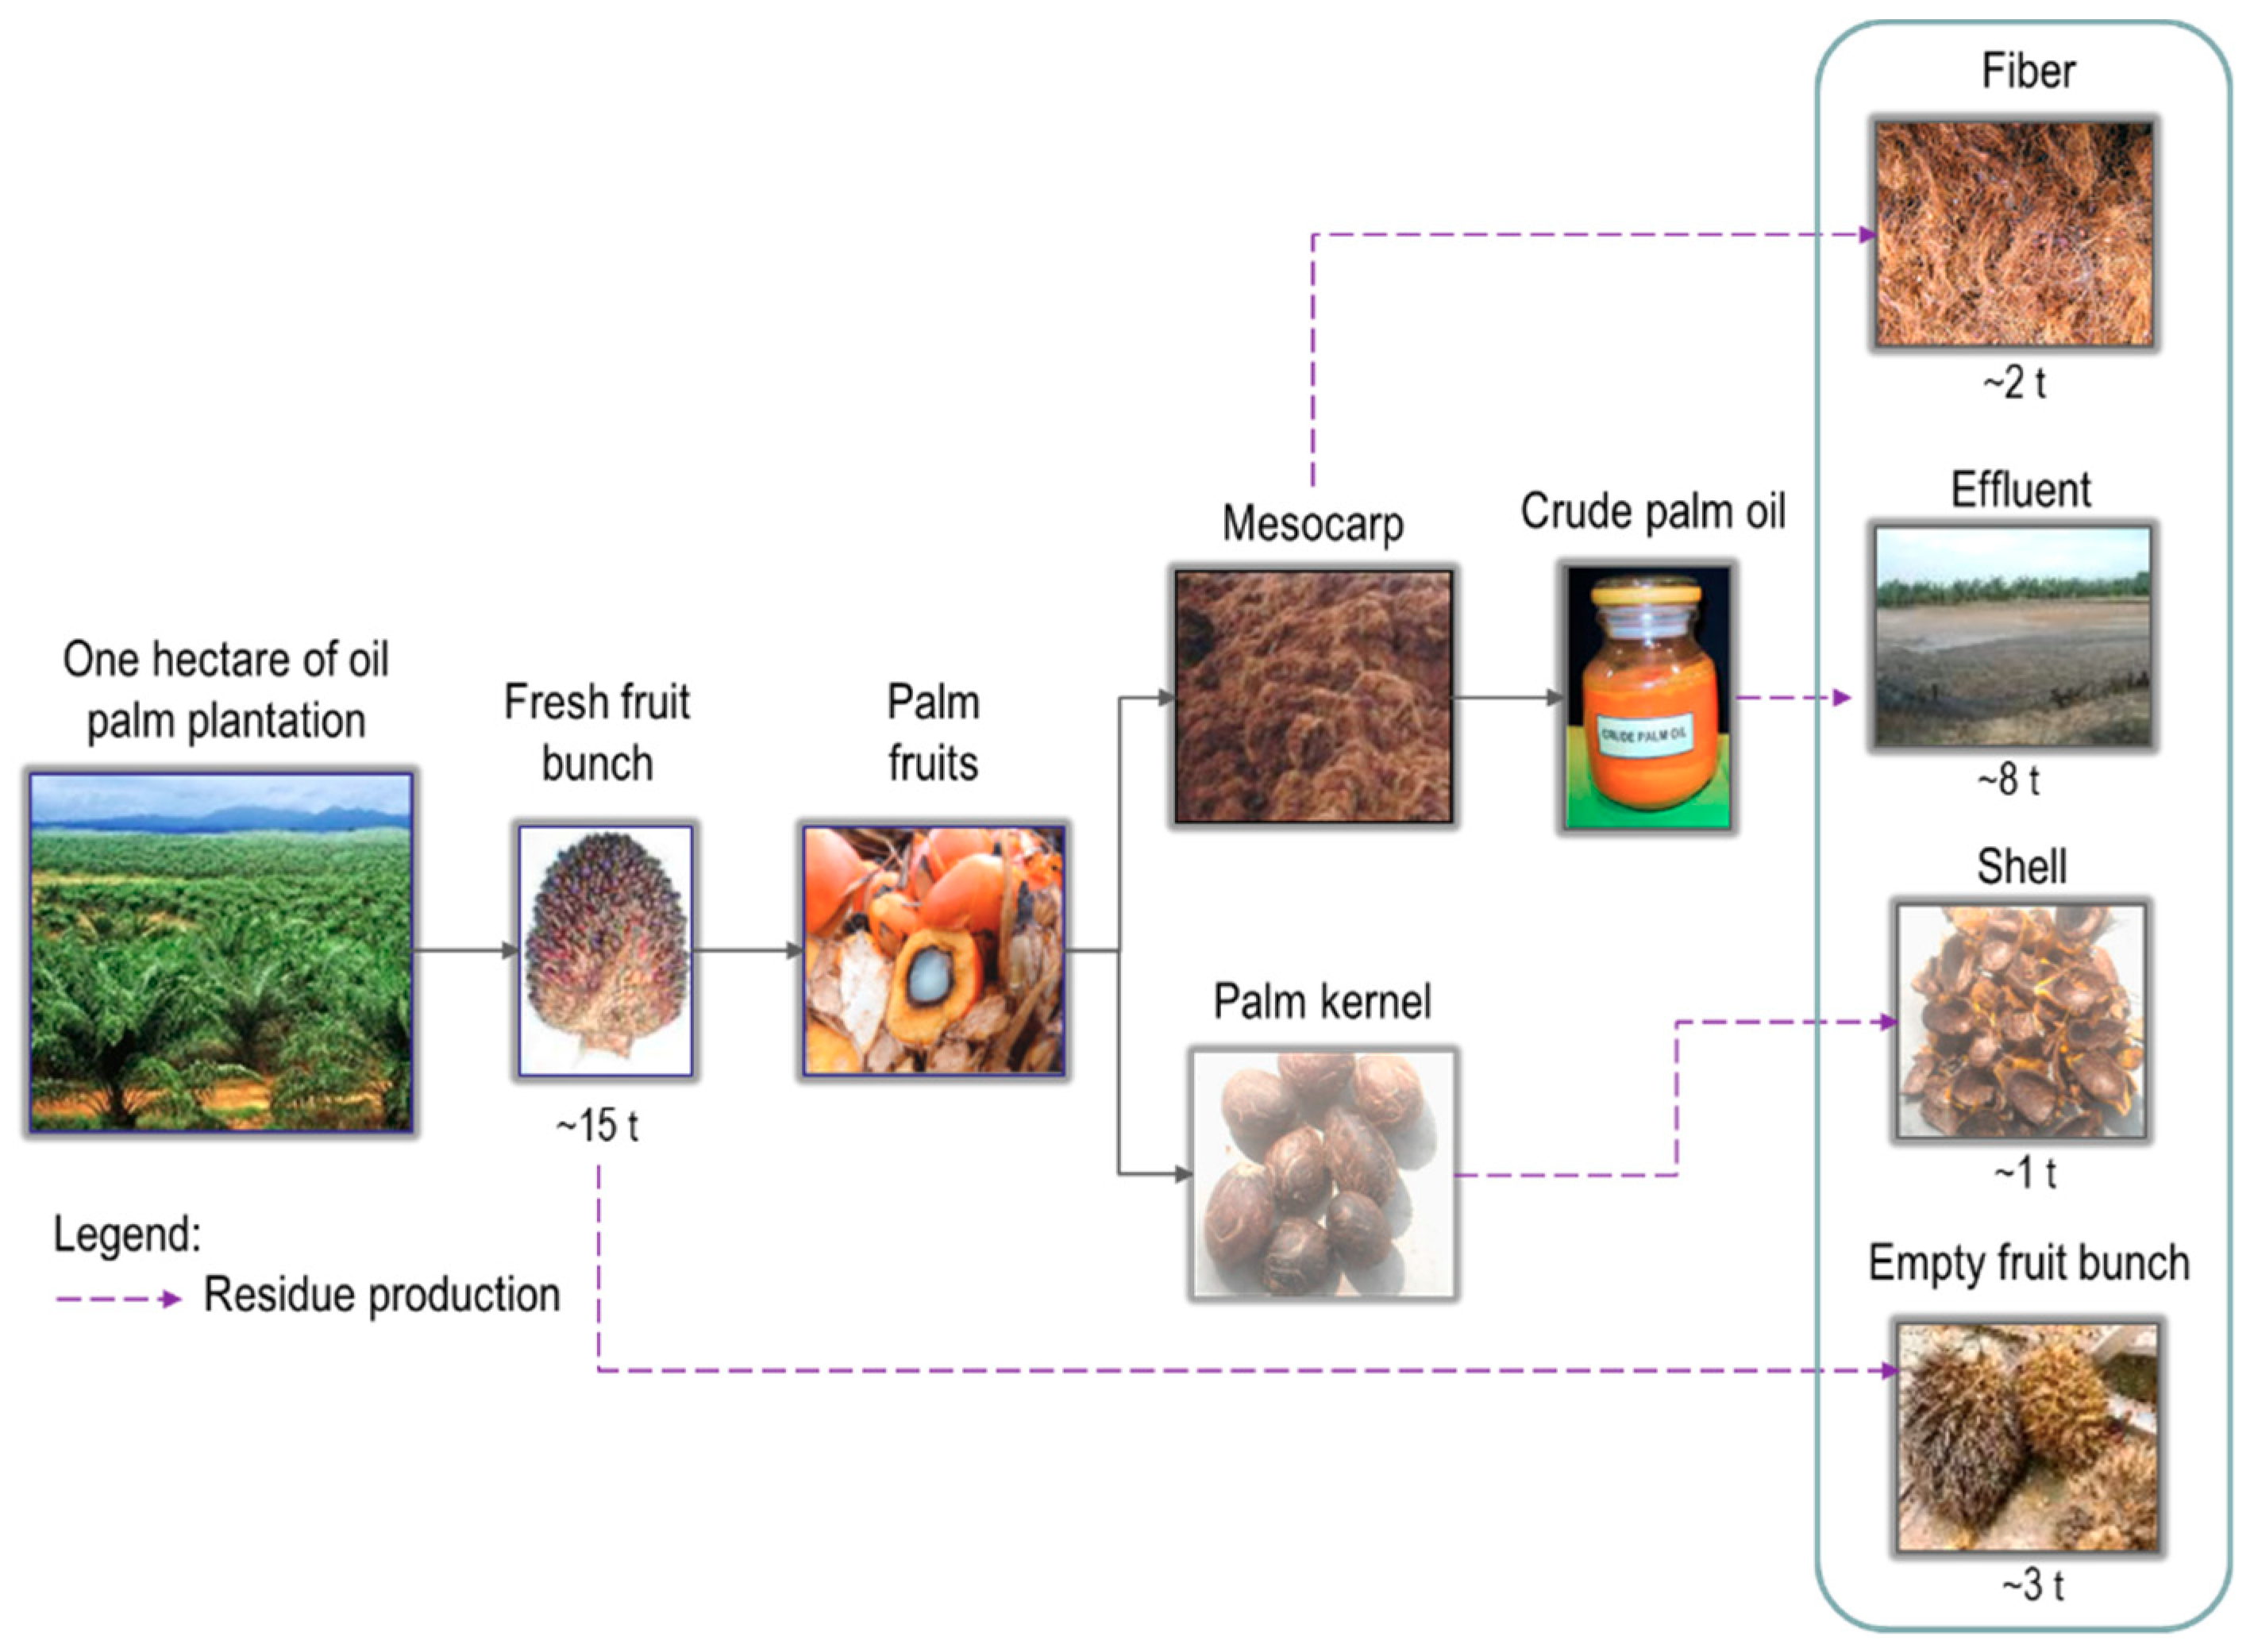
Oil palm is the largest biomass source in Indonesia. The country housed 11 million hectares (Mha) of oil palm plantations and produced 31 million tons (Mt) of crude palm oil (CPO) in 2015 [1]. Oil extraction from palm fruits occurs in palm oil mills. One ton (t) of CPO production results in nearly 5 t of solid biomass waste, including empty fruit bunches (EFB), palm kernel shells (PKS), palm mesocarp fibers (PMF), and palm oil mill effluent (POME), see Figure 1. This implies that, in 2015, Indonesia produced around 155 Mt of palm biomass residue. These residues are the source of significant greenhouse gas (GHG) emissions due to biomass decomposition and, at the same time, result in lost opportunities in terms of economic gains from bio-based products (e.g., fuel for steam boilers, organic fertilizer, or further processed into value-added products, such as briquettes and pellets) [2,3].
The Indonesian government has introduced several policy measures to promote the treatment of palm biomass residues as specified in the Indonesian Sustainable Palm Oil or ISPO statute (Regulation 11/2015). This includes methane capture from POME, power generation from solid biomass, and biofertilizer production from POME and EFB. However, the implementation of these policies has evolved slowly [4]. The Indonesian government has also set a national target of 23% renewable energy generation by 2025, which includes 5500 MWe installed capacity of bioenergy-based plants [5]. This will ultimately help to reduce GHG emissions by 29% by 2030 compared to 2010 levels. Harnessing the full potential of palm biomass residue could contribute to meeting the national targets for renewable energy and emissions reduction, as well as to creating new jobs.
This study examines the utilization of oil palm biomass residues in Indonesia. A cost–benefit analysis was performed to identify optimal ways to fully utilize residues along the palm oil supply chain. We consider the production of the main product (i.e., CPO), byproduct (i.e., palm kernel or PK), as well as the utilization of the palm biomass residues (EFB, PKS, PMF, and POME) for bioenergy and biofertilizer using efficient biomass conversion technologies. We use mathematical modeling through the implementation of mixed integer linear programming (MILP), that has been used in various previous studies of the biomass supply chain [6,7,8,9]. Our reference scenario considers the current policy measures as described above. The scenario includes improvements from the conventional palm oil mill as described by Harahap et al. [10]. We investigate other scenarios with enhanced small-scale plantation yields (Sc-yield) and improved grid connectivity (Sc-grid), as well as with a combination of these measures (Sc-yield-grid) to evaluate the economic and environmental impacts that can be obtained along the palm oil supply chain. The geographical focus of the study is Sumatra Island in Indonesia, which has a total land area of 473,481 km2. Sumatra accounts for more than 60% of the oil palm plantations and palm oil mills, and close to 70% of total palm oil production in Indonesia [1].
Supply chain optimization considers process engineering to systematically synthesize, design, and analyze biomass processing for multiple purposes [11,12]. A typical biomass supply chain is comprised of biomass harvesting and collection, pretreatment, storage, transport, and biomass conversion to bio-based products [13,14]. Atashbar et al. [15] emphasize that, although the biomass supply chain has been studied extensively, few papers consider the optimization of the whole supply chain. Many studies have been conducted on single parts or a few parts of the logistic system. In addition, very few papers consider the full biomass potential of a single plant. An optimization study is justified in light of the complexity of the palm oil supply chain.
While a large number of studies modeled regions in Malaysia, the world’s second largest palm oil producer after Indonesia, only a few have discussed the case of Indonesia. Some studies that analyzed the Malaysian case are worth mentioning. Chiew et al. [16] carried out various scenarios to identify the optimal location of combined heat and power (CHP) plants for treating EFB, aiming at maximizing regional profit. The optimization model took into account biomass availability, transport distances, and the scale and location of CHP plants within the state of Selangor. Also, Foo [6] described the regional bioenergy supply chain for utilizing EFB, minimizing transportation costs to CHP plants for the case of Sabah state in Malaysia. Idris et al. [9] assessed the utilization of EFB, fronds, and trunks for co-firing, using spatial optimization to identify the technology cost. The regional bioenergy supply chain under carbon pricing and trading policies was discussed by Memari et al. [8] to evaluate the impact of using EFB in a CHP plant. Lam et al. [7] and Theo et al. [17] evaluated complex supply chain network designs, considering both the full biomass potential in a single plant and accounting for multiple palm oil mills in Malaysia. Lam et al. [7] proposed a strategy to integrate the solid biomass residues with industrial waste motor oil for fossil fuel substitution, while Theo et al. [17] focused on the utilization of POME and its distribution pathways.
The case of palm biomass supply chain performance in Indonesia was studied by Hadiguna et al. [18]. The supply chain optimization and risk assessment were included in the framework proposed to manage the palm oil supply chain more effectively. The study boundary encompassed the plantation, processing plant, and CPO production up to CPO distribution to the end customer. However, the study focused on operational performance in a single location, and excluded the potential utilization of biomass residues and multiple bio-based products, as well as the upgrading of biomass conversion technologies.
Our work unravels the biomass potential of the mills located in Sumatra Island, and this includes CPO, PK, and residues (i.e., EFB, PKS, PMF, and POME), as well as the biomass supply chain from feedstock collection, biomass processing, bio-products generation, and distribution. As far as we are aware, this study is the first attempt to model the palm oil supply chain in a geographically explicit way on Indonesia’s Sumatra Island while considering the regional infrastructures. All datasets were developed for the simulation and had not previously been used in other studies. Our work contributes to the existing literature of the spatial optimization of the palm oil supply chain in Indonesia where half of all global CPO production takes place. Thus, the optimization of the palm oil industry in this region may have both national and global impacts.
2. Framework for Analyzing the Palm Biomass Supply Chain
Utilizing palm biomass residues to produce value-added products can bring additional income to a palm oil mill [4]. In this paper, we use the spatially explicit BeWhere model developed at the International Institute for Applied Systems Analysis (IIASA) to optimize the utilization of biomass residue in one palm oil mill, and clustered mills in Sumatra [19]. Leduc [20] and Wetterlund [21] described the core of the BeWhere model. BeWhere is developed in the commercial software GAMS [22], uses a CPLEX solver, and the studied problem is expressed via mixed integer linear programming (MILP). The model is schematically represented with nodes and arcs. Each arc associates to a continuous variable. MILP allows the modeling of discrete (binary) variables. In this study, the binary variables are associated to the plant nodes to select the lowest cost technology for electricity production. The model chooses the optimal pathways from one set of biomass supply points to a specific plant and, further, to a set of demand points [20]. BeWhere has been used for bioenergy policy evaluation in Europe and elsewhere (e.g., the United States, Brazil, Malaysia, and Vietnam) [23].
BeWhere applications in bioenergy are found in various studies. The integration of biomass with the existing steel industry in Europe, for instance, was studied by Mandova et al. [24]. Natarajan et al. [25] developed the BeWhere model to investigate optimal locations for biodiesel production plants in Finland, and Khatiwada et al. [26] applied the model to optimize ethanol and electricity production in sugarcane biorefineries in Brazil. The case for biogas for transport in Italy was discussed by Patrizio et al. [27], while the optimal biomethane (from palm oil mill effluent) injection into the natural gas grid in Malaysia was investigated by Hoo et al. [28]. Other studies using the BeWhere model can be found in Leduc et al. [23]. For the purpose of the present paper, the model was adjusted with a new algorithm and coding to study the specific case of oil palm in Indonesia.
2.1. BeWhere Model for the Oil Palm Supply Chain
This study defines the objective function to maximize overall profit by minimizing the total cost along the product(s) supply chain. This is formulated as follows:
where TotProfit is the total profit obtained from the system, TotIncome is the total revenues generated from selling bio-products, TotCost is the supply chain cost, and TotEnvCost is the cost of environmental impacts in the studied system.
There are many environmental impacts to consider. TotEmissions is the supply chain emissions, CarbonTax is the cost of GHG emissions, TotPeatPltArea is oil palm plantations on peat land affected by peat fires, and EcoLossPeatFire represents economic losses due to peat fires. TotPltArea is the area covered by oil palm plantations, WaterLoss is the amount of water lost for every one ha of oil palm plantation developed, WaterPrice is the price for water, and BiodiversityLoss is biodiversity losses from oil palm plantation development.
The profit is maximized by considering product sales, feedstock production costs, feedstock transportation costs from supply points to mills, the investment and production costs of bio-products, and electricity transmission line costs. The supply chain emissions include emissions from feedstock production, transport emissions, emissions from plant operations, and emissions from biomass processing. The cost of GHG emissions is internalized in the model (i.e., in the form of CO2eq tax). The external cost of biodiversity losses, water supply disruption, and peat fires were quantified based on the affected areas multiplied by factors for monetizing the impacts. Further details on this are available in Section 2.2.6.
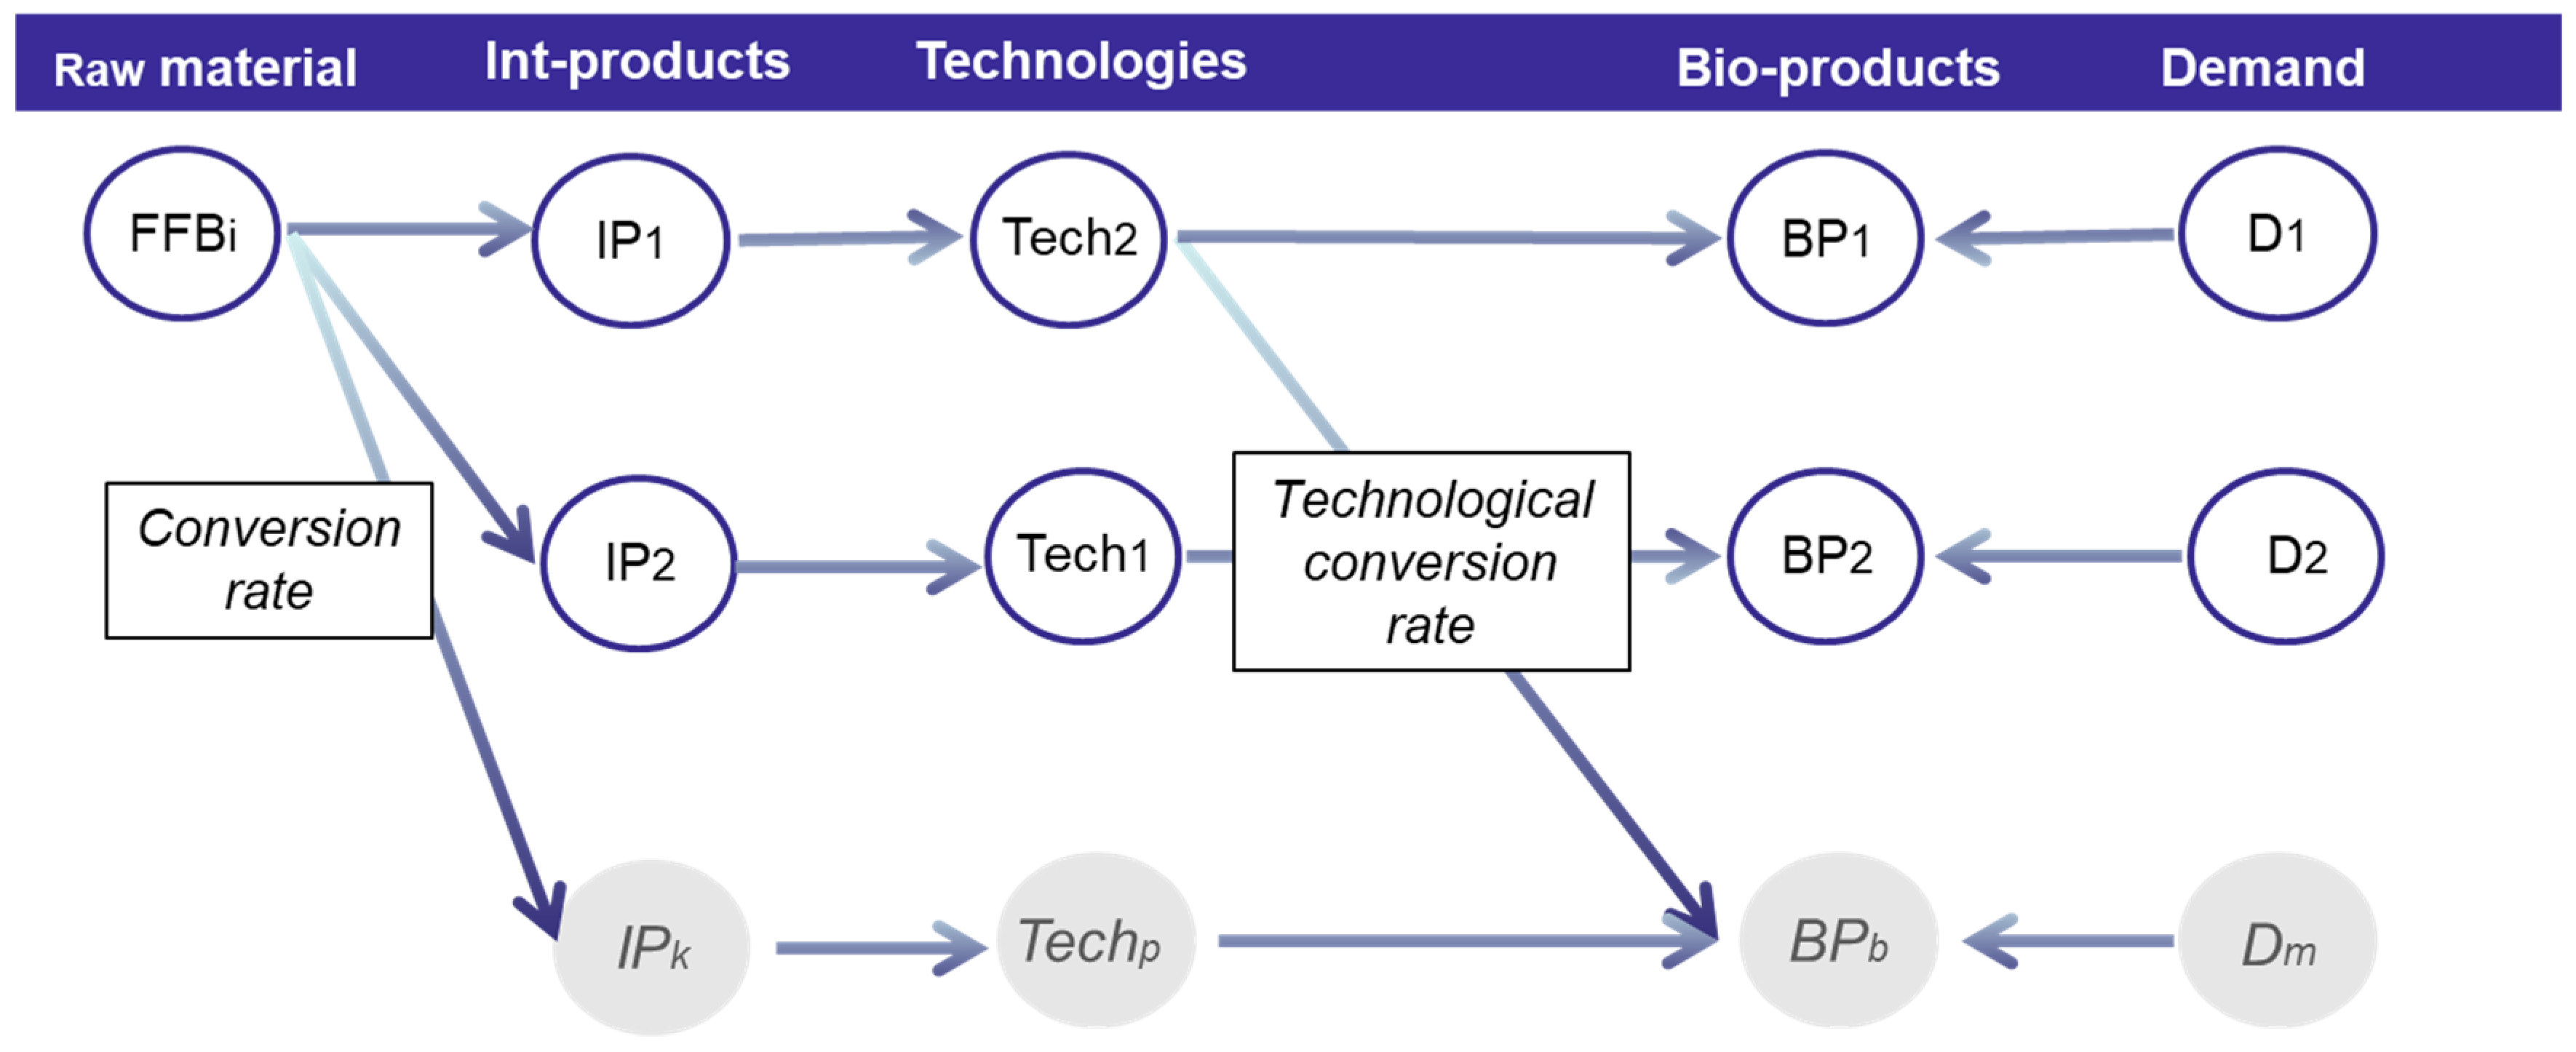
The model structure for this regional case (i.e., multiple supply sides and palm oil mills) and multiple residue utilization pathways is illustrated in Figure 2, which depicts the BeWhere model structure for palm oil in Indonesia. The analysis was performed for a period of one year (base year of 2015). This study examines a supply chain optimization problem that consists of fresh fruit bunches (FFB) that originate from small-scale and large-scale plantations (i.e., government and private companies). FFBs are transported from plantations to palm oil mills by truck and using the existing road network. In the palm oil mill, FFB is processed to generate various intermediate products, which were quantified using the conversion rate. The intermediate products encompass CPO and PK, and residues from CPO production, that is, EFB, PKS, PMF, and POME. There are various conversion technologies in the mill for processing biomass into final bio-products, including both energy products (i.e., bioelectricity) and non-energy products (i.e., CPO, PK, PKS, PMF, EFB, and biofertilizer). The bio-products were estimated by multiplying the amount of intermediate products with the respective technological conversion rate. For intermediate products that do not require an upgrading process, and where input is similar to output, an artificial technology with efficiency equal to 1 was created to follow the model structure. We applied material balances from FFB to intermediate products, and from intermediate products to final bio-products.
The requirements for residue treatment (i.e., methane capture from POME, power generation from solid biomass, and biofertilizer production from EFB and POME), set by the Indonesian government, were taken into account. Low-efficiency CHP is the technology used to treat PKS and PMF, while high-efficiency CHP can also burn EFB. A preprocessing of the EFB is needed to reduce the moisture content before burning it in the boiler [29]. Alternatives considered for CHP plants consist of 1 MW low-efficiency CHP, and 4 MW and 9 MW high-efficiency CHP configurations. To reduce GHG emissions and increase bioelectricity generation, a 1 MW and 2 MW anaerobic digester biogas plant, that captures methane from POME, was incorporated in the model. The electricity produced is used for FFB processing in the mill, and excess electricity is fed into the electricity grid. Co-composting of the EFB and the POME was introduced in the model for the production of biofertilizer. The optimization model chose the most optimal biomass and biogas combustion system for each mill. Due to a variety of technical restrictions associated with the utilization of residue and upgrading to bio-products, relationships had to be defined within the BeWhere model. Details of the possible combinations of intermediate products, technologies, and bio-products are available in the Supplementary Material (Figure S1).
2.2. Input Data
This section describes the parameter input for the model comprising spatial data, technical data, investment costs and commodity prices, and emissions. All data are for 2015. All costs and prices were adjusted for inflation corresponding to 2015 prices and using the Indonesian GDP deflator [30].
2.2.1. Feedstock Production and Availability
A 25 km × 25 km grid size was chosen to match the resolution of a previous work on forest fires in Indonesia [31], the results of which we intend to merge with the results of this work to serve as input for a harmonized risk assessment study in the future. The grid size gives a total amount of 656 grid points in Sumatra Island, which is a relevant number for the model to be resolved in a reasonable amount of time without losing accuracy in the results. The availability of feedstock (i.e., FFB) represented at grid level was derived from the district statistical data obtained from the Indonesian Ministry of Agriculture (MoA) [1]. Notice that the statistical data do not provide geographical information on the plantation. Still, at the time of writing, this was the best dataset available to perform the regional analysis. The spatial data from the Ministry was not publicly available, and plantation maps were provided by Global Forest Watch (GFW) [32], which only included the concession area allocated by the government for large-scale oil palm plantations, as opposed to the actual area planted. In addition, the latter excludes the small-scale plantations.
The availability of FFB was calculated based on the total plantation area and the average plantation yield per district. Thus, each grid point contains information about the raw material available from small-scale and large-scale plantations, the plantation area, and the average yield. The physical characteristics of small-scale and large-scale plantations considered in the analysis are listed in Table 1. The spatial representation of FFB availability can be found in the Supplementary Material (Figure S2).
2.2.2. Processing FFB in Palm Oil Mills
The FFB are transported from the plantation area to the palm oil processing plant (palm oil mills). Processing FFB in palm oil mills generates various products. Here, these products are defined as intermediate products, consisting of the main product (i.e., CPO), the byproduct (i.e., PK), and biomass residues (PKS, PMF, EFB, and POME). The quantity of each intermediate product was derived using conversion rates, which are available in the Supplementary Material (Table S1).
According to the MoA, there were 636 mills across Indonesia in 2015, of which, 415 were located in Sumatra. This number of mills is not consistent with the GFW database [32,36], according to which there were 410 mills in Indonesia and 339 in Sumatra in 2015. In fact, Indonesia does not have any official database of palm oil mills specifying their geographical locations and processing capacity (mill data is at district level, and not fully compiled at the national level). We used various sources from the MoA, ISPO, the Roundtable on Sustainable Palm Oil (RSPO), and a database of palm oil suppliers, to compile a database of mills in Sumatra. For the purpose of our analysis, we considered 415 mills in Sumatra, which is in line with the numbers provided by the MoA and Hambali et al. [37]. The geographic location of palm oil mills and the annual FFB processed is provided in the Supplementary Material (Figure S3). All mills are assumed to operate for 4800 h per year (h/y). Previous studies used operating hours ranging between 3600 [28] and 6000 h/y [7]. In reality, every mill has different operating hours. This assumption causes a 16% discrepancy between the total CPO production considered in this study (i.e., 18 MtCPO/y) and the MoA’s national statistic [1] (i.e., 22 MtCPO). This also means that our study does not overestimate the added value generated from the industry.
A mill requires 22 kWhel/tFFB and 500 kgsteam/tFFB for operation [4]. The mill costs consist of annualized capital costs and operation and maintenance (O&M) costs (5% of annual capital cost [38], equal to 1.96 USD/tFFB). The annuity factor was 8.45% using an interest rate of 6.83% [30] and a project lifetime of 25 years.
2.2.3. Palm Oil Biomass Utilization and Biomass Conversion Technologies
Our assessment considers a strategic level of decision-making that involves the selection of biomass conversion technologies. Technology selection plays a key role in the biomass supply chain, as it influences the choice of biomass, capital, and operational costs of the supply chain and related environmental impacts [39]. In this study, the equipment of the new technology is installed in the existing facility, assuming the availability of land.
CHP plants (low- and high-efficiency systems), biogas plants with a covered lagoon, and co-composting are the biomass technologies considered in this study. The technologies were chosen in line with the government policy promoting the utilization of palm biomass residues, as specified in ISPO Regulation 11/2015. The CHP system consists of steam boilers, back pressure turbines, and electrical networks. The biogas plant consists of biodigester (i.e., continuous stirred tank reactor), scrubber, gas engine, boiler, and flare. In this study, we predefined the installed capacity for the CHP and biogas systems, since only systems below 10 MW are considered for special tariffs from the government (Regulation 12/2017). The low-efficiency CHP system has 1 MW capacity, which only meets the energy demand of the palm oil mill. Alternatively, in places with higher demand, high-efficiency CHP with 4 MW or 9 MW capacity are considered. The biogas system has 1 MW or 2 MW installed capacity, which are typical capacity sizes for some mills in Indonesia [40]. Excess electricity is fed into the national grid.
The technological conversion rate was used to quantify the amount of bio-products generated from treating the residue using a specific technology. The cost of technology consisted of O&M costs and annualized capital costs. Similar to the palm oil mill, an annuity factor of 8.45% was used.
Notice that the production of electricity is driven by electricity demand at the mill and in the district. A palm oil mill requires 22 kWhel/tFFB [4]. Sumatra’s electricity demand is 34 TWh/y, as further described in Section 2.2.5. The production of other bio-based products is influenced by their market values. The residues that are not treated at the mill site are sold to the market at a specific price. Indonesia has been exporting PKS to Japan to be used as feedstock for biomass power plants [41].
Details about the technological conversion rates, the technology costs, and the prices of bio-products considered in this study are provided in the Supplementary Material (Tables S2–S4).
2.2.4. FFB Transport to Palm Oil Mills
The prompt transport of FFB to mills is crucial to maintain the quality of palm oil with a low level of free fatty acids and other impurities, and to allow high oil extraction [42]. Fatty acids can quickly build up, which means that FFB must be processed within 24 h of harvest [36]. Transporting FFB can take from 30 min to more than three hours. Hence, we restricted the travel time from the plantation side to the mill to four hours [43]. The average truck speed is 50 km/h. The network analysis performed using ArcGIS software identified 272,241 possible route combinations from plantation to mill. The restriction of travel time reduced the possible routes to 26,590. The original data on the road network were obtained from DIVA-GIS [44], which was modified to improve resolution prior to running the network analysis using the ArcGIS software. Information about Sumatra’s road network is available in the Supplementary Material (Figure S4). The transport cost considered the variable cost (0.2 USD/tFFB/km), and fixed cost (0.5 USD/tFFB) [7], as well as the return trip.
2.2.5. District Electricity Demand and Transmission Lines
In this work, electricity was delivered to high voltage transmission lines, that is, 150, 275, and 500 kV. The location of the distribution transformers is detailed in the Supplementary Material (Figure S5). For modeling purposes, each distribution transformer contains information on aggregated district electricity demand as presented in the Supplementary Material (Figure S6). Electricity demand was calculated by district population in 2015 [45] and average electricity consumption per capita in Indonesia (812 kWh/y [46]). The transmission cost considered the amount of excess electricity, the annualized capital cost of transmission lines (58 USD/MW/km/y), the distance from the mill to the nearest power grid, and the annualized capital cost for connection (17.5 USD/MW/y) [47]. The annuity factor is 0.06, assuming a 40-year life span and a 5% interest rate.
2.2.6. Environmental Impacts
The palm oil industry generates significant positive economic and social impacts (e.g., job creation) for the region. However, the expansion of palm oil plantations has also led to non-sustainable land use practices in past years, particularly deforestation [48]. Thus, the negative environmental impacts from supply chain emissions, haze and peat fires, water supply disruption, and biodiversity losses were quantified in the analysis.
Supply chain emissions account for direct GHG emissions associated with emissions from feedstock production, transport emissions, emissions from plant operations, and emissions from biomass processing. The emissions factors used in this study are summarized in the Supplementary Material (Table S5). Direct and indirect land use change effects are not in the scope of the analysis. The main GHGs considered in the biomass combustion system are carbon dioxide (CO2), methane (CH4), and nitrous oxide (N2O) [49], which are converted to CO2 equivalent (i.e., CO2eq) by using a global warming potential (GWP) of 1, 25, and 298, respectively [50]. Currently, Indonesia does not apply carbon taxes. Yet, the inclusion of a carbon tax to compensate for CO2 emissions could play an important role in substituting carbon-intensive fossil-based electricity in the future [26]. The carbon-pricing gap varies widely, both across countries and across sectors within countries. Mexico, Poland, and Ukraine, for example, adopted a carbon tax below 1 USD/tCO2eq, while Sweden imposed 139 USD/tCO2eq, the highest in the world [51]. In this study, we used a carbon tax of 25 USD/tCO2eq. In the optimization model, carbon tax is applied to the total GHG emissions.
The conversion factors for monetizing the other environmental impacts (i.e., emissions from peat fires, disruption in water supply and biodiversity losses) were taken from Agustira et al. [52]. The economic losses from peat fires were based on 41.73 USD/ha/year [52]. We estimate that 39,000 ha are affected [31]. The water supply disruptions were calculated by multiplying the total number of oil palm plantations with the amount of water lost for every one ha of oil palm plantation developed (500 m3/ha/year) and water price (0.402 USD/m3) [52]. The estimation of biodiversity losses took into account the total number of oil palm plantations and 30 USD/ha to represent biodiversity losses from oil palm plantation development [52].
The estimation of emissions reductions considers the substitution of products with higher fossil fuel consumption with bio-products, such as substituting electricity in the Sumatra grid (grid emission factor is 0.855 tCO2/MWh [53]) with biomass electricity, and replacing chemical fertilizers with biofertilizers. In one hectare of plantation, 1 tbiofertilizer replaces 0.25 tchemical-fertilizer, based on the ratio of nutrient values [54]. The methane avoidance from POME treatment was also included in the calculation of emissions reduction.
2.2.7. Model Assumptions and Limitations
Here, we summarize the key assumptions made. The estimation of FFB availability was based on the aggregated regional values from national statistics instead of on the actual planted area. The location of palm oil mills was fixed. The capacity of the mill in FFB processed per year assumes 4800 operating hours per year. The transportation of FFB from the supply site to the mill was limited to a maximum of four hours travel time to meet the 24 hour requirement from FFB harvesting until processing. The model selected the optimal routes to transport FFB to palm oil mills. The assessment was performed for one year (base year 2015), which means that the model optimizes the production of CPO and PK, as well as the utilization of biomass residue (PKS, PMF, EFB, and POME) for processing them into bio-products or selling them to the market. All bio-products were sold at the gate (mill) except bioelectricity, which was delivered to the distribution transformer via transmission lines. In the reference scenario, only palm oil mills that were located within 10 km of the distribution transformer could supply electricity to the grid. The study assumed that there was sufficient need for heat generated from the CHP plant for internal use in the mill.
3. Scenario Development
The base case or reference scenario (Sc-ref) in this study incorporated the official policy for utilizing biomass residue in Indonesia (i.e., methane capture from POME, power generation from solid biomass, and biofertilizer production from EFB). Depending on the parameter inputs and spatial location, the model selected the most cost-effective biomass conversion technologies for each mill. The alternative technologies and possible combinations of biomass input are presented in in the Supplementary Material (Figure S1).
Apart from the Sc-ref, we consider a scenario with higher yields in small-scale plantations (Sc-yield). Smallholder plantations are often associated with low yield due to poor agricultural practices, bad quality of seed, and insufficient fertilizer application [55]. Over decades, the yield of smallholder plantations in Indonesia has been improving. Several studies attribute this to cooperation between smallholders and companies [34]. The government views this as an opportunity to improve the livelihoods of farmers and is continuing with a program for improving smallholder yield, while also providing financial incentives channeled through the biodiesel fund program [2]. The Sc-yield scenario proposes an improvement of smallholder yields to levels similar to those found in large-scale plantations, that is, 18.82 tFFB/ha. Hence, there is an increase in the FFB availability in this scenario.
Harnessing the full potential of palm biomass for electricity generation requires sufficient grid connection infrastructure to deliver bioelectricity. The lack of electricity grid connections in palm oil mills has curtailed increases in bioelectricity production from palm biomass. We developed a scenario (Sc-grid) with enhanced grid connectivity that allows increased bioelectricity delivery. With this scenario, we evaluate the opportunities offered by palm biomass in terms of meeting national bioenergy targets, as well as the overall cost along the supply chain studied. To deliver excess electricity to external consumers, the Sc-ref scenario included mills located within a 10 km radius from the power grid. Sc-grid considers the connection of all mills (415) to the distribution transformers and, therefore, their increased access to biomass electricity. However, this was constrained by electricity demand at the district level. Notice that the model selected the nearest point from the mill.
Finally, the third scenario (Sc-yield-grid) was developed to assess the impact of both higher yields from small-scale plantations and improved grid electricity connection for the mills. Table 2 presents the different parameters of the scenarios analyzed.
Sensitivity Analysis
A sensitivity analysis was carried out to investigate the importance of different parameters, as well as their interactions on total cost and total profit. We performed a 2k factorial design of experiments in two levels, with all input factors also set at two levels. We evaluated the impact of five parameters as shown in Table 3. The 25 factorial designs resulted in 32 model runs. The analysis was carried out using R code following the steps described in [56] by first observing the response (i.e., total cost and total profit) for each factor using a box plot, identifying the significant effects with a theoretical model, and confirming the most significant effects using normal probability plots.
Previous studies used operating hours ranging between 3600 [28] and 6000 h/y [7]. The reference value of 4800 h/y was chosen, with 4000 h/y as the lower level and 4900 h/y as the upper level. Notice that the model is constrained by the availability of raw material, implying that there should be sufficient biomass for processing in the mill. The second parameter for sensitivity analysis is the FFB to CPO conversion rate or oil extraction rate. CPO is the main product of the industry, which means that the revenue generated is driven by production. Depending on the varieties of the oil palm (e.g., dura, tenera, psifera), the oil extraction rate is between 16% and 30% [55]. The reference value of the oil extraction rate is 0.2 tCPO/tFFB. Here, the upper value considered is 0.25 tCPO/tFFB or a 25% oil extraction rate, and the lower value is 0.18 tCPO/tFFB or an 18% oil extraction rate. The cost of raw material has been cited in some studies as the key parameter affecting the production cost of bio-based products (i.e., biofuels) [57,58,59]. We investigate the change in raw material production cost of large-scale plantations, since large-scale plantations account for more than half of the total FFB production in Indonesia. In this sensitivity test, the raw material production cost of small-scale plantations is not changed. We assume the upper level of the cost to be similar to the cost of small-scale plantations (98 USD/tFFB) and set the lower level of the cost at 65 USD/tFFB. Apart from the raw material cost, Petterson [60] and Solikhah [61] indicated that the cost for transporting feedstock is significant in relation to the total cost of feedstock. We assume a range of 50% from the reference value to present the upper and lower levels. The capital cost of biomass conversion technology is an important parameter that influences the decision of a mill to adopt the technology. A 1 MW CHP plant is the minimum improvement for a mill to utilize biomass for bioenergy production, which can then be consumed internally. A reference value of 23.65 USD/MWh was chosen with the lower and upper levels set at 17 USD/MWh and 30 USD/MWh, respectively.
The parameters used for the sensitivity analysis are presented in Table 3, together with their extreme values (−1 or low level and +1 or high level).
4. Results and Discussion
4.1. Technology Selection and Quantity of Bio-Products Generated
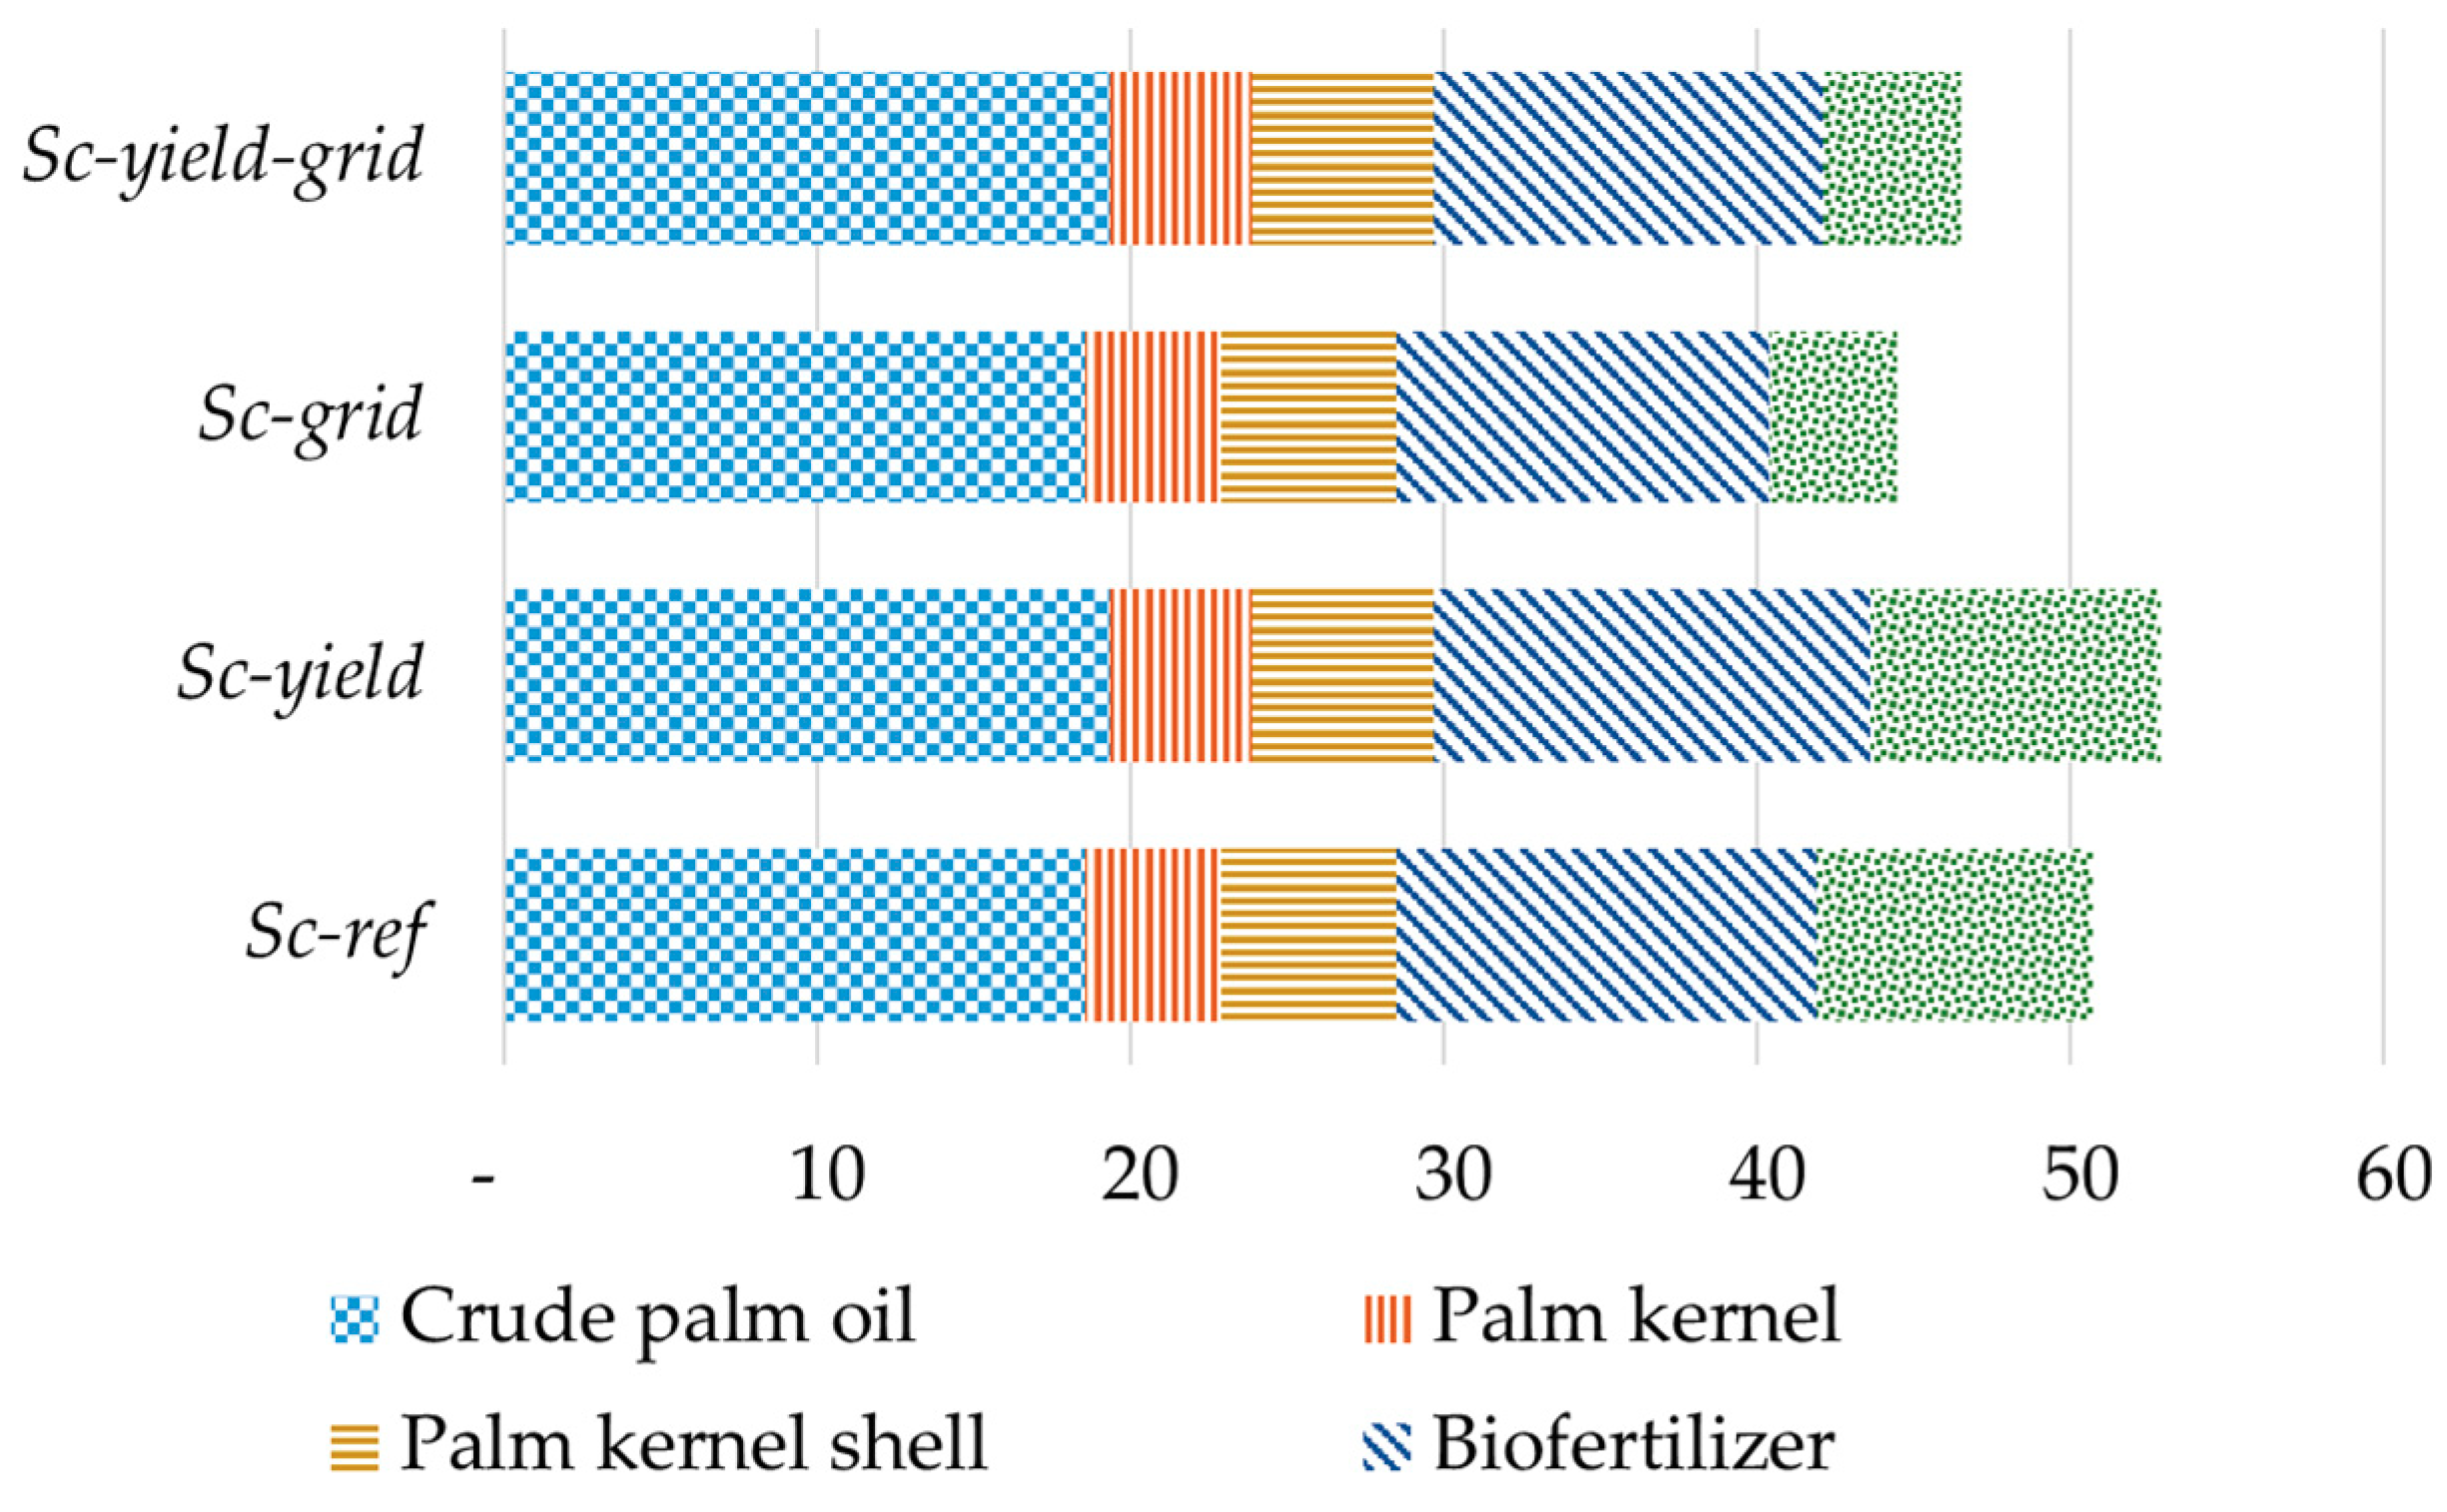
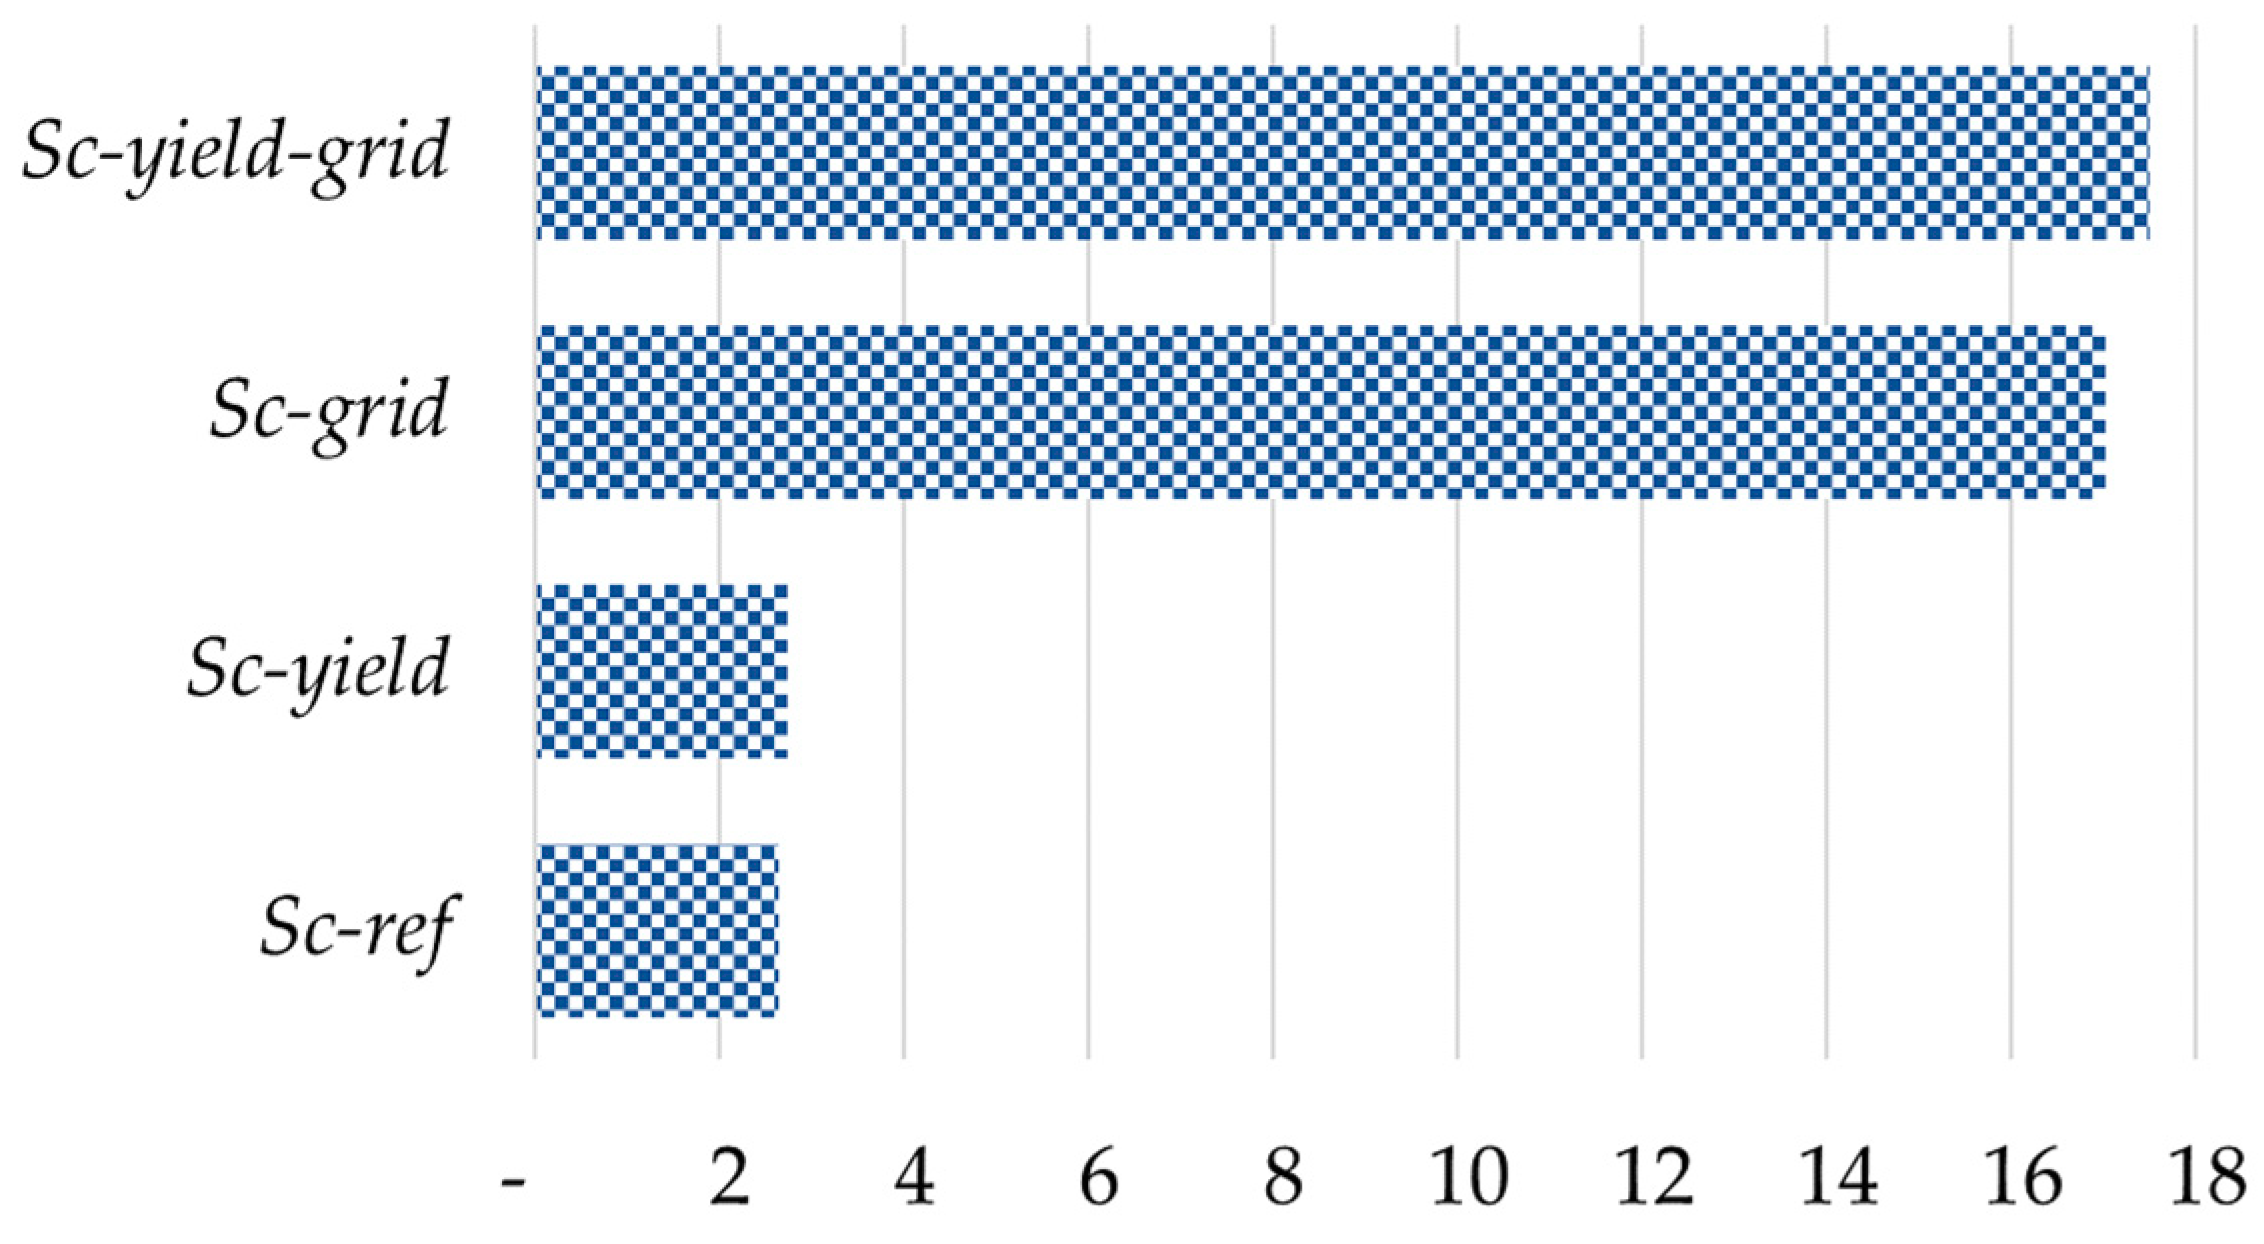
The model chooses the most cost-effective technology at each mill depending on the scenario setup. Figure 3 and Figure 4 present the total bio-products generated in all mills. For power production, PMF is the preferred feedstock for the CHP system, due to its high heating value compared to PKS and EFB. The results show that Sc-ref and Sc-grid provided 3 TWh/y and 17 TWh/y of excess electricity to the grid, respectively. Not surprisingly, when all mills are connected to the power grid (Sc-grid and Sc-yield-grid), there is higher potential to generate excess electricity. While Sc-ref has the potential to meet 8% of electricity demand in Sumatra, Sc-grid could cover up to 50% of the electricity demand on the island (i.e., 34 TWh/y). This is quite significant and means that oil palm biomass could play a major role in the development of electrification in Sumatra.
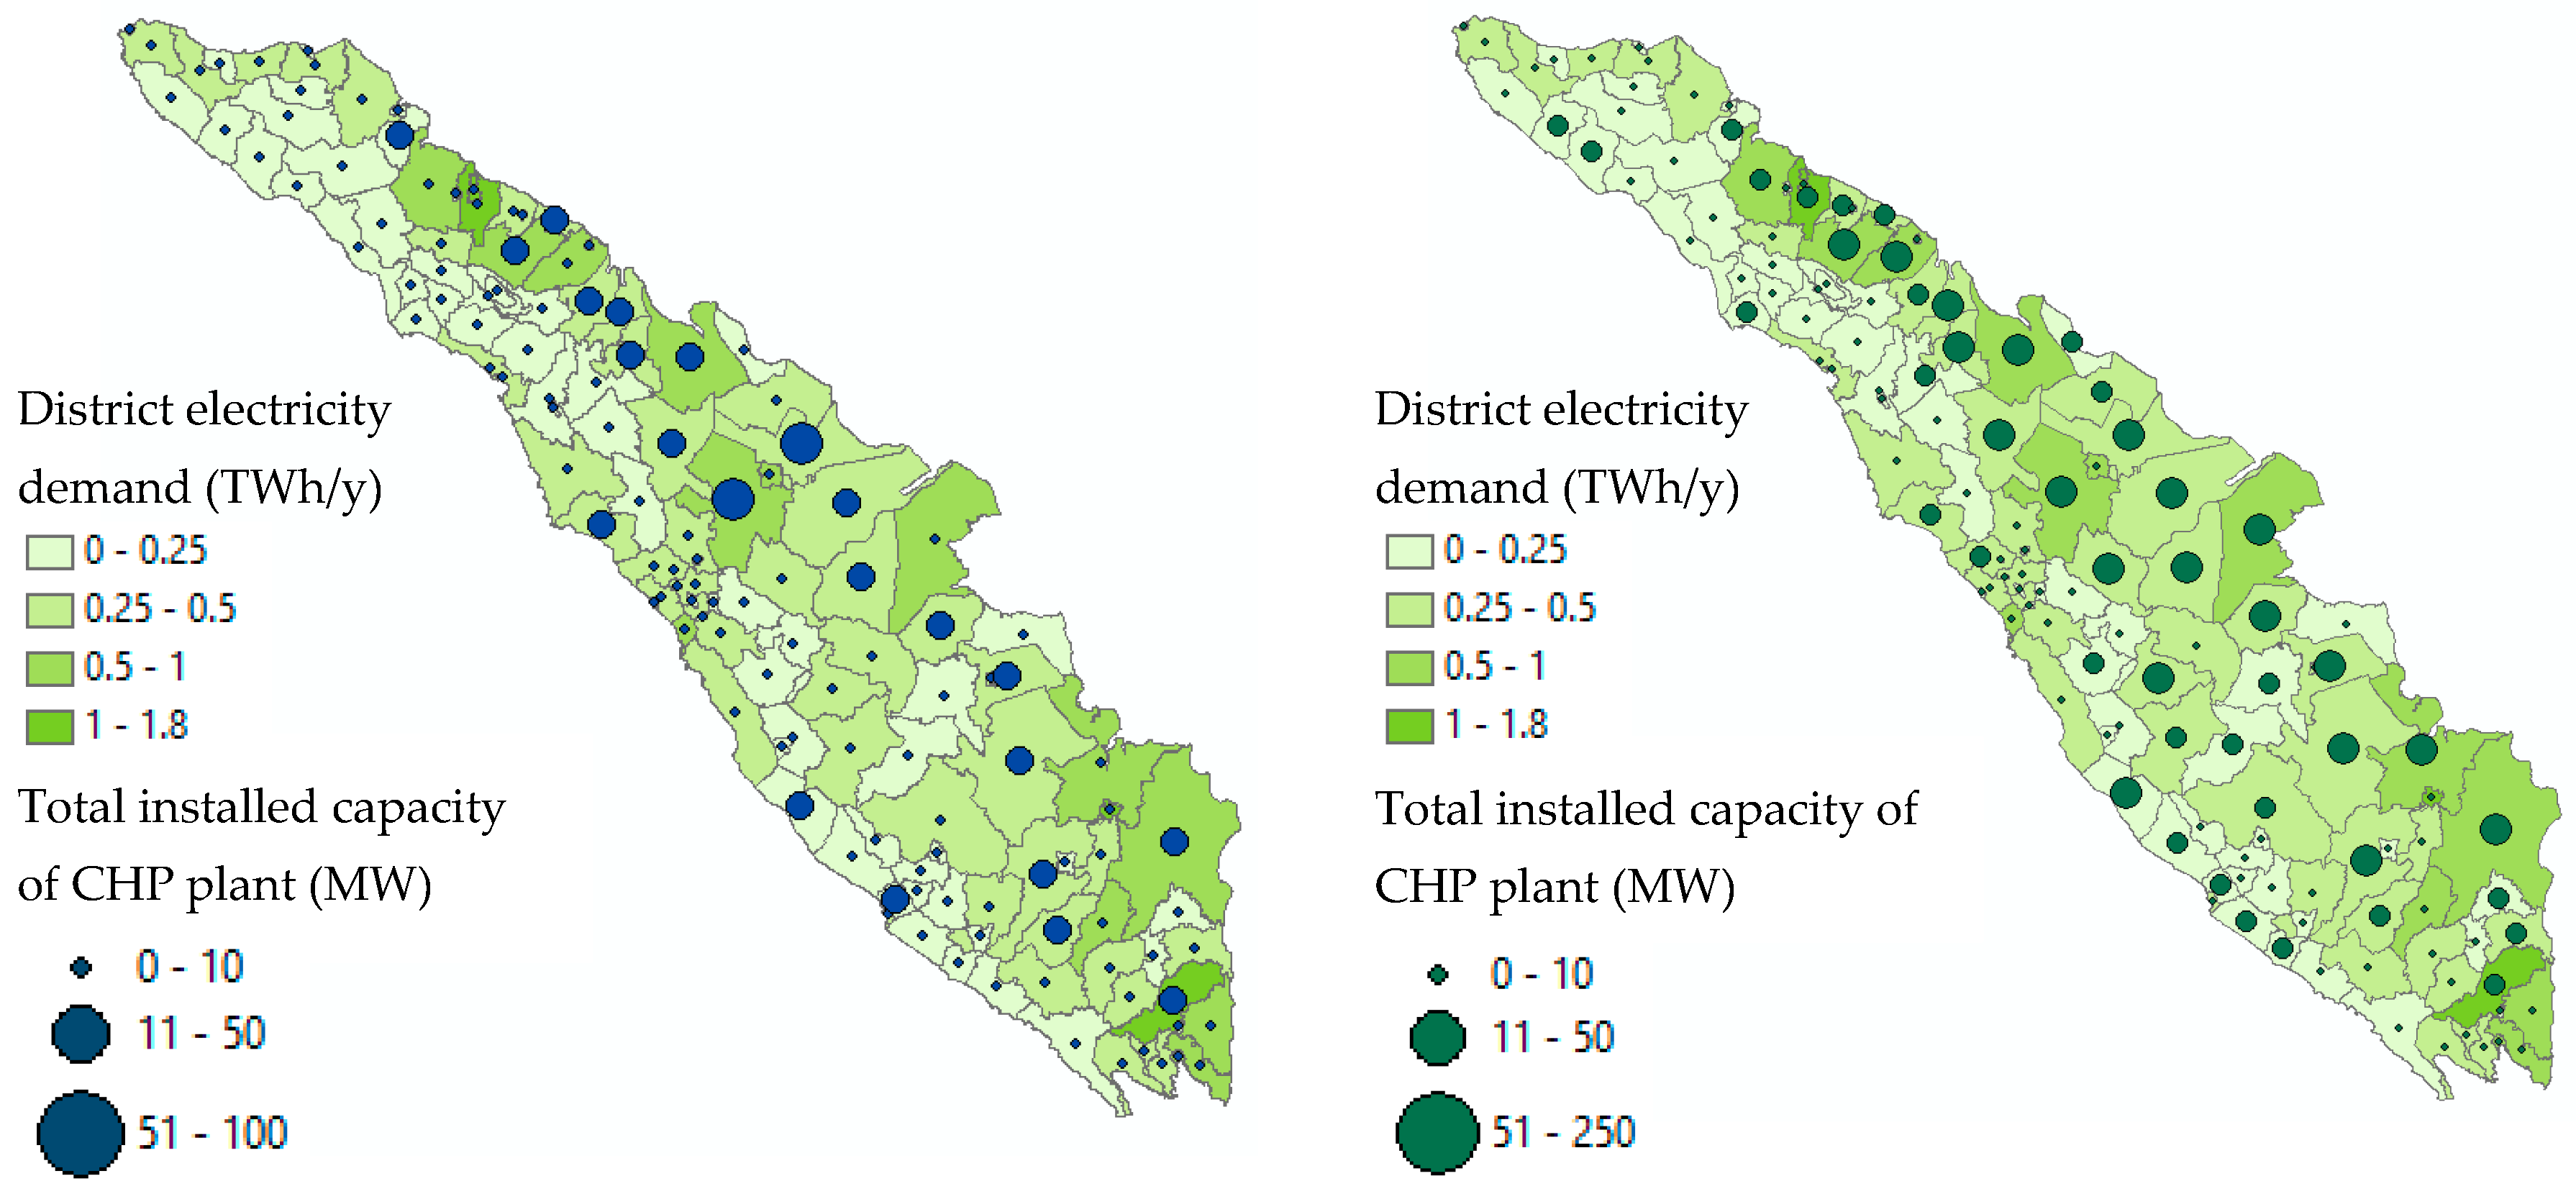
In terms of technology selection for electricity production, most mills in Sc-ref installed 1 MW low-efficiency CHP plants for treating PMF, generating just enough electricity to run the mill operations. Out of 415 mills, 345 chose a 1 MW CHP system, 30 mills upgraded to a 4 MW CHP system, and the remaining 40 mills upgraded to 9 MW CHP systems. In the Sc-yield-grid scenario, 129 mills upgraded to 4 MW and 266 upgraded to 9 MW high-efficiency CHP systems. Figure 5 provides a schematic representation of the total installed capacity of CHP systems in the districts of Sumatra.
The results demonstrate that Sc-ref has the potential to install a capacity equivalent to 670 MWe to use the palm biomass residues available, thus contributing to meeting 12% of the national bioenergy target (i.e., 5500 MWe [5]) and 38% of the target for Sumatra (i.e., 1755 MWe [5]) by 2025. Sc-ref requires 250 million USD/y in new investments for upgrading the biomass technologies and building transmission lines. About four-fold of installed capacity of bioenergy plants can be achieved in Sc-yield-grid—equivalent to 2800 MWe. This means that 50% of the national bioenergy target and more than 100% of the target for Sumatra can be met by 2025 if the full potential of palm biomass residues in Sumatra are harnessed. Investments in the order of 760 million USD/y (i.e., upgrading the equipment and transmission lines) are needed to implement this scenario.
Only 19 plants installed 1 MW biogas plants (anaerobic digester) to treat POME in Sc-ref, and none in Sc-grid and Sc-yield-grid. No mills installed a 2 MW biogas plant. This occurs due to the high capital cost of the technology. Economically, it is more attractive to produce biofertilizer than bioelectricity from POME. This suggests that a cluster model with POME collection from several palm oil mills can achieve economies of scale. The concept of industrial symbiosis can be explored to facilitate mills’ cooperation [62]. As described by Martin et al. [63], industrial symbiosis can improve regional sustainable development by enhancing the environmental performance of the industries and the socioeconomic status of the region. Such a model could be the way forward for making biogas plants economically more attractive.
4.2. Total Costs and Benefits
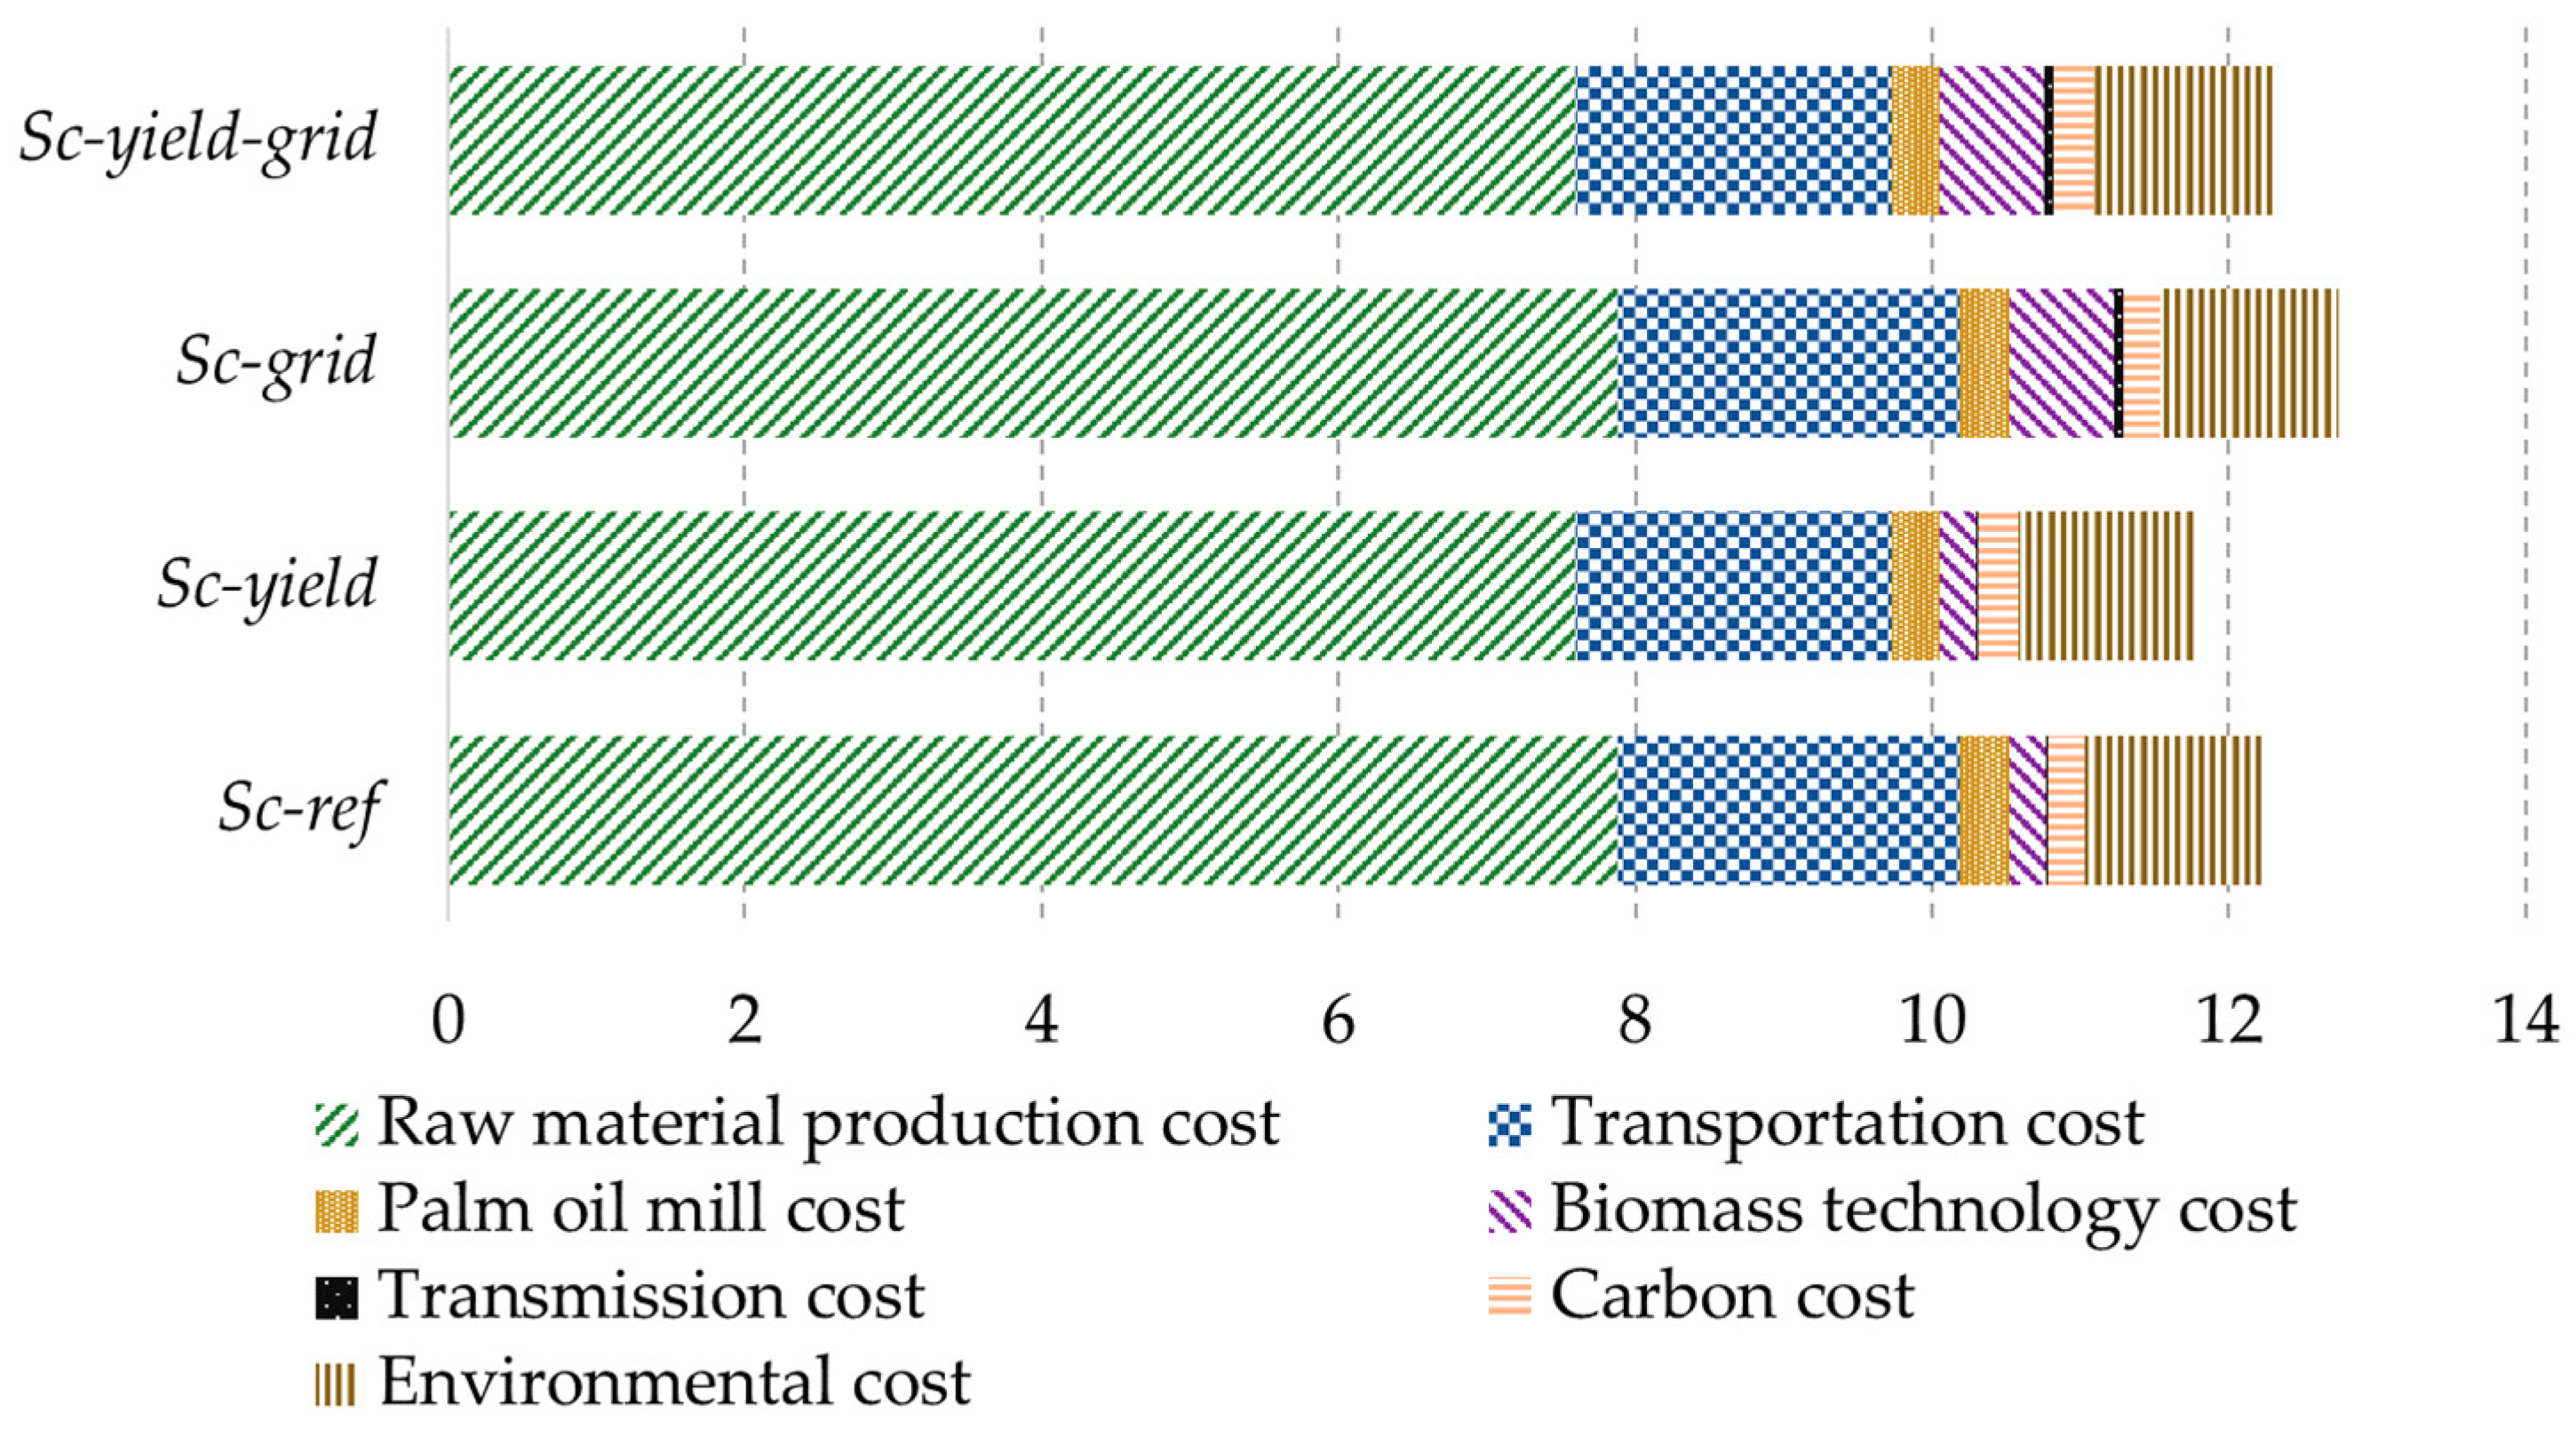
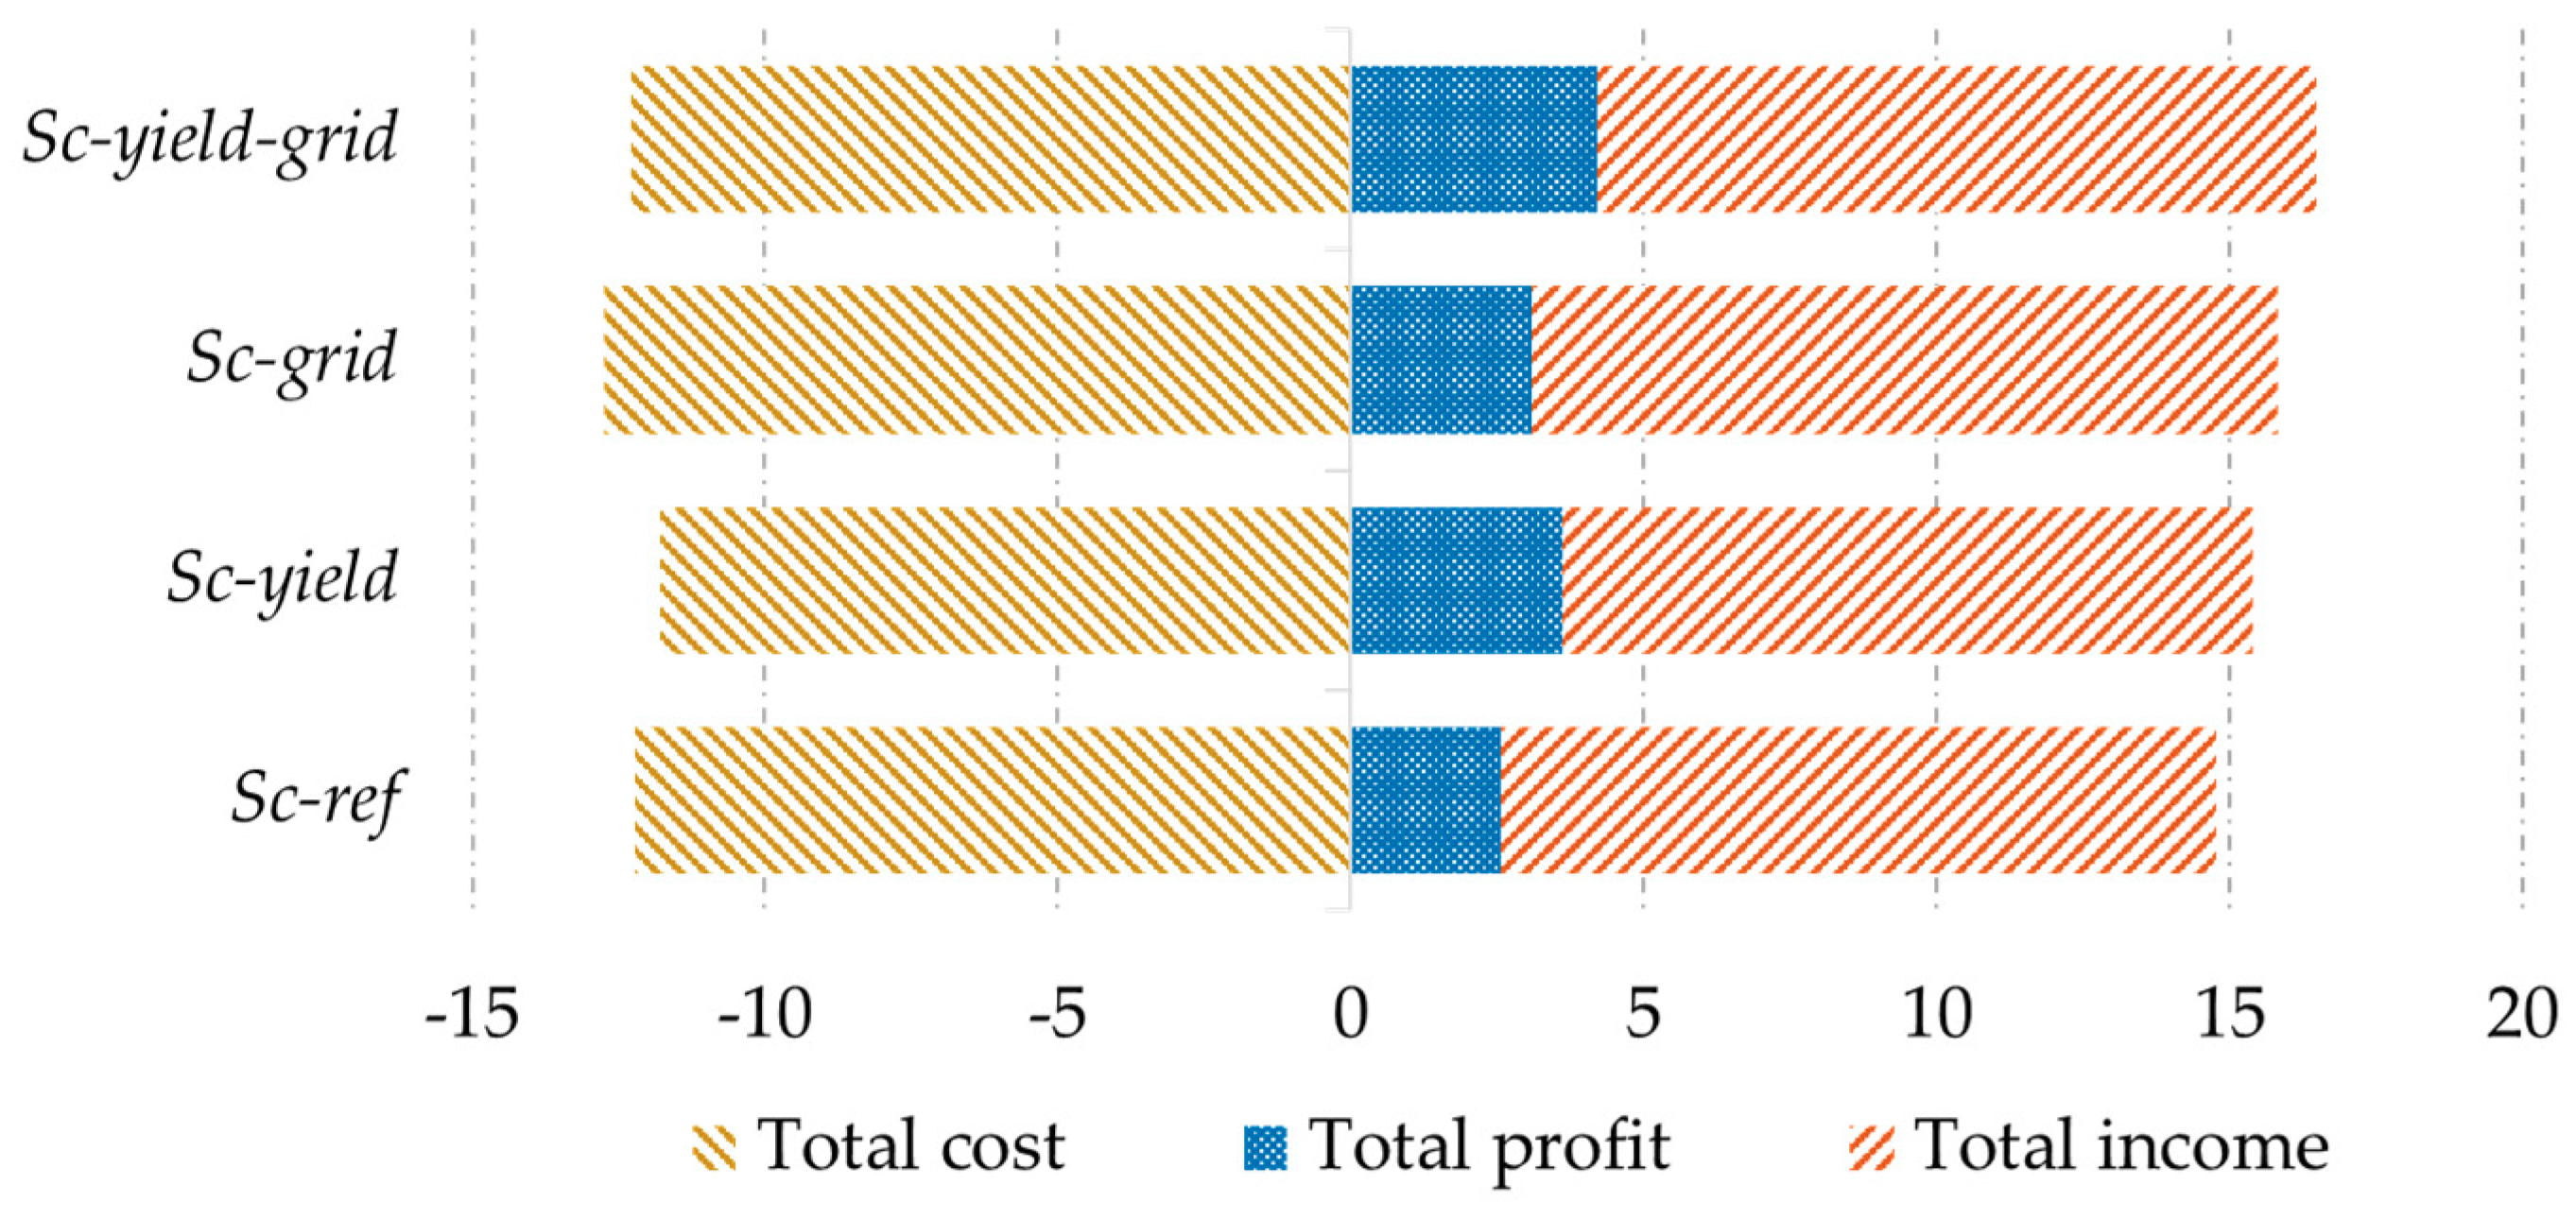
Figure 6 and Figure 7 show the costs, income, and profit from the palm oil industry in Sumatra. In all scenarios, the highest costs relate to FFB production and feedstock transportation to the mills. Sc-yield-grid shows the highest total cost of 12.3 billion USD/y but, at the same time, provides the highest profit for the palm oil industry (4 billion USD/y). Sc-ref and Sc-yield offer profits of 2.5 billion USD/y and 3.6 billion USD/y, respectively. However, Sc-yield-grid requires new investments of 760 million USD/y for upgrading the biomass technologies and building new transmission lines, whereas Sc-yield could achieve higher profits than Sc-ref with three times lower investment than Sc-yield-grid. This suggests priorities and cost-efficient measures to consider when planning an upgrading program, depending on resource availability for new investments.
4.3. Total Emissions, Emissions Reduction, and Technology Abatement Cost
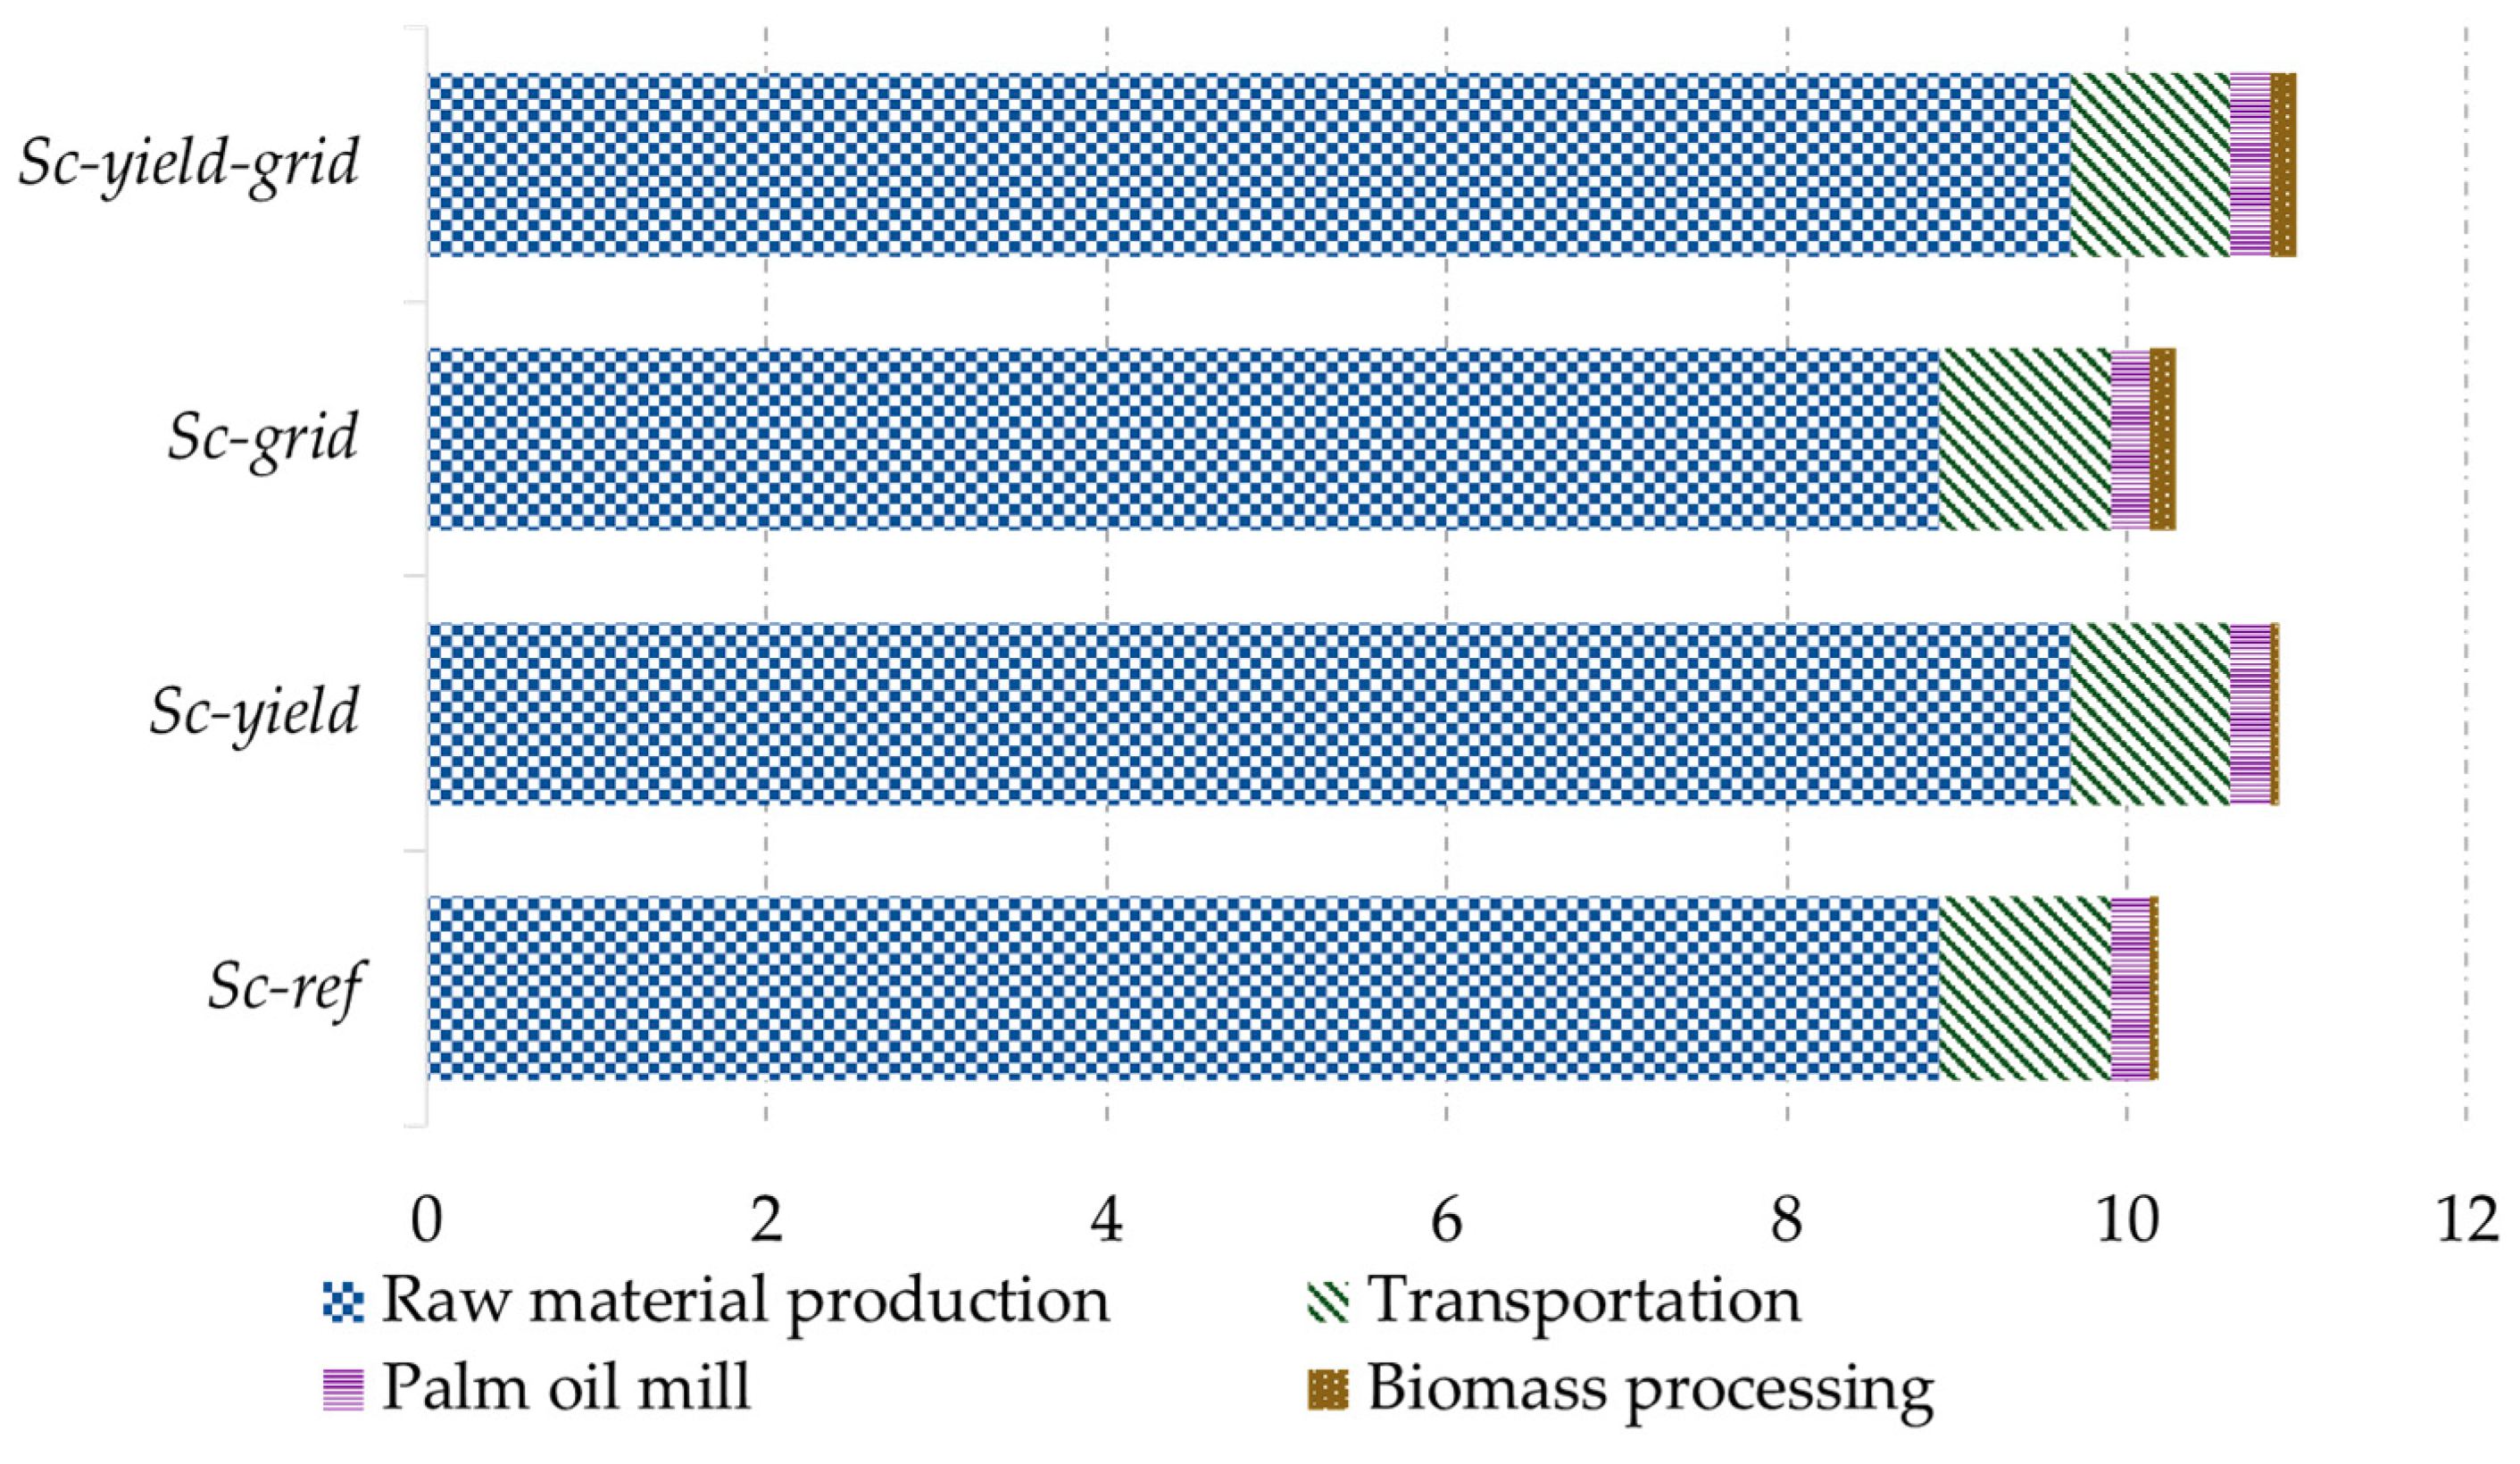
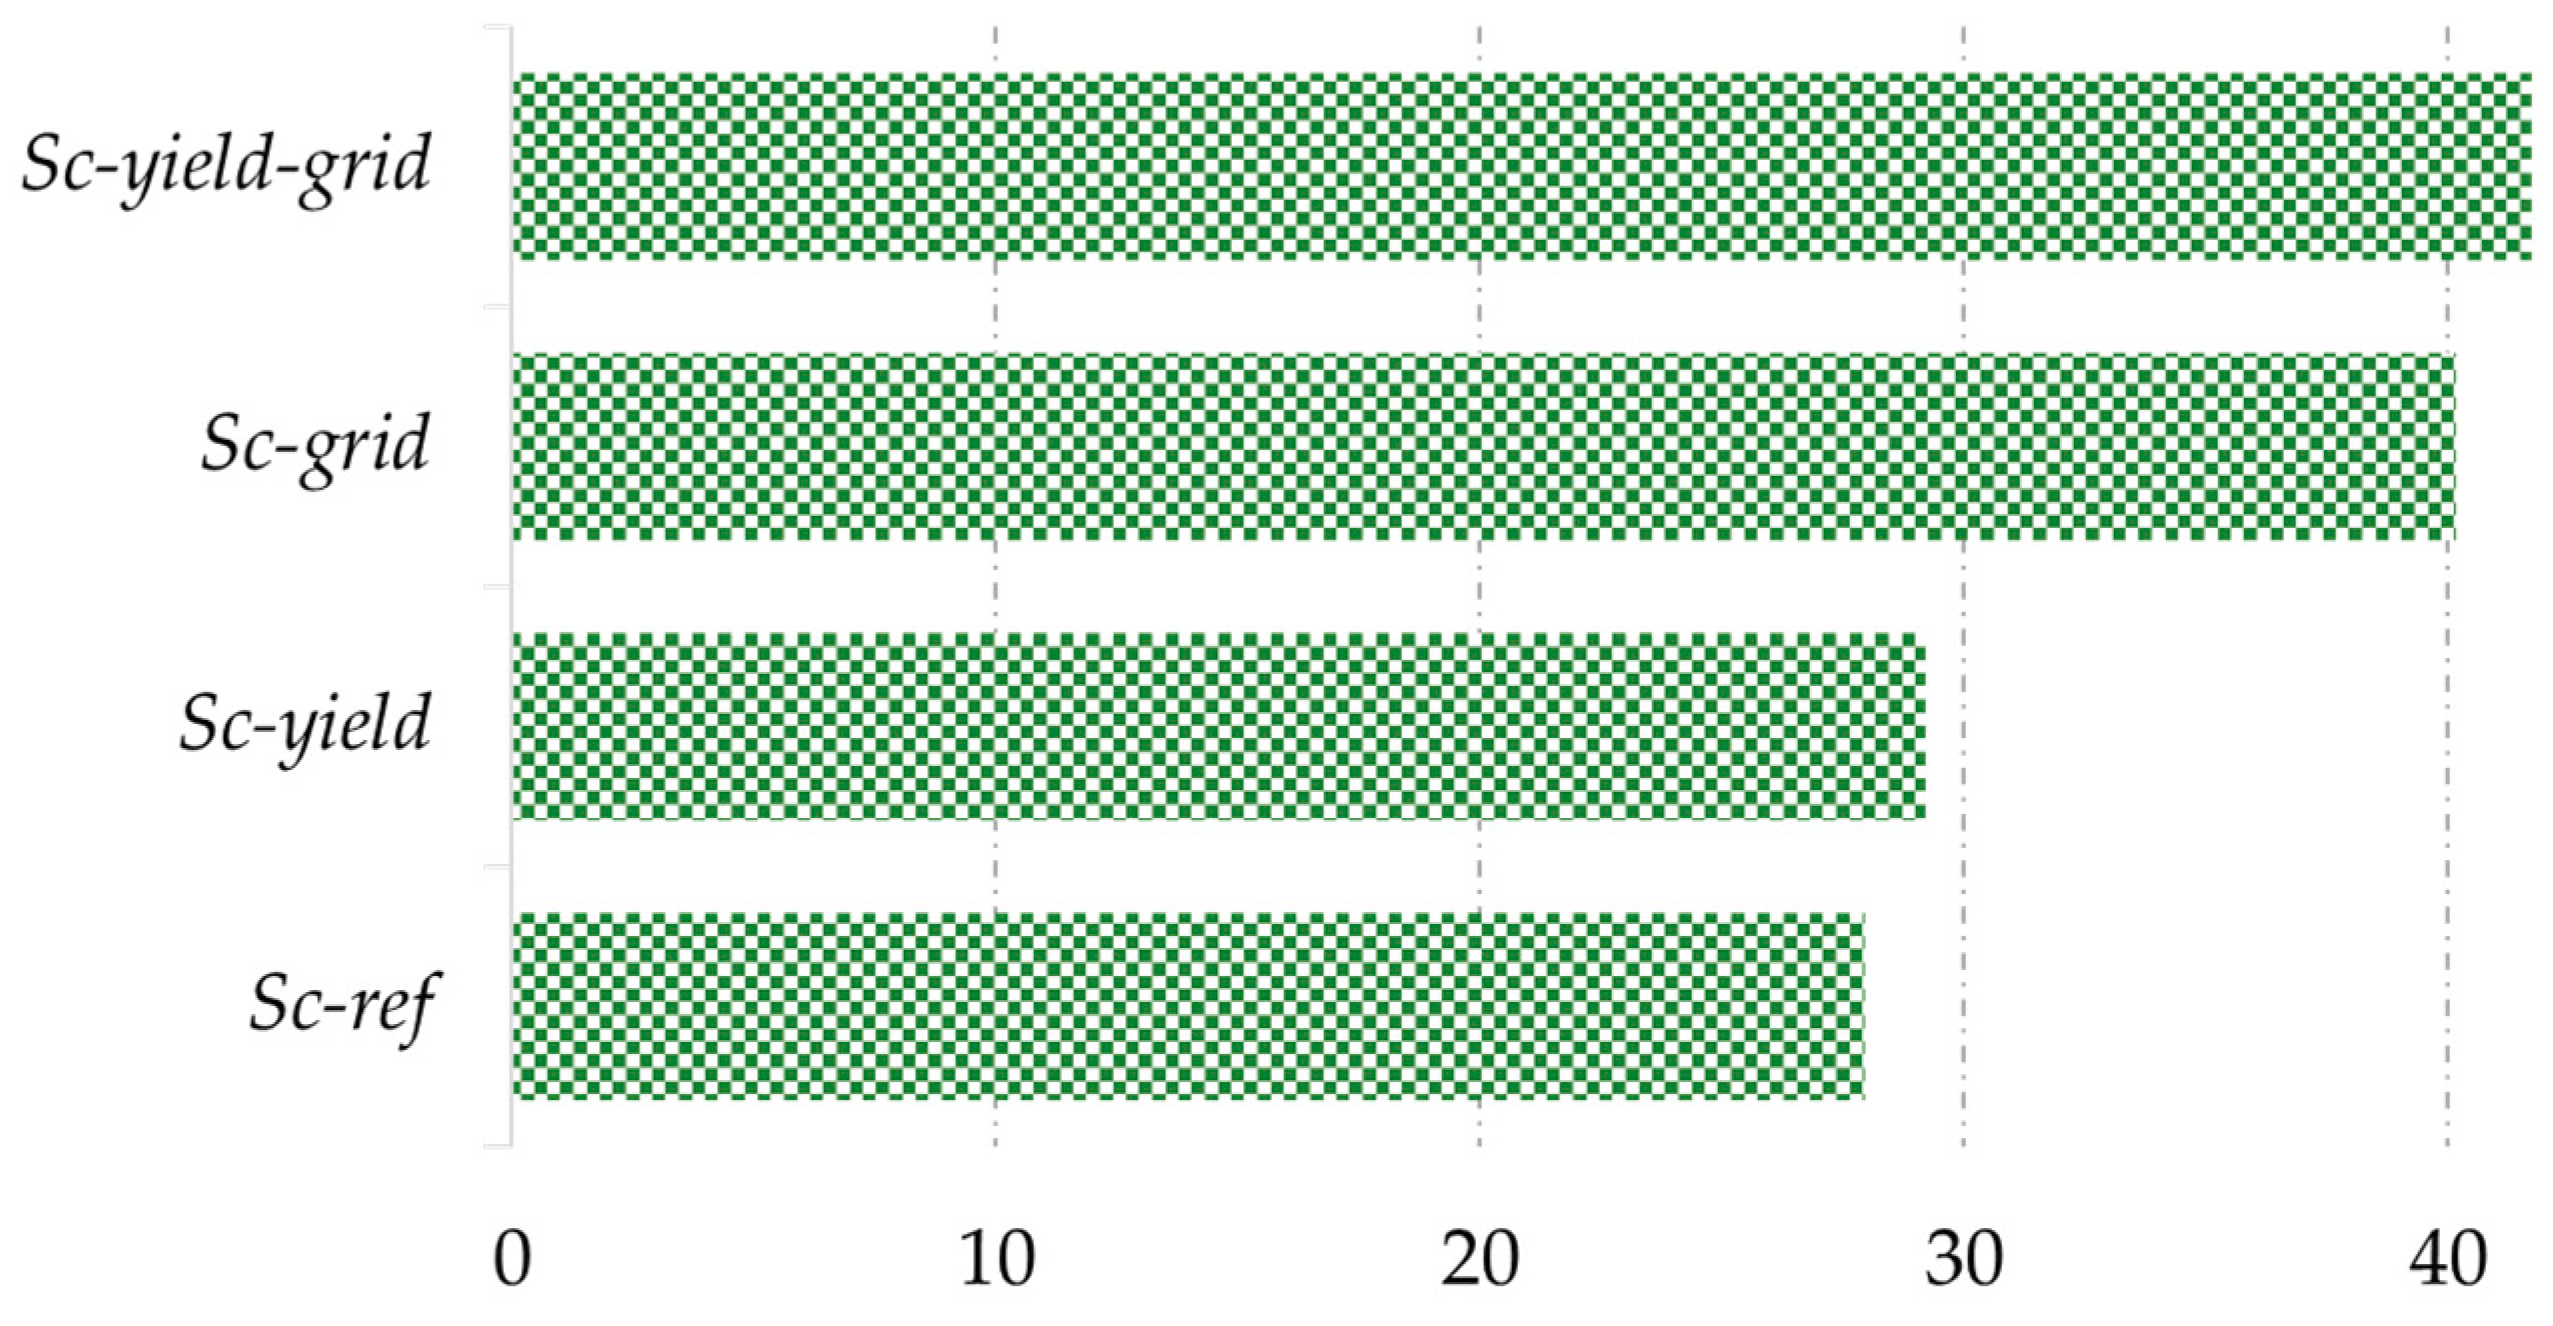
The total emissions of each scenario include emissions from raw material production and transportation, the use of diesel in the palm oil mill, and the emissions from biomass processing. The emissions reduction is based on the emissions saving potential derived from product substitution with bio-products and methane avoidance from POME treatment. For example, electricity from biomass replaces the electricity in the Sumatra grid, and biofertilizer is applied in plantations instead of chemical fertilizers. Figure 8 and Figure 9 show GHG emissions at activity level and emissions reduction from product substitution and methane avoidance. Net emissions savings between 17 and 30 MtCO2eq/y can be achieved in a more efficient system.
According to the Nationally Determined Contribution (NDC), Indonesia aims to reduce GHG emissions by 834 MtCO2eq/y by 2030 (including emissions from sectors: energy, waste, industrial processes, agriculture, and forestry) from business-as-usual (BAU) levels in 2010 [64]. For the energy and waste sectors, the GHG emissions reduction targets for 2030 are 314 MtCO2eq/y and 11 MtCO2eq/y, respectively [64]. Sc-grid and Sc-yield-grid can potentially reduce emissions between 28 and 40 MtCO2eq/y. Thus, a more efficient utilization of oil palm biomass residues can contribute 3% to 5% of the national GHG emissions reduction target for 2030. Bioenergy production from palm biomass residue in Sumatra can serve 1.3% to 5% of the target for the energy sector (excluding methane avoidance from POME management). Additional bioenergy will reduce Sumatra’s dependence on highly fossil-based electricity, which is currently more than 55% crude oil and coal-based [65]). In addition, emissions are significantly reduced through methane avoidance—up to 22 MtCO2eq/y. This means that efforts to manage POME in Sumatra can meet the country’s emissions reduction target from the waste sector for the unconditional mitigation scenario (i.e., 11 MtCO2eq/y) and nearly all for the conditional mitigation scenario (i.e., 26 MtCO2eq/y) by 2030 [64]. This indicates that Indonesia can set a higher target to reduce emissions from the waste sector.
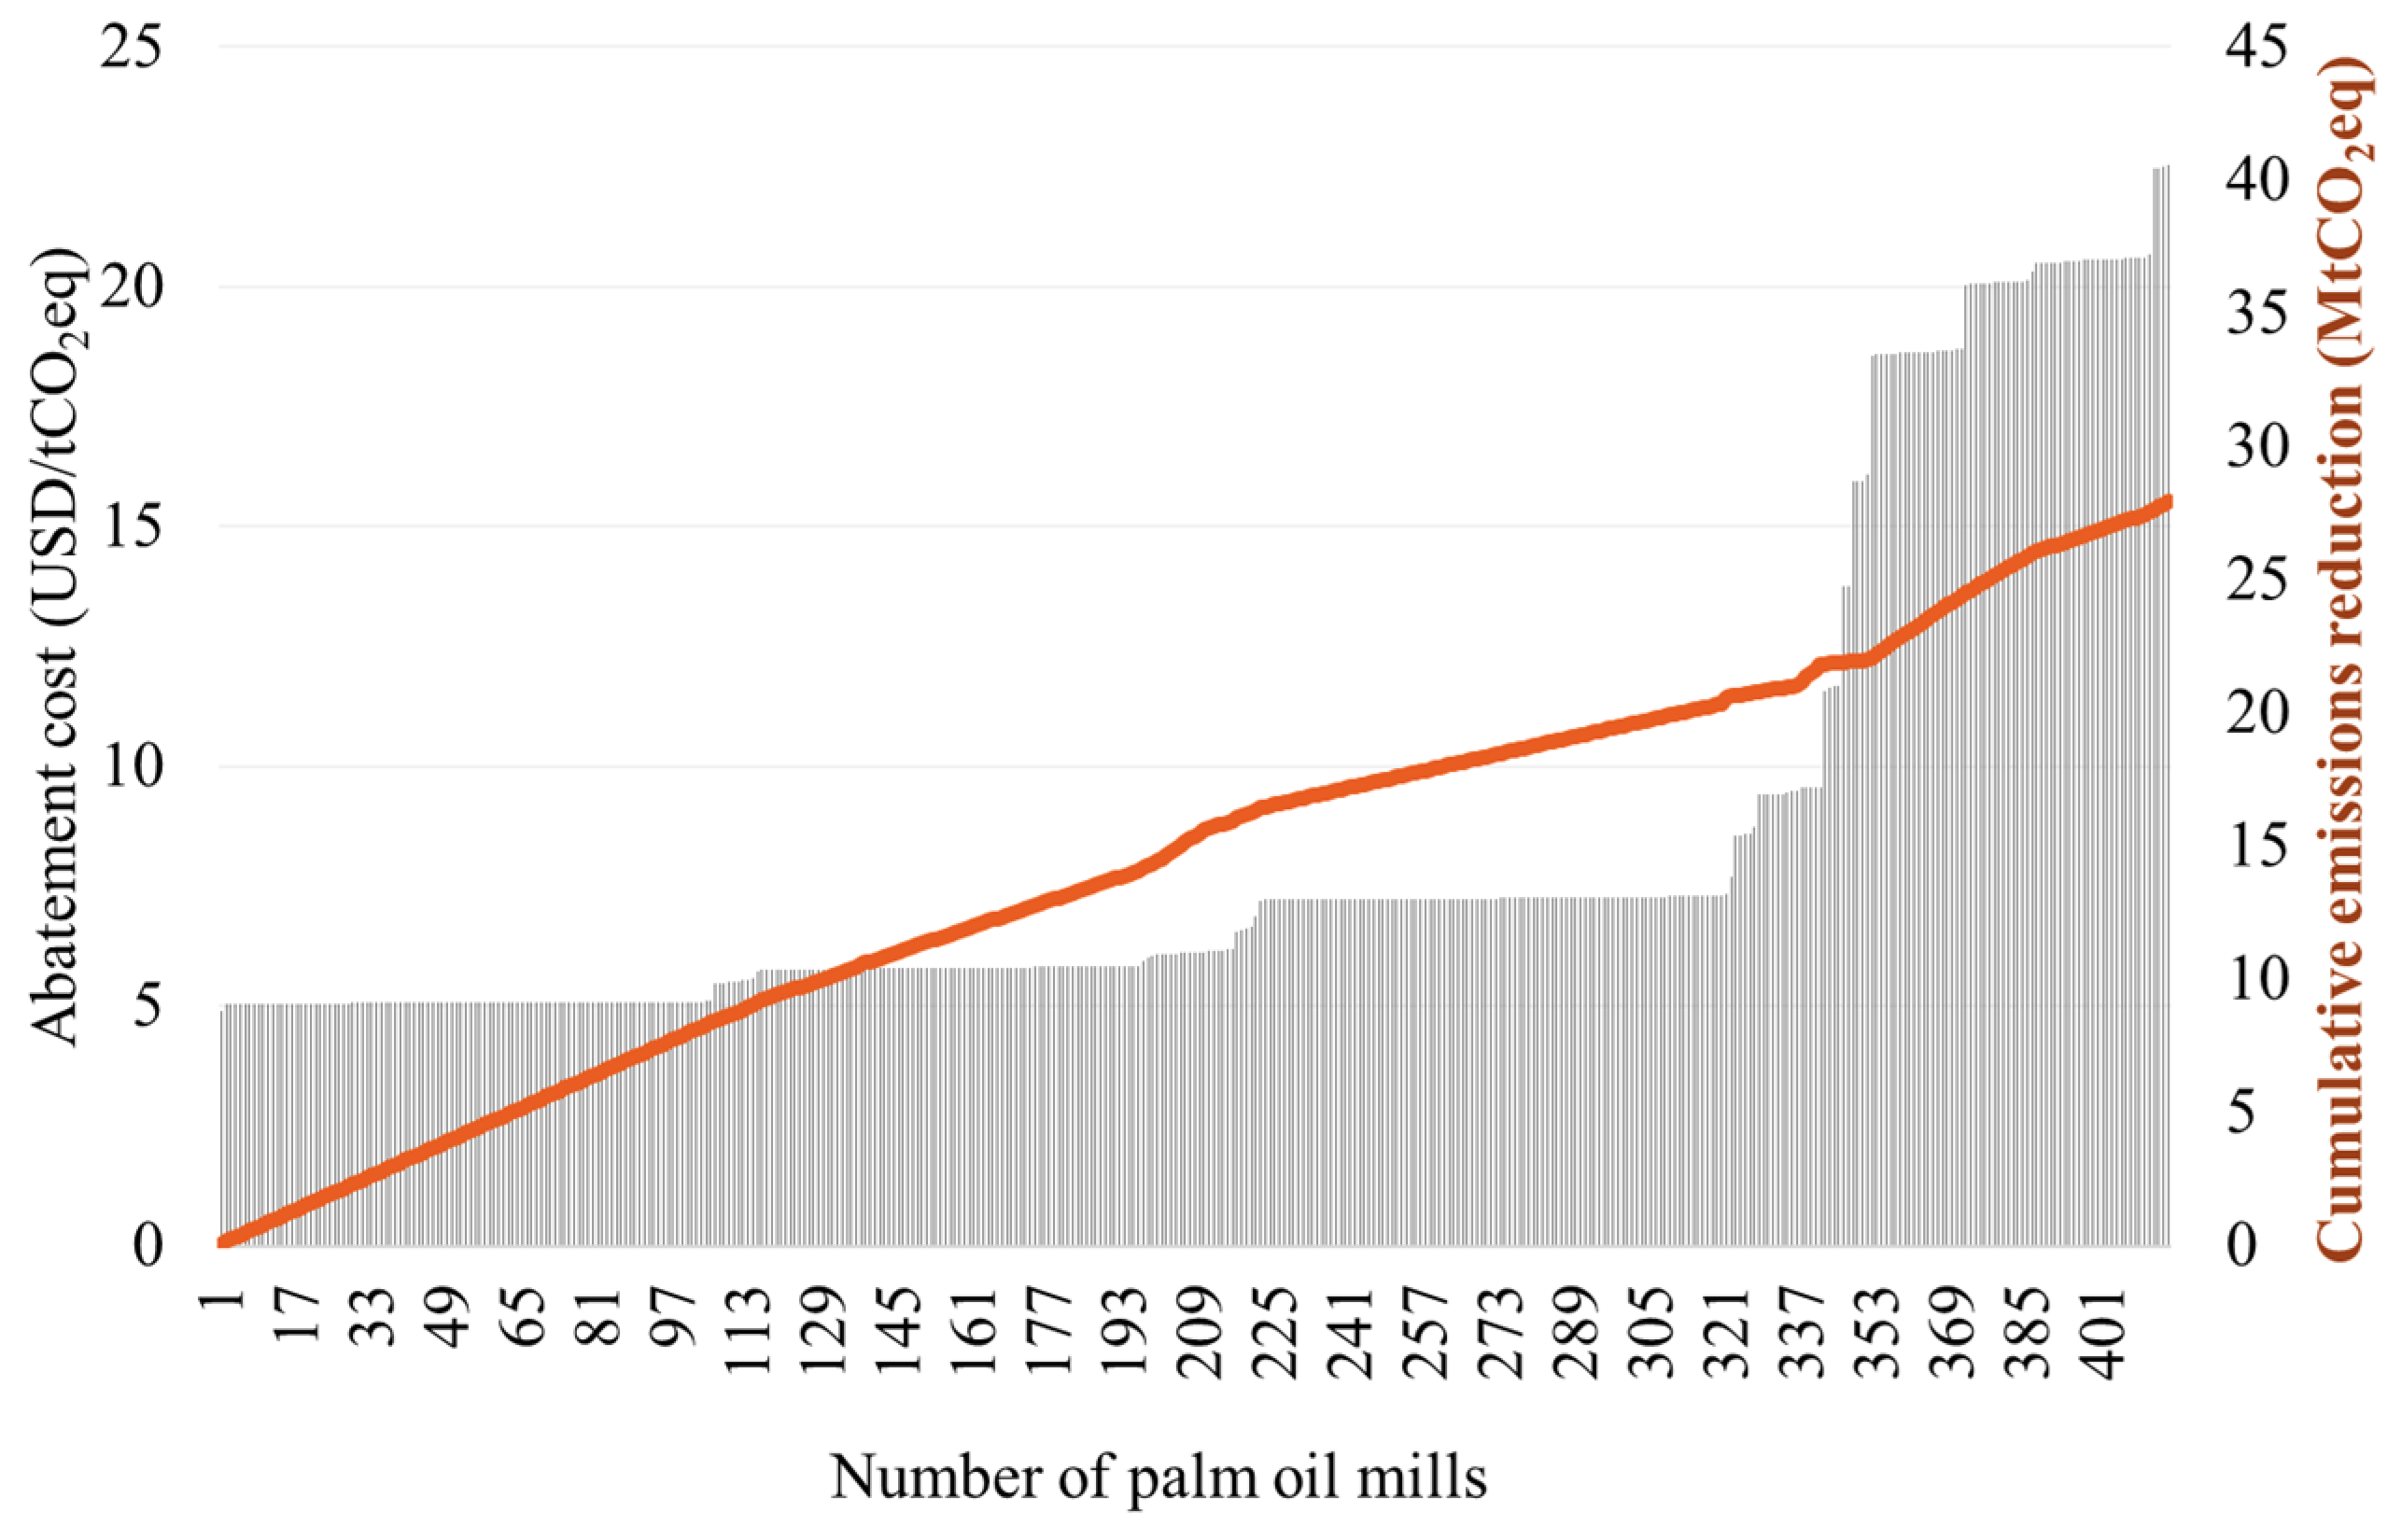
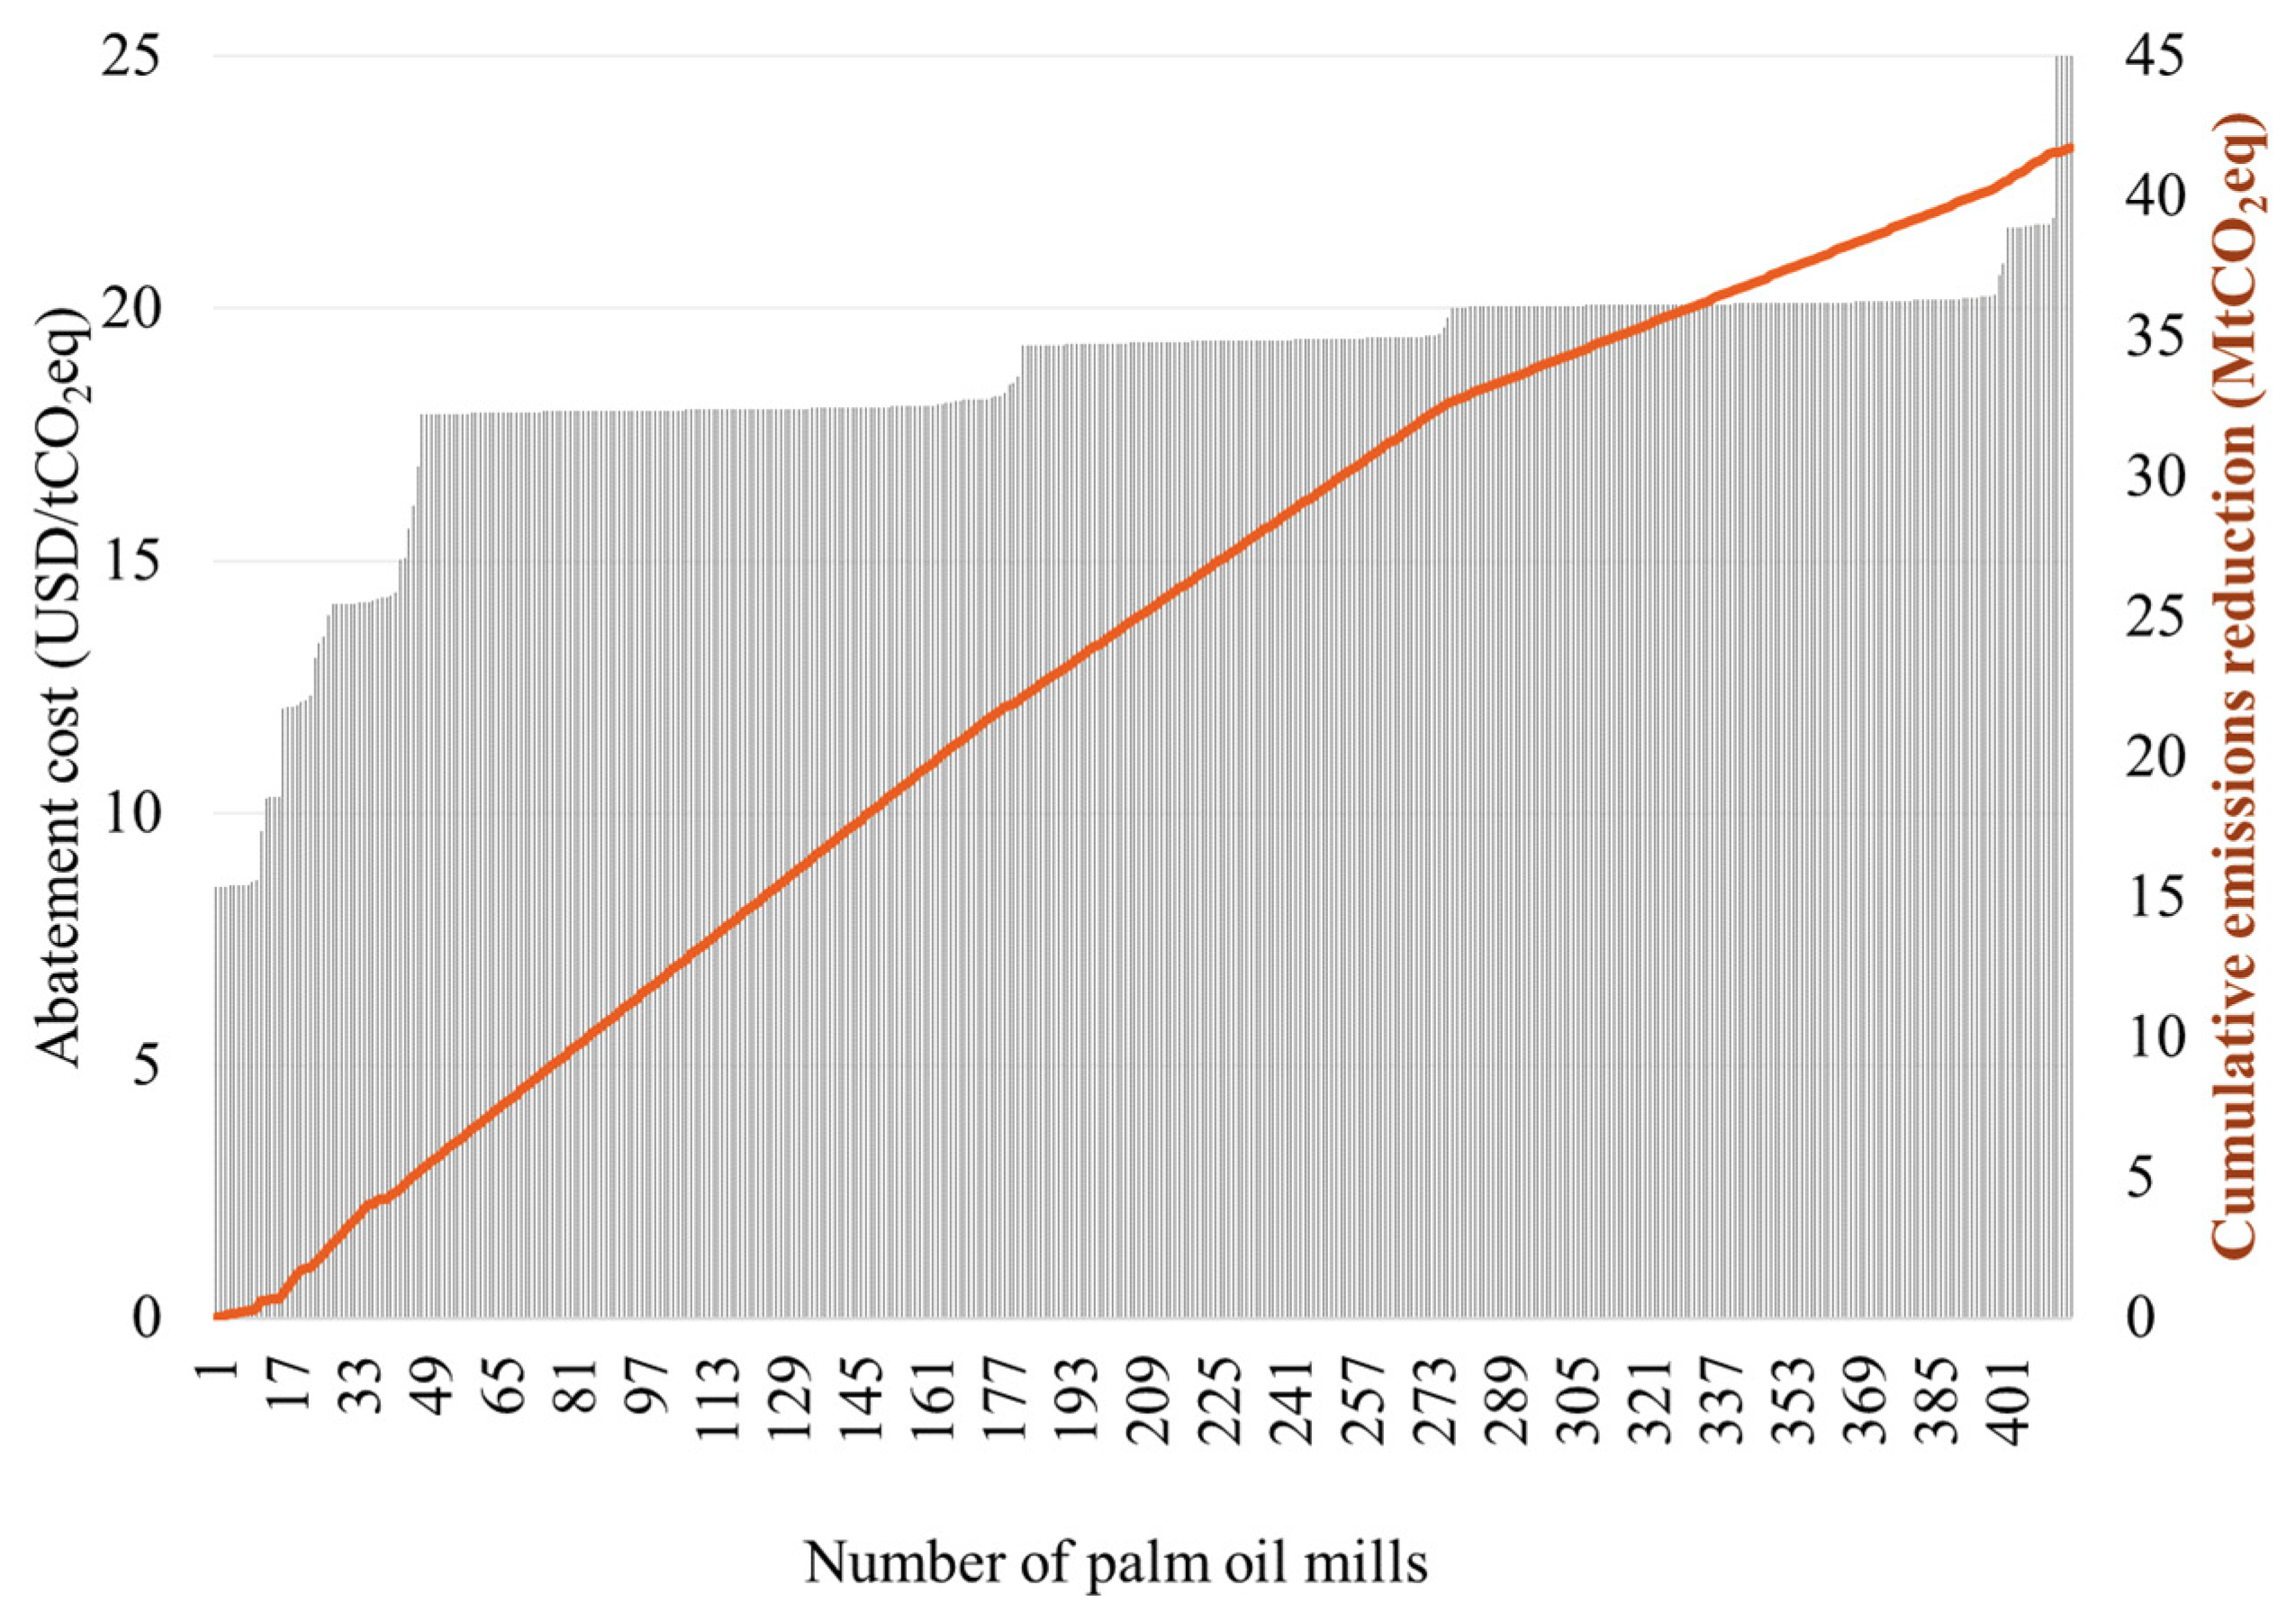
We analyzed the technology abatement cost, which is the cost to reduce one tCO2eq. Each bar in Figure 10 and Figure 11 represents the abatement cost of each analyzed mill. It suggests which mills can be prioritized to achieve the most in terms of emissions reduction. The average abatement cost of all mills in Sc-ref (i.e., 8.5 USD/tCO2eq) is 50% lower than in Sc-yield-grid (i.e., 18.5 USD/tCO2eq). However, the total emissions reduction in Sc-yield-grid is 1.5 times higher than in Sc-ref.
4.4. Effects of Significant Parameters on Cost and Profit
The sensitivity and interactions of the parameters were analyzed using a 25 factorial design of experiments, in which the influence on the costs of five parameters as well as their interactions with each other, were studied. This study was carried out in 32 runs with different combinations between the parameters. For each run, the total cost and profit were determined with the parameter changes listed in Table 3. The full factor combinations and the results from the factorial designs of the 32 runs are provided in Appendix A.
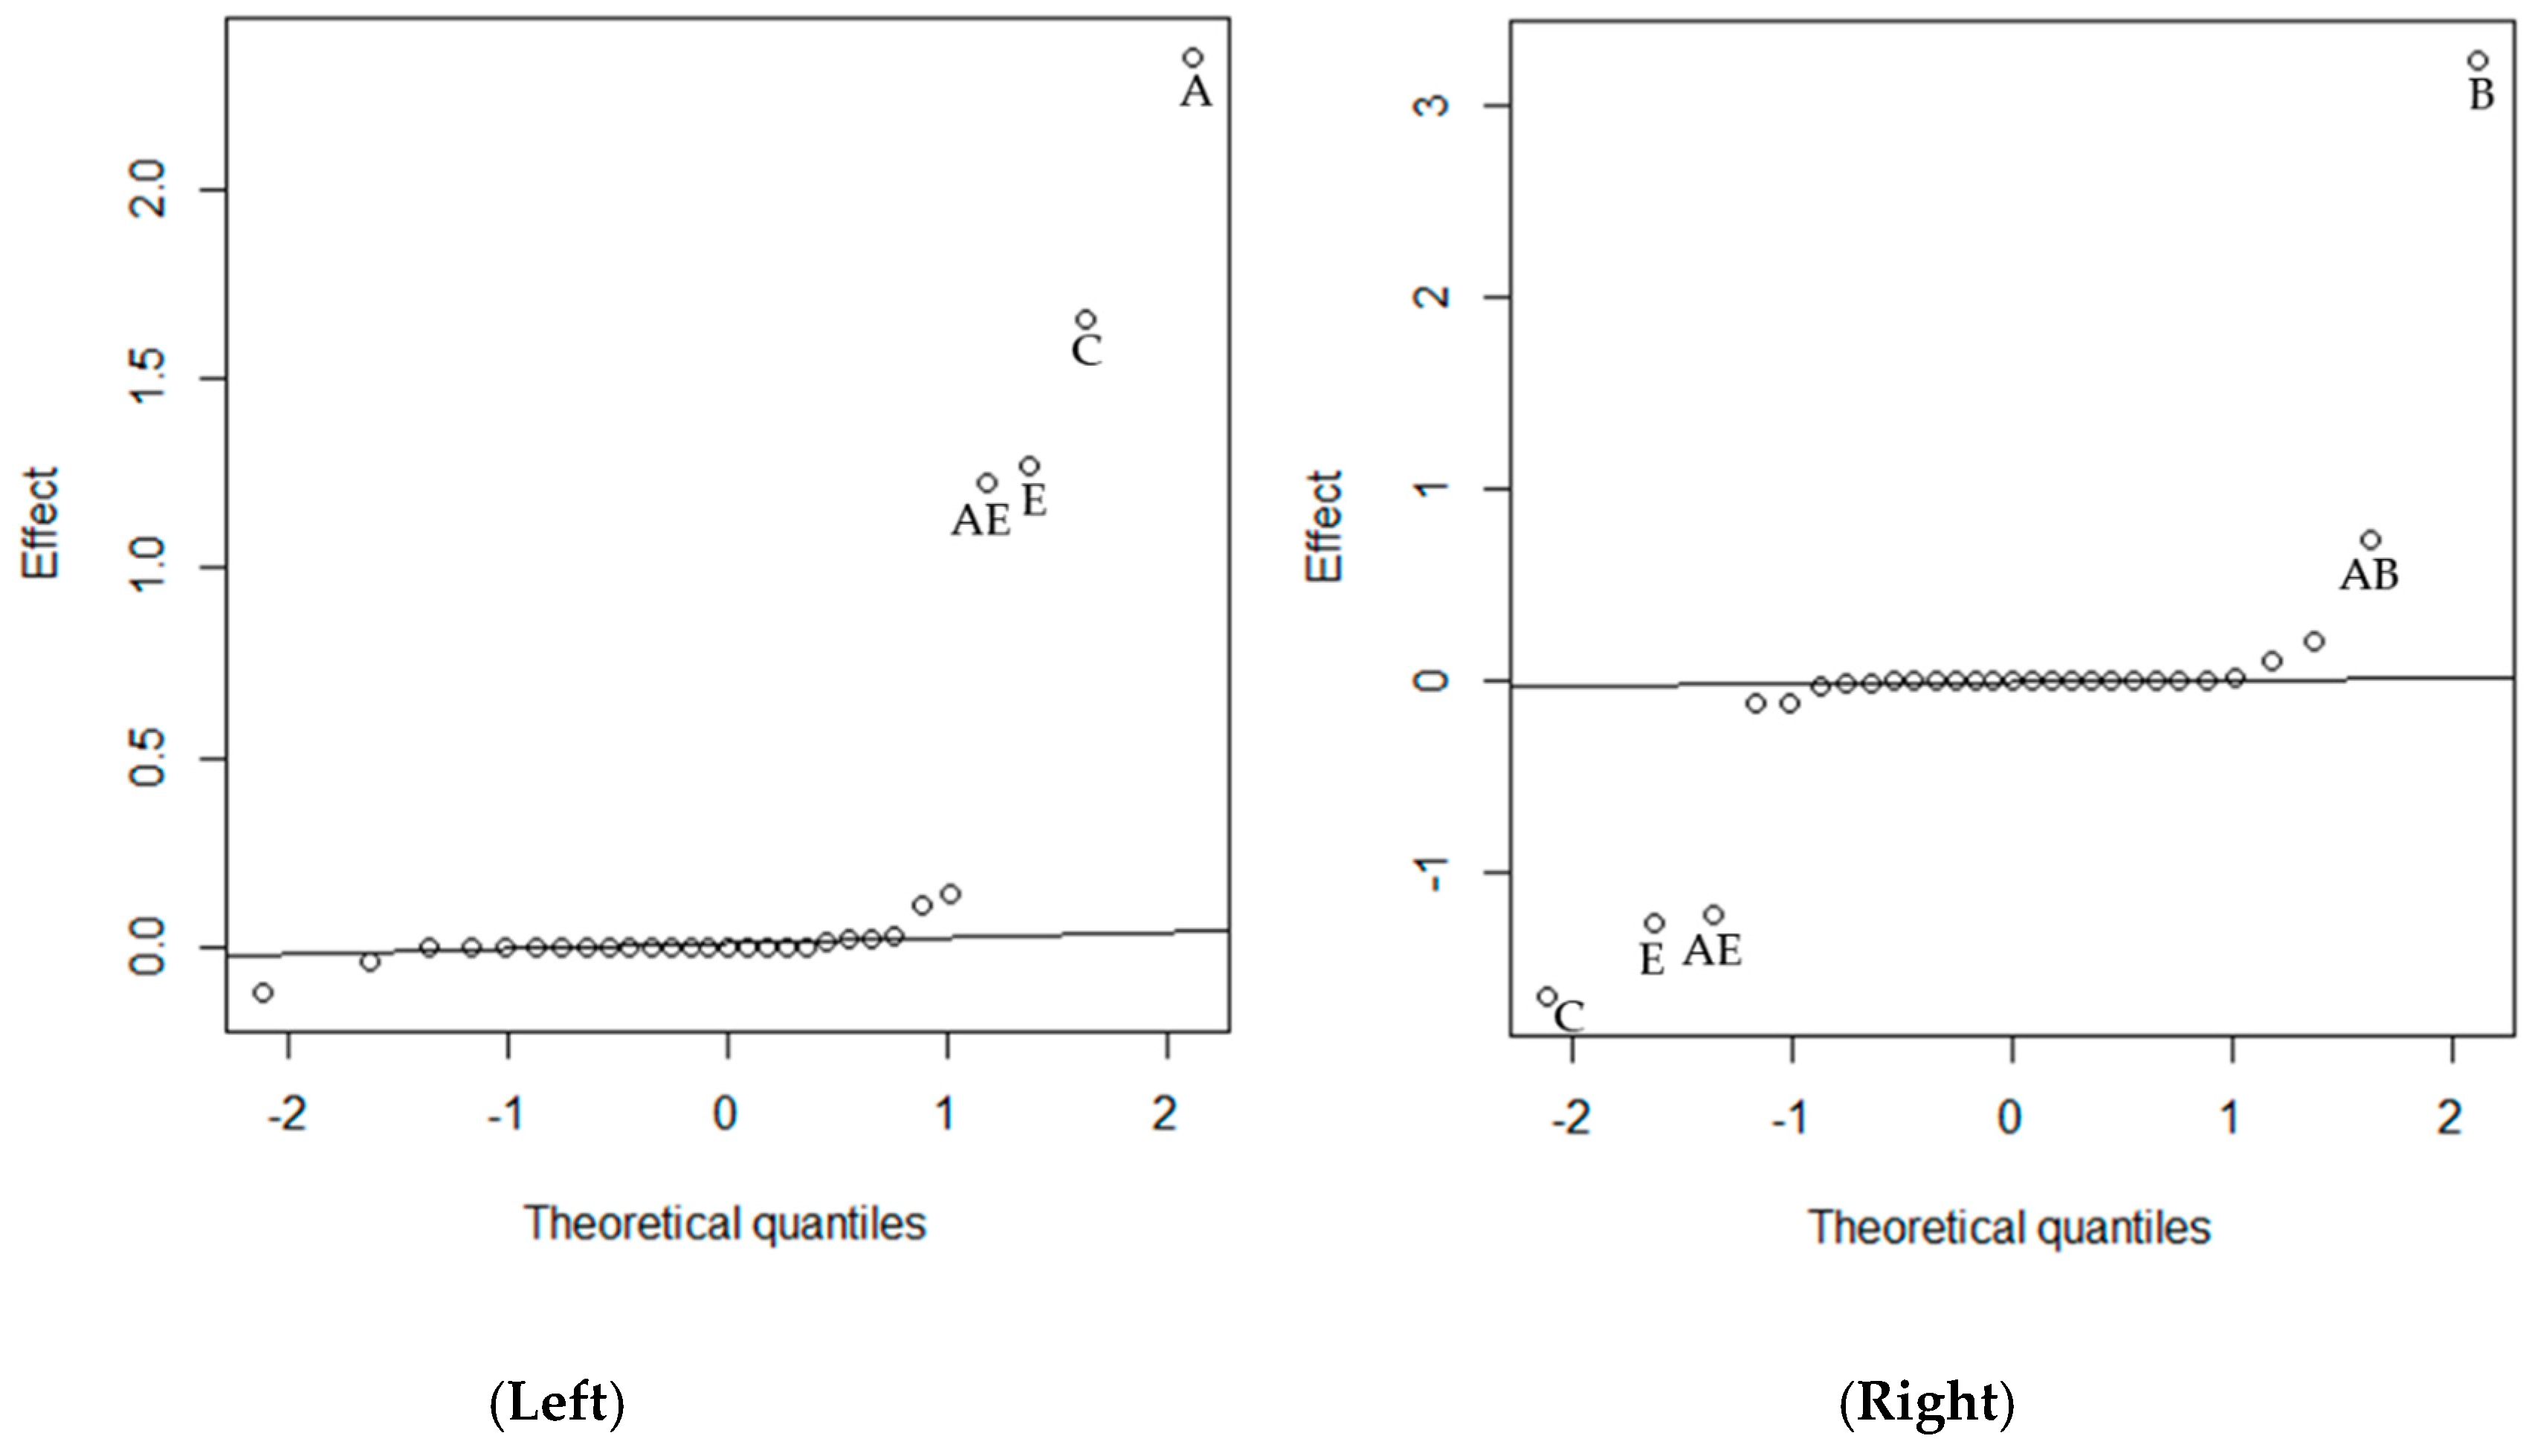
The normal probability plots of the effects on total cost and total profit are shown in Figure 12. The effects considered to be significant are labeled. The significant effects deviate substantially from the straight line (i.e., normal distribution line). Non-significant effects should effectively follow an approximately normal distribution with the same location and scale. The mill operating hours (A) appear to have a larger effect on total cost, followed by the raw material production cost (C) and transport cost (E). The interaction between mill operating hours and transport cost (AE) also has a significant effect on total cost. The magnitude of the effect estimates show that the palm oil extraction rate (B) is the most important factor in total profit. The oil extraction rate (B) is not influential on the total cost because, in this study, the cost function is determined by raw material availability (i.e., FFB) instead of CPO. The interaction of raw material availability with operating hours (AB) is relevant because a higher number of operating hours leads to higher amounts of FFB processed which, in turn, leads to a higher oil extraction rate and CPO production, the latter being the main source of income in the mill. Other single factors that have a significant effect on total profit are raw material production cost (C) and transport cost (E). The interactions that appear to be significant in terms of total profit include those between (i) the mill operating hours and the oil extraction rate (AB) and (ii) between mill operating hours and transport cost (AE).
The analysis reveals that, when mill operating hours, raw material cost, and transport cost are at the upper levels, and the efficiency of the mill is at the lower level, the costs are higher than the revenues, and the system runs at a loss (Run 22 and 30 in Appendix A).
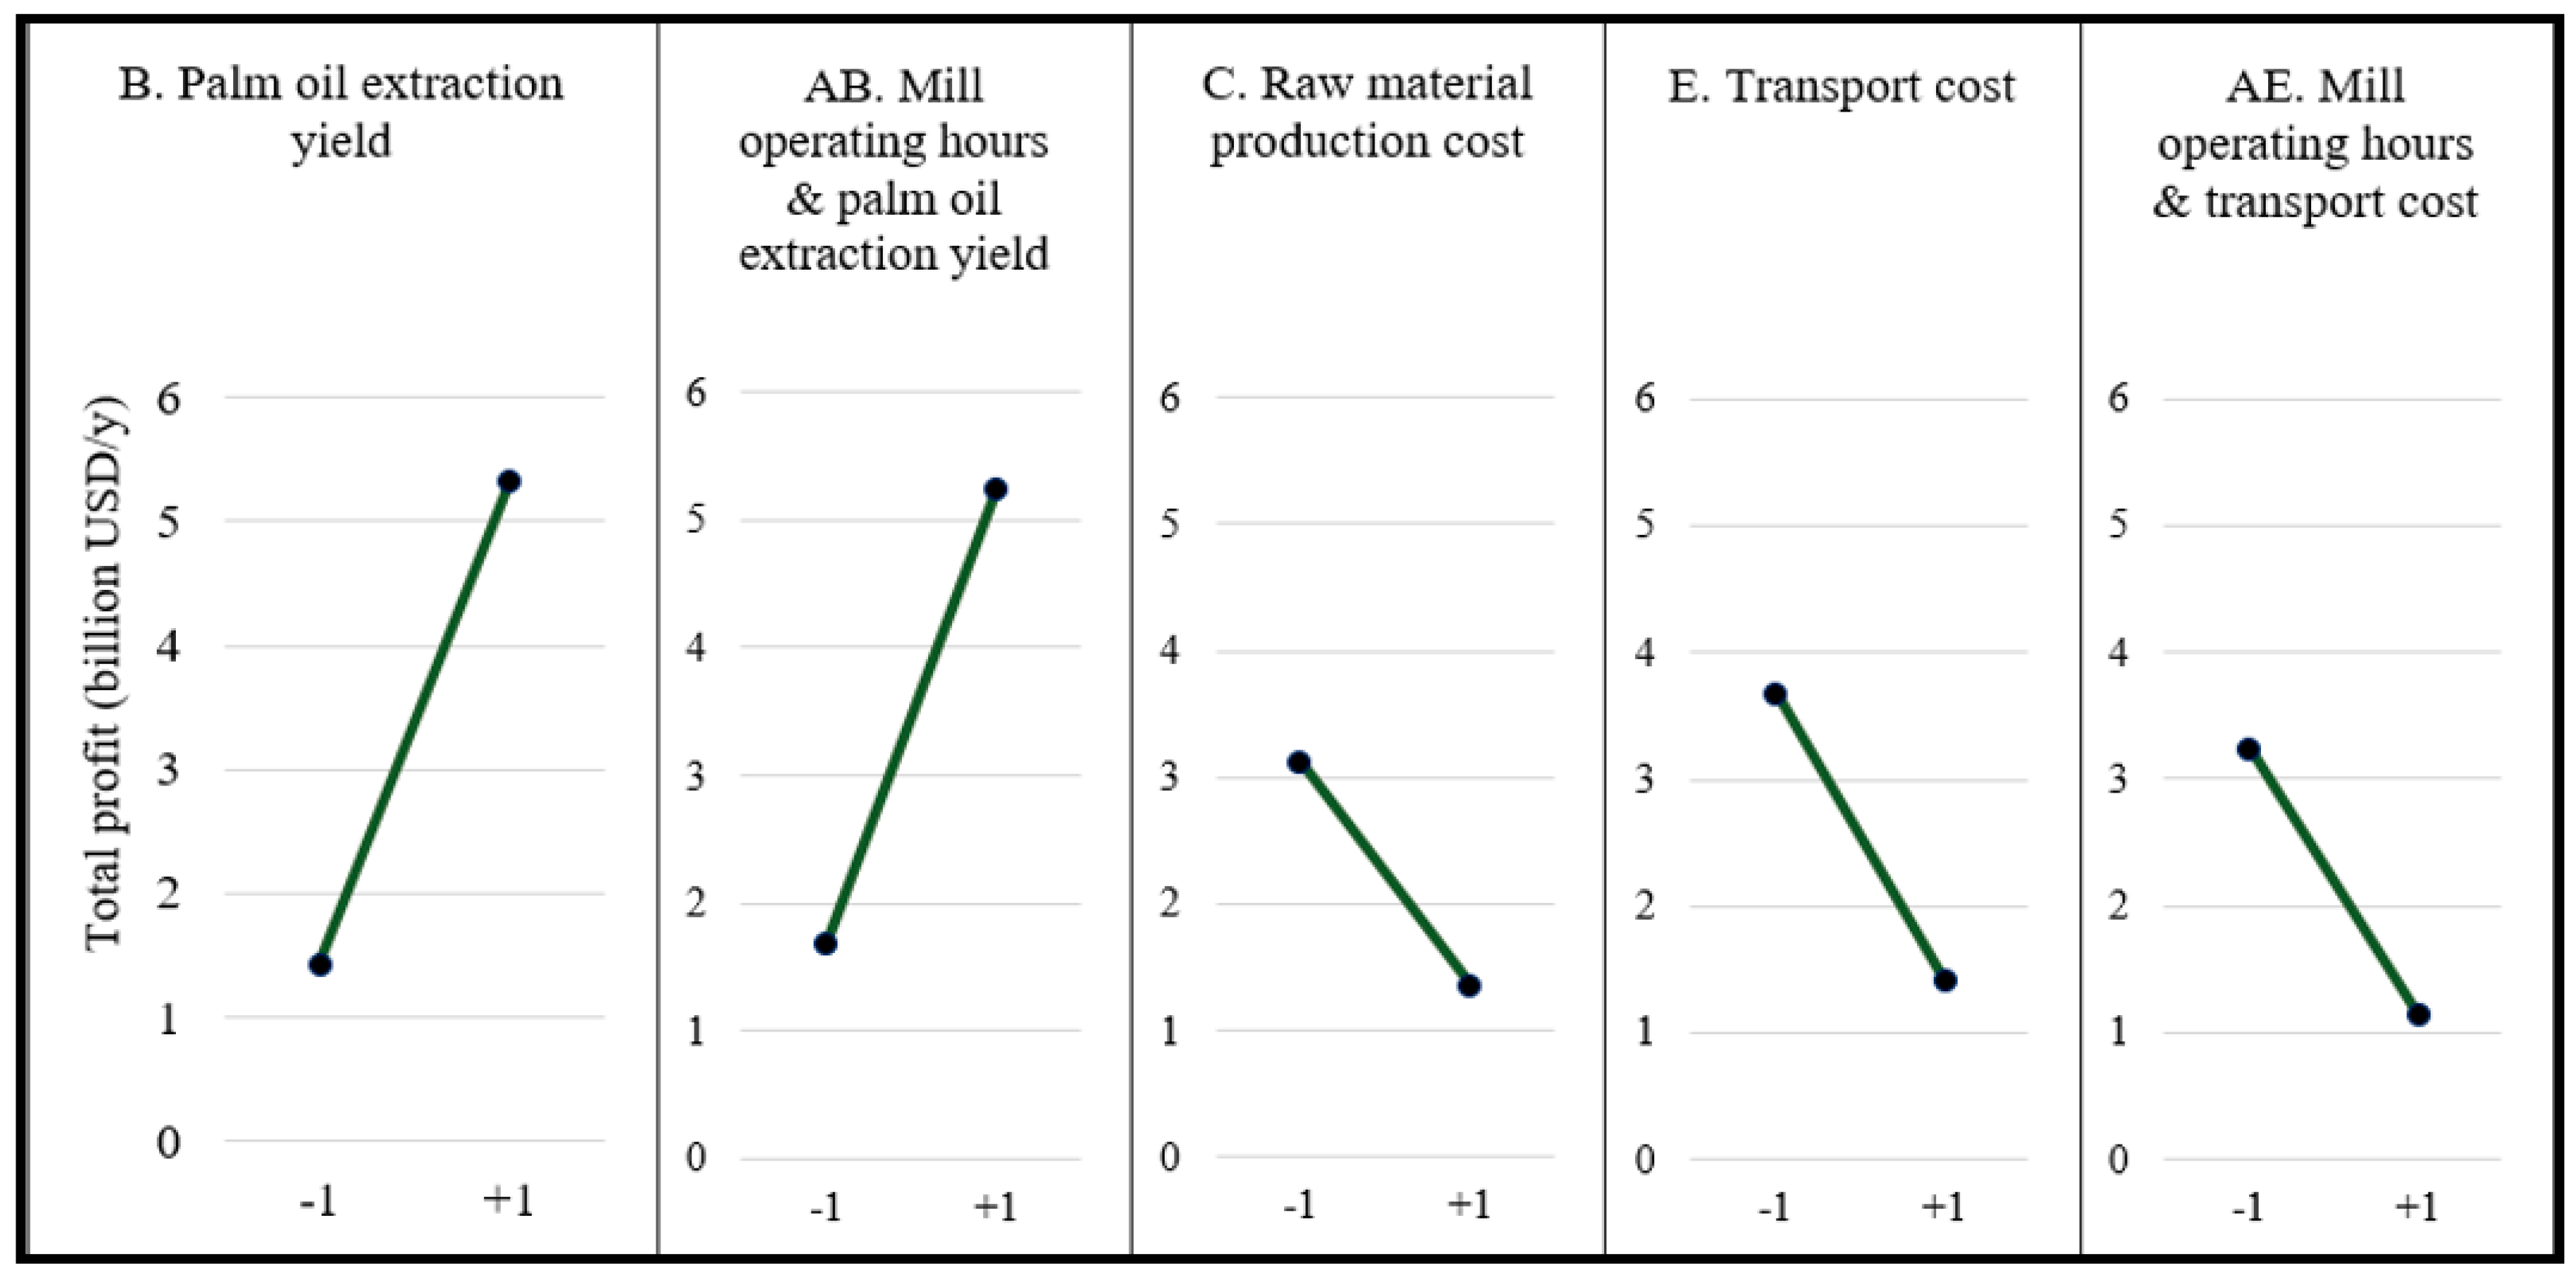
Plots of the low and high levels of the main effects, and their interactions with total cost and total profit, are shown in Figure 13 and Figure 14, respectively. The highest cost of 14 billion USD/y is achieved when mill operating hours and transport cost (AE) are at their highest level. The lowest cost is 9 billion USD/y, and is obtained when both variables are at their lowest level. This can be explained by the importance of each factor, that is, mill operating hours (A) and transport cost (E). The highest profit of 5.3 billion USD/y is achieved when the palm oil extraction rate (B) is at the upper level, while the lowest profit of 1.1 billion USD/y is reached when mill operating hours and transport cost (AE) are at their lowest levels.
5. Conclusions: Pathways to Enhance the Utilization of Palm Biomass Residue in Indonesia
This work scrutinizes the most important agro-industry in Indonesia—palm oil. The results show that it is economically feasible to fully utilize solid and liquid biomass residues, and improve regional economic gains from the palm oil industry in Sumatra. The results can be used to assist in strategic decision-making around the planning and operation of the palm oil supply chain in terms of the cost competitiveness of oil palm biomass utilization, emissions reduction, biomass technology selection, and the prioritization of grid connectivity. The implementation of the results will depend on the availability of financial resources for new investments. Meanwhile, better databases, policy monitoring processes, and more stringent consequences for non-compliance are needed to fully take advantage of current policies, and achieve climate and sustainable development targets.
Data availability poses challenges for the spatial analysis and monitoring of the palm oil industry. A reliable palm oil database is crucial for future research in the oil palm industry, so that relevant policy recommendations can be provided, and the sustainability of palm oil production can be improved. An actual mapping of oil palm plantations encompassing both small-scale and large-scale plantations, as well as their geographical location and characteristics, is needed for a more robust estimation of FFB availability, monitoring of production, and planning for optimal investments. A complete database of palm oil mills, their geographical location, and operational capacity is also necessary to perform future research on the industry, and plan possible integration with other industries. A plan to improve the database can be carried out together with the definition of monitoring processes for policy implementation. The MoA could collaborate with the regional government in improving the database.
The study demonstrates that Sc-yield (i.e., improved yield of small-scale plantations) could obtain 1 billion USD/y more profit than Sc-ref. Both Sc-yield and Sc-grid-yield result in significant benefits in terms of resource efficiency and the reduction of GHG emissions. However, Sc-grid-yield requires 70% more investments for upgrading biomass conversion technologies and building transmission lines compared to Sc-yield. This suggests that, in the short to medium term, improving smallholder plantation yields is the optimal way to maximize regional economic gains from the palm oil industry. This means that it is worth continuing the financial incentive that the government currently provides to improve small-scale plantation yields. In addition, the use of biofertilizer for substituting chemical fertilizer can contribute to significant emissions reductions. Besides, the potential leaching of biofertilizer into freshwater ecosystems is significantly less harmful than that of conventional fertilizers, which are mixed formulations [66]. These benefits are difficult to materialize without policy support for fertilizer substitution, which could start with a partial substitution of chemical fertilizers in the plantations. More importantly, the effort will significantly reduce the amount of methane that would have been released from untreated POME.
Sc-ref shows that harnessing the full potential of palm biomass residue in Sumatra can contribute to meeting 12% of the national bioenergy target (i.e., 5500 MWe of bioenergy installed capacity) or 38% of the target for Sumatra (i.e., 1755 MWe of bioenergy installed capacity), while also delivering 28 MtCO2eq/y of GHG emissions reductions. Up to 50% of the national target of the bioenergy installed capacity, and emissions reductions of up to 40 MtCO2eq/y, can be achieved with improved grid connectivity. Therefore, in the medium to long term, improving grid electricity connections to palm oil mills will make it attractive to invest in larger electricity capacity at mills, and supply excess electricity to the grid. This measure could be part of an integrated program to increase electricity access in Sumatra, while also upgrading the palm oil industry. Although not analyzed in this study, the high investment for improved grid connectivity provides an opportunity to explore small grid options for mill clusters to meet the electricity demand of surrounding areas. This option can be aligned with the cluster model for biogas plants as described in Section 4.1. Furthermore, it provides an opportunity to develop industrial symbiosis in Sumatra by enhancing interaction and cooperation among mill owners, leading to regional sustainable development.
While the main business of a typical palm oil mill is to process FFB and sell CPO and its byproducts (i.e., PK), it is important to sensitize palm oil mill owners to the opportunities at hand in terms of incorporating energy production in their business models. To realize the existing potential, palm oil mills will have to acquire new expertise or collaborate with new players to develop independent power production capacity. A review of the potential interaction between industrial policy for waste management and energy policy would be valuable to guide policymakers. Likewise, forging partnerships between mill owners and independent power producers can help trigger investments.
In this study, we investigated optimal ways to fully harness oil palm biomass residue for generating both energy and non-energy products. Ultimately, the results show that there are alternatives for decoupling the palm oil industry’s growth from plantation expansion, while curtailing deforestation and promoting sustainable development. Existing policy frameworks are working in the right direction, but the various bottlenecks identified here need to be addressed to realize the full bioenergy potential of this industry in Indonesia.
Supplementary Materials
The following are available online at https://www.mdpi.com/1996-1073/12/3/420/s1, Figure S1: List of raw materials, intermediate products (IP), technologies (Tech), bio-products (BP) and associated demands optimized in the BeWhere model. Figure S2: Representation of FFB availability in Sumatra, grid of 25 km × 25 km (left: small-scale plantations, right: large-scale plantations). Figure S3: Mills capacity in grid of 25 km × 25 km. Figure S4: The road network of Sumatra. Figure S5: Geographical location of distribution transformers. Figure S6: District’s electricity demand. Table S1: Conversion rate from FFB to intermediate products. Table S2: Technological conversion rate for processing the biomass residue into bio-products. Table S3: Annualized cost of biomass-based technology. Table S4: Prices of bio-products used in the analysis. Table S5: Emissions factor applied in the model.
Author Contributions
“Conceptualization, F.H.; Methodology, F.H., S.L. and S.M.; Software, F.H., S.L. and S.M.; Validation, F.H. and S.L.; Formal Analysis, F.H.; Investigation, F.H.; Data Curation, F.H.; Writing—Original Draft Preparation, F.H.; Writing—Review & Editing, F.H., S.L., S.S. and D.K.; Visualization, F.H.; Supervision, S.L., S.S., F.K.; Funding Acquisition, S.S, F.K.”, please turn to the CRediT taxonomy for an explanation of terminology used.
Funding
This research was developed during the Young Scientists Summer Program at the International Institute for Systems Analysis (IIASA), with financial support from Ferrero Trading Lux S.A. The first author’s research project is financed by the Swedish Energy Agency [T6473].
Acknowledgments
We would like to thank the Ministry of Agriculture of Indonesia for the data provided. This work was supported by the IIASA Tropical Futures Initiative (TFI) (www.iiasa.ac.at/tropics) and the RESTORE+ project (www.restoreplus.org), which is part of the International Climate Initiative (IKI), supported by the Federal Ministry for the Environment, Nature Conservation and Nuclear Safety (BMU) based on a decision adopted by the German Bundestag.
Conflicts of Interest
The authors declare no conflict of interest. The funders had no role in the design of the study; in the collection, analyses, or interpretation of data; in the writing of the manuscript, or in the decision to publish the results.
Appendix A

Table A1.
Results from the factorial design.
| Run | A. Mill Annual Operating Hours (h/y) | B. Palm Oil Extraction Rate (tCPO/tFFB) | C. Raw Material Production Cost of Large-Scale Plantations (USD/tFFB) | D. Capital Cost 1 MW CHP Plant (USD/MWh) | E. Transport Cost (USD/tFFB/km) | Total Cost (billion USD) | Total Profit (billion USD) |
|---|---|---|---|---|---|---|---|
| 1 | 4000 | 0.18 | 65 | 17 | 0.1 | 8.50 | 2.89 |
| 2 | 4900 | 0.18 | 65 | 17 | 0.1 | 10.86 | 3.10 |
| 3 | 4000 | 0.25 | 65 | 17 | 0.1 | 8.50 | 6.14 |
| 4 | 4900 | 0.25 | 65 | 17 | 0.1 | 10.86 | 7.08 |
| 5 | 4000 | 0.18 | 98 | 17 | 0.1 | 10.16 | 1.23 |
| 6 | 4900 | 0.18 | 98 | 17 | 0.1 | 12.62 | 1.32 |
| 7 | 4000 | 0.25 | 98 | 17 | 0.1 | 10.16 | 4.48 |
| 8 | 4900 | 0.25 | 98 | 17 | 0.1 | 12.65 | 5.29 |
| 9 | 4000 | 0.18 | 65 | 30 | 0.1 | 8.54 | 2.85 |
| 10 | 4900 | 0.18 | 65 | 30 | 0.1 | 10.89 | 3.07 |
| 11 | 4000 | 0.25 | 65 | 30 | 0.1 | 8.54 | 6.10 |
| 12 | 4900 | 0.25 | 65 | 30 | 0.1 | 10.89 | 7.05 |
| 13 | 4000 | 0.18 | 98 | 30 | 0.1 | 10.19 | 1.20 |
| 14 | 4900 | 0.18 | 98 | 30 | 0.1 | 12.66 | 1.29 |
| 15 | 4000 | 0.25 | 98 | 30 | 0.1 | 10.19 | 4.45 |
| 16 | 4900 | 0.25 | 98 | 30 | 0.1 | 12.68 | 5.26 |
| 17 | 4000 | 0.18 | 65 | 17 | 0.3 | 9.78 | 1.61 |
| 18 | 4900 | 0.18 | 65 | 17 | 0.3 | 13.35 | 0.59 |
| 19 | 4000 | 0.25 | 65 | 17 | 0.3 | 9.78 | 4.86 |
| 20 | 4900 | 0.25 | 65 | 17 | 0.3 | 13.37 | 4.56 |
| 21 | 4000 | 0.18 | 98 | 17 | 0.3 | 11.31 | 0.07 |
| 22 | 4900 | 0.18 | 98 | 17 | 0.3 | 15.14 | (1.19) |
| 23 | 4000 | 0.25 | 98 | 17 | 0.3 | 11.33 | 3.31 |
| 24 | 4900 | 0.25 | 98 | 17 | 0.3 | 15.16 | 2.78 |
| 25 | 4000 | 0.18 | 65 | 30 | 0.3 | 9.81 | 1.58 |
| 26 | 4900 | 0.18 | 65 | 30 | 0.3 | 13.39 | 0.56 |
| 27 | 4000 | 0.25 | 65 | 30 | 0.3 | 9.81 | 4.83 |
| 28 | 4900 | 0.25 | 65 | 30 | 0.3 | 13.40 | 4.53 |
| 29 | 4000 | 0.18 | 98 | 30 | 0.3 | 11.34 | 0.03 |
| 30 | 4900 | 0.18 | 98 | 30 | 0.3 | 15.17 | (1.22) |
| 31 | 4000 | 0.25 | 98 | 30 | 0.3 | 11.36 | 3.28 |
| 32 | 4900 | 0.25 | 98 | 30 | 0.3 | 15.19 | 2.75 |
References
- Ministry of Agriculture. Tree Crop Estate Statistics of Indonesia 2015–2017; Ministry of Agriculture: Jakarta, Indonesia, 2017.
- Salema, A.A.; Ani, F.N. Pyrolysis of oil palm empty fruit bunch biomass pellets using multimode microwave irradiation. Bioresour. Technol. 2012, 125, 102–107. [Google Scholar] [CrossRef]
- Kasivisvanathan, H.; Ng, R.T.L.; Tay, D.H.S.; Ng, D.K.S. Fuzzy optimisation for retrofitting a palm oil mill into a sustainable palm oil-based integrated biorefinery. Chem. Eng. J. 2012, 200, 694–709. [Google Scholar] [CrossRef]
- Harahap, F. An Evaluation of Biodiesel Policies—The Case of Palm Oil Agro-Industry in Indonesia. Licentiate Thesis, KTH Royal Institute of Technology, Stockholm, Sweden, 2018. [Google Scholar]
- Ministry of Energy and Mineral Resources. Indonesia Energy Roadmap 2017–2025; Ministry of Agriculture: Jakarta, Indonesia, 2017; p. 3804242. [Google Scholar]
- Foo, D.C.Y.; Tan, R.R.; Lam, H.L.; Kamal, M.; Aziz, A.; Rí, J.; Kleme, J. Robust models for the synthesis of flexible palm oil-based regional bioenergy supply chain. Energy 2013, 55, 68–73. [Google Scholar] [CrossRef]
- Lam, H.L.; Ng, W.P.Q.; Ng, R.T.L.; Ng, E.H.; Aziz, M.K.A.; Ng, D.K.S. Green strategy for sustainable waste-to-energy supply chain. Energy 2013, 57, 4–16. [Google Scholar] [CrossRef]
- Memari, A.; Ahmad, R.; Rahim, A.R.A.; Jokar, M.R.A. An optimization study of a palm oil-based regional bio-energy supply chain under carbon pricing and trading policies. Clean. Technol. Environ. Policy 2018, 1, 113–125. [Google Scholar] [CrossRef]
- Idris, M.N.M.; Hashim, H.; Razak, N.H. Spatial optimisation of oil palm biomass co-firing for emissions reduction in coal-fired power plant. J. Clean. Prod. 2018, 172, 3428–3447. [Google Scholar] [CrossRef]
- Harahap, F.; Silveira, S.; Khatiwada, D. Cost competitiveness of palm oil biodiesel production in Indonesia. Energy 2019, 170, 62–72. [Google Scholar] [CrossRef]
- Ng, D.K.; Ng, R.T. Applications of process system engineering in palm-based biomass processing industry. Curr. Opin. Chem. Eng. 2013, 2, 448–454. [Google Scholar] [CrossRef]
- Grossmann, I.E. Challenges in the new millennium: Product discovery and design, enterprise and supply chain optimization, global life cycle assessment. Comput. Chem. Eng. 2004, 29, 29–39. [Google Scholar] [CrossRef]
- Mafakheri, F.; Nasiri, F. Modeling of biomass-to-energy supply chain operations: Applications, challenges and research directions. Energy Policy 2014, 67, 116–126. [Google Scholar] [CrossRef]
- Sahoo, K.; Mani, S.; Das, L.; Bettinger, P. GIS-based assessment of sustainable crop residues for optimal siting of biogas plants. Biomass Bioenergy 2018, 110, 63–74. [Google Scholar] [CrossRef]
- Atashbar, N.Z.; Labadie, N.; Prins, C. Modeling and optimization of biomass supply chains: A review and a critical look. IFAC-PapersOnLine 2016, 49, 604–615. [Google Scholar] [CrossRef]
- Chiew, Y.L.; Iwata, T.; Shimada, S. System analysis for effective use of palm oil waste as energy resources. Biomass Bioenergy 2011, 35, 2925–2935. [Google Scholar] [CrossRef]
- Theo, W.L.; Lim, J.S.; Ho, W.S.; Hashim, H.; Lee, C.T.; Muis, Z.A. Optimisation of oil palm biomass and palm oil mill effluent (POME) utilisation pathway for palm oil mill cluster with consideration of BioCNG distribution network. Energy 2017, 121, 865–883. [Google Scholar] [CrossRef]
- Hadiguna, R.A.; Tjahjono, B. A framework for managing sustainable palm oil supply chain operations: A case of Indonesia. Prod. Plan. Control 2017, 28, 1093–1106. [Google Scholar] [CrossRef]
- IIASA. “BeWhere”. Available online: www.iiasa.ac.at/bewhere%0A (accessed on 2 September 2018).
- Leduc, S. Development of an Optimization Model for the Location of Biofuel Production Plants. Ph.D. Thesis, Luleå University of Technology, Luleå, Sweden, 2009. [Google Scholar]
- Wetterlund, E. Interim Report Optimal Localization of Biofuel Production on a European Scale; IIASA Publ.: Laxenburg, Austria, 2010; p. 50. [Google Scholar]
- Rosenthal, R. GAMS-A User’s Guide; GAMS Development Corporation: Washington, DC, USA, 2017. [Google Scholar]
- Leduc, S.; Wetterlund, E.; Dotzauer, E.; Schmidt, J.; Natarajan, K.; Khatiwada, D. Policies and Modeling of Energy Systems for Reaching European Bioenergy Targets. In Handbook of Clean Energy Systems; John Wiley & Sons, Ltd.: Hoboken, NJ, USA, 2015. [Google Scholar]
- Mandova, H.; Leduc, S.; Wang, C.; Wetterlund, E.; Patrizio, P.; Gale, W.; Kraxner, F. Possibilities for CO2 emission reduction using biomass in European integrated steel plants. Biomass Bioenergy 2018, 115, 231–243. [Google Scholar] [CrossRef]
- Natarajan, K.; Leduc, S.; Pelkonen, P.; Tomppo, E.; Dotzauer, E. Optimal locations for second generation Fischer Tropsch biodiesel production in Finland. Renew. Energy 2014, 62, 319–330. [Google Scholar] [CrossRef]
- Khatiwada, D.; Leduc, S.; Silveira, S.; McCallum, I. Optimizing ethanol and bioelectricity production in sugarcane biorefineries in Brazil. Renew. Energy 2016, 85, 371–386. [Google Scholar] [CrossRef] [Green Version]
- Patrizio, P.; Leduc, S.; Chinese, D.; Dotzauer, E.; Kraxner, F. Biomethane as transport fuel - A comparison with other biogas utilization pathways in northern Italy. Appl. Energy 2015, 157, 25–34. [Google Scholar] [CrossRef]
- Hoo, P.Y.; Patrizio, P.; Leduc, S.; Hashim, H.; Kraxner, F.; Tan, S.T.; Ho, W.S. Optimal Biomethane Injection into Natural Gas Grid - Biogas from Palm Oil Mill Effluent (POME) in Malaysia. Energy Procedia 2017, 105, 562–569. [Google Scholar] [CrossRef]
- Garcia-Nunez, J.A.; Rodriguez, D.T.; Fontanilla, C.A.; Ramirez, N.E.; Lora, E.E.S.; Frear, C.S.; Stockle, C.; Amonette, J.; Garcia-Perez, M. Evaluation of alternatives for the evolution of palm oil mills into biorefineries. Biomass Bioenergy 2016, 95, 310–329. [Google Scholar] [CrossRef]
- Bank Indonesia. Data BI Rate—Bank Sentral Republik Indonesia. 2016. Available online: http://www.bi.go.id/en/moneter/bi-rate/data/Default.aspx (accessed on 24 October 2017).
- Krasovskii, A.; Khabarov, N.; Pirker, J.; Kraxner, F.; Yowargana, P.; Schepaschenko, D.; Obersteiner, M. Modeling burned areas in Indonesia: The FLAM approach. Forests 2018, 9, 437. [Google Scholar] [CrossRef]
- Global Forest Watch. Global Forest Watch Open Data Portal. Available online: http://data.globalforestwatch.org/datasets/palm-oil-mills (accessed on 23 October 2017).
- Khasanah, N.; van Noordwijk, M.; Ekadinata, A.; Dewi, S.; Rahayu, S.; Ningsih, H.; Setiawan, A.; Dwiyanti, E.; Octaviani, R. The Carbon Footprint of Indonesian Palm Oil Production. Available online: http://old.icraf.org/sea/Publications/files/policybrief/PB0047-12.pdf (accessed on 24 January 2019).
- Molenaar, J.W.; Persch-Orth, M.; Lord, S.; Taylor, C.; Harms, J. Diagnostic Study on Indonesian Oil Palm Smallholders. Available online: http://www.aidenvironment.org/media/uploads/documents/201309_IFC2013_Diagnostic_Study_on_Indonesian_Palm_Oil_Smallholders.pdf (accessed on 20 September 2017).
- Pardamean, M. Mengelola Kebun Dan Pabrik Kelapa Sawit Secara Profesional; Penebar Swadaya: Jakarta, Indonesia, 2014. [Google Scholar]
- Dowell, L.; Rosenbarger, A.; December, S.L. Palm Oil Mill Data: A Step Towards Transparency. 2015. Available online: https://www.wri.org/blog/2015/12/palm-oil-mill-data-step-towards-transparency (accessed on 15 June 2018).
- Hambali, E.; Rivai, M. The Potential of Palm Oil Waste Biomass in Indonesia in 2020 and 2030. IOP Conf. Ser. Earth Environ. Sci. 2017, 65, 012050. [Google Scholar] [CrossRef] [Green Version]
- IRENA. Renewable Energy Prospects: Indonesia, a REmap Analysis; IRENA: Abu Dhabi, UAE, 2017. [Google Scholar]
- McKendry, P. Energy Production from Biomass (Part 2): Conversion Technologies. Bioresour. Technol. 2002, 83, 47–54. [Google Scholar] [CrossRef]
- Rahayu, A.S.; Karsiwulan, D.; Trisnawati, H.I.; Mulyasari, S.; Rahardjo, S.; Hokermin, S.; Paraminta, V. Handbook POME-to-Biogas Project Development in Indonesia. Available online: https://www.winrock.org/wp-content/uploads/2016/05/CIRCLE-Handbook-2nd-Edition-EN-25-Aug-2015-MASTER-rev02-final-new02-edited.pdf (accessed on 24 January 2019).
- BioEnergy Consult. Biomass Market in Japan: Perspectives. 2018. Available online: https://www.bioenergyconsult.com/biomass-market-japan/ (accessed on 25 November 2018).
- Corley, R.; Tinker, P.B. The Oil Palm; Wiley: Backwell, UK, 2016. [Google Scholar]
- Golden Agri-Resources. Plantation to Mill in 24 h. 2017. Available online: https://goldenagri.com.sg/plantation-mill-24-hours/ (accessed on 14 October 2018).
- DIVA-GIS. GIS Data. Available online: http://www.diva-gis.org/gdata (accessed on 7 September 2018).
- BPS. BPS Database. Available online: http://www.bps.go.id/ (accessed on 7 September 2018).
- World Bank. Country Profile Indonesia: World Development Indicators. 2016. Available online: http://databank.worldbank.org/data/Views/Reports/ReportWidgetCustom.aspx?Report_Name=CountryProfile&Id=b450fd57&tbar=y&dd=y&inf=n&zm=n&country=IDN (accessed on 9 February 2018).
- Mesfun, S.; Leduc, S.; Patrizio, P.; Wetterlund, E.; Mendoza-Ponce, A.; Lammens, T.; Staritsky, I.; Elbersen, B.; Lundgren, J.; Kraxner, F. Spatio-temporal assessment of integrating intermittent electricity in the EU and Western Balkans power sector under ambitious CO2 emission policies. Energy 2018, 164, 676–693. [Google Scholar] [CrossRef]
- Harahap, F.; Silveira, S.; Khatiwada, D. Land allocation to meet sectoral goals in Indonesia—An analysis of policy coherence. Land Use Policy 2017, 61, 451–465. [Google Scholar] [CrossRef]
- Sher, F.; Pans, M.A.; Afilaka, D.T.; Sun, C.; Liu, H. Experimental investigation of woody and non-woody biomass combustion in a bubbling fluidised bed combustor focusing on gaseous emissions and temperature profiles. Energy 2017, 141, 2069–2080. [Google Scholar] [CrossRef]
- USEPA. EPA Climate Leadership—Emission Factors November 2015; USEPA: Washington, DC, USA, 2015. [Google Scholar]
- World Bank. State and Trends of Carbon Pricing 2018; World Bank: Washington, DC, USA, 2018. [Google Scholar]
- Agustira, M.A.; Rañola, R.F., Jr.; Sajise, A.J.U. Economic Impacts of Smallholder Oil Palm (Elaeis guineensis Jacq.) Plantations on Peatlands in Indonesia. J. Econ. Manag. Agric. Dev. 2016, 1, 105–123. [Google Scholar]
- Institute for Global Environmental Strategies (IGES). List of Grid Emission Factors, version 10.3. 2018. Available online: https://pub.iges.or.jp/pub/iges-list-grid-emission-factors (accessed on 25 November 2018).
- UNFCCC. PDD Co-Composting of EFB and POME—MG BioGreen Sdn.Bhd; UNFCCC: Bonn, Germany, 2006. [Google Scholar]
- Woittiez, L.S.; van Wijk, M.T.; Slingerland, M.; van Noordwijk, M.; Giller, K.E. Yield gaps in oil palm: A quantitative review of contributing factors. Eur. J. Agron. 2017, 83, 57–77. [Google Scholar] [CrossRef]
- NIST/SEMATECH. e-Handbook of Statistical Methods. 2013. Available online: http://www.itl.nist.gov/div898/handbook/ (accessed on 13 October 2018).
- Ong, H.C.; Mahlia, T.M.I.; Masjuki, H.H.; Honnery, D. Life cycle cost and sensitivity analysis of palm biodiesel production. Fuel 2012, 98, 131–139. [Google Scholar] [CrossRef]
- Posada, J.A.; Rincón, L.E.; Cardona, C.A. Design and analysis of biorefineries based on raw glycerol: Addressing the glycerol problem. Bioresour. Technol. 2012, 111, 282–293. [Google Scholar] [CrossRef]
- Moncada, J.; Tamayo, J.; Cardona, C.A. Evolution from biofuels to integrated biorefineries: Techno-economic and environmental assessment of oil palm in Colombia. J. Clean. Prod. 2014, 81, 51–59. [Google Scholar] [CrossRef]
- Pettersson, K.; Wetterlund, E.; Athanassiadis, D.; Lundmark, R.; Ehn, C.; Lundgren, J.; Berglin, N. Integration of next-generation biofuel production in the Swedish forest industry—A geographically explicit approach. Appl. Energy 2015, 154, 317–332. [Google Scholar] [CrossRef]
- Solikhah, M.D.; Kismanto, A.; Raksodewanto, A.; Peryoga, Y. Profitability and sustainability of small—Medium scale palm biodiesel plant. AIP Confer. Proc. 2017, 1855, 070005. [Google Scholar]
- Ng, R.T.L.; Hassim, M.H.; Ng, D.K.S.; Tan, R.R.; El-Halwagi, M.M. Multi-objective design of industrial symbiosis in palm oil industry. Comput. Aided Chem. Eng. 2014, 34, 579–584. [Google Scholar]
- Martin, M.; Harris, S. Prospecting the sustainability implications of an emerging industrial symbiosis network. Resour. Conserv. Recycl. 2018, 138, 246–256. [Google Scholar] [CrossRef]
- GoI. Nationally Determined Contribution Republic of Indonesia; GoI: Jakarta, Indonesia, 2016. [Google Scholar]
- PLN. RUPTL PLN 2016–2025; PLN: Jakarta, Indonesia, 2016. [Google Scholar]
- Malusà, E.; Pinzari, F.; Canfora, L. Effi cacy of Biofertilizers: Challenges to Improve Crop Production. In Microbial Inoculants in Sustainable Agricultural Productivity: Vol. 2: Functional Applications; Springer: New Delhi, India, 2016; Volume 2016, pp. 1–308. [Google Scholar]
Figure 1.
Simplified illustration of palm biomass residue generated from one hectare of oil palm plantation aimed at palm oil production. Note: conversion rate per one-hectare plantation was obtained during fieldwork carried out in a palm oil mill in Sumatra in 2016. Fiber is mesocarp fibers (PMF), effluent is palm oil mill effluent (POME), shell is palm kernel shells (PKS), and empty fruit bunches (EFB).

Figure 2.
BeWhere model structure for palm oil in Indonesia.

Figure 3.
Total bio-products generated in palm oil mills (Mt/y). Legend: Sc-ref: Incorporating the government policy to foster the utilization of palm biomass residue; Sc-yield: Improving the yield of small-scale plantations; Sc-grid: Improving bioelectricity delivery; Sc-yield-grid: Combination of Sc-ref and Sc-grid.

Figure 4.
Total excess power to the grid (TWh/y). Legend: Sc-ref: Incorporating the government policy to foster the utilization of palm biomass residue; Sc-yield: Improving the yield of small-scale plantations; Sc-grid: Improving bioelectricity delivery; Sc-yield-grid: Combination of Sc-ref and Sc-grid.

Figure 5.
Total installed capacity of CHP plants per district, Sc-ref (left) and Sc-yield-grid (right).
Figure 5.
Total installed capacity of CHP plants per district, Sc-ref (left) and Sc-yield-grid (right).

Figure 6.
Total costs of a more efficient palm oil supply chain (billion USD/y). Legend: Sc-ref: Incorporating the government policy to foster the utilization of palm biomass residue; Sc-yield: Improving the yield of small-scale plantations; Sc-grid: Improving bioelectricity delivery; Sc-yield-grid: Combination of Sc-ref and Sc-grid.

Figure 7.
Total costs, income, and profits of a more efficient palm oil supply chain (billion USD/y). Legend: Sc-ref: Incorporating the government policy to foster the utilization of palm biomass residue; Sc-yield: Improving the yield of small-scale plantations; Sc-grid: Improving bioelectricity delivery; Sc-yield-grid: Combination of Sc-ref and Sc-grid.

Figure 8.
GHG emissions from a more efficient palm oil supply chain (MtCO2eq/y). Legend: Sc-ref: Incorporating the government policy to foster the utilization of palm biomass residue; Sc-yield: Improving the yield of small-scale plantations; Sc-grid: Improving bioelectricity delivery; Sc-yield-grid: Combination of Sc-ref and Sc-grid.

Figure 9.
Emissions reduction from a more efficient palm oil supply chain (MtCO2eq/y). Legend: Sc-ref: Incorporating the government policy to foster the utilization of palm biomass residue; Sc-yield: Improving the yield of small -scale plantations; Sc-grid: Improving bioelectricity delivery; Sc-yield-grid: Combination of Sc-ref and Sc-grid.

Figure 10.
Technology abatement cost (bar chart, primary Y-axis) and cumulative emissions reduction (line, secondary Y-axis) of Sc-ref.
Figure 10.
Technology abatement cost (bar chart, primary Y-axis) and cumulative emissions reduction (line, secondary Y-axis) of Sc-ref.

Figure 11.
Technology abatement cost (bar chart, primary Y-axis) and cumulative emissions reduction (line, secondary Y-axis) of Sc-yield-grid.
Figure 11.
Technology abatement cost (bar chart, primary Y-axis) and cumulative emissions reduction (line, secondary Y-axis) of Sc-yield-grid.

Figure 12.
Normal probability plots of the effects on total cost (left) and total profit (right). Legend: A: Mill operating hours; B: Palm oil extraction rate; C: Raw material production cost of large-scale plantations; D: Capital cost of 1 MW CHP system; E: Transport cost.
Figure 12.
Normal probability plots of the effects on total cost (left) and total profit (right). Legend: A: Mill operating hours; B: Palm oil extraction rate; C: Raw material production cost of large-scale plantations; D: Capital cost of 1 MW CHP system; E: Transport cost.

Figure 13.
Plots of the main effects and significant two-way interactions on total cost.

Figure 14.
Plots of the main effects and significant two-way interactions on total profit.

Table 1.
Physical characteristics of small-scale and large-scale plantations in Sumatra, Indonesia.
| Item | Unit | Small-Scale Plantation | Large-Scale Plantation |
|---|---|---|---|
| Total Fresh Fruit Bunches (FFB) production in Sumatra, 2015 | Mt/y | 41.9 [1] | 54.5 [1] |
| Total plantation area in Sumatra, 2015 | Mha | 3.33 [1] | 3.24 [1] |
| Average productivity, 2015 | t/ha | 13.57 [1] | 18.82 [1] |
| Feedstock production cost a | USD/t | 98.14 | 75.52 |
| Nfertilizer consumption b | kg/ha | 92.94 [33] | 138.72 [33] |
Notes: a The production cost comprises the cost of fertilizers, field maintenance, and harvesting, as well as general expenses. The feedstock production cost per year (y) per tFFB is 1332 USD/ha for small-scale plantations [34] and 1421 USD/ha/y for large-scale plantations [35], multiplied with the respective average productivity. Notice that the higher cost for large-scale plantations is related to higher fertilizer use. b The amount of nitrogen fertilizer applied was calculated based on an equation by Khasanah [33] for the relation between nitrogen fertilizer applied and the plantation yield in Indonesia: y = 1.1386x2 − 28.157x + 265.36, where y is the amount of nitrogen fertilizer applied and x is the plantation yield.
Table 2.
Different parameters of the scenarios analyzed for the palm biomass supply chain in Sumatra, Indonesia.
Table 2.
Different parameters of the scenarios analyzed for the palm biomass supply chain in Sumatra, Indonesia.
| Scenario | Parameters Related to Small-Scale Plantations | Number of Mills Connected to Power Grid | Average Annual Mill Operating Hours (h/y) | Scenario Description | |||
|---|---|---|---|---|---|---|---|
| Plantation Yield | Nfertilizer Consumption | Emissions | Raw Material Production Cost * | ||||
| tFFB/ha | kg/ha | tCO2eq/tFFB | USD/tFFB | ||||
| Sc-ref | 13.57 | 92.94 | 0.089 | 98.14 | 65 | 4800 | Reference scenario incorporating government policy to foster the utilization of palm biomass residue |
| Sc-yield | 18.82 | 138.72 | 0.096 | 81.93 | 65 | 5000 | Improved yield in small-scale plantations, which also affects fertilizer consumption and associated emissions |
| Sc-grid | 13.57 | 92.94 | 0.089 | 98.14 | 415 (all mills) | 4800 | All palm oil mills are connected to the nearest distribution transformers |
| Sc-yield-grid | 18.82 | 138.72 | 0.096 | 81.93 | 415 (all mills) | 5000 | Combines the improvement specified in Sc-yield and Sc-grid |
Note: * The production cost consists of the cost of fertilizers, field maintenance and harvesting, as well as general expenses. The feedstock production cost per tFFB for small-scale plantations is based on 1332 USD/ha/y for the reference value [34] and 1542 USD/ha/y for higher yields (using a similar fertilizer cost as for large-scale plantations). The cost per hectare is multiplied with the respective average productivity.
Table 3.
Upper and lower values of variables for the sensitivity analyses.
| Factor | Description | Unit | −1 | Ref. | +1 |
|---|---|---|---|---|---|
| A | Mill operating hours | h/y | 4000 | 4800 | 4900 |
| B | Palm oil extraction rate | tCPO/tFFB | 0.18 | 0.2 | 0.25 |
| C | Raw material production cost of large-scale plantations | USD/tFFB | 65 | 75.52 | 98 |
| D | Capital cost of 1 MW Combined Heat and Power (CHP) system | USD/MWh | 17 | 23.65 | 30 |
| E | Transport cost | USD/tFFB/km | 0.1 | 0.2 | 0.3 |
© 2019 by the authors. Licensee MDPI, Basel, Switzerland. This article is an open access article distributed under the terms and conditions of the Creative Commons Attribution (CC BY) license (http://creativecommons.org/licenses/by/4.0/).
Share and Cite
MDPI and ACS Style
Harahap, F.; Leduc, S.; Mesfun, S.; Khatiwada, D.; Kraxner, F.; Silveira, S. Opportunities to Optimize the Palm Oil Supply Chain in Sumatra, Indonesia. Energies 2019, 12, 420. https://doi.org/10.3390/en12030420
AMA Style
Harahap F, Leduc S, Mesfun S, Khatiwada D, Kraxner F, Silveira S. Opportunities to Optimize the Palm Oil Supply Chain in Sumatra, Indonesia. Energies. 2019; 12(3):420. https://doi.org/10.3390/en12030420
Chicago/Turabian StyleHarahap, Fumi, Sylvain Leduc, Sennai Mesfun, Dilip Khatiwada, Florian Kraxner, and Semida Silveira. 2019. "Opportunities to Optimize the Palm Oil Supply Chain in Sumatra, Indonesia" Energies 12, no. 3: 420. https://doi.org/10.3390/en12030420
Note that from the first issue of 2016, this journal uses article numbers instead of page numbers. See further details here.