Study on the Coupled Dynamic Responses of a Submerged Floating Wind Turbine under Different Mooring Conditions


1
State Key Laboratory of Hydraulic Engineering Simulation and Safety, Tianjin University, Tianjin 300072, China
2
School of Civil Engineering, Tianjin University, Tianjin 300072, China
*
Author to whom correspondence should be addressed.
Energies 2019, 12(3), 418; https://doi.org/10.3390/en12030418
Submission received: 25 December 2018
/
Revised: 23 January 2019
/
Accepted: 24 January 2019
/
Published: 29 January 2019
(This article belongs to the Special Issue Design, Fabrication and Performance of Wind Turbines 2019)
Abstract
:A submerged floating offshore wind turbine (SFOWT) is proposed for intermediate water depth (50–200 m). An aero-hydro-servo-elastic-mooring coupled dynamic analysis was carried out to investigate the coupled dynamic response of the SFOWT under different mooring conditions subjected to combined turbulent wind and irregular wave environments. The effects of different parameters, namely, the tether length, pretension and the tether failure, on the performance of SFOWT were investigated. It is found that the tether length has significant effects on the motion responses of the surge, heave, pitch and yaw but has little effects on the tower fore-aft displacement and the tether tensions. The increased pretension can result in the increase of the natural frequencies of surge, heave and yaw significantly. The influence of tether failure on the SFOWT performance was investigated by comparing the responses with those of the intact mooring system. The results show that the SFOWT with a broken tether still has a good performance in the operational condition.
1. Introduction
Offshore wind energy has become an increasingly attractive solution for energy conversion due to the enormous energy potential associated with the vast offshore areas, higher wind speeds, more consistent wind patterns, decreased noise and visual effects for human population centers [1,2]. Most of offshore wind turbines are installed in shallow water (<50 m) on the bottom-fixed foundations, such as monopiles, gravity-based, jackets and bucket foundations [3,4,5]. With the development of offshore wind energy, it is inevitable for a wind farm to move towards the deeper water to harvest stronger and superior wind resource [6]. At the intermediate water depth, the bottom-fixed foundations will no longer be economically feasible. A variety of FOWT concepts have been proposed in the last two decades, such as spar, semi-submersible and tension leg platforms (TLPs) [7,8,9,10]. Several of these concepts have already outgrown the prototype status and will go into pre-serial production shortly, such as the WindFloat semi-submersible, SWAY [11,12,13]. In late 2017 the world’s first floating wind farm, Hywind Scotland pilot park, has been built near Buchan Deep, 25 km off the northeast coast of Peterhead in Scotland, at a water depth of 95–120 m, with five 6 MW floating wind turbines.
Before FOWTs can be widely applied, it has several critical challenges to be addressed. The main challenge is to combine the stability, acceptable motions, mooring and low costs [14,15]. Most of the FOWT concepts are evolved from offshore oil & gas platforms. The loads from offshore wind turbines differ significantly from the oil & gas structures and are more dynamic. Given the payload of the wind turbine and nacelle weighing approximately 700 tons for a 5 MW wind turbine and producing a maximum steady-state thrust of approximately 800 kN at 90 m above sea level, the FOWT has a raised center of gravity and a large overturning moment, which will severely challenge its stability. Several studies were conducted to compare and optimize the designs of support structures and mooring systems [16,17,18]. TLPs have been proposed as a possible solution for intermediate water depths, since the taut mooring system may be better suited for relatively shallow water depths than a catenary mooring system. Meanwhile, the platform motions are expected to be reduced compared to other floating concepts [1,19,20,21].
FOWT systems are complicated and dynamic due to time-variant environmental loads from wind, wave, current and mooring tension acting on a flexible integrated structure with a wide range of natural frequencies, coupled with the complex control strategy of the wind turbine. How to accurately predict FOWT’s system dynamic responses excited by variable loads is one of the primary issues in the design, which requires multidisciplinary consideration of wind turbine aerodynamics, floating platform hydrodynamics, structural mechanics and control systems. In recent years, a number of researches have been carried out on the dynamic responses under various environmental conditions. Several coupled codes have been developed to address the challenges of the coupling wave and wind loads and the choice of blade-pitch control strategy [22,23], such as FAST developed by NREL [24], HAWC2 developed by DTU Wind Energy [25], SIMO-RIFLEX-AeroDyn developed by NTNU [26].
In this paper, a submerged floating offshore wind turbine (SFOWT) is proposed to support a 5 MW turbine and withstand harsh environmental conditions in intermediate water depth [27]. The SFOWT is self-stabilized in the transportation and installation phases due to its relatively large waterline area, like a semi-submersible. It has a sufficient restoring moment in ballasted conditions and can thus be wet-towed together with the wind turbine from the quayside to the installation site. The main structure of the SFOWT, cylinder-shaped pontoons and horizontal pontoons, is submerged with a relatively small waterline area of approximately 51.5 m2 in the operation phase, like a spar, which can reduce its wave force and mean drift force. The SFOWT is stabilized and positioned by the taut tethers, like a TLP, which means limited platform motions are expected without a deep draft or large footprint for spread mooring system.
The stability of SFOWT is achieved from the mooring system, which means mooring conditions have a significant influence on the motion response of SFOWT. Although a lot of research on the dynamic response of FOWT has been investigated, there are few studies regarding the effect of various design mooring variables on system responses. This paper discusses the effects of mooring conditions on the SFOWT system’s performance under the combined actions of wind and wave. Frequency-domain analysis and time-domain method were employed to study the hydrodynamic behavior of the SFOWT by means of two simulation tools, SESAM and FAST, which are able to perform fully coupled time-domain aero-hydro-servo-elastic simulations for the system [24,28,29].
The paper is organized as follows. Section 2 briefly describes the configuration of the SFOWT system. Section 3 introduces the numerical methods that are used for fully coupled dynamic analysis and environment conditions. Section 4 discusses the dynamic responses of the SFOWT under different mooring conditions and Section 5 summarizes the results.
2. Configuration of the Submerged Floating Wind Turbine
The SFOWT consists of a wind turbine, a tower, a floating platform and a mooring system, as illustrated in Figure 1. The coordinate system and main dimensions of the SFOWT platform are shown in Figure 2. The NREL-5 MW wind turbine, designed by National Renewable Energy Laboratory, is employed for the analysis. Its principal properties are given in Table 1 [30]. The floating platform is composed of one column to support the wind turbine and four separated cylinder-shaped pontoons connected by four rectangular horizontal pontoons. The column and pontoons are interconnected by cross braces. The mooring system consists of 4 sets of vertical tethers and suction anchors to maintain the position of the SFOWT system. The principal properties of the SFOWT and the mooring system are listed in Table 2 and Table 3, respectively.
3. Numerical Modeling and Environmental Conditions
The equation of the SFOWT motion in the time domain can be expressed as [3,19,31]:
where denotes the mass matrix of the SFOWT, is the added mass at infinite frequency, , and are the vectors of six degree of freedom of displacements, velocities and accelerations of the SFOWT, respectively, is the retardation function, which can be given by , is the liner radiation damping matrix, is the hydrostatic stiffness matrix, is the wave exciting forces, is the nonlinear drag force, is the wind induced forces including aerodynamic force and tower drag force, is the restoring force provided by the tethers.
can be expressed as [32,33]:
where K is the stiffness matrix to the center of gravity, T is the displacement transformation matrix, is the stiffness matrix to the center of the body bottom, can be expressed as follows:
where the components are given by [32,33]:
t denotes the tether pretension, B and G are the buoyance and gravity of the SFOWT, respectively, l is the tether length, is the mean vertical distance between the upper fairlead and seabed, is the water density, g is the gravitational acceleration, is the waterline area of SFOWT, , , and are the displacements of surge and sway and the angle of yaw, respectively, r is the horizontal distance between the center of the column and the center of cylinder-shaped pontoon, and are the inertia moment of the waterline about x-axis and y-axis, respectively, and are the inertia moment of the SFOWT about x-axis and y-axis, respectively, and are the rotational angles of roll and pitch, , and are the vertical coordinates of the buoyancy center, the upper fairlead and the center of gravity, respectively, is the increment of the set-down motion, , is vertical distance between the upper fairlead and the center of gravity.
The time domain analysis tool FAST, developed by the National Renewable Energy Laboratory (NREL) was utilized to perform fully coupled time-domain aero-hydro-servo-elastic simulations of the SFOWT system [24]. Five modules of FAST, namely, AeroDyn, HydroDyn, ServoDyn, ElastoDyn and MAP++, were employed to simulate the dynamic responses of the SFOWT, as illustrated in Figure 3. The aerodynamic loads were obtained by AeroDyn [34]. AeroDyn accounted for the influence of wake via induction factors based on the quasi-steady BEM (blade element momentum) theory. The effect of skewed wake was considered by using the Pitt and Peters model. And the tower shadow effect was also considered based on the potential flow theory. Regarding the drag load acting on the tower, it was determined by the tower diameter, drag coefficient and the local relative wind velocity. The hydrodynamic coefficients, such as the added mass, potential damping, hydrostatic restoring stiffness and wave excitation force transfer function, were calculated in frequency domain using the potential-based 3D diffraction/radiation code HydroD/Wadam and then applied in time domain using the convolution technique. Then these hydrodynamic coefficients were fed to the HydroDyn module in FAST [9]. MAP++ was used to model the mooring system. ServoDyn regulates the rotor rotational speed using the generator torque controller below the rated wind speed and the blade pitch angle based on a blade-pitch control algorithm above the rated wind speed. The platform hull was simulated as a rigid body and the tower and blades were simulated as flexible finite elements in ElastoDyn module.
The overall system performances of SFOWT were simulated under different mooring conditions. The wave and wind propagated along the positive surge direction. JONSWAP spectrum was employed to generate the irregular wave time series. Turbsim developed by NREL was used to generate the 3D turbulent wind field [35]. The most representative sea state with the highest occurrence probabilities was selected for analyzing SFOWT performance with a significant wave height of 3 m, a spectral peak period of 10s and rated wind speed of 11.4 m/s at a zero-degree heading. The time series of wave elevation and wind velocity are shown in Figure 4 and Figure 5, respectively. And currents were not considered in the present study for convenience.
4. Results and Discussion
4.1. Length of Tethers
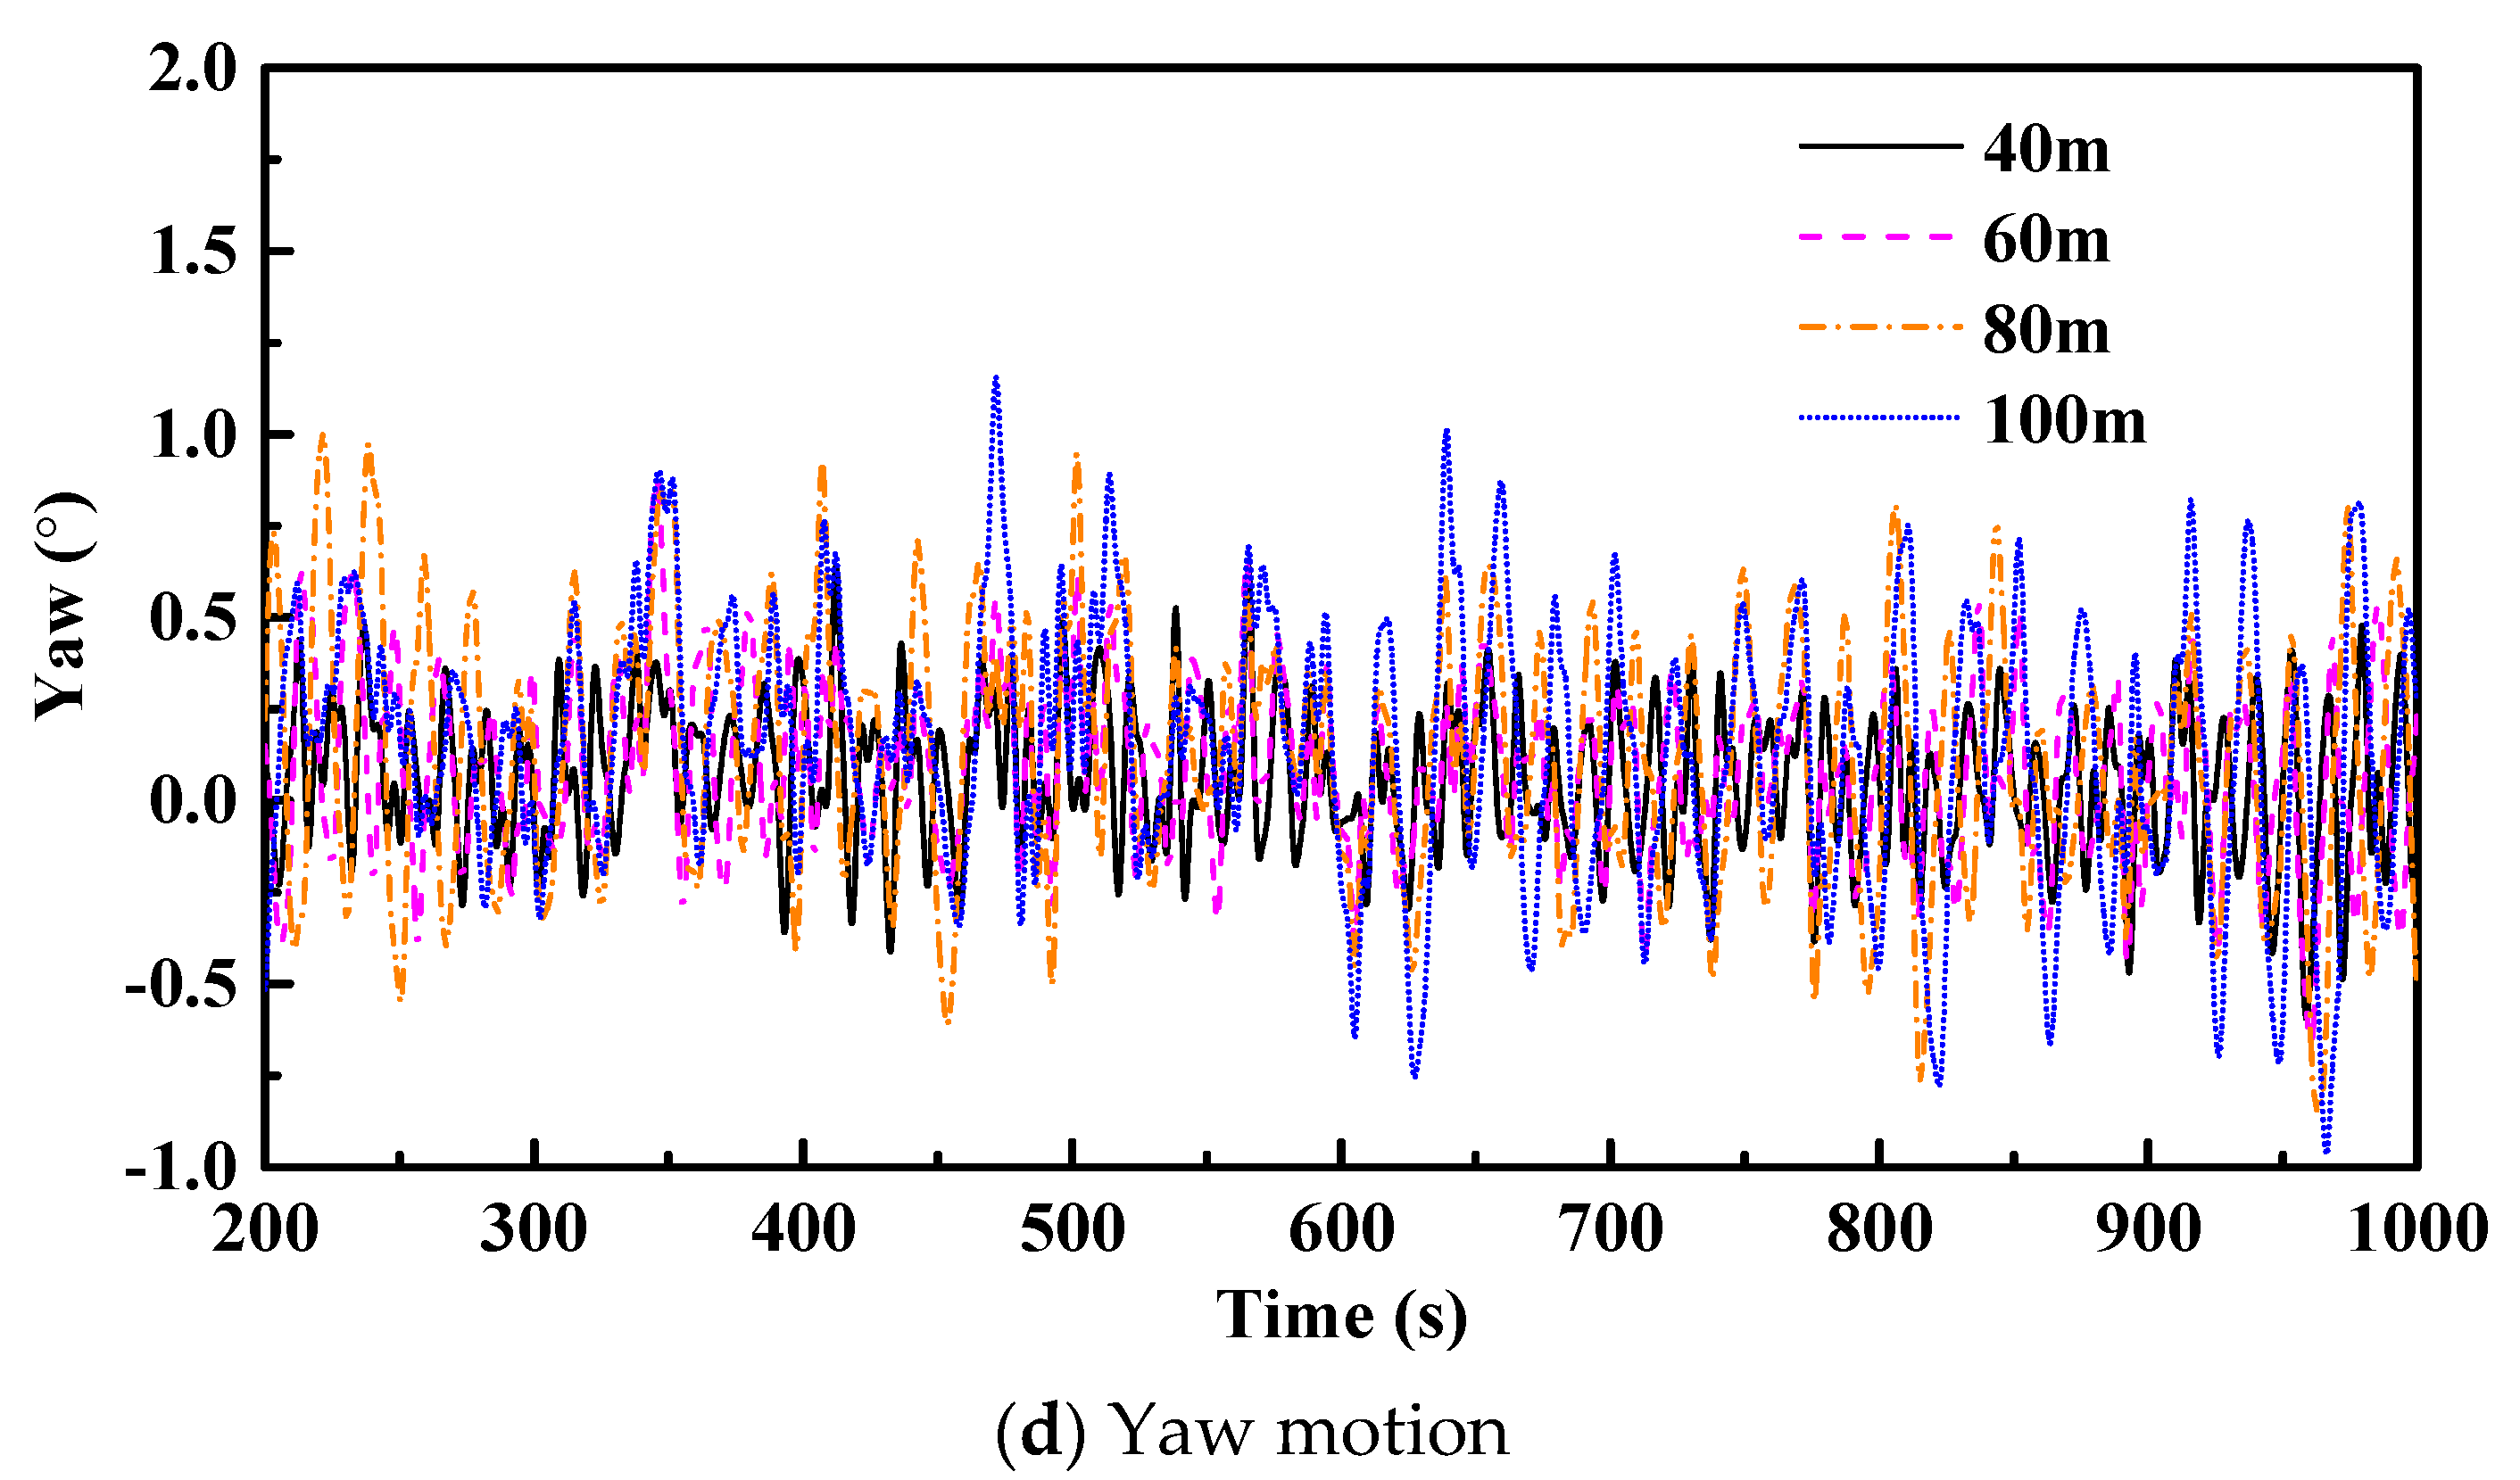
To study the influence of the tether length on the dynamic response of the SFOWT, several tether lengths of 40 m, 60 m, 80 m and 100 m were studied in operational condition with the same draft of 20 m, in other words, the water depth varied from 60 m to 120 m. Figure 5 shows the time series of the surge, heave, pitch and yaw responses of the SFOWT with different tether lengths. The time series of tower fore-aft displacement and tension of tether 1# (in the downstream direction) are presented in Figure 6 and Figure 7, respectively. An overview of the maximum, minimum, mean values and standard deviation for the platform motions, tower fore-aft displacement, normalized tether tension is illustrated in Figure 8 for different lengths of tether. The tether tensions are normalized as the ratio of tension to pretension (3500 kN).
An increase in the tether length will result in a decrease in the mooring system stiffness. As shown in Figure 6a and Figure 9a, the mean surge increase with the growth of tether length due to the reduced tether stiffness. With the increase of the tether length, ranging from 40 m up to 100 m, the mean surge increases by 154.3%, from 0.85 m up to 2.16 m. As can be seen from Figure 6b and Figure 9b, the largest heave amplitude and standard deviation reach 0.15 m and 0.02 m, respectively, which appear when the tether length is 40 m. As the tether length increases from 60 m up to 100 m, the maximum heave amplitude and mean heave amplitude increase by 57.5% and 60.0%, respectively. The pitch motion increased due to the increased tether length, the maximum and mean pitch increase by 137.5% and 154.1%, respectively, as the tether length increases from 40 m up to 100 m. However, the pitch motion is overall low, below 0.10°. The yaw motion response shows the same variation trend of the pitch motion as shown in Figure 6d and Figure 9d. The maximum and mean yaw increase by 81.1% and 157.3%, respectively, as the tether length increases from 40 m up to 100 m. The variation of tether length has little effect on the tower fore-aft displacement and the tether tensions.
4.2. Pretension of Tethers
The restoring forces of the taut mooring system are provided by the tether tension [7], therefore, the variations in tether pretension have direct effects on the dynamic response of the SFOWT. To complete the pretension comparisons, 4 pretensions of 1500 kN, 2500 kN, 3500 kN and 4500 kN for each tether were simulated by adjusting the base ballast. The SFOWT with a tether length of 80 m was selected for analysis.
The natural frequency of surge, heave, pitch and yaw in different pretension conditions are plotted in Figure 10. It can be observed that the natural frequency of the SFOWT in vertical plane motions (heave and pitch) are much higher than others in horizontal plane motions (surge and yaw). Except for a slight increase in the natural frequency of pitch, the natural frequencies in other degrees of freedom increase significantly owing to the increased pretension.
Time series of the SFOWT platform motions, tower fore-aft displacement and tether tension in different pretension conditions are shown in Figure 11, while corresponding statistics are presented in Figure 12. It is obvious that the pretension has significant effects on the behaviors of the SFOWT. The restoring force increases with the increase of pretension and the motion in surge, heave, pitch and yaw reduce significantly first but with the increase of pretension, the restoring force provided by the tether is large enough, the effects of pretension on reducing the responses of the SFOWT are decreased. For instance, the maximum surge motion reduces by 40.8%, from 6.25 m to 3.70 m. Meanwhile, the maximum heave motion reduces by 60.7%, from −0.10 m to −0.25 m, when the pretension increases from 1500 kN to 3500 kN. However, when the pretension increases from 3500 kN to 4500 kN, the reduction rates of motions in surge and heave drops sharply to 9.7% and 23.0%, respectively. The pitch responses are relatively small, the motion range of pitch decreased obviously with the increase of pretension, from 1500 kN to 3500 kN. Interestingly, when the pretension reaches 4500 kN, it grows up slightly instead of going down. The pretension variation has a minor effect on the responses of the tower fore-aft displacement, the maximum fore-aft displacement reduces by 9.7% when the pretension increases from 1500 kN to 4500 kN. The standard deviations for the tension have small changes with the increase of pretension. When the pretension is 1500 kN, the lowest tension of tether 1# is only 281.6 kN, close to the relaxed state, which is the limit state of the mooring system. So increasing the pretension is conducive to improve the performance of the SFOWT in the case of ensuring the safety of the mooring system.
The power spectra of the surge, heave, pitch and yaw motions are shown in Figure 13. The spectra of motions are mainly dominated by the resonant response, wind frequency response and wave frequency response in the operational condition. The variation of pretension also introduces large discrepancies of power spectra. As shown in the Figure 13a, the surge motion is mainly dominated by the surge resonant response, especially for that with pretension of 1500 kN. The wind and wave frequency responses are smaller than the surge resonant response. The heave response in the range of low frequency and wave frequency is similar to its surge motion, as shown in Figure 13b. This is because the heave motion is mainly caused by the set-down effect induced by the surge motion. Natural frequency of heave motion is much larger than the wave frequency, which avoids having an obvious resonance response with the wave. The pitch motion is mainly dominated by the wave and wind frequency responses. The yaw motion is mainly concentrated in the natural frequency of yaw motion and the response of yaw motion decreases with the increase of pretension.
4.3. Tether Failure
Two mooring condition scenarios of intact mooring system and one of the tethers broken have been simulated with the tether length of 80 m and pretension of 3500 kN. The layout of tethers is illustrated in the Figure 1. There are 4 sets of tethers, each including 2 tethers. Tethers 3# (7#) and 4# (8#) are located upstream of the incident wave direction and tethers 1# (5#) and 2# (6#) are located in the downstream direction. Figure 14 gives the time series of tether tensions and corresponding statistics. As can be seen in the figure, the tensions of upstream tethers are higher than those of the downstream tethers due to the influence of trim, of which tether 3# (7#) has the greatest tension. Tether may break in response to the harsh environment or repetitive fatigue load [31]. Tether 7#, one of the tethers with the greatest tension, is intentionally broken. After the loss of tether 7#, the remaining tethers keep the SFOWT at a new equilibrium position. The tether failure may result in significant changes to the performance of the SFOWT and the impact of the tether failure on the dynamic response of the SFOWT was investigated.
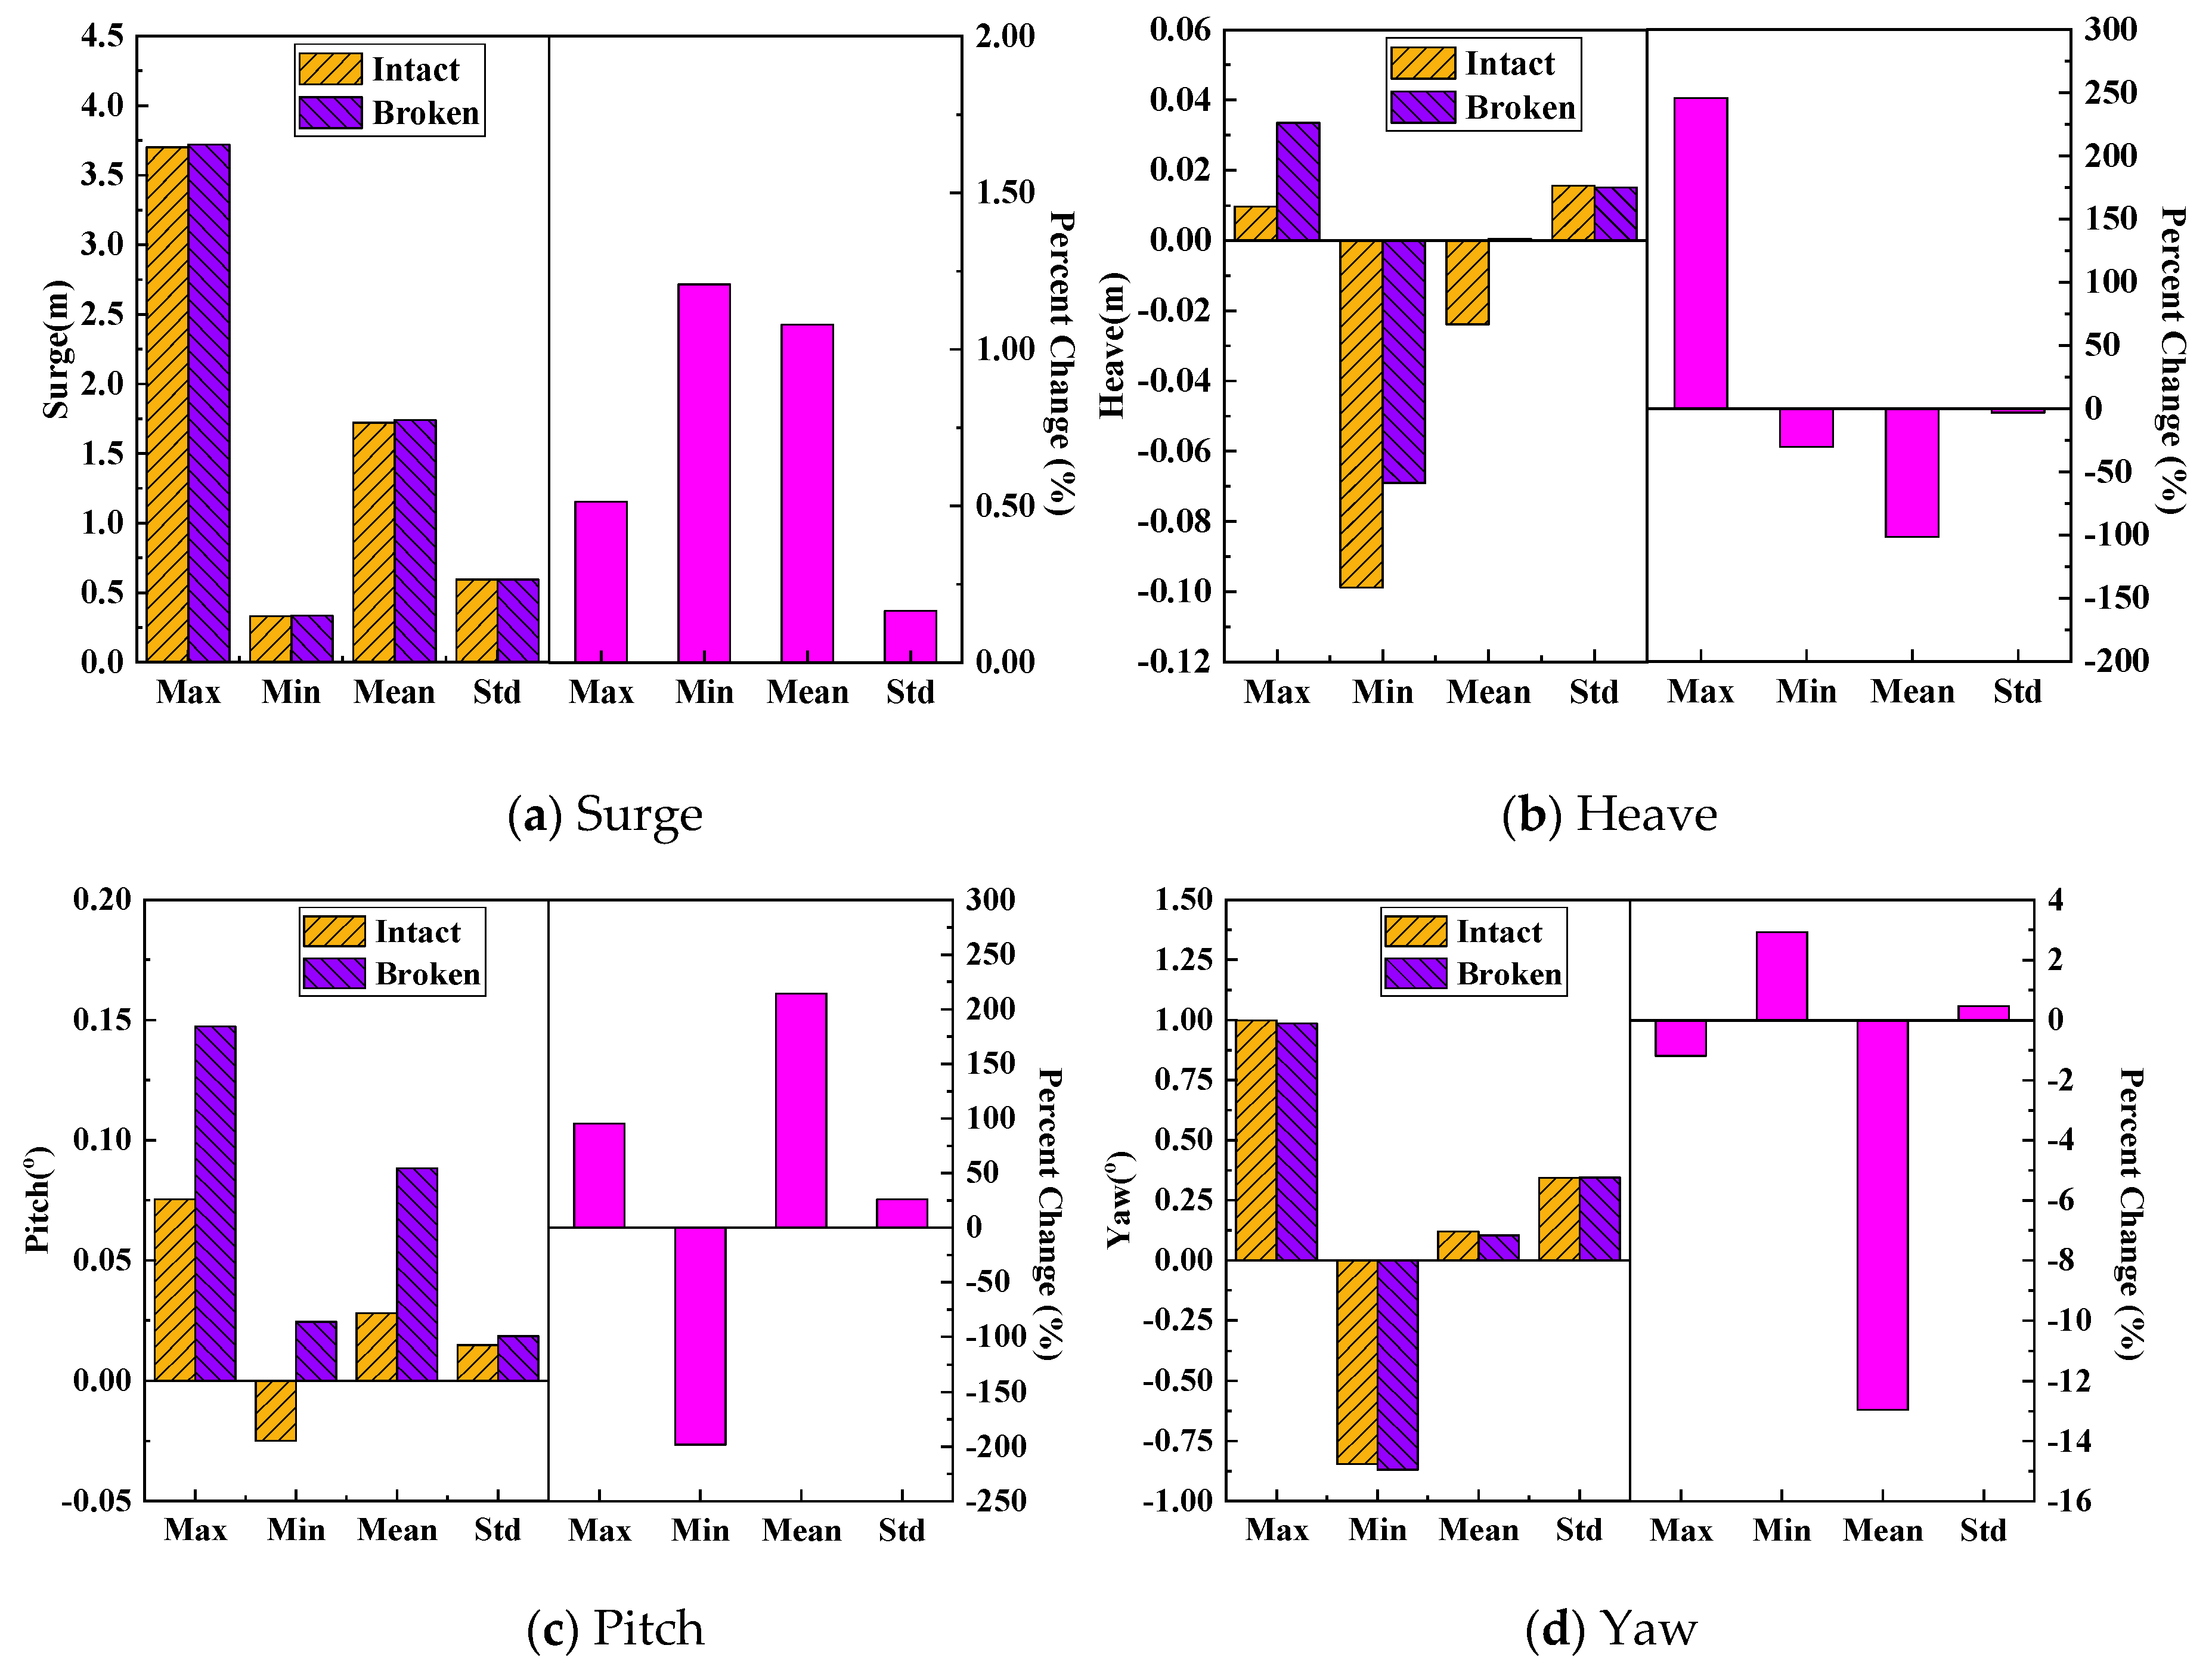
The changes in the tether tension are presented in Figure 15 and Figure 16. The loss of tether 7# results in a significant increase in the tensions of remaining tethers except tether 1#, which is in the downward direction. The maximum tether tension, occurs at the tether 3#, reaches 2.22 times pretension after the failure, which has 1.71 times safety factor for the tether breaking strength. Figure 17 shows the comparison of dynamic response statistics and percent change. The tether 7# failure results in changes in the SFOWT performance, such as heave and pitch motions. As shown in the Figure 17b, the minimum heave motion decreases by 30.2%, from −0.099 m to −0.069 m after the failure. Meanwhile, the maximum and mean pitch motions increase by 95.4% and 214.5%, respectively. The increase in pitch motion explains the reason for the decrease in tension of tether 1#. The surge and yaw motions show little change after the failure. The SFOWT with a broken tether still has a good performance in the operational condition, which means the restoring force provided by the remaining tethers is sufficient.
5. Conclusions
This paper presents an investigation into the coupled dynamic responses of a submerged floating wind turbine (SFOWT) under different mooring conditions. The time domain analysis tool FAST is utilized to perform fully coupled time-domain aero-hydro-servo-elastic simulations of the SFOWT system.
The influence of tether length on the performance of the SFOWT was investigated. An increase in the tether length will result in a decrease in the stiffness of the mooring system. The surge and pitch motions increase significantly, as the tether length increases from 40 m to 100 m. The maximum heave amplitude and mean heave amplitude increase by 57.5% and 60.0%, respectively, as the tether length increases from 60 m up to 100 m. It is worth noting that the largest heave amplitude and standard deviation appear when the tether length is 40 m. The variation of tether length has little effect on the tower fore-aft displacement and the tether tension.
An increase in pretension will result in an increase in restoring force. As expected, the pretension has significant effects on the performance of the SFOWT. The natural frequencies of surge, heave and yaw increase significantly owing to the increase of pretension and the natural frequency of pitch has a slight increase. The motions in surge, heave, pitch and yaw obviously reduced with the increase of pretension until the pretension is large enough. The pretension variation has a minor effect on the responses of the tower fore-aft displacement. The standard deviations for the tension have small changes with the increase of pretension. The power spectra of motions are mainly dominated by the resonant response, wind frequency response and wave frequency response in the operational condition. The variation of pretension also introduces large discrepancies of power spectra. The coupled behavior among the surge and heave motion is also captured in the spectra. The motions of the SFOWT are not a simple linear superposition of wind-wave induced motions and complex nonlinear motion responses may occur when coupled with other multiple degrees of freedom.
The influence of a tether failure on the SFOWT performance was investigated by comparing the responses with those of the intact mooring system. The loss of tether 7# results in a significant increase in tensions of remaining tethers except tether 1#, which is in the downward direction. The maximum tension of tether reaches 2.22 times pretension and has 1.71 times safety factor after the failure. The tether failure results in the increase of pitch motion response. However, the surge and yaw show little change. It is worth noting that the SFOWT with a broken tether still has a good performance in the operational condition.
Author Contributions
Conceptualization, C.L. and H.D.; methodology, C.L.; software, C.L. and Y.L.; writing—original draft preparation, C.L.; writing—review and editing, C.L.
Funding
The financial support from the Innovation Method Fund of China (Grant No. 2016IM030100), the Tianjin Municipal Natural Science Foundation (Grant No. 18JCYBJC22800) and State Key Laboratory of Coastal and Offshore Engineering (Grant No. LP1709).
Conflicts of Interest
The authors declare no conflict of interest.
References
- Bachynski, E.E. Design and Dynamic Analysis of Tension Leg Platform Wind Turbines. Ph.D. Thesis, Norwegian University of Science and Technology, Trondheim, Norway, 2014. [Google Scholar]
- Zhang, P.-Y.; Guo, Y.-H.; Liu, Y.-G.; Ding, H.-Y.; Le, C.-H. Model tests on sinking technique of composite bucket foundations for offshore wind turbines in silty clay. J. Renew. Sustain. Energy 2015, 7, 033113. [Google Scholar] [CrossRef]
- Han, Y.-Q.; Le, C.-H.; Ding, H.-Y.; Cheng, Z.-S.; Zhang, P.-Y. Stability and dynamic response analysis of a submerged tension leg platform for offshore wind turbines. Ocean Eng. 2017, 129, 68–82. [Google Scholar] [CrossRef]
- Wang, X.-F.; Yang, X.; Zeng, X.-W. Seismic centrifuge modelling of suction bucket foundation for offshore wind turbine. Renew. Energy 2017, 114, 1013–1022. [Google Scholar] [CrossRef]
- LeBlanc, C. Design of Offshore wind Turbine Support Structures. Ph.D. Thesis, Technical University of Denmark, Kgs. Lyngby, Denmark, 2009. [Google Scholar]
- Dinh, V.N.; McKeogh, E. Offshore Wind Energy: Technology Opportunities and Challenges. In Proceedings of the First Vietnam Symposium on Advances in Offshore Engineering; Springer: Berlin, Germany, 2018; Volume 18, pp. 3–22. [Google Scholar]
- Jonkman, J.M.; Matha, D. Dynamics of offshore floating wind turbines-analysis of three concepts. Wind Energy 2011, 14, 557–569. [Google Scholar] [CrossRef]
- Simos, A.N.; Ruggeri, F.R.; Watai, A.; Souto-Iglesias, A.; Lopez-Pavon, C. Slow-drift of a floating wind turbine: An assessment of frequency-domain methods based on model tests. Renew. Energy 2018, 116, 133–154. [Google Scholar] [CrossRef]
- Oguz, E.; Clelland, D.; Day, A.H.; Incecik, A.; López, J.A.; Sánchez, G.; Almeria, G.G. Experimental and numerical analysis of a TLP floating offshore wind turbine. Ocean Eng. 2018, 147, 591–605. [Google Scholar] [CrossRef]
- Viselli, A.M.; Goupee, A.J.; Dagher, H.J. Model Test of a 1:8-Scale Floating Wind Turbine Offshore in the Gulf of Maine. J. Offshore Mech. Arct. 2015, 137. [Google Scholar] [CrossRef]
- Nematbakhsh, A.; Olinger, D.J.; Tryggvason, G. Nonlinear simulation of a spar buoy floating wind turbine under extreme ocean conditions. J. Renew. Sustain. Energy 2014, 6, 033121. [Google Scholar] [CrossRef]
- Utsunomiya, T.; Matsukuma, H.; Minoura, S.; Ko, K.; Hamamura, H.; Kobayashi, O.; Sato, I.; Nomoto, Y.; Yasui, K. At Sea Experiment of a Hybrid Spar for Floating Offshore Wind Turbine Using 1/10-Scale Model. J. Offshore Mech. Arct. 2013, 135. [Google Scholar] [CrossRef]
- Skaare, B.; Nielsen, F.G.; Hanson, T.D.; Yttervik, R.; Havmoller, O.; Rekdal, A. Analysis of measurements and simulations from the Hywind Demo floating wind turbine. Wind Energy 2015, 18, 1105–1122. [Google Scholar] [CrossRef]
- Skaare, B.; Hanson, T.D.; Nielsen, F.G.; Yttervik, R.; Hansen, A.M.; Thomsen, K.; Larsen, T.J. Integrated dynamic analysis of floating offshore wind turbines. In Proceedings of the European Wind Energy Conference, Milan, Italy, 7–10 May 2007. [Google Scholar]
- Butterfield, S.; Musial, W.; Jonkman, J.; Sclavounos, P.; Wayman, L. Engineering challenges for floating offshore wind turbines. In Proceedings of the Copenhagen Offshore Wind Conference, Copenhagen, Denmark, 26–28 October 2005. [Google Scholar]
- Goupee, A.J.; Koo, B.J.; Kimball, R.W.; Lambrakos, K.F.; Dagher, H.J. Experimental Comparison of Three Floating Wind Turbine Concepts. J. Offshore Mech. Arct. 2014, 136. [Google Scholar] [CrossRef]
- Myhr, A.; Maus, K.J.; Nygaard, T.A. Experimental and computational comparisons of the OC3-HYWIND and Tension-Leg-Buoy (TLB) floating wind turbine conceptual designs. In Proceedings of the Twenty-first International Offshore and Polar Engineering Conference, Maui, HI, USA, 19–24 June 2011. [Google Scholar]
- Campanile, A.; Piscopo, V.; Scamardella, A. Mooring design and selection for floating offshore wind turbines on intermediate and deep water depths. Ocean Eng. 2018, 148, 349–360. [Google Scholar] [CrossRef]
- Bae, Y.H.; Kim, M.H. Rotor-floater-tether coupled dynamics including second-order sum-frequency wave loads for a mono-column-TLP-type FOWT (floating offshore wind turbine). Ocean Eng. 2013, 61, 109–122. [Google Scholar] [CrossRef]
- Adam, F.; Steinke, C.; Dahlhaus, F.; Großmann, J. GICON®-TLP for Wind Turbines-Validation of Calculated Results. In Proceedings of the Twenty-Third International Offshore and Polar Engineering Conference, Anchorage, Alaska, 30 June–5 July 2013. [Google Scholar]
- Jonkman, J.M.; Matha, D. A quantitative comparison of the responses of three floating platforms. In Proceedings of the European Offshore Wind 2009: Conference and Exhibition, Stockholm, Sweden, 14–16 September 2009. [Google Scholar]
- Bae, Y.H.; Kim, M.; Shin, Y.S. Rotor-floater-mooring coupled dynamic analysis of mini-TLP-type offshore floating wind turbines. In Proceedings of the ASME 2010 29th International Conference on Ocean, Offshore and Arctic Engineering, Shanghai, China, 6–11 June 2010. Paper No. OMAE2010-20555. [Google Scholar]
- Ormberg, H.; Passano, E.; Luxcey, N. Global analysis of a floating wind turbine using an aero-hydro-elastic model. Part 1: Code development and case study. In Proceedings of the 30th International Conference on Ocean, Offshore and Arctic Engineering, Rotterdam, The Netherlands, 19–24 June 2011. Paper No. OMAE2011-50114. [Google Scholar]
- Jonkman, J.M. Dynamics of Offshore Floating Wind Turbines-Model Development and Verification. Wind Energy 2009, 12, 459–492. [Google Scholar] [CrossRef]
- Larsen, T.J.; Hansen, A.M. How 2 HAWC2, the User’s Manual. Available online: http://orbit.dtu.dk/files/7703110/ris_r_1597.pdf (accessed on 26 January 2019).
- Bachynski, E.E. SIMO-RIFLEX-AeroDyn (64-bit) and NREL-Control Fixpitch. Jar User Manual, Tech. Rep.; Centre for Ships and Ocean Structures, Norwegian University of Science and Technology: Trondheim, Norway, 2013. [Google Scholar]
- Ding, H.-Y.; Han, Y.-Q.; Le, C.-H.; Zhang, P.-Y. Dynamic analysis of a floating wind turbine in wet tows based on multi-body dynamics. J. Renew. Sustain. Energy 2017, 9. [Google Scholar] [CrossRef]
- Coulling, A.J.; Goupee, A.J.; Robertson, A.N.; Jonkman, J.M.; Dagher, H.J. Validation of a FAST semi-submersible floating wind turbine numerical model with DeepCwind test data. J. Renew. Sustain. Energy 2013, 5. [Google Scholar] [CrossRef]
- et Norske Veritas. SESAM User Manual HydroD; et Norske Veritas: HØVIK, Norway, 2013. [Google Scholar]
- Jonkman, J.; Butterfield, S.; Musial, W.; Scott, G. Definition of a 5-MW Reference Wind Turbine for Offshore System Development; National Renewable Energy Laboratory (NREL): Golden, CO, USA, 2009.
- Bae, Y.H.; Kim, M.H.; Kim, H.C. Performance changes of a floating offshore wind turbine with broken mooring line. Renew. Energy 2017, 101, 364–375. [Google Scholar] [CrossRef]
- Li, Y.; Tang, Y.-G.; Zhu, Q.; Qu, X.-Q.; Wang, B.; Zhang, R.-Y. Effects of second-order wave forces and aerodynamic forces on dynamic responses of a TLP-type floating offshore wind turbine considering the set-down motion. J. Renew. Sustain. Energy 2017, 9. [Google Scholar] [CrossRef]
- Wang, B.; Tang, Y.-G.; Liu, L.-Q.; Li, Y.; Qu, X.-Q. Nonlinear random motion analysis of a Tension Leg Platform considering the set-down motion of a floating body. China Ocean Eng. 2017, 31, 210–219. [Google Scholar] [CrossRef]
- Jonkman, J.; Hayman, G.; Jonkman, B.; Damiani, R. AeroDyn v15 User’s Guide and Theory Manual. Available online: https://wind.nrel.gov/nwtc/docs/AeroDyn_Manual.pdf (accessed on 26 January 2019).
- Jonkman, B.J. TurbSim User’s Guide: Version 1.50. Available online: https://www.nrel.gov/docs/fy09osti/46198.pdf (accessed on 26 January 2019).
Figure 1.
Overall model of the SFOWT.

Figure 2.
Coordinate system and main dimensions of the SFOWT platform.
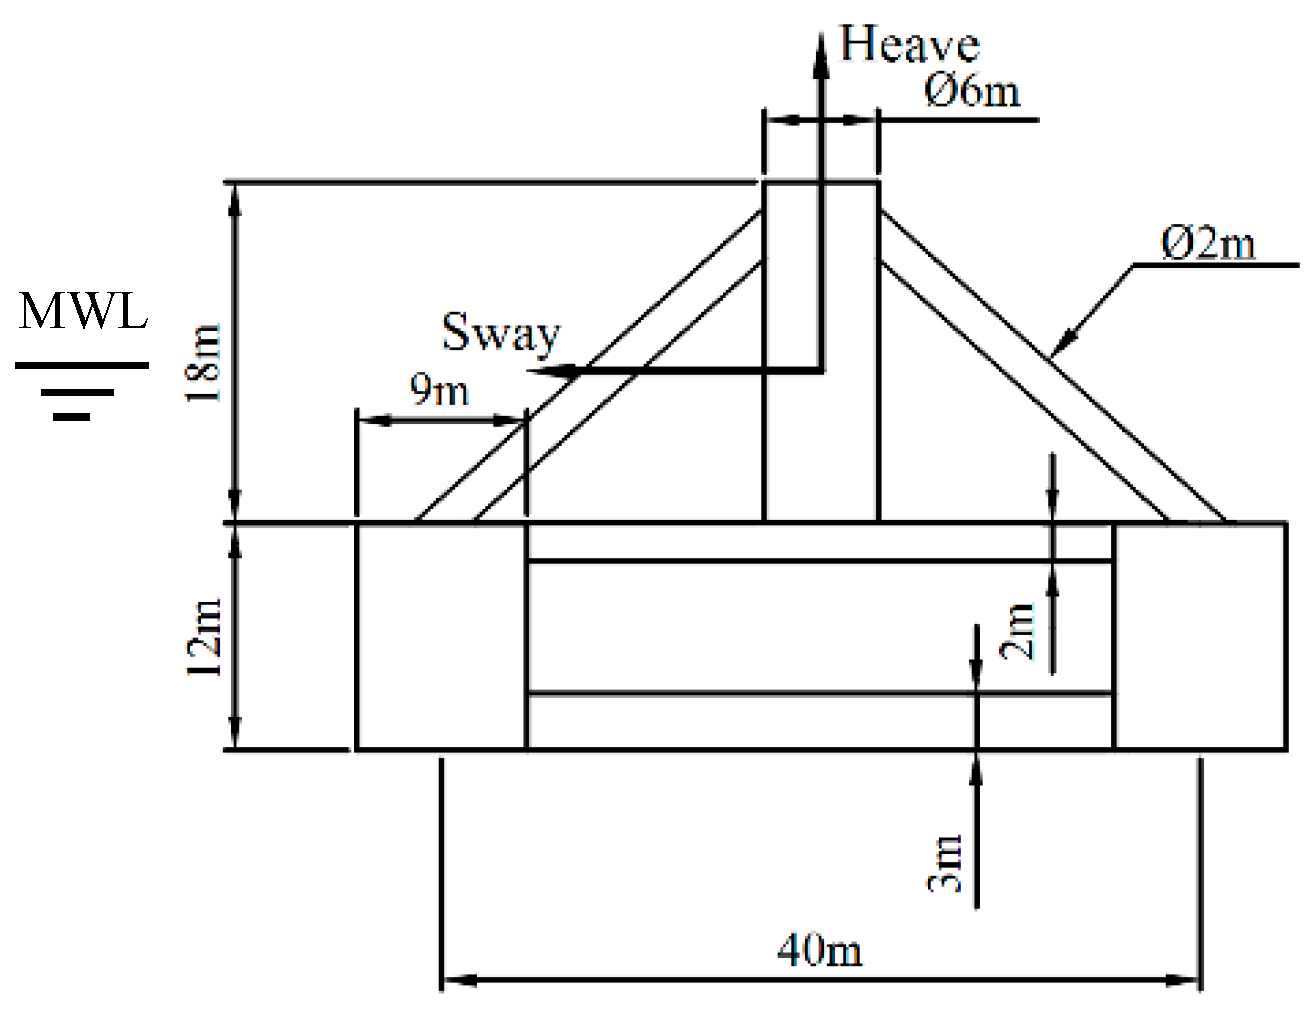
Figure 3.
An overview of codes used in the fully coupled analysis [3].
Figure 3.
An overview of codes used in the fully coupled analysis [3].
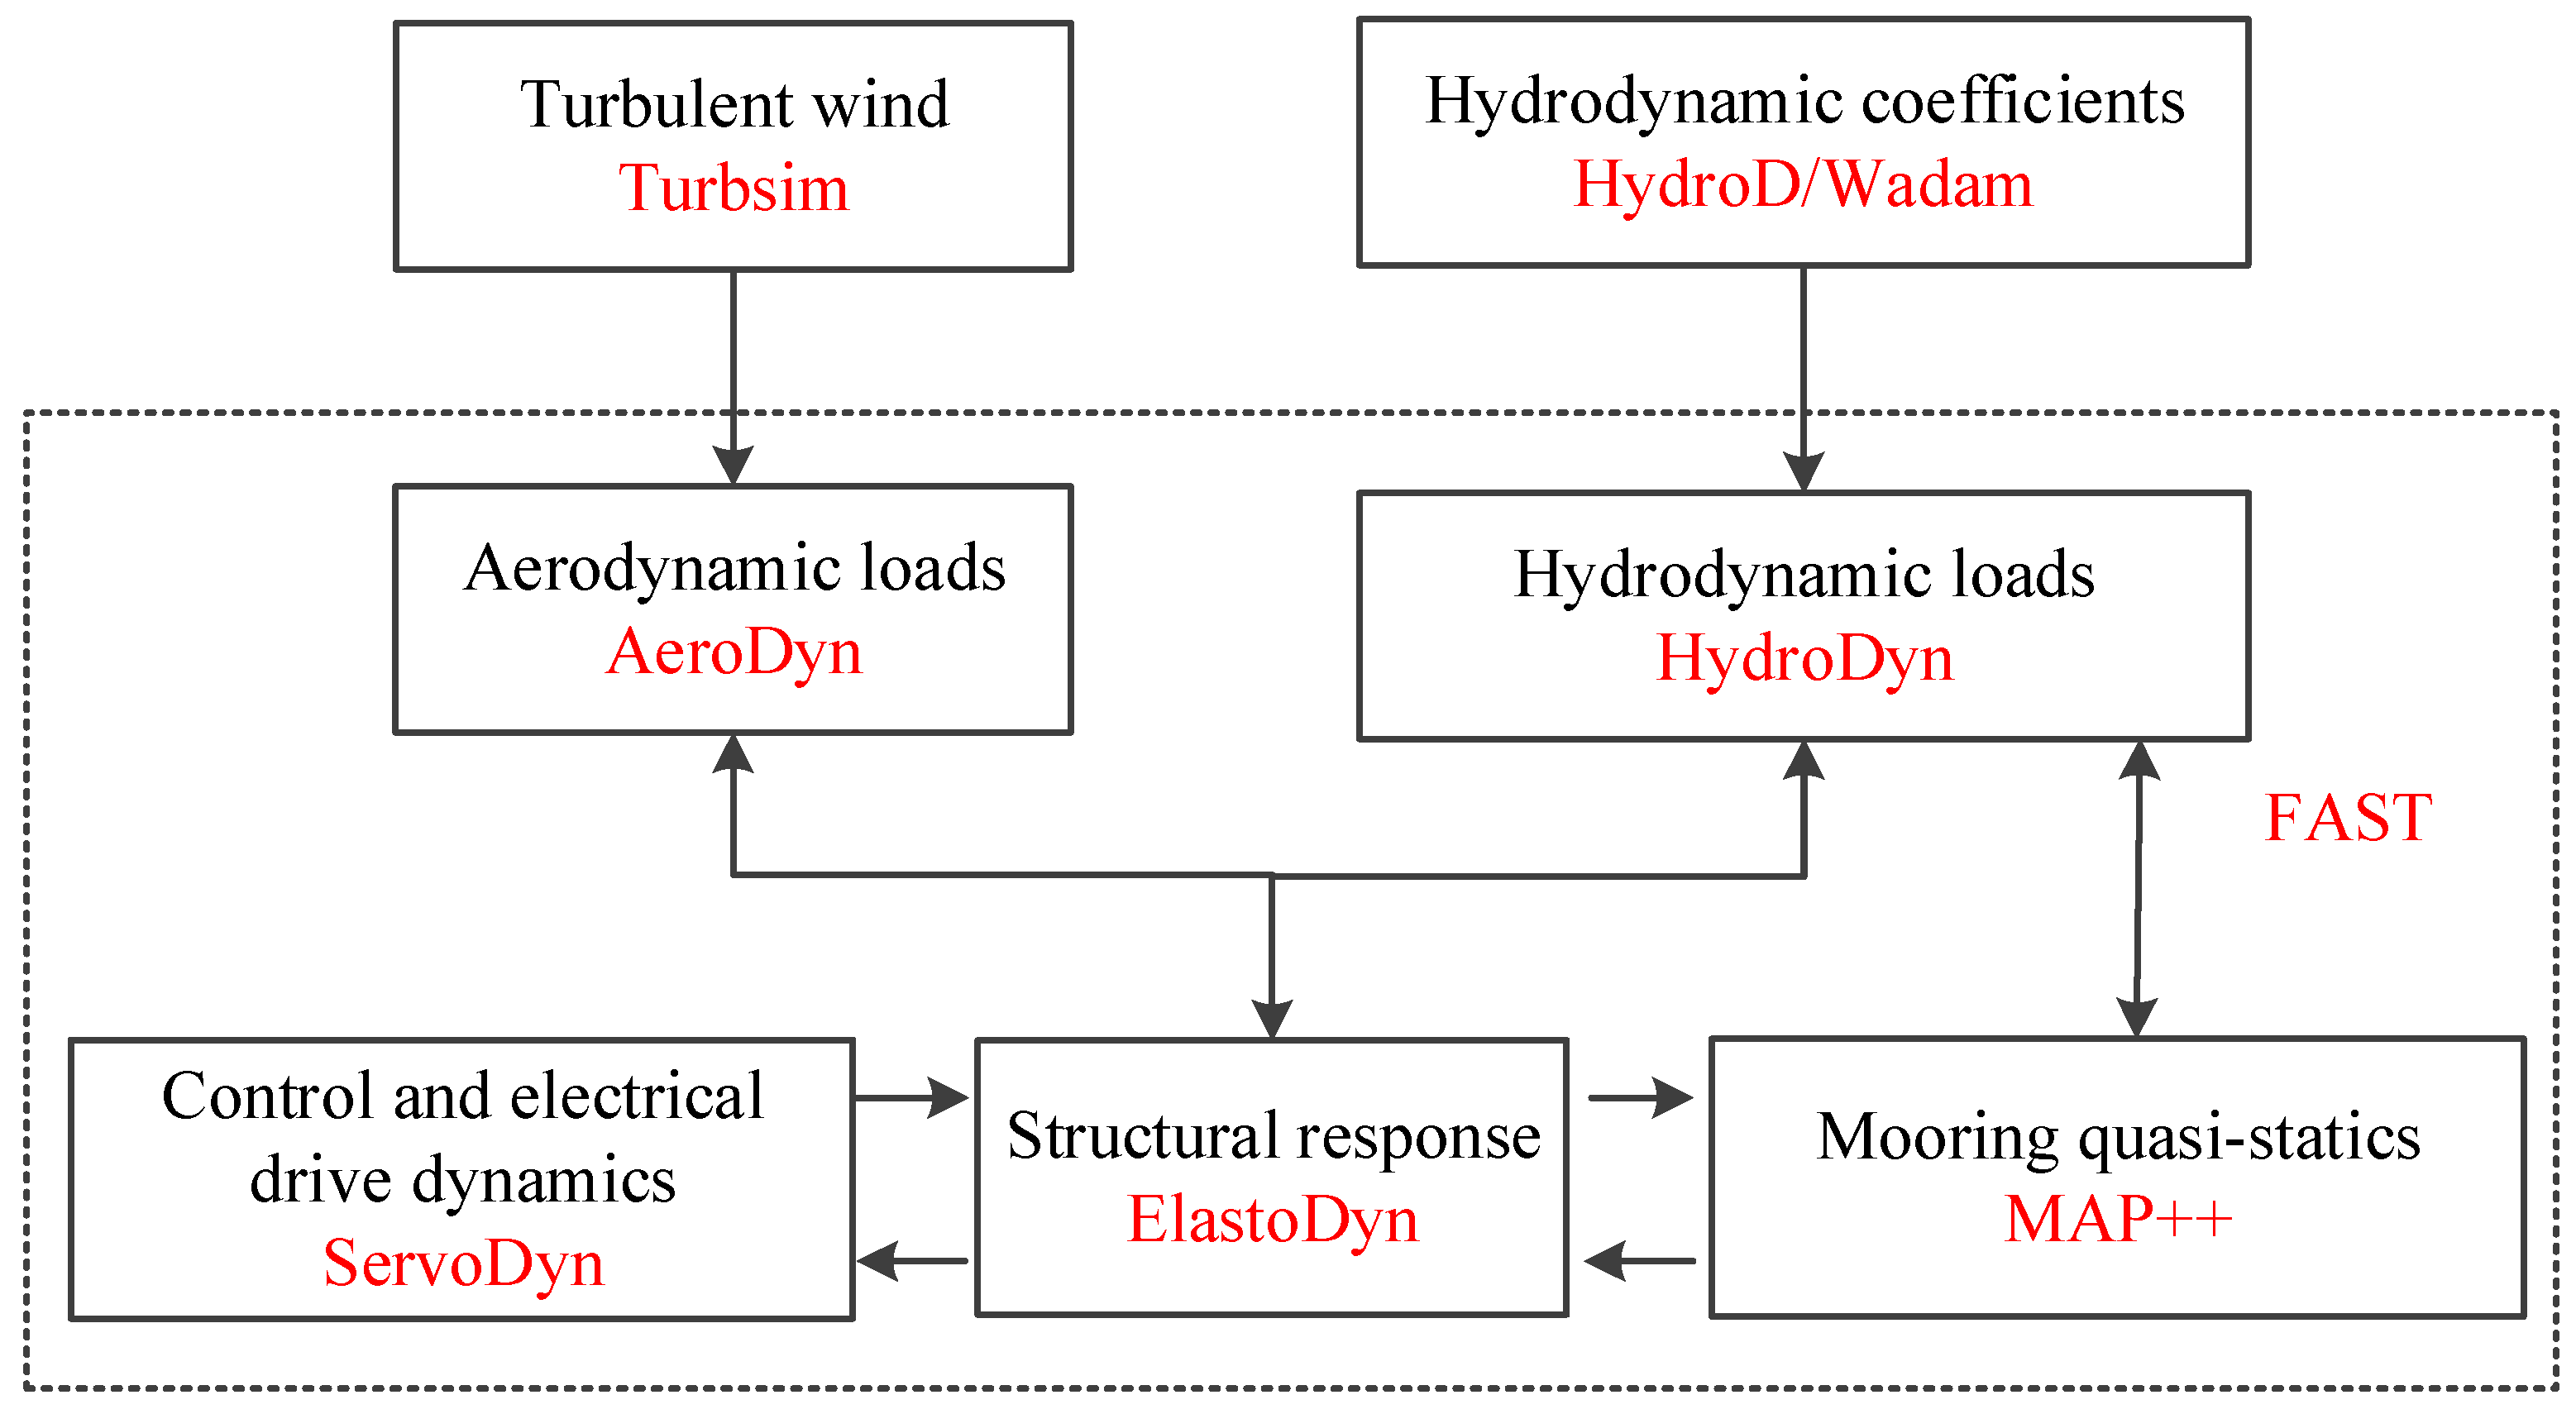
Figure 4.
Time series of wave elevation.

Figure 5.
Time series of wind velocity.

Figure 6.
Time series of platform motions for different tether lengths.
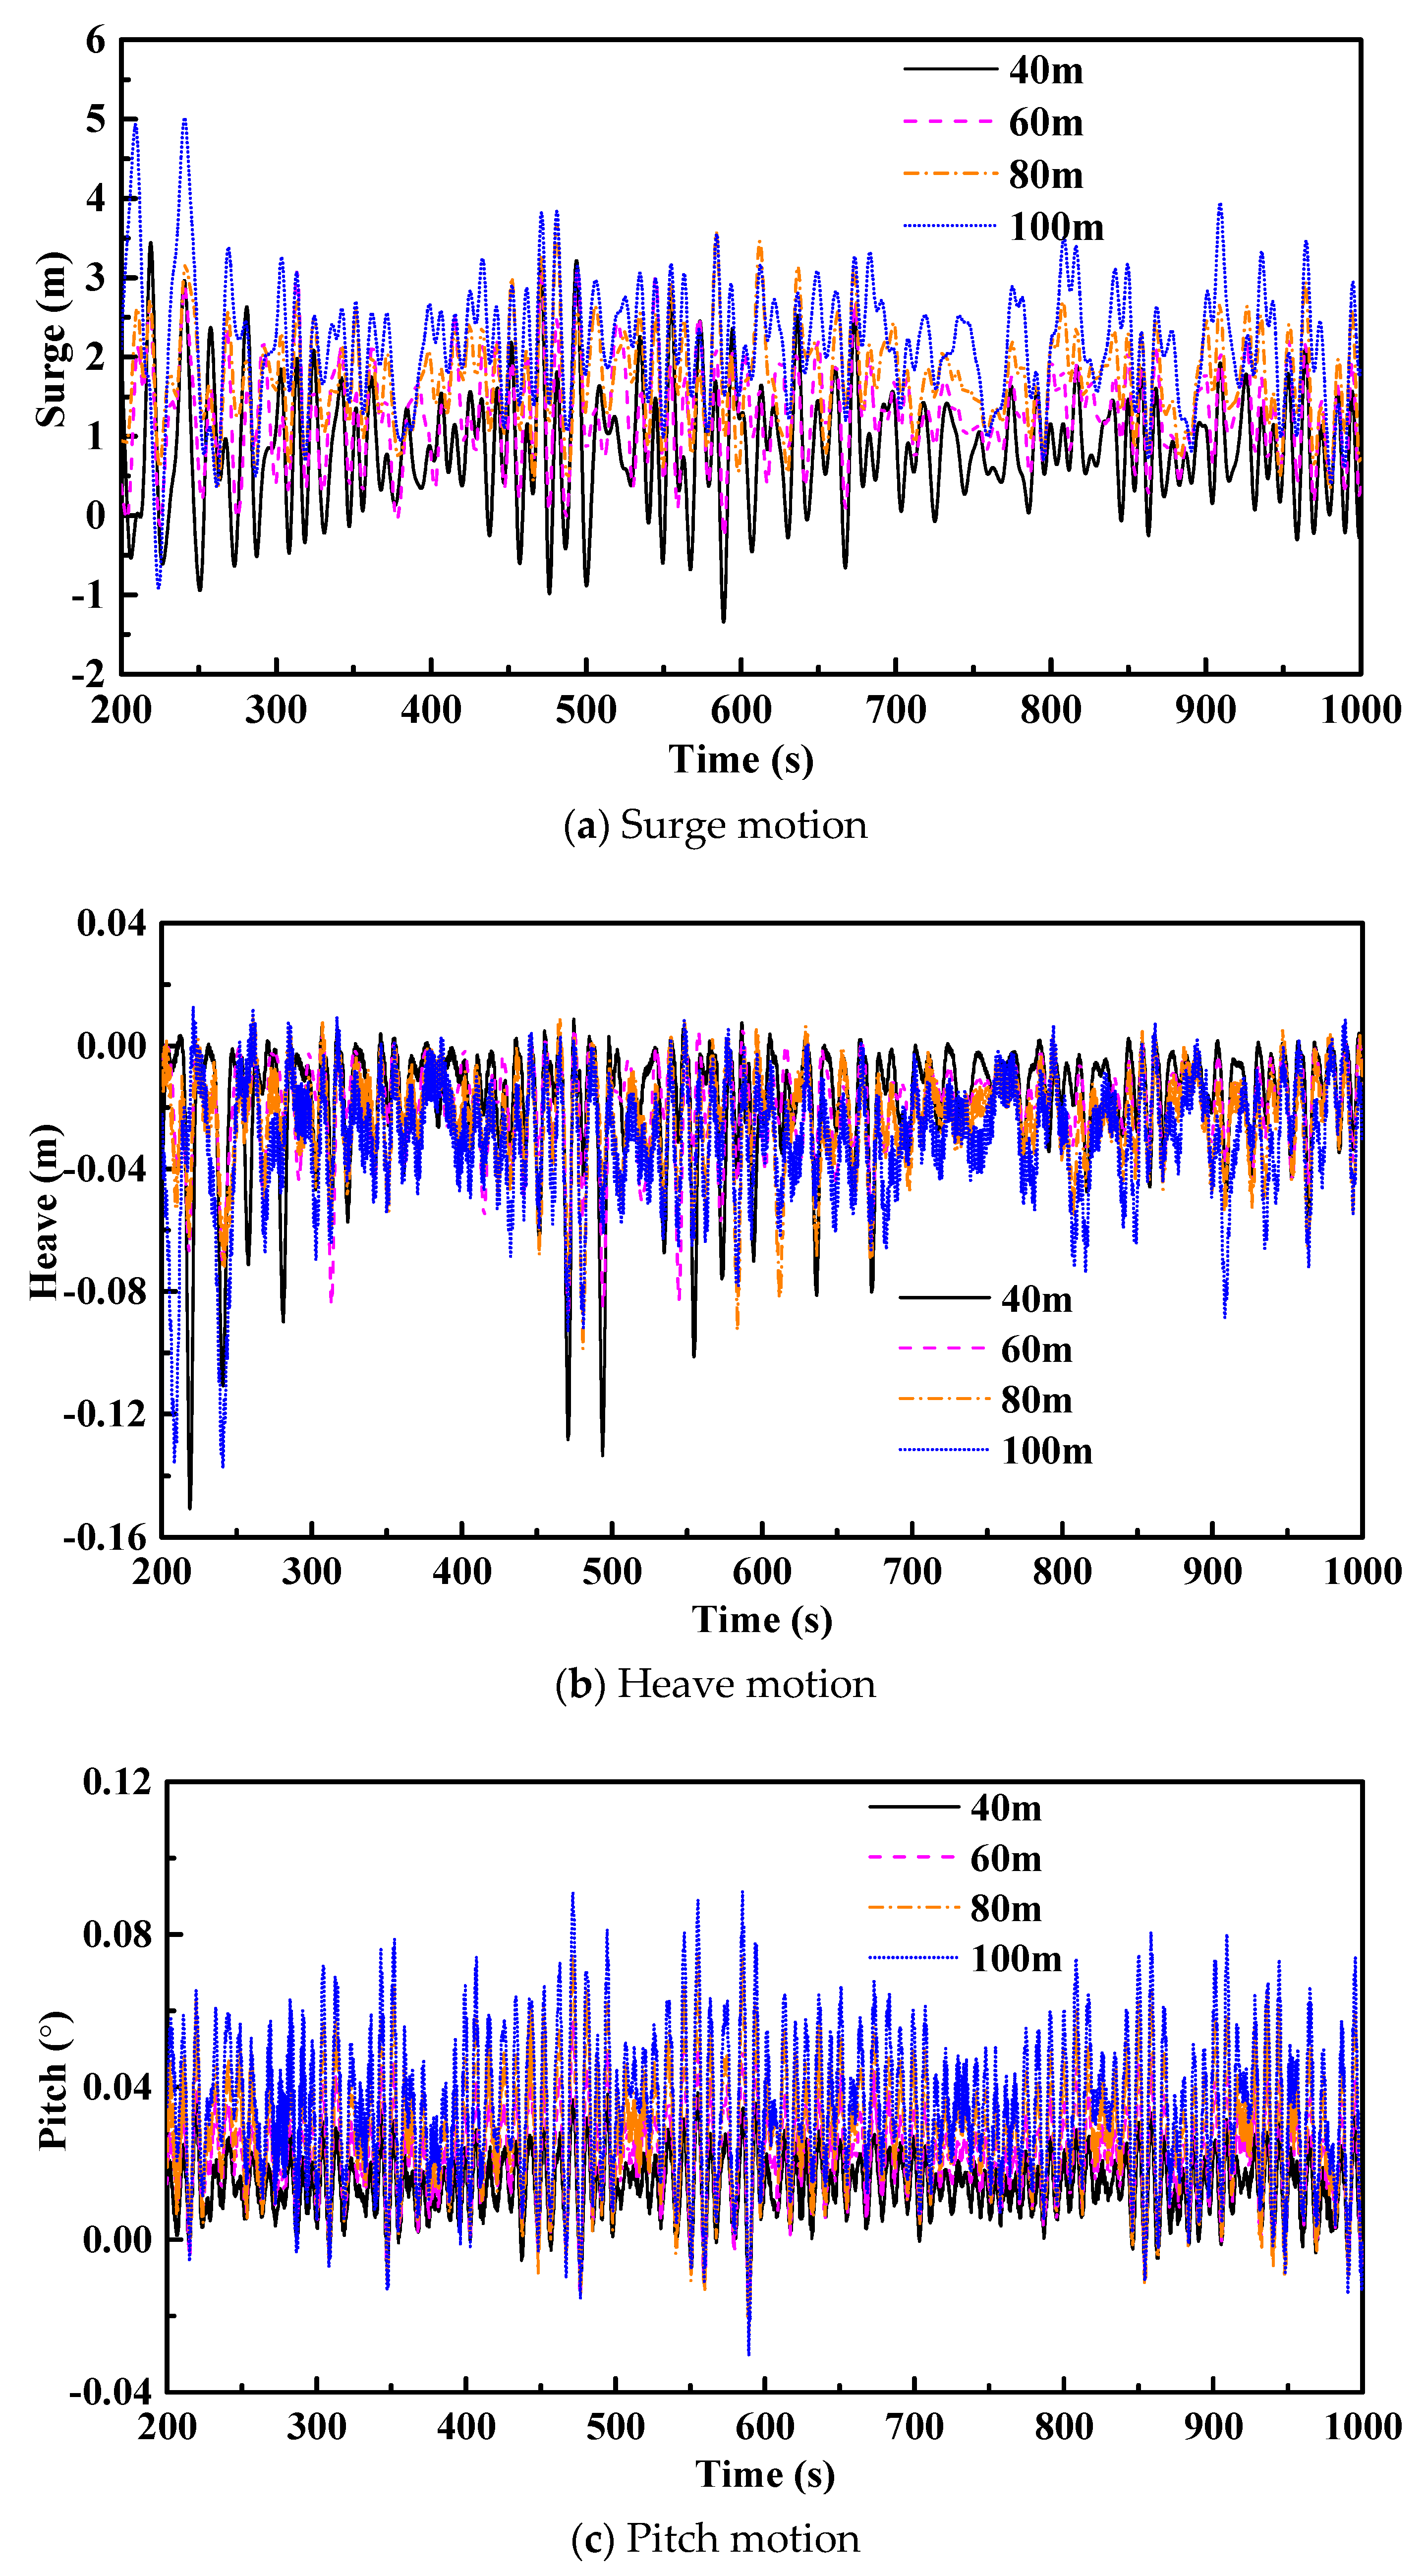

Figure 7.
Time series of tower top fore-aft displacements for different tether lengths.

Figure 8.
Time series of tether 1# tension for different tether lengths.
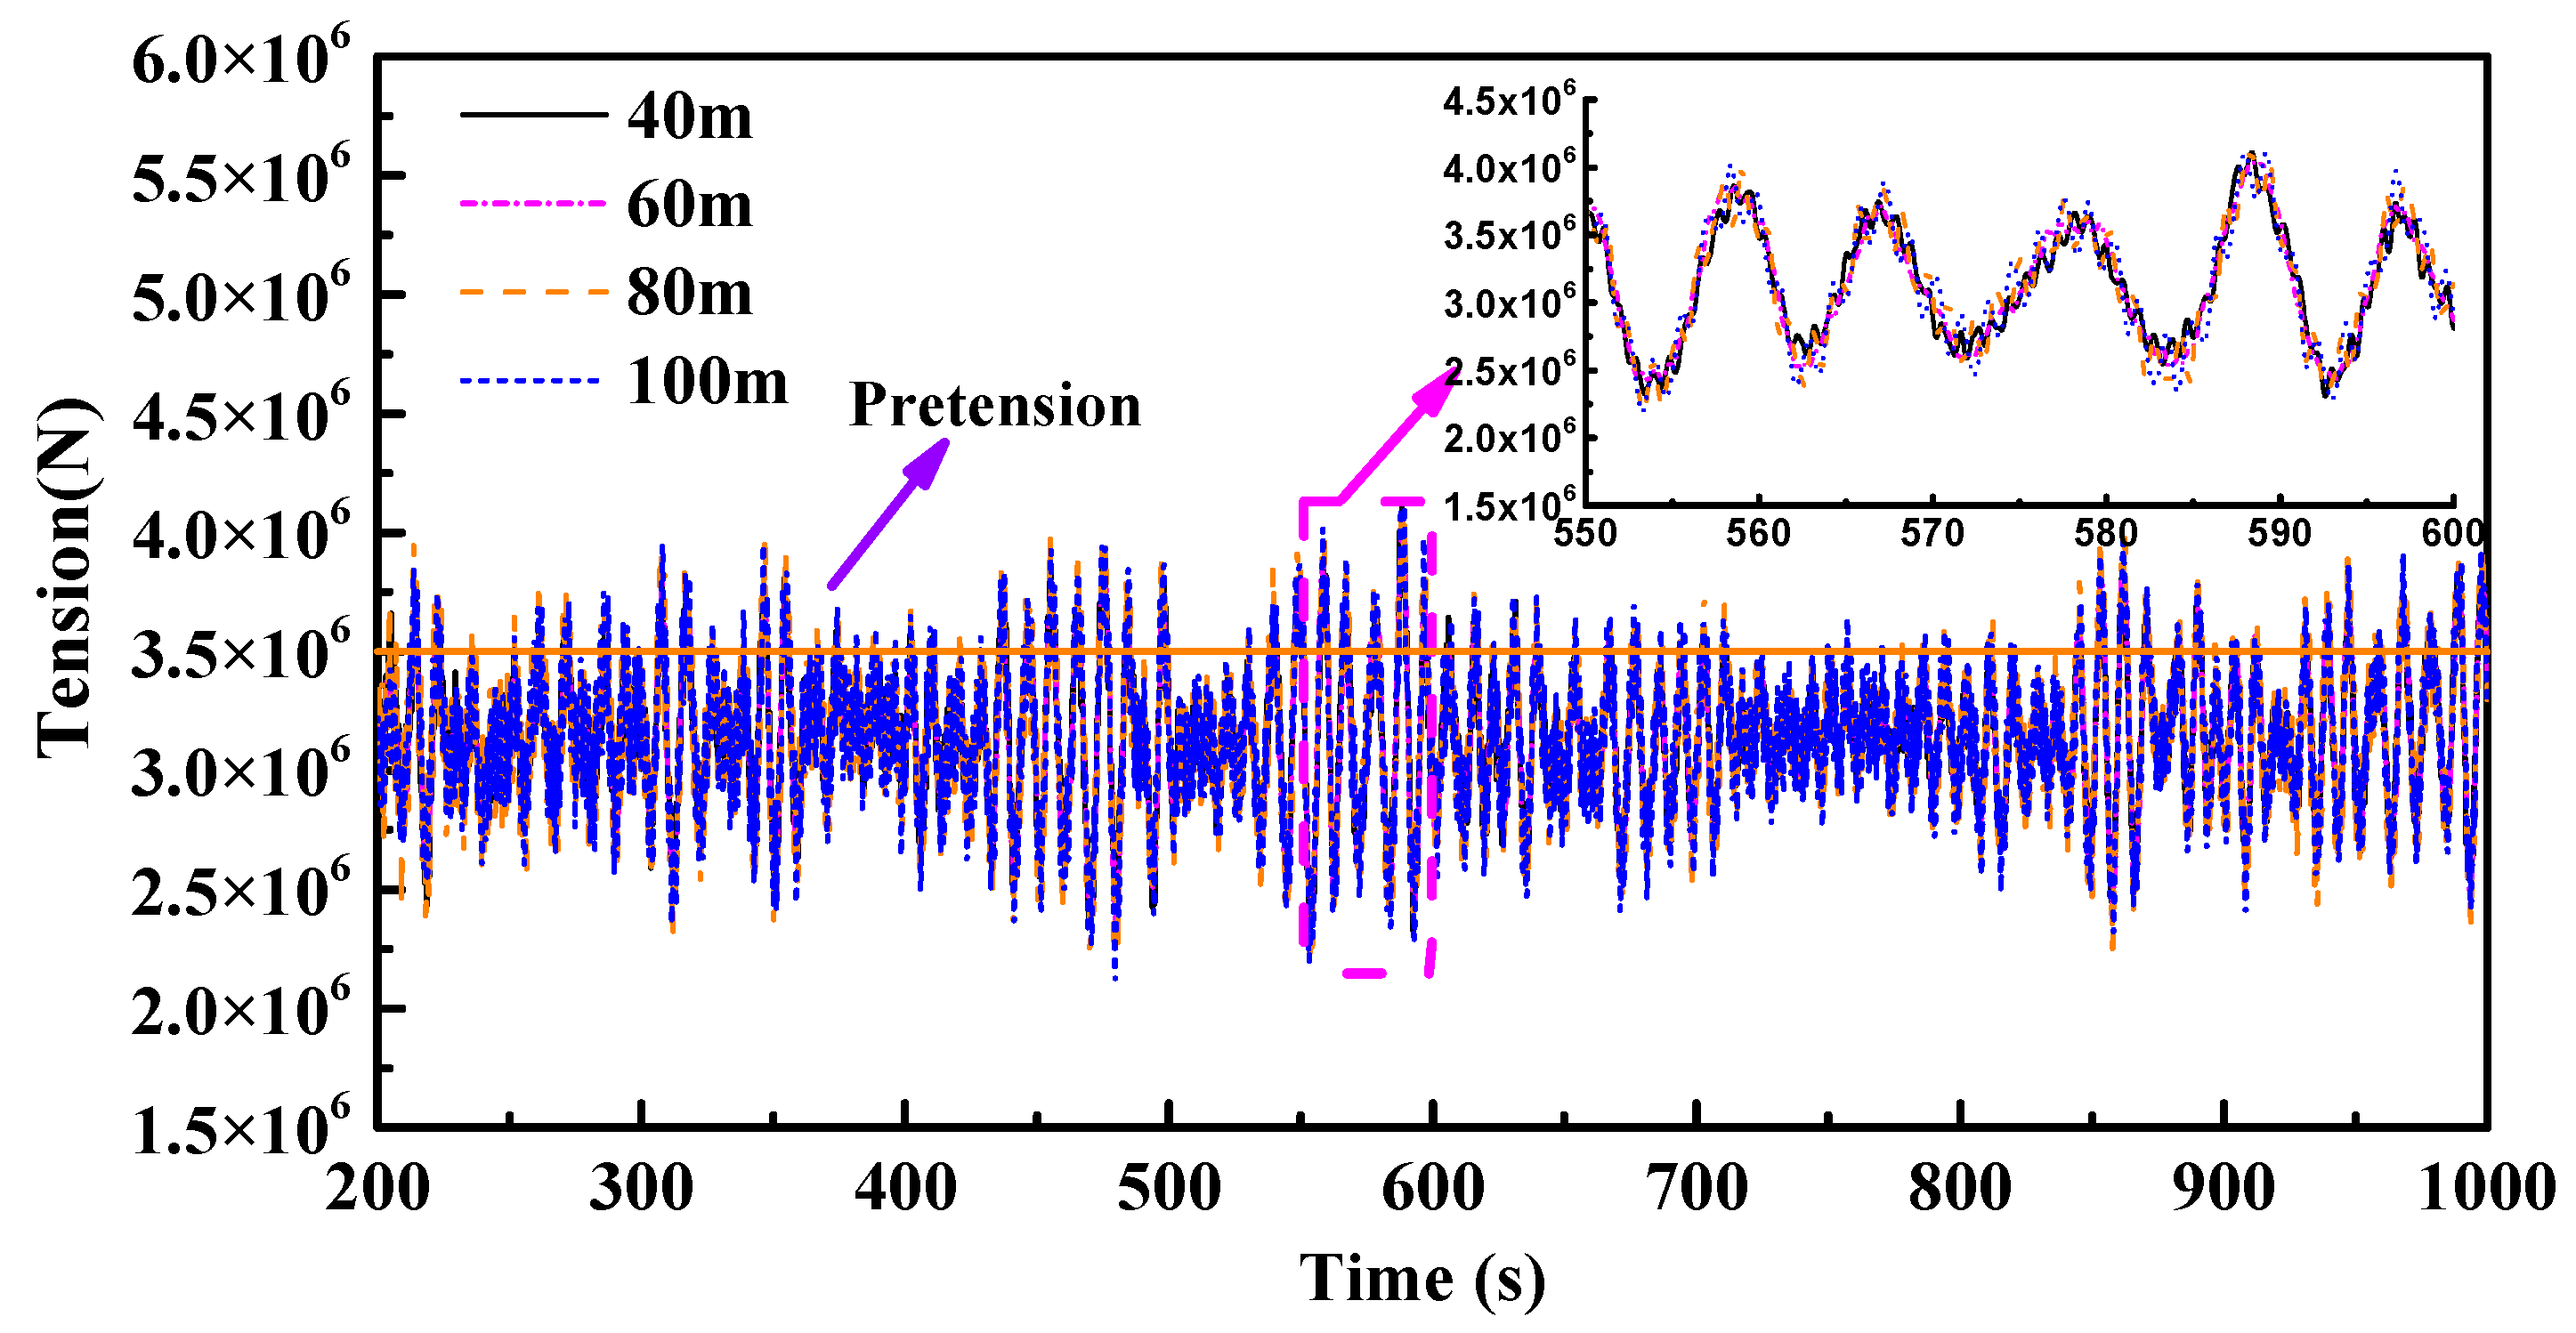
Figure 9.
Comparison of platform motion, tower fore-aft displacement, tension of tether 1# for different tether lengths.
Figure 9.
Comparison of platform motion, tower fore-aft displacement, tension of tether 1# for different tether lengths.

Figure 10.
Natural frequencies of surge, heave, pitch and yaw in different pretension conditions.
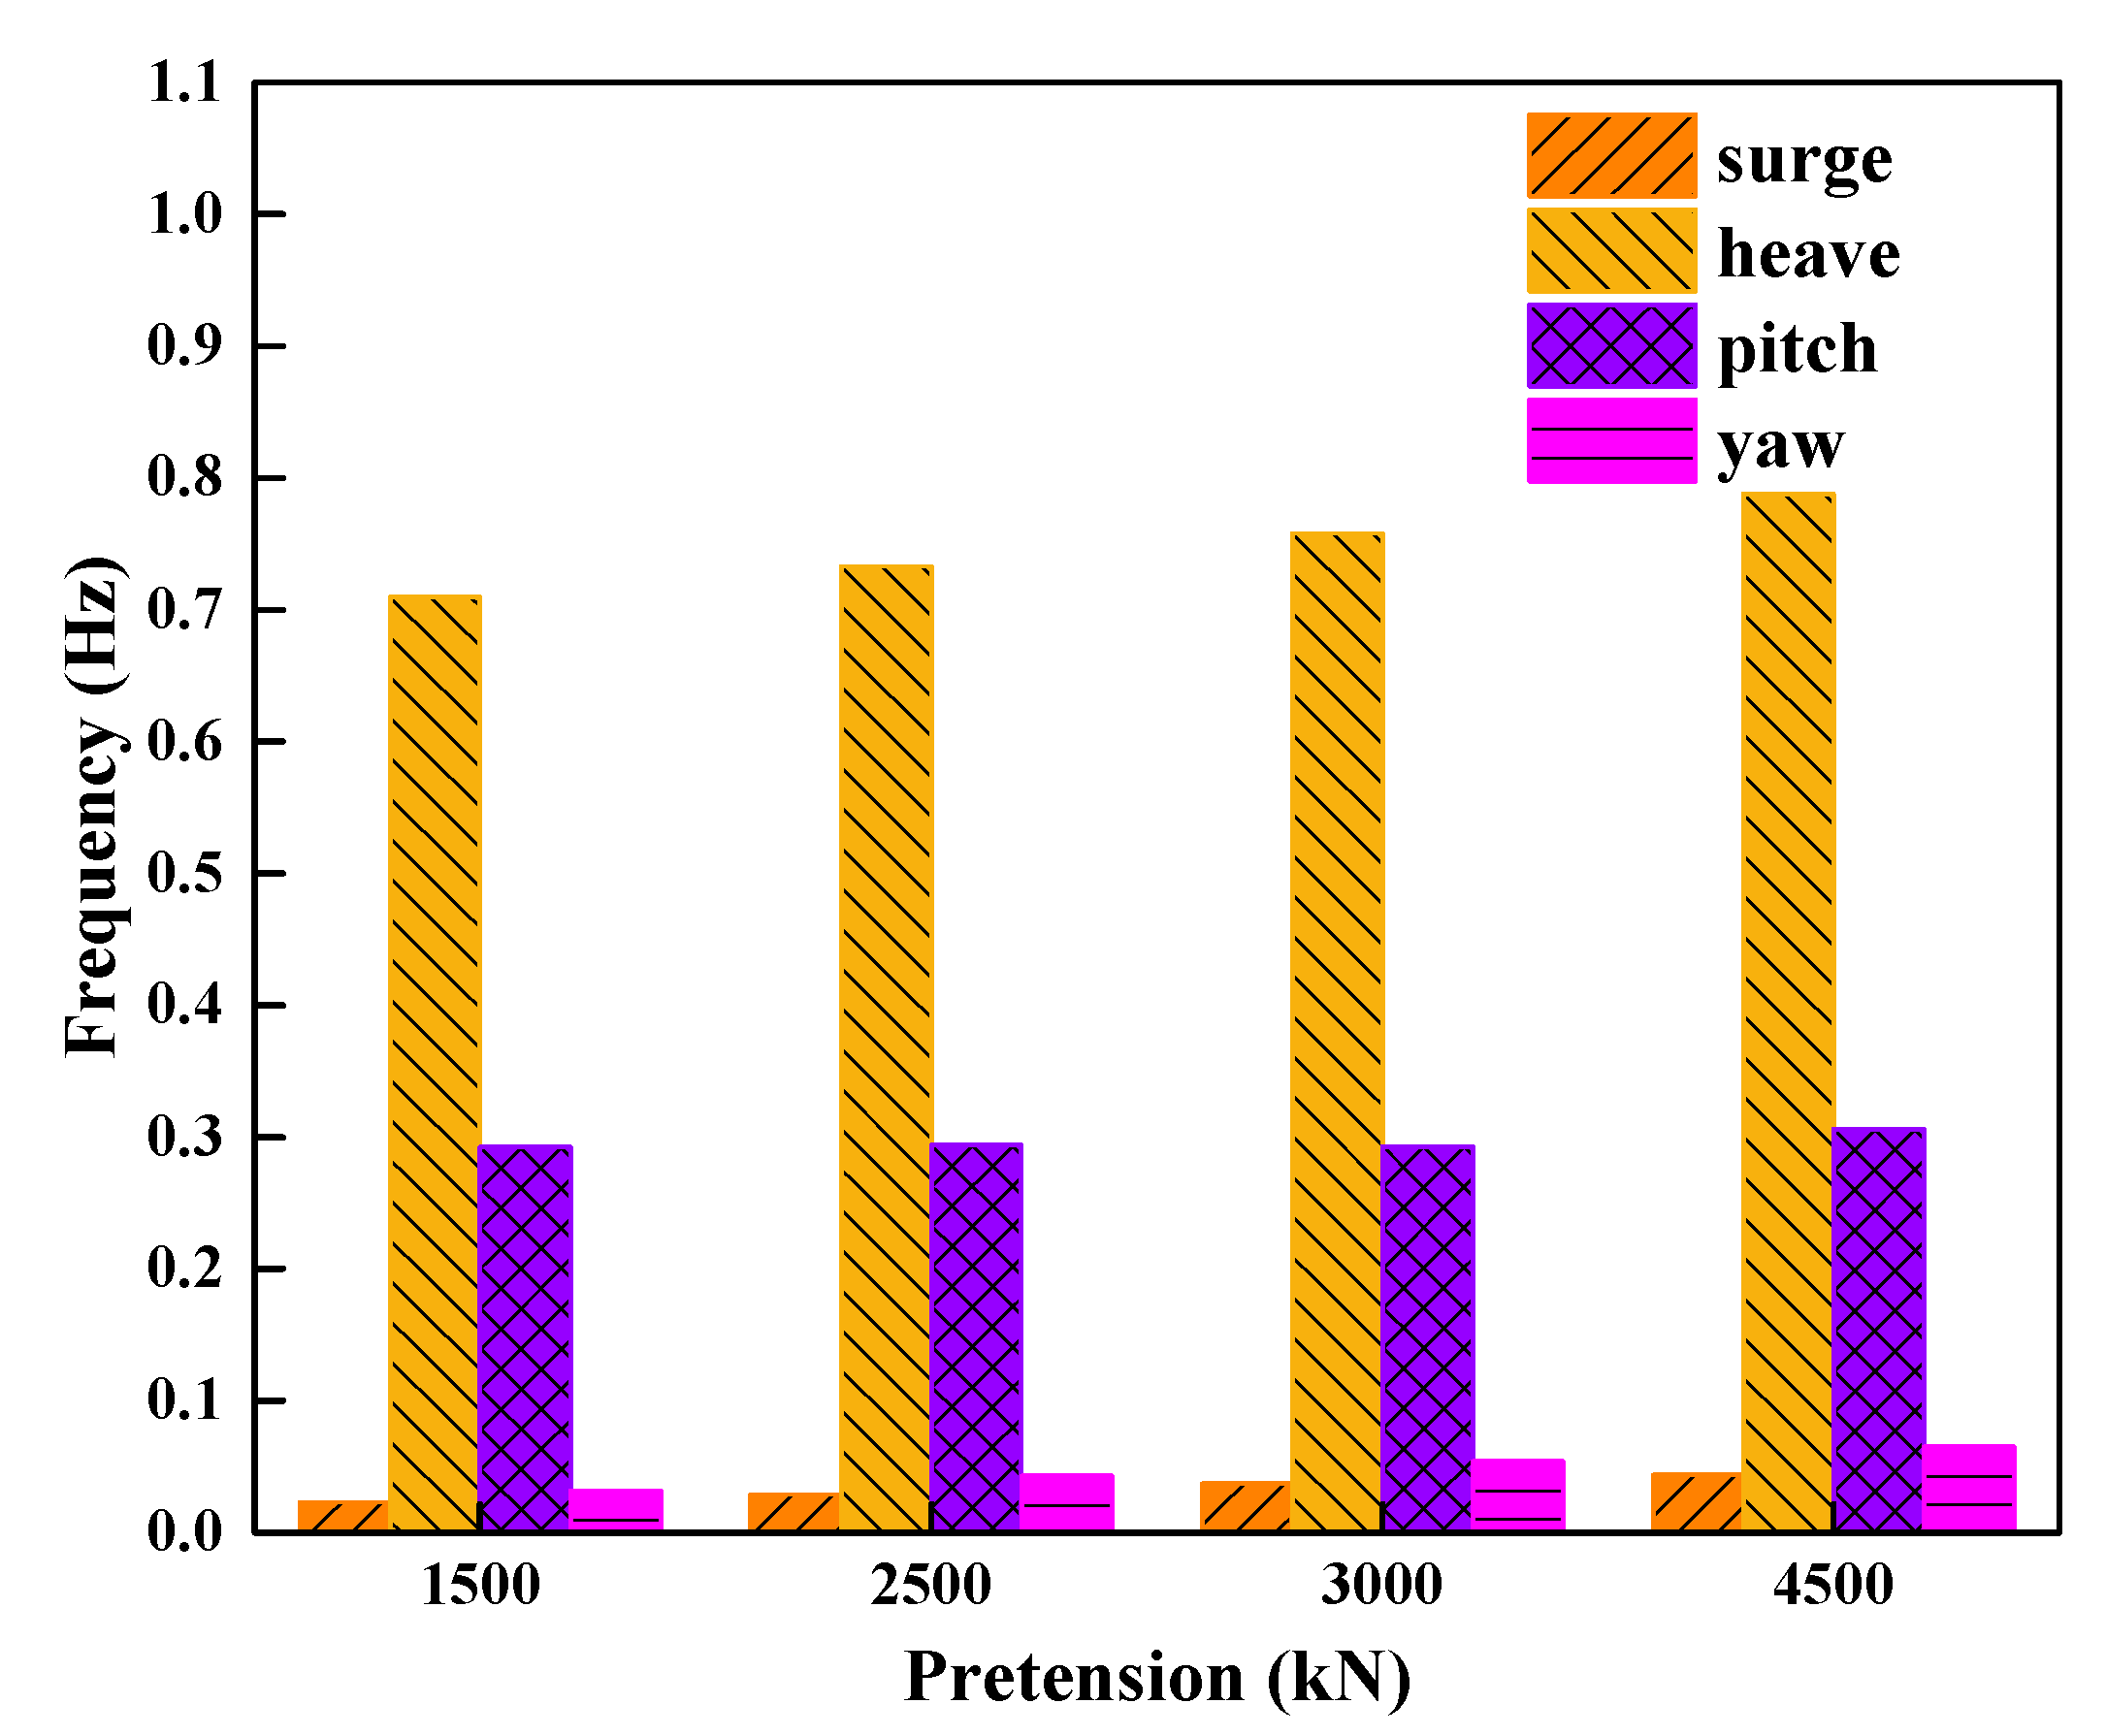
Figure 11.
Time series of platform motion, tower fore-aft displacement and tension of tether 1# in different pretension conditions.
Figure 11.
Time series of platform motion, tower fore-aft displacement and tension of tether 1# in different pretension conditions.
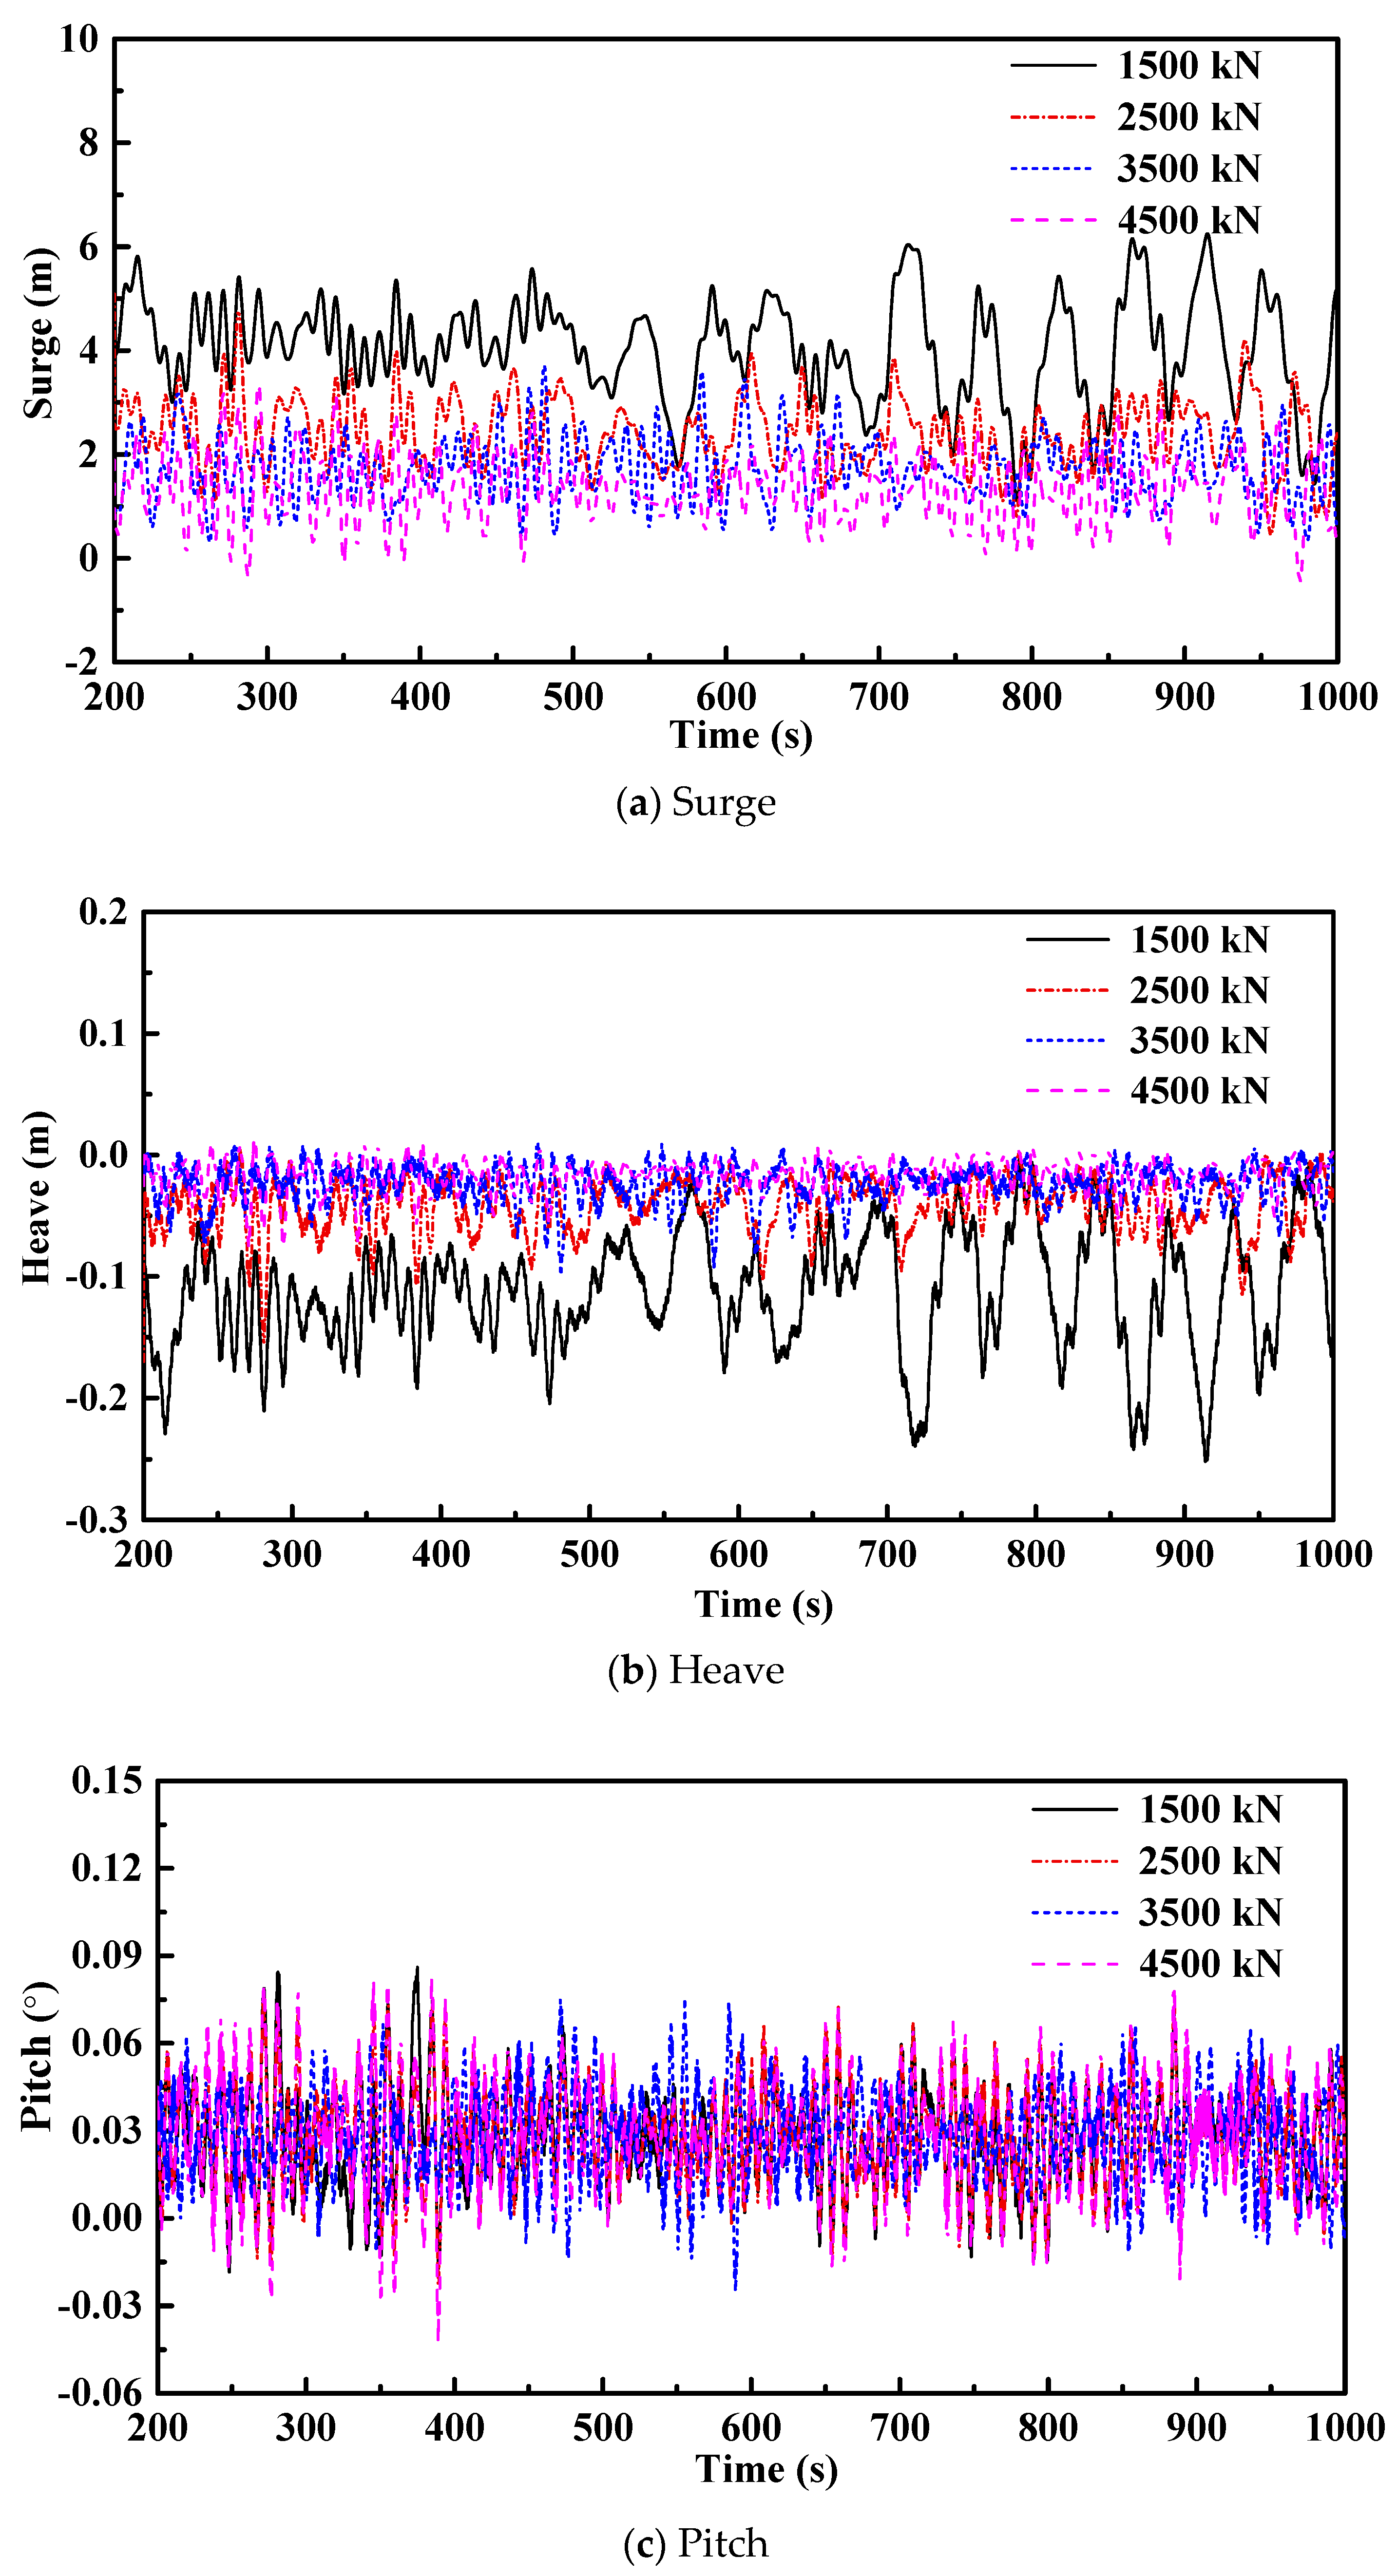

Figure 12.
Statistics of platform motion, tower fore-aft displacement, tension of tether 1# in different pretension conditions.
Figure 12.
Statistics of platform motion, tower fore-aft displacement, tension of tether 1# in different pretension conditions.
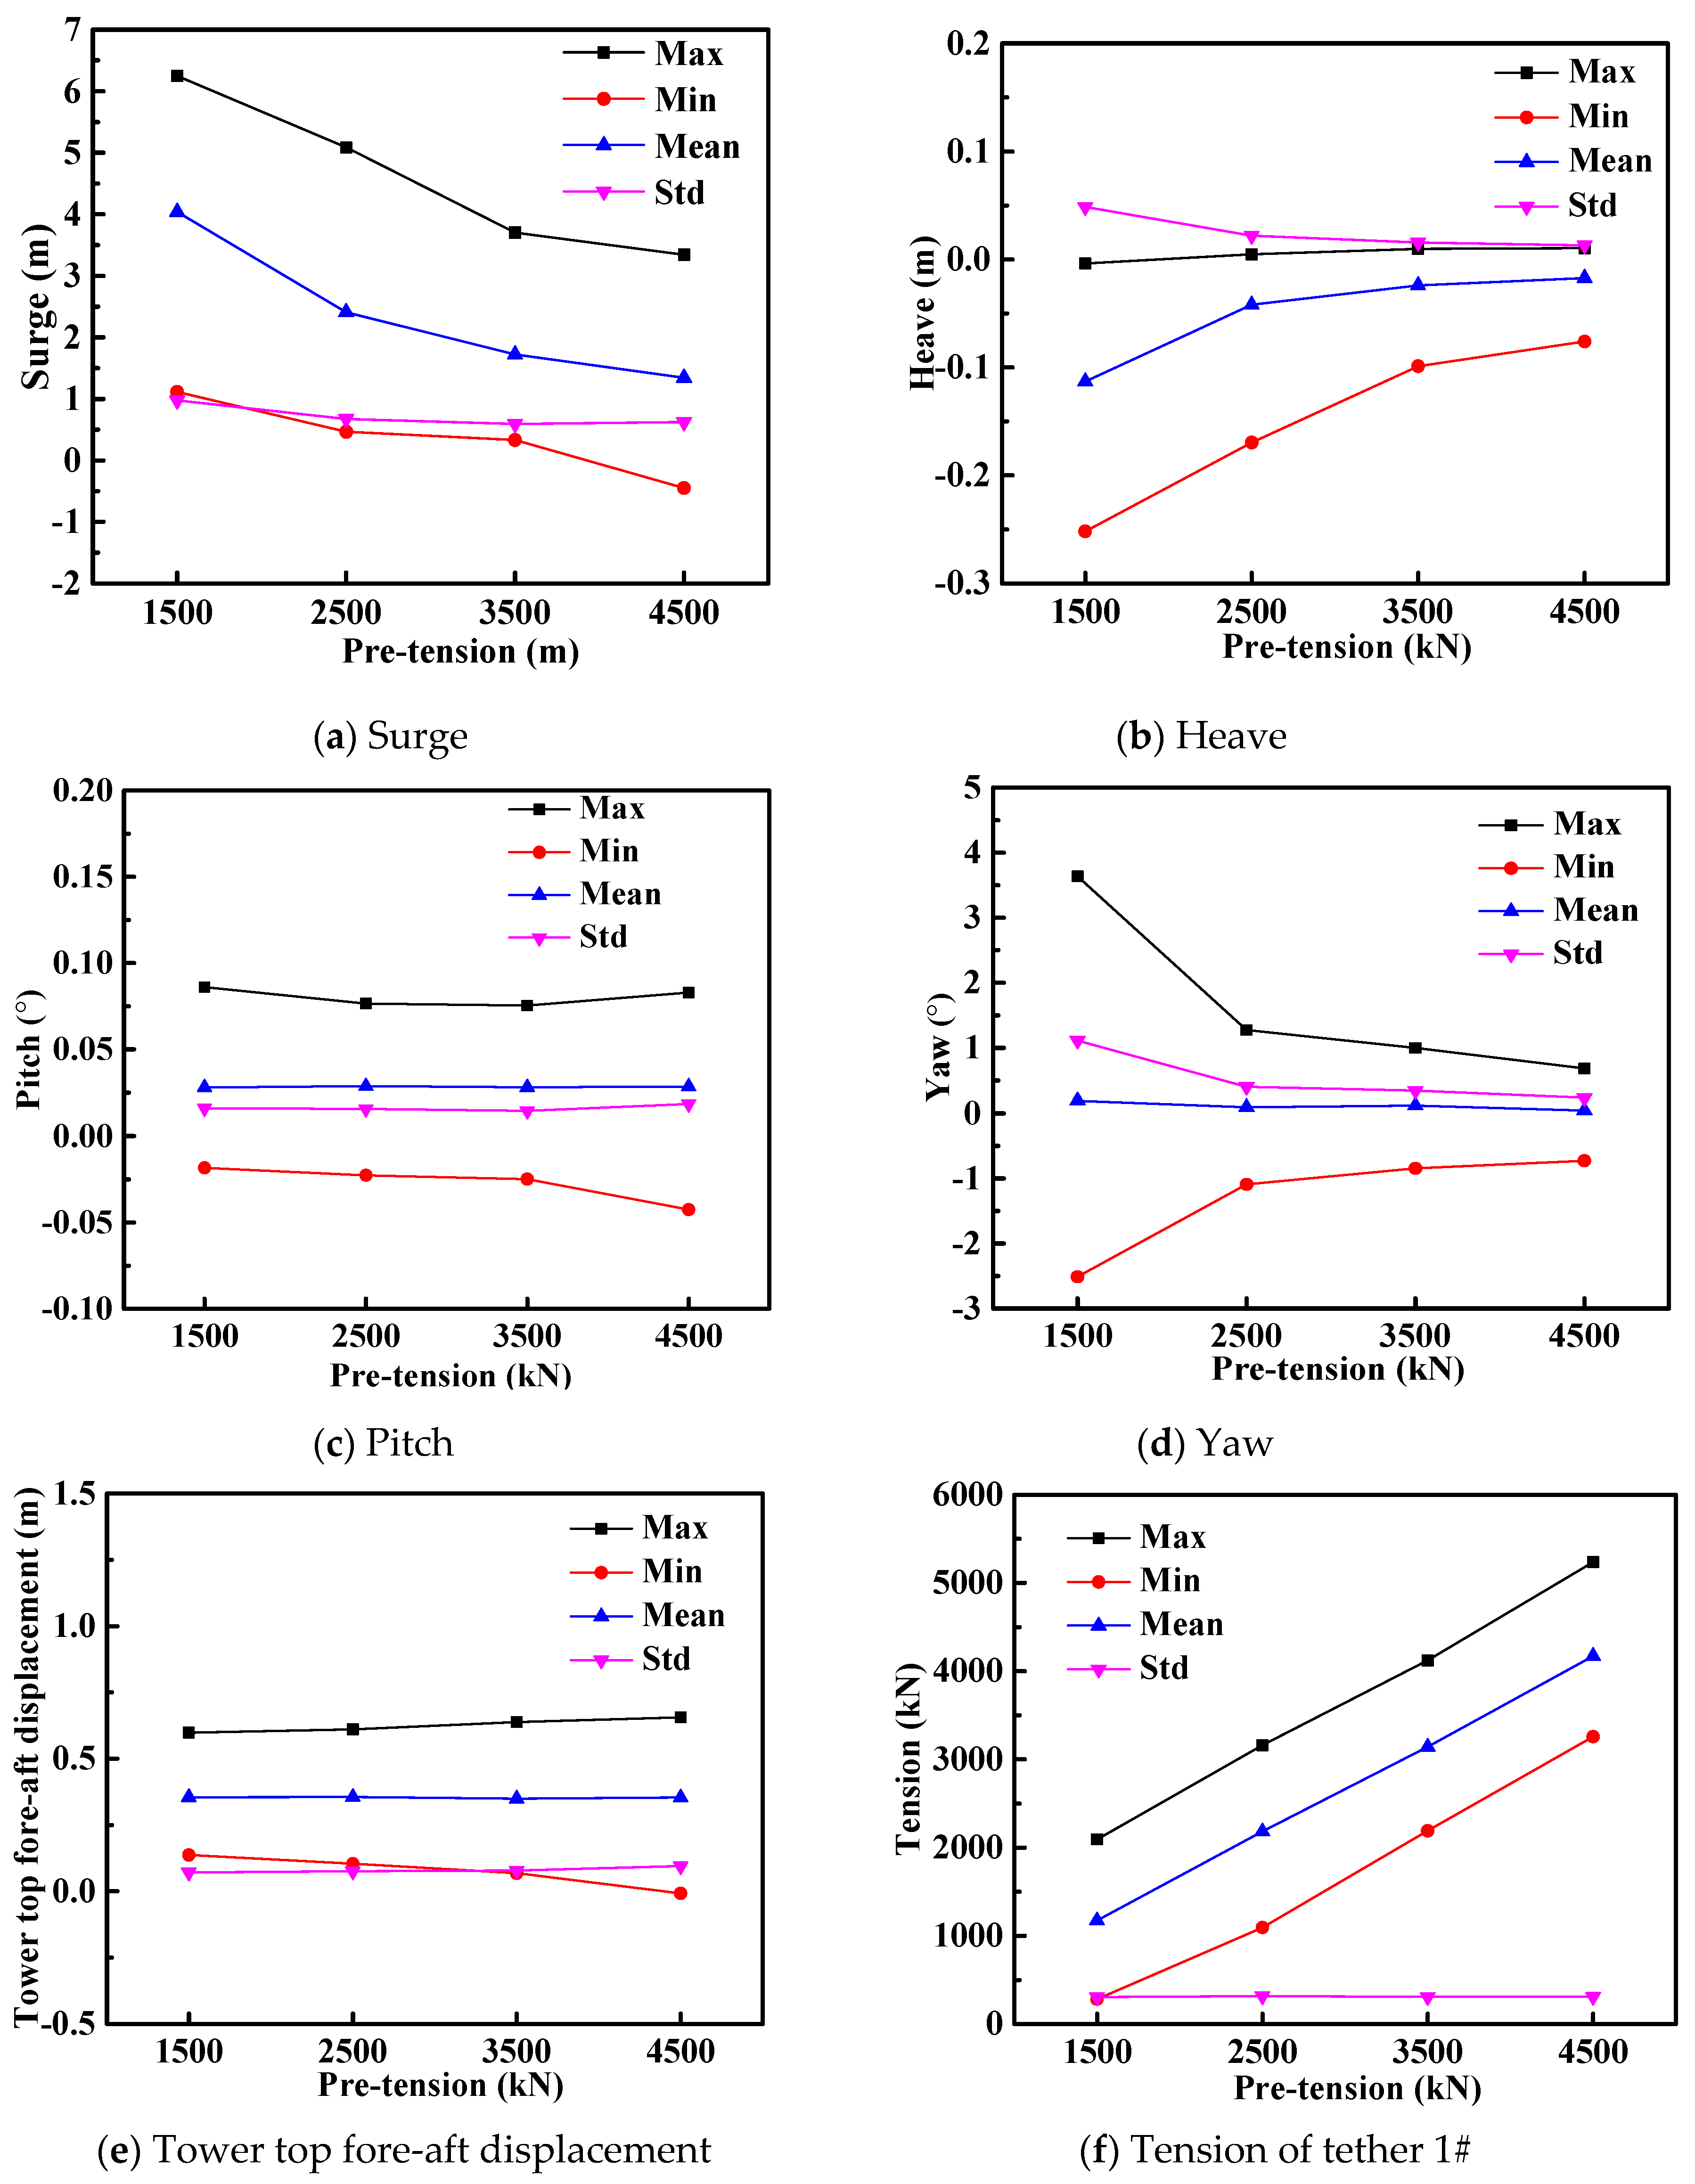
Figure 13.
Power spectra of motions in surge, heave, pitch and yaw in different pretension conditions.
Figure 13.
Power spectra of motions in surge, heave, pitch and yaw in different pretension conditions.

Figure 14.
Time series and statistics of tether tensions.
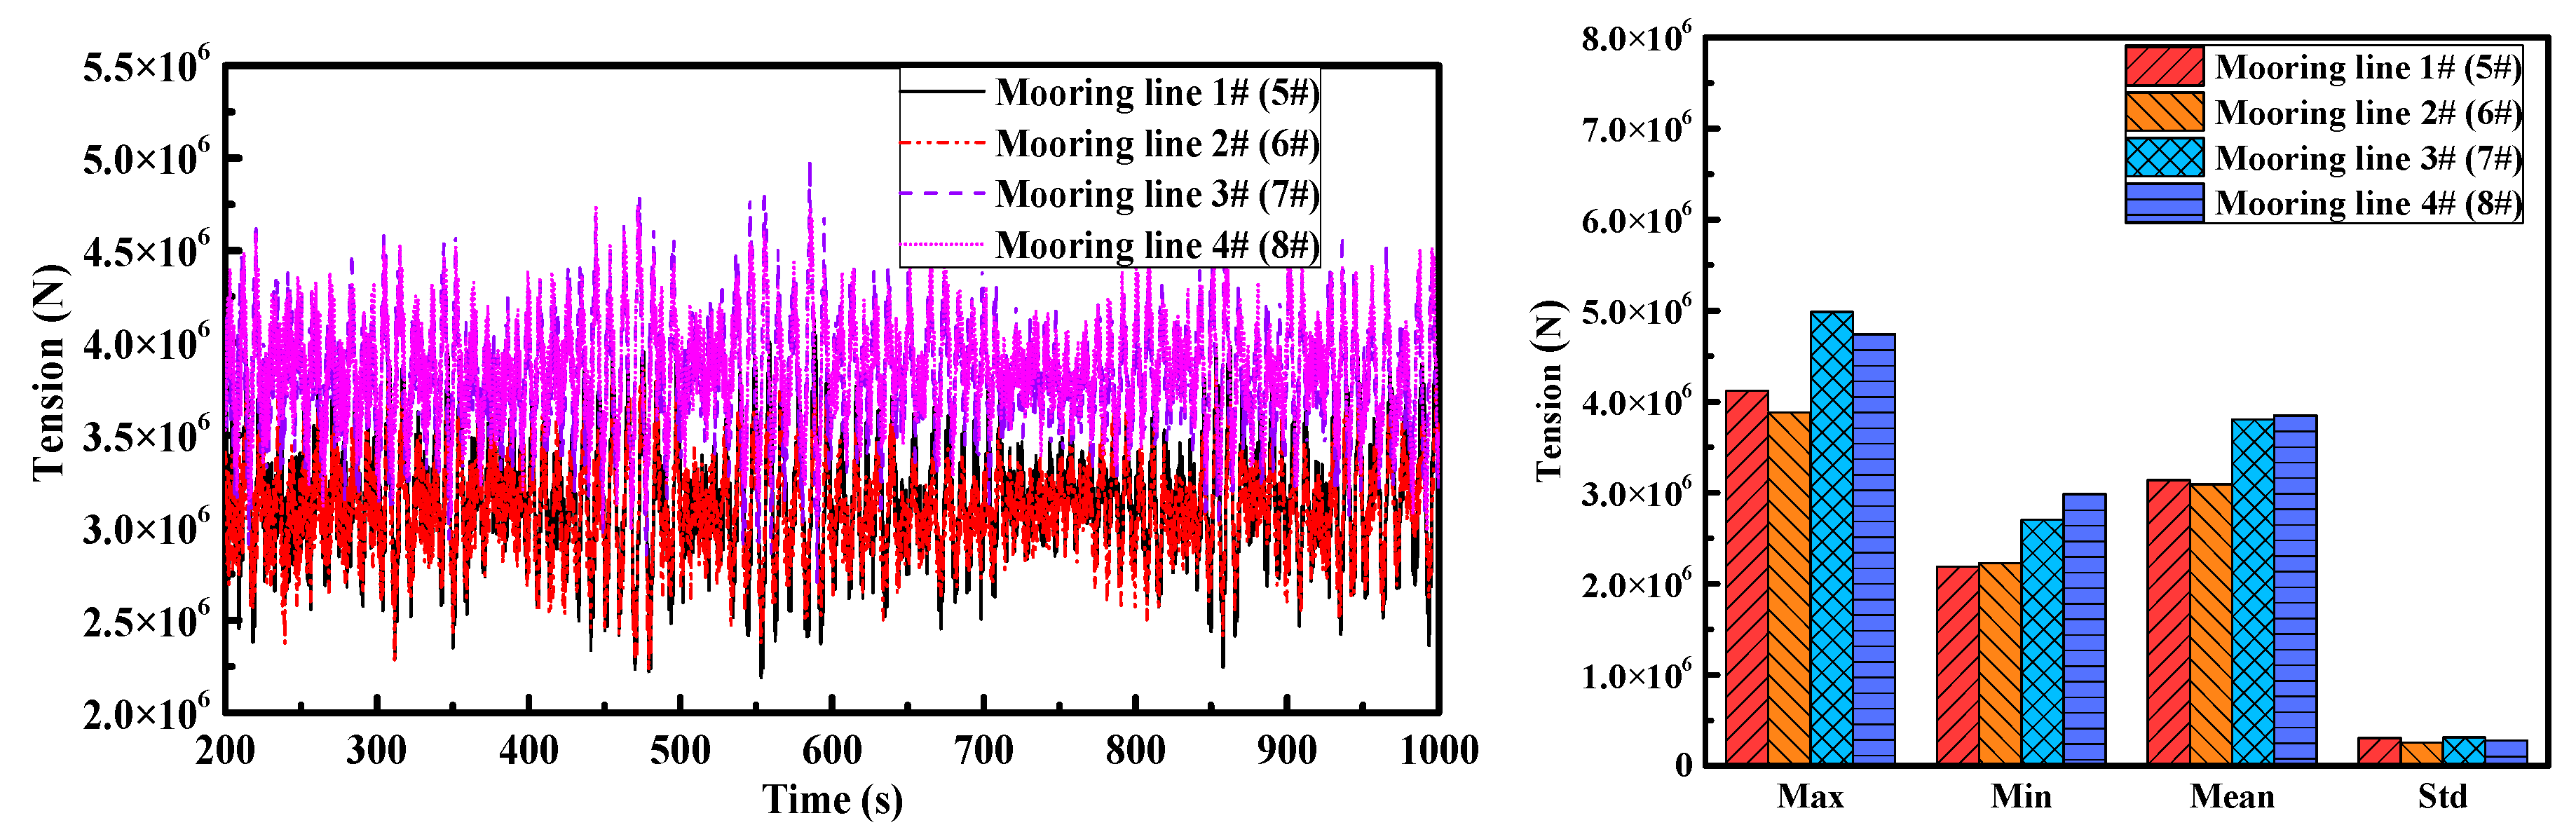
Figure 15.
Time series of tether tensions.
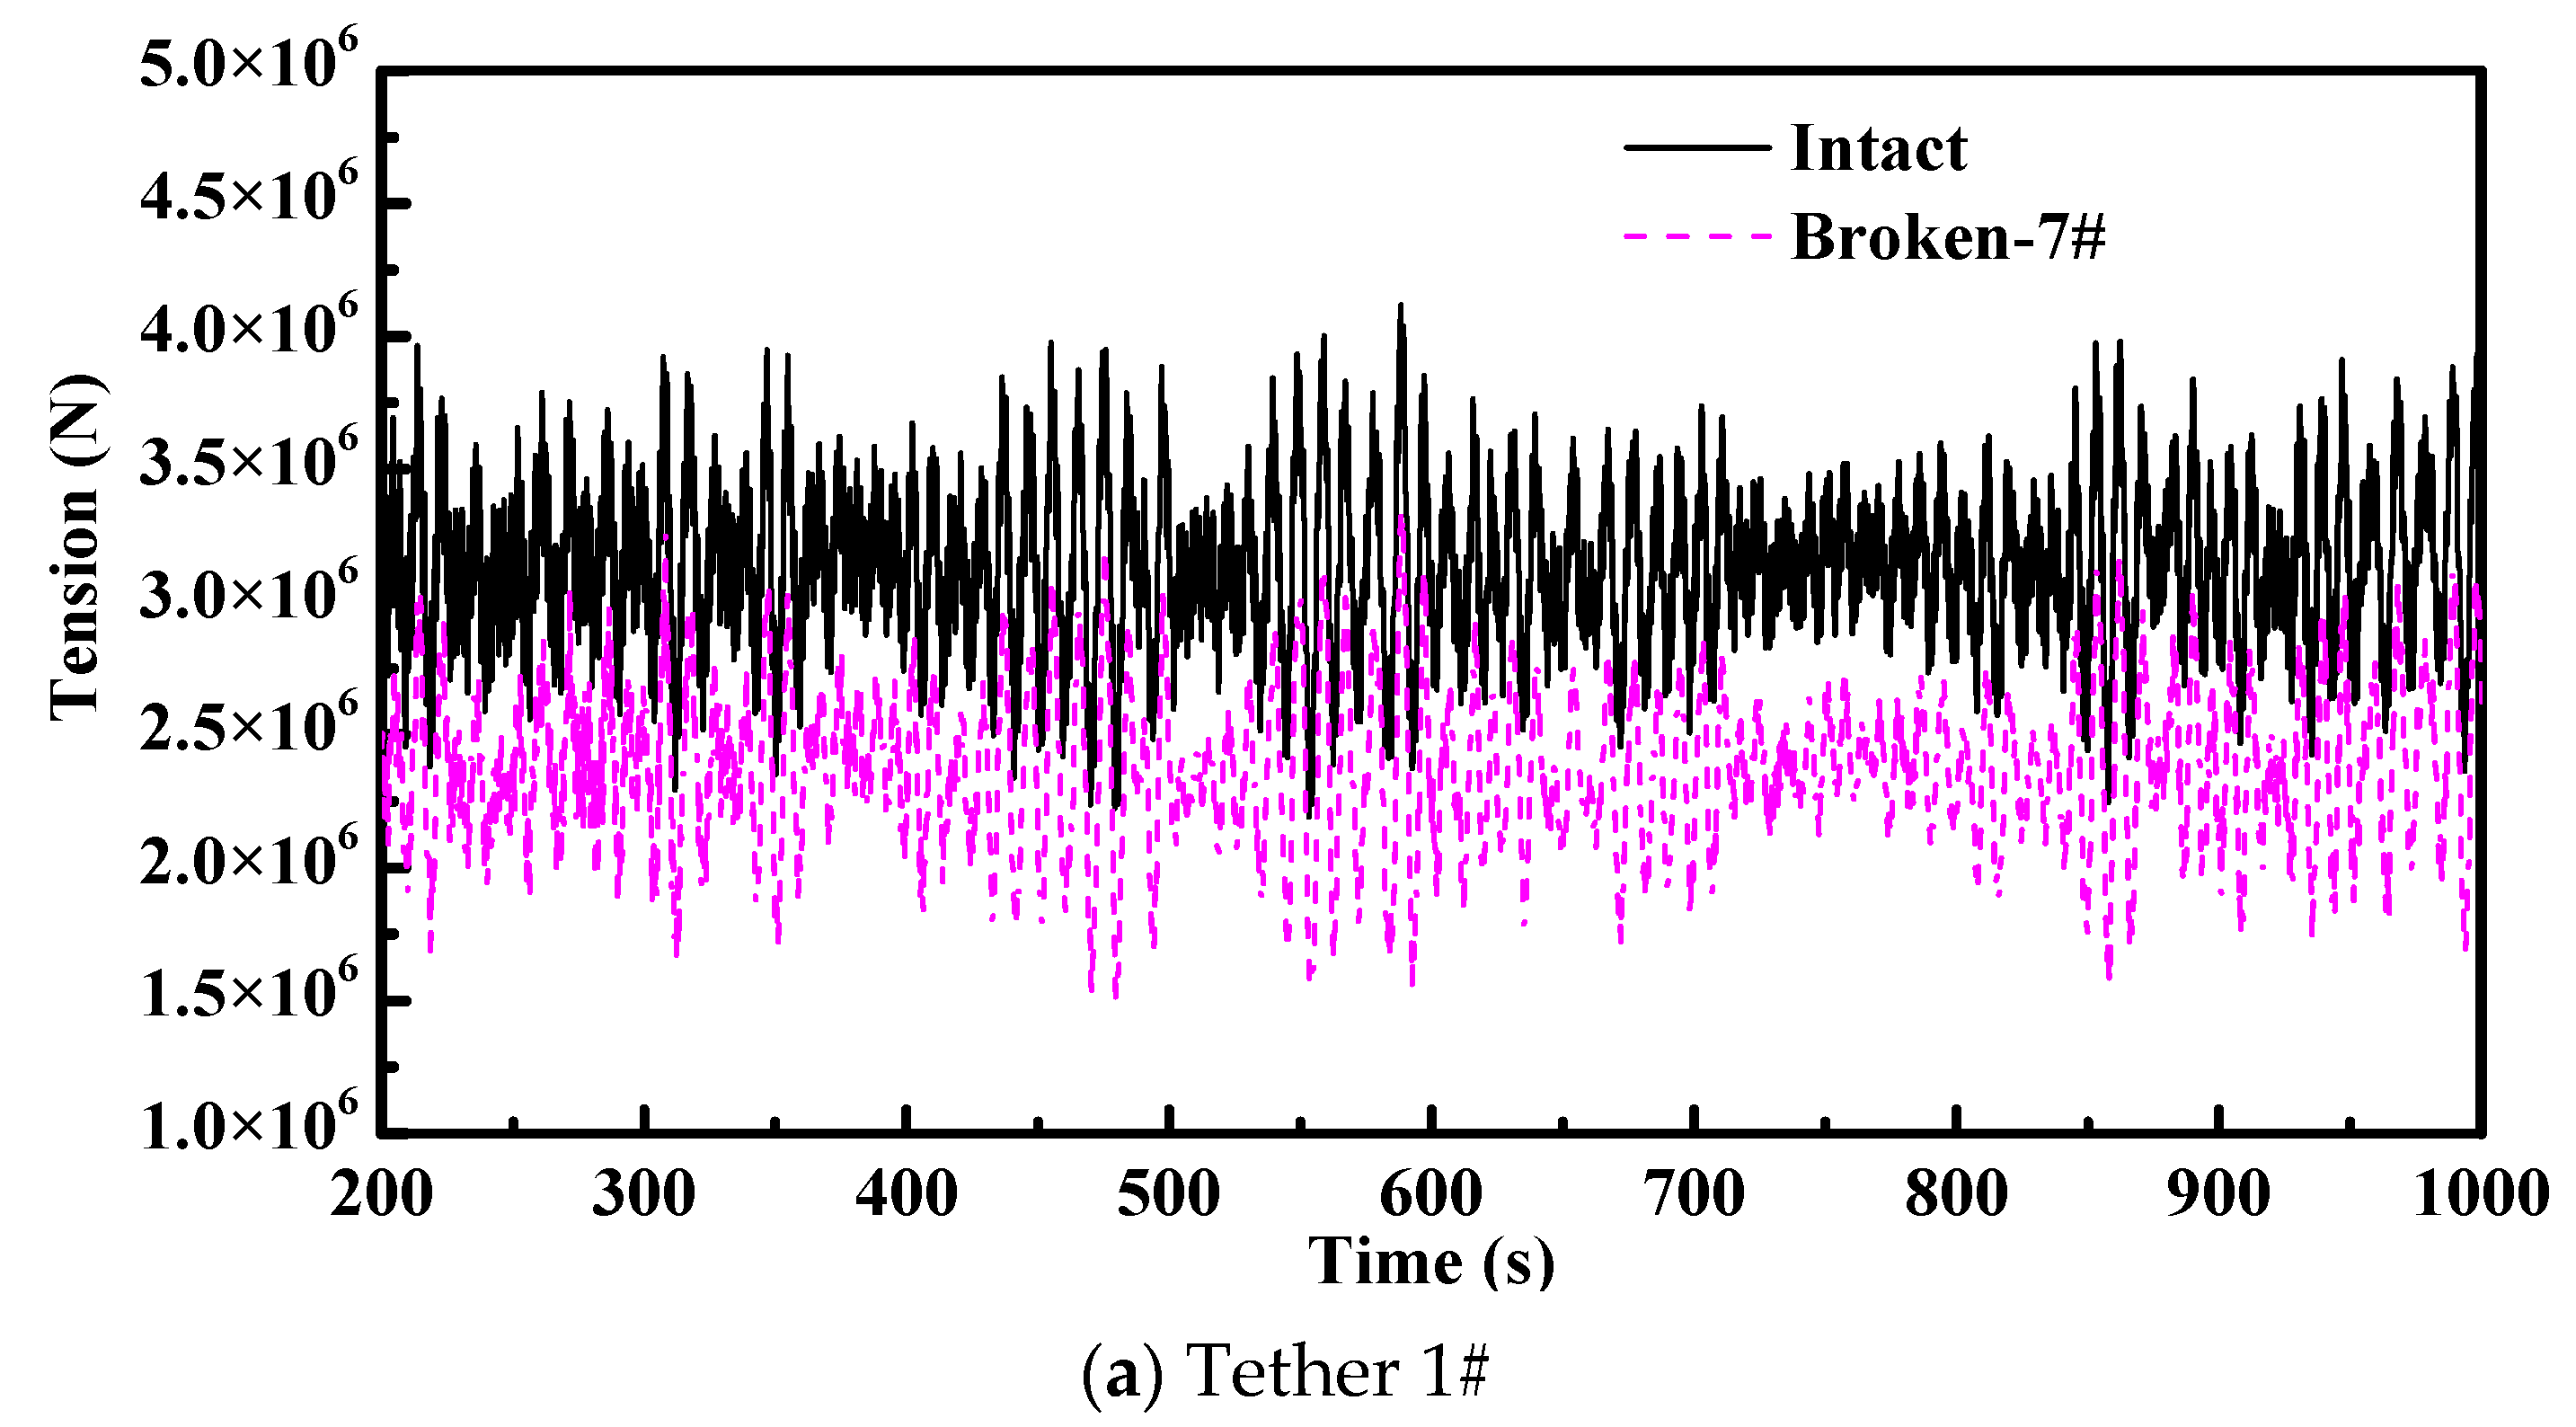
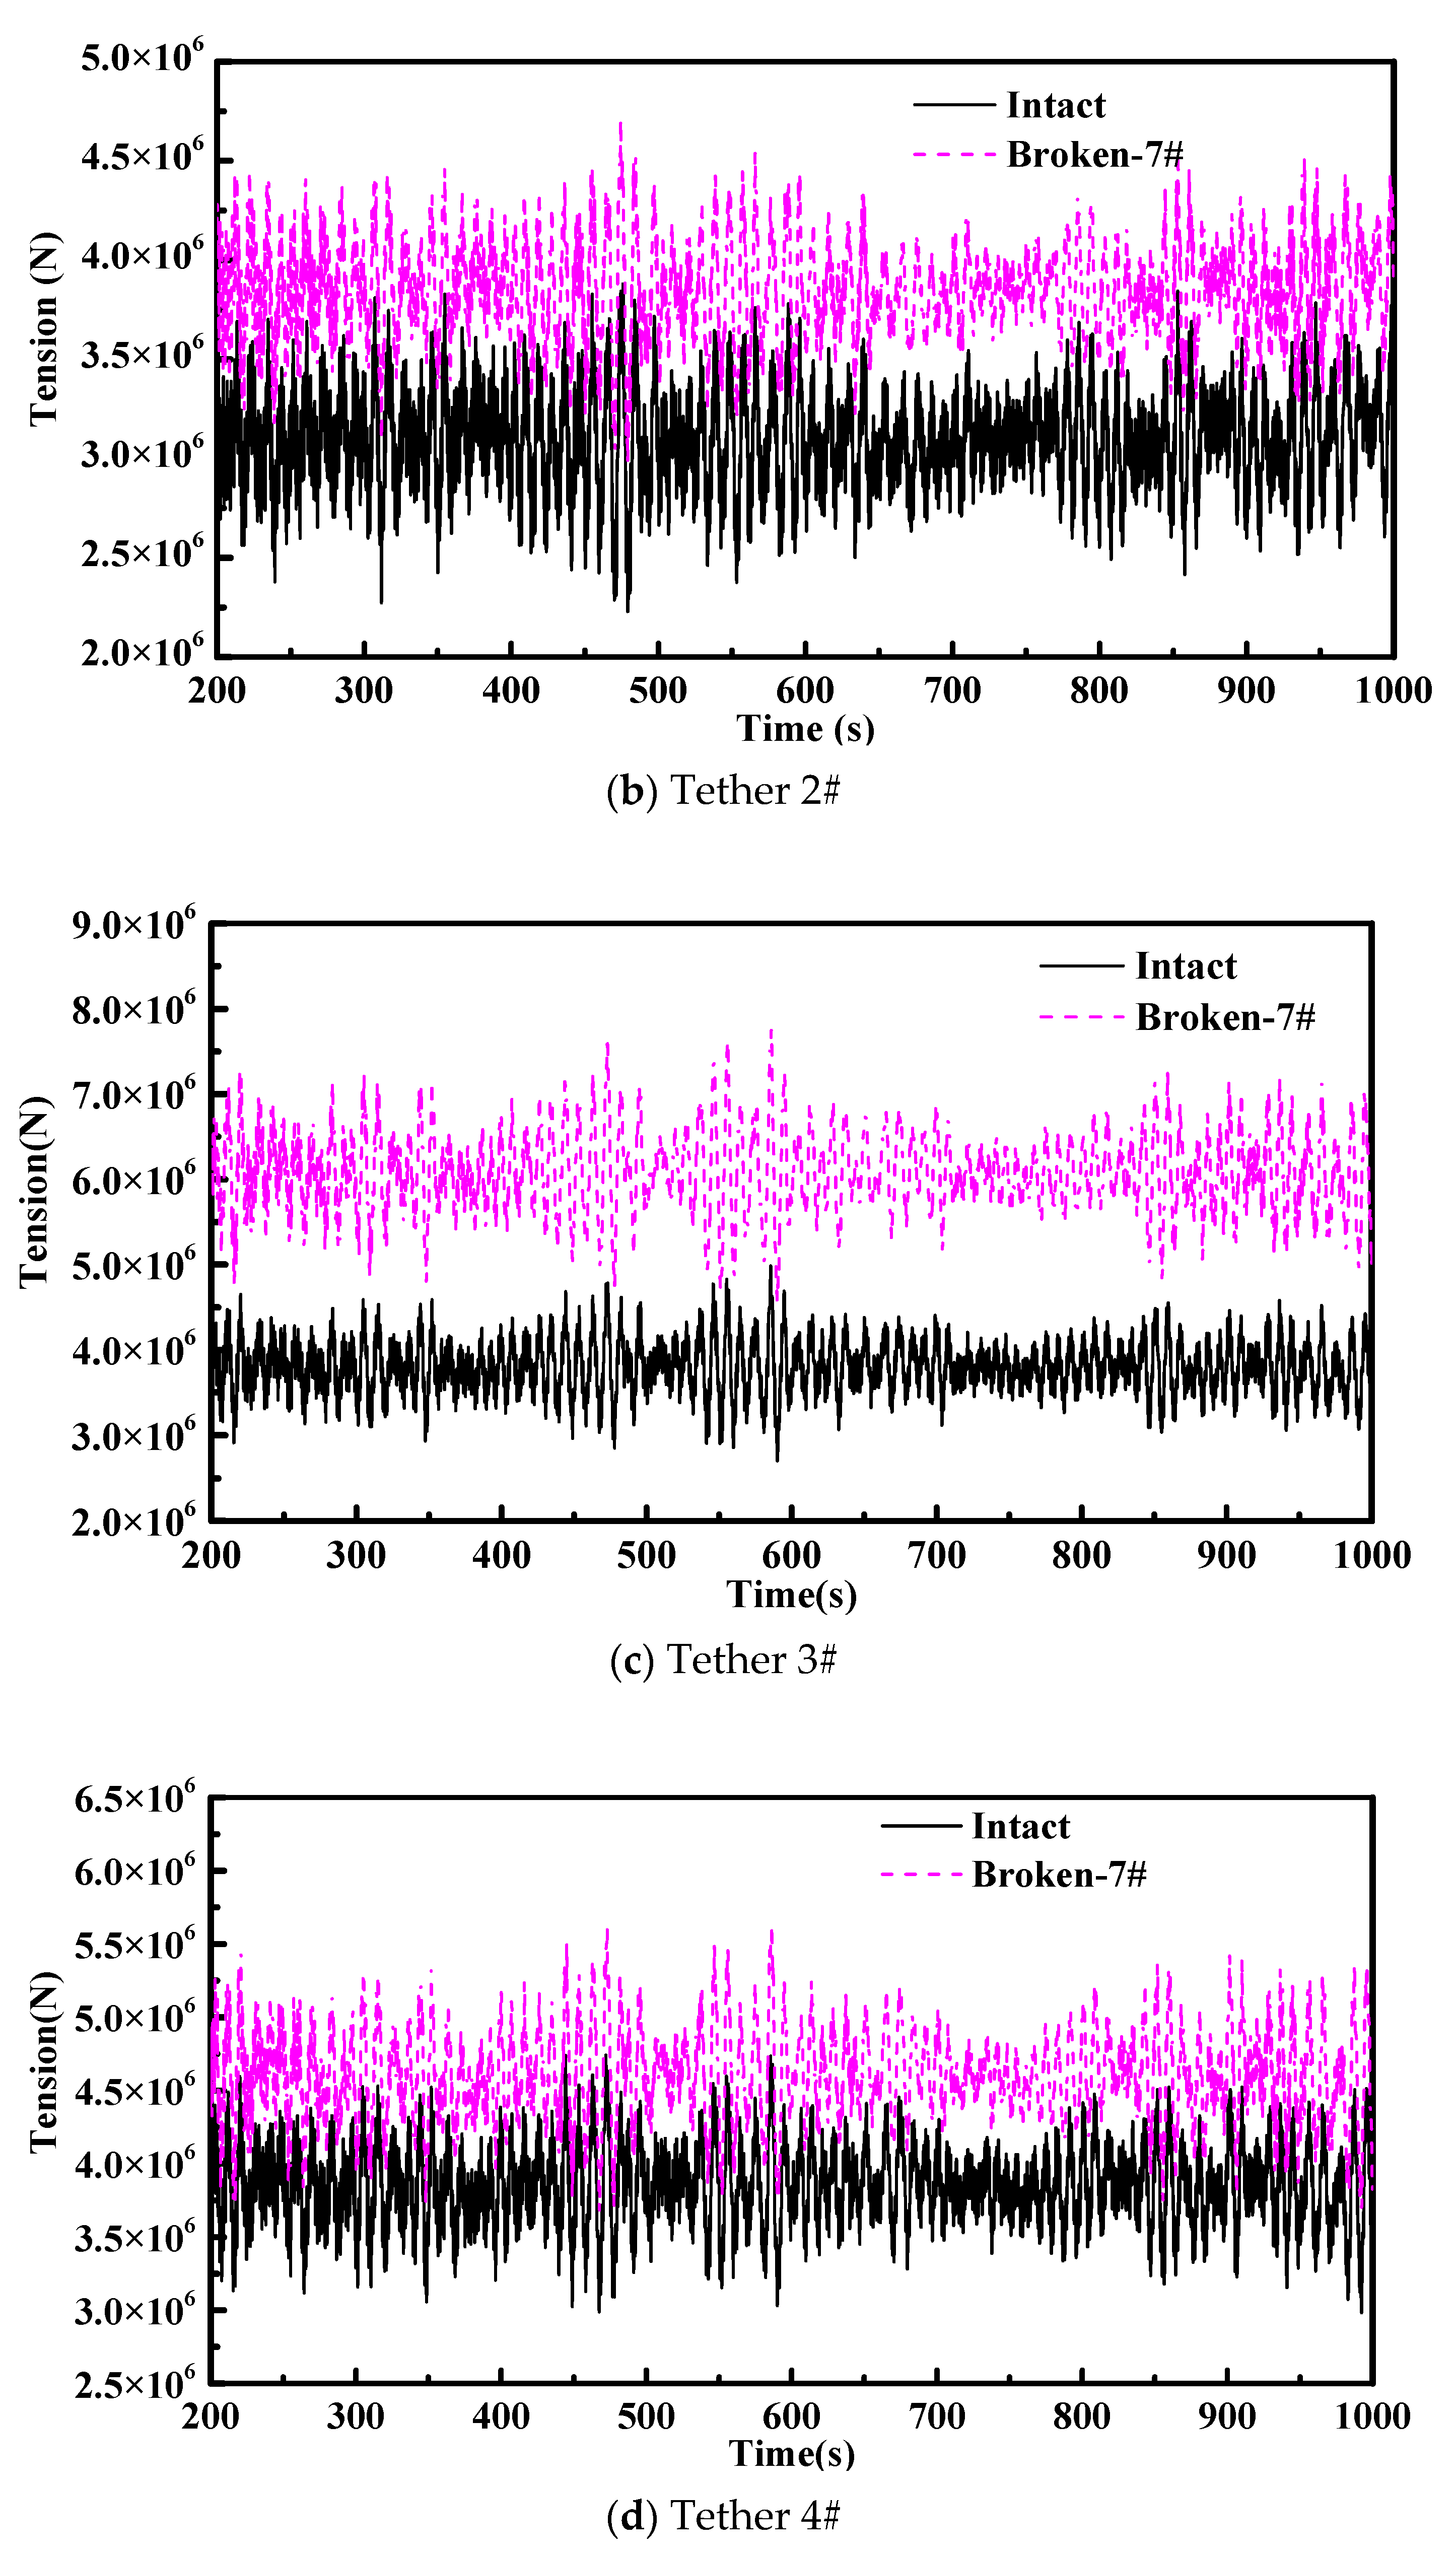
Figure 16.
Comparison of normalized tension statistics.

Figure 17.
Comparison of dynamic response statistics and percent change.


Table 1.
NREL-5MW wind turbine principal properties.
| Impeller Diameter | Hub Diameter | Hub Height | Impeller Mass | Nacelle Mass | Tower Mass | Centroid Coordinates |
|---|---|---|---|---|---|---|
| 126 m | 3 m | 90 m | 110 t | 240 t | 347.46 t | (−0.2, 0.0, 74.0) m |
Table 2.
Floating platform principal properties.
| Item | Value | Item | Value |
|---|---|---|---|
| Pontoon diameter | 9 m | Pontoon height | 12 m |
| Middle axis distance of pontoons | 40 m | Column height | 18 m |
| Column diameter | 6 m | Bracing diameter | 2 m |
| Platform mass (including ballast) | 2734.2 t | Displacement volume | 6116 m3 |
Table 3.
Mooring system principal properties.
| Item | Value | Item | Value |
|---|---|---|---|
| Number of tethers | 8 | Tether mass density | 116.07 kg/m |
| Distance from MWL to anchors | 60–120 m | Pretension | 1500–4500 kN |
| Distance from MWL to upper fairleads | 20 m | Breaking strength | 13,249 kN |
| Tether diameter | 0.127 m | Axial stiffness EA | 2.7 × 10⁹ N |
© 2019 by the authors. Licensee MDPI, Basel, Switzerland. This article is an open access article distributed under the terms and conditions of the Creative Commons Attribution (CC BY) license (http://creativecommons.org/licenses/by/4.0/).
Share and Cite
MDPI and ACS Style
Le, C.; Li, Y.; Ding, H. Study on the Coupled Dynamic Responses of a Submerged Floating Wind Turbine under Different Mooring Conditions. Energies 2019, 12, 418. https://doi.org/10.3390/en12030418
AMA Style
Le C, Li Y, Ding H. Study on the Coupled Dynamic Responses of a Submerged Floating Wind Turbine under Different Mooring Conditions. Energies. 2019; 12(3):418. https://doi.org/10.3390/en12030418
Chicago/Turabian StyleLe, Conghuan, Yane Li, and Hongyan Ding. 2019. "Study on the Coupled Dynamic Responses of a Submerged Floating Wind Turbine under Different Mooring Conditions" Energies 12, no. 3: 418. https://doi.org/10.3390/en12030418
Note that from the first issue of 2016, this journal uses article numbers instead of page numbers. See further details here.