Article

Experimental Study on the Physical Performance and Flow Behavior of Decorated Polyacrylamide for Enhanced Oil Recovery

1
EOR key lab in the Ministry of Education in Northeast Petroleum University, Daqing 163318, China
2
Daqing Oilfield Co., Ltd. No. 6 Oil Production Company, Daqing 163318, China
*
Authors to whom correspondence should be addressed.
Energies 2019, 12(3), 562; https://doi.org/10.3390/en12030562
Submission received: 21 January 2019 / Revised: 10 February 2019 / Accepted: 11 February 2019 / Published: 12 February 2019
(This article belongs to the Special Issue Sustainability of Fossil Fuels)

Abstract

:
With the rapid growth of energy consumption, enhanced oil recovery (EOR) methods are continually emerging, the most effective and widely used was polymer flooding. However, the shortcomings were gradually exposed. A novel decorated polyacrylamide might be a better alternative than polymer. In this work, the molecular structure and the properties reflecting the viscosity of decorated polyacrylamide, interfacial tension, and emulsification were examined. In order to better understand the interactions between decorated polyacrylamide and oil as well as the displacement mechanism, the displacement experiment were conducted in the etched-glass microscale model. Moreover, the coreflooding comparison experiments between decorated polyacrylamide and polymer were performed to investigate the displacement effect. The statistical analysis showed that the decorated polyacrylamide has excellent characteristics of salt tolerance, viscosity stability, and viscosification like polymer. Besides, the ability to reduce the interfacial tension in order 10−1 and emulsification, which were more similar to surfactant. Therefore, the decorated polyacrylamide was a multifunctional polymer. The displacement process captured by camera illustrated that the decorated polyacrylamide flooded oil mainly by means of ‘pull and drag’, ‘entrainment’, and ‘bridging’, based on the mechanism of viscosifying, emulsifying, and viscoelasticity. The results of the coreflooding experiment indicated that the recovery of decorated polyacrylamide can be improved by approximately 11–16% after water flooding when the concentration was more than 800 mg/L, which was higher than that of conventional polymer flooding. It should be mentioned that a new injection mode of ‘concentration reduction multi-slug’ was first proposed, and it obtained an exciting result of increasing oil production and decreasing water-cut, the effect of conformance control was more significant.

1. Introduction

Polymer flooding as an EOR technology boosted in the 1950s in order to ensure the sufficient oil production. Pye and Sandiford [1,2] first noted that the mobility of brine solution could be substantially reduced when the polymer was added. Until now, the researches concerning polymer flooding have matured enough [3,4,5,6], the mechanism of conformance control and mobility control has also been clearly understood by laboratory experiment [7]. The permeability of the reservoir decreased by increasing the viscosity of the water phase and the retention of polymer in the reservoir. Consequently, the mobility ratio and injection profile were improved, the swept region was enlarged. Both commercial and inhouse simulators were applied to optimize the injection process of polymer flooding. Oliveira et al. [8] studied the influence of polymer properties on economic indicators, which was helpful in the sensitivity analysis of polymer parameters. Janiga et al. [9] screened the efficient polymer injection strategy based on the nature-inspired algorithms and reservoir simulation. When the concentration of polymer was higher, the elasticity appeared, which was helpful to pull and drag the residual oil droplets [10]. Wang and Xia [11,12,13] stated that the high visco-elastic polymers can reduce the amount of remaining oil compared with water flooding by the etched microscale model. Zhong [14] established a mathematical model to simulate the transient flows of viscoelastic polymer, and obtained the pressure and velocity distribution in the course of flooding. Mohammad Sadegh et al. [15] took some factors into account such as effective concentration, thermal effects, dispersion, diffusion, etc., in order to improve the accuracy of viscoelastic polymer flooding model at present stage. Large-scale applications have gradually been realized in China after the 1990s, mainly in mature oil fields and offshore heavy oil fields [16,17]—for instance, Daqing Oilfield, Shengli Oilfield, and Bohai Oilfield.
Laboratory and field tests showed that recovery based polymer flooding was higher than that of water flooding by 10% [18]. However, lots of oil reserves remained underground by approximately 50% after polymer flooding. This was probably due to the shortcomings of polymer, a lower viscosity retention when located in the high temperature and salinity reservoir [19], as well as in the process of high-speed injection [20]. Additionally, water preferential channels appeared after long term displacement in the actual non-homogeneous reservoir. All those led to highly scattered distribution of remaining oil and coexisted with the water advantage channels, causing the waste and pollution of injected polymer [21,22]. Consequently, numerous studies were carried out to develop novel polymers. Zhang et al. [23] investigated the molecular structure of hydrophobically associating polyacrylamides (HAPAM) characterized by its tackifying performance. Lai et al. [24] synthesized shear-resistance hyperbranched polymers with special network, which can reduce the effect of shear. Li et al. [25] created a hydrophobically associating fluorinated polyacrylamide with amazing surface activity and thickening property. You et al. [26] studied the properties of a self-thickening polymer (STP), which was similar to gel, and can be prepared by produced water, moreover, a better effect of water control and oil increase was obtained. It was concluded that nanoparticles such as silica and titanium dioxide were applied broadly in polymer flooding and surfactant flooding to enhanced oil recovery, especially for heavy oil reservoir [27,28,29,30,31]. Cheraghian et al. [32] synthesized a nanopolymer used nanoclay and PAM, which has a good stability in the polymer solution. Besides, the amphiphilic polymer, biopolymers, low-tension polymer, thermally-stable, and salt-tolerant polymers have also been studied [33,34,35]. Overall, the mainly EOR mechanism of above polymers was still increasing the viscosity or decreasing the viscosity loss.
Nevertheless, it was unsatisfactory to further enhance oil recovery only depended the viscous property of polymers, lower interfacial tension and emulsification also played important roles in enhancing oil recovery. Polymer/surfactant binary system, alkali-surfactant-polymer (ASP) combinational flooding system, heterogeneous compound flooding system and foam flooding system have become the main direction of enhanced oil recovery technology after polymer flooding [36,37,38,39]. It was proved that the ASP flooding improved oil recovery by 17.2%, the recovery increment of SP flooding reached 14.3%, and that of the foam flooding was 13.1% [40]. However, some problems were still in existence, chromatographic separation due to the differences lied in migration velocity of components was the main problem, especially for the low permeability reservoir [41]. Which resulted in poor synergy of multi-component and waste of costs and chemicals.
Furthermore, the injection mode was important for enhanced oil recovery. Zhu et al. [42] stated that adjustable-mobility polymer flooding can enlarge the swept region of medium and low permeability layer. A variable viscosity injection was also applied in polymer flooding [43], Li et al. [44] compared the different injection pattern of polymer flooding, the result showed that the three-stage plugged injection with relatively high molecular polymer was the optimal approach to enhanced recovery. Considering above points, single displacement agent with multi-functional groups might be a better alternative and new injection pattern needed to be explored urgently.
The primary objective of this study was to evaluate the physical properties of a novel decorated polyacrylamide, which possessed the excellent characteristic of polymer and surfactant. In addition, the oil displacement mechanism and flow behavior were uncovered by means of etching glass model. Finally, the comparison experiments were performed to verify the displacement effect of decorated polyacrylamide. Meanwhile, a new injection method has been proposed to improve the recovery.

2. Materials and Methods

2.1. Materials

The decorated polyacrylamide (DP) used in this research was provided by Chinese Academy of Sciences, the purity was more than 91%, the particle size from 0.2 mm to 1.0 mm accounted for 94%. The polymers were polyacrylamide from Daqing Refining & Chemical Company, which molecular weight were 1.5 × 10⁷ and 3.5 × 10⁷. The oil sample used in the experiment was from the First Oil Production Plant in Daqing Oilfield, the viscosity of simulated oil was 10 mPa·s at 45 ℃. The brine water with salinity of 6778 mg/L was prepared according to the water of the First Oil Production Plant, the composition of injection water and wastewater were all presented in Table 1. Sodium chloride (NaCl) was from Shanghai Yansheng Biochemical Co. Ltd., China.

2.2. Equipment

The main equipment included an environmental scanning electron microscope (ESEM), a vacuum freeze drier, a LVDV-II + Pro viscosimeter, a HJ-6 magnetic stirrer, a thermostat, a Texas-500 interfacial tensiometer, an electronic balance, beakers, test tubes, and measuring cylinders. The coreflooding experiment equipment was from Wuxi City Petroleum Instrument Equipment Co., Ltd. China, the experimental setup was depicted in Figure 1a. The displacement experiments were carried out by artificial sinter cores, which were square with length 30 cm and the thickness 4.5 cm, and made of quartz sand and epoxy resin. The key parameters of cores were listed in Table 2. The oil displacement mechanism experiment device was presented in Figure 1b, the etching glass model was 40 cm in length and 40 cm in width, the average pore size of unevenly distributed pores and throats was 0.1 mm and the cross section was elliptical. One injection well and one production well were distributed at both ends of the diagonal line of the model.

2.3. Method

2.3.1. Microstructure Measurement

The polymer (molecular weight was 1.5 × 10⁷) and DP solution with a concentration of 1000 mg/L were prepared, then the liquid sample of two chemical agents were placed on the stainless steel concave groove by a dropper respectively. Immediately, the samples solidified rapidly by the injected liquid ammonia. Meanwhile, a vacuum was created by means of vacuum freeze drier, which leaded to the water molecular located in the solution was sublimated, the dried samples were obtained. Finally, the samples were moved into the ESEM to observe and analyze the visualization images.

2.3.2. Salt Tolerance Property Measurement

Considering the Na+ was the main cation in the formation water, the sodium chloride was selected to perform the salt tolerance property measurement. Firstly, the two chemicals’ mother liquors of 5000 mg/L were simulated respectively, the NaCl solution was added into the mother liquors until the concentration up to 1000, 3000, 5000, 6000, 7000, and 9000 mg/L respectively. At last, the viscosities of different salinities were determined at 45 ℃.

2.3.3. Viscosity-Improvement Measurement

In this study, the mother liquors with a concentration of 5000 mg/L were prepared by injection water, and diluted to different concentrations by injection wastewater (i.e., 500, 800, 1000, 1500, 1800, and 2000 mg/L). The viscosities of polymer (molecular weight was 3.5 × 10⁷) and DP solution of different concentrations were tested by a LVDV-II + Pro viscosimeter at the rate of 6 rpm with magnetic stirrer.

2.3.4. Viscosity Stability Measurement

The DP solution of different concentrations (1500 mg/L and 2000 mg/L) were made up by injection wastewater, and the solution were placed in different days (0, 3, 7, 15, 30, 60, and 90 days), then the concentrations were measured by a viscosimeter to evaluate the viscosity stability.

2.3.5. Emulsification Property Measurement

Samples were prepared by mixing different concentrations of DP solution (20, 50, 100, 150, 200, 300, 500, 800, and 1000 mg/L) with oil at the volume ratio of 1:1. After that, the measuring cylinders with mixed samples were put into the thermostat for 15 min, then shaken by approximately 200 times to form an emulsion. Meanwhile, the emulsification phenomenon was observed regularly.

2.3.6. Interfacial Tension Measurement

The spinning drop method was applied to interfacial tension measurement, the experimental temperature was 45 ℃. The DP of different concentrations (800, 900, 1000, 1200, 1400, 1600, and 1800 mg/L) and a 2 μL oil drop were injected into the test tubes respectively. An elliptical or cylindrical droplet will be formed at the rotation speed of 5000 r/min, under the action of gravity, centrifugal force and interfacial tension. Subsequently, the length and width of droplets were determined once every 20 min until the morphology was stable. According to Equation (1), the interfacial tension was calculated.
I F T = 0.521 × Δ ρ × D 3 T 2
where IFT refers to the interfacial tension (mN/m), T the rotation period (s), Δ ρ the density difference of oil and DP (g/cm3), D the diameter of oil droplet (cm).

2.3.7. Cores Displacement Experiment

Experimental flowchart presented in Figure 1a was used in this study, nine single-tubes were applied to compare the oil recovery of polymer and DP (numbered 1–9). The cores parameters and injection fluids were shown in Table 2. According to the measured relative permeability curves before, the mobility ratios of water–oil and polymer–oil were approximately 55 and 0.3, respectively. The cores flooding experiment steps included that:
(1)
The casted cores were vacuumed for several hours until the weight did not decrease, then the dry weight were measured. Next, saturated the cores with brine (6778 mg/L), the porosities were attained.
(2)
The above cores were taken into the thermostat at 45 ℃ for more than 12 h. The simulated oil was injected until the water cut was 0%. Step (1) and (2) were called core treatment in the following text. The initial oil volume (saturation) and irreducible water saturation were obtained.
(3)
The brine was injected at a rate of 0.1 mL/min as far as the water-cut equaled 98%, the amount of displaced oil was obtained from the collector. The ratio of displaced oil volume to initial oil volume was the recovery of water flooding.
(4)
The chemicals were injected as designed in Table 2, then the chase water was injected again until the water content raised to 98%. As above, the oil volumes from chemicals flooding were attained from collector, based on the initial oil volume, the recovery were calculated. Consequently, the recovery increments were received.
In addition, the dual-tubes model (no. 10) was used to investigate the concentration reduction multi-slug injection of DP. The injection order was that: water injection, injection of polymer (1000 mg/L, 0.6 PV), succeeding water injection, injection of DP (1500 mg/L, 0.6 PV), injection of DP (1000 mg/L, 0.3 PV) and subsequent water injection. The injection rate was 1.2 mL/min.

2.3.8. Displacement Experiment in Etched-Glass Micromodel

The experiment was completed using the installations depicted in Figure 1b, the experimental procedures were similar to Section 2.3.7. The process included that water flooding, polymer flooding, chase water flooding, DP flooding, and succeeding water flooding in turn. Simultaneously, the experiment course was photographed by camera for analysis and research.

3. Results and Discussion

3.1. Microstructure of the DP

Figure 2a depicted the molecular structure of the DP. It can be seen that the chemical agent took flexible acrylamide and sodium acrylate hydrocarbon chain as the backbone, there occurred copolymerization with multiple functional monomers as the side chains, such as anionic or nonionic surfactants. A novel polymer we called decorated polyacrylamide (DP) was formed, which has the both characteristics of polymer and surfactant, coexistence with hydrophilic and hydrophobic groups. Figure 2b,c compared the microstructures of polymer and DP solution with a concentration of 1000 mg/L. It was indicated that the network structure formed in the polymer solution, which resulted in a good viscoelasticity to enlarge the sweep efficiency. However, the network structure was three-dimensinal in the DP solution and became denser. At a high concentration, the DP solution had the plugging property, and it was easier to enter inaccessible pore at low concentration. Consequently, the sweep volume was expanded.

3.2. Physical Properties of the DP

3.2.1. Salt Tolerance Property Analysis

As the viscosity data showed in Table 3, with the concentration of NaCl increased, the viscosity of polymer was declined. In contrast, the viscosity of DP was increased first, and then decreased at 6000 mg/L. It indicated that the polymer has no salt tolerance property, due to there was a repulsion effect among the carboxyl ions in polymer solution. Besides the formation water was rich in metal ions, the existence of sodium and potassium ions weaken the repulsion of charges, and it made the molecules coil up and the viscosity declined. It showed a significant salt tolerance property as the concentration of NaCl increased as it concerned the DP. Because the polarity of the solution was enhanced by adding NaCl, it brought about the decrease of contact area between the DP molecule and water molecule. Meanwhile, the physical contact points among the molecule groups were increased correspondingly, it was possible to form a network structure. In addition, due to the association of hydrophobic groups, the molecules were close to each other, the hydrodynamic radius was increased and the viscosity was increased. The increment was more obvious from 3000 mg/L to 5000 mg/L, and maintained over 300 mPa·s. This increase rate after a certain NaCl concentration of 6000 mg/L off, it could be explained by the fact that the probability of intramolecular association was greater than that of intermolecular association, therefore, the viscosity decreased.

3.2.2. Viscosification Property Analysis

The correlations of apparent viscosity and concentration of different chemical agents were shown in Figure 3a. It was indicated that the apparent viscosity increased with the concentration increased, and the increase increment of DP was larger than that of polymer. The reasons might be that the molecular weight of polyacrylamide was 3.5 × 10⁷, which belonged to high-molecular polymer, the hydrodynamic size was larger. The molecular attraction increased when the concentration increased, meanwhile, the molecular motion became intense, the internal friction force and flow resistance increased, then the viscosity increased accordingly. In addition, as the molecular chain increased, the entanglement effect became more obvious, and the viscosity was larger. Although the molecular weight of DP was lower than the polyacrylamide, there were hydrophobic groups in the DP. When the concentration was below 1000 mg/L, the viscosity reduction effect of intramolecular association and the viscosifying effect of intermolecular association reached an equilibrium state. Whereas, the intermolecular association played a dominant role, resulting in the significant viscosity enhancement when the concentration was more than 1000 mg/L. Moreover, the association effect of hydrophobic groups was a dehydration action, which depended on the polarity of the solution. The stronger the polarity, the more compact the molecular chain, and the more obvious the association. Duo to the solution was prepared by wastewater, the existence of more cations made the polarity of the solution enhanced, and the association was intensified.

3.2.3. Viscosity Stability Analysis

Figure 3b clearly showed that the viscosity was increased substantially at the beginning and then decreased as the time. The difference was that when the concentration was 1500 mg/L, the viscosity reached a maximum value after seven days, then reduced sharply, and finally the viscosity kept stable, the viscosity retention rate was about 52%. However, the viscosity achieved maximal after three days, then gradually flatten with slight declines at 2000 mg/L, the viscosity retention rate was almost 99%. On account of the solution was prepared by injection wastewater, the existence of dissolved oxygen, bacteria, and microorganisms made the apparent viscosity of the solution instable, and the oil displacement was worse. Fu et al. [45] revealed that the polymer degraded severely in both clean water and waste water, and viscosity decreased with time. Nevertheless, the –SH and surfactants located in DP, which has an antioxidation and resistance to biodegradation. The peroxide in the solution was decomposed effectively via the self-oxidation of oxygen transfer groups, and the fracture of molecular chains under oxidation was inhibited, consequently, the viscosity did not decrease continuously. When the concentration was below a certain value, it was difficult to degrade substantially. Yet, the number of oxygen transfer radicals achieved a certain degree as the concentration increased, the viscosity loss rate was reduced under the comprehensive action.

3.2.4. Emulsification Property Analysis

It can be seen from Figure 4a that emulsification occurred in the system, which was not separated after resting for 16 days, and the emulsion type was oil-in-water when the concentration was over 800 mg/L. The emulsion was thermodynamically unstable system, it was necessary to inhibit the stratification and coalescence to maintain stability. The stratification rate can be expressed by Stockes formula (Equation (2)). The viscosity was increased with the concentration as mentioned above, which leaded to less the stratification rate. In addition, it was mentioned that wettability affected the multiphase flow, and wettability of sandstone was generally water-wet [46]. Due to the functional monomers of DP might be the alkyl sulfonate surfactant unit and quaternary ammonium Gemini surfactant unit, which led to the DP being adsorbed at the water–wet interface, the adsorption film formed as shown in Figure 4b. The stability of emulsion was improved due to the collision of emulsion droplets was prevented. Moreover, the existence of film made it difficult to wet the pore wall during the process of oil droplets migration, the displacement efficiency was improved. When the functional monomer was anionic surfactant, the charge density on the pore wall will be increased by the adsorption film. Thus, the electrostatic repulsion force between oil droplets and pore wall was increased, the oil droplets were easily to be taken away. Simultaneously, the emulsion droplets will be stuck in the three-dimensional network structure at a high concentration of DP, the droplet coalescence and floatation can be avoided.
v = ( ρ o ρ D P ) g 18 μ D 2
where v is the stratification rate (cm/s), ρ O the density of oil (g/cm3), ρ D P the density of DP (g/cm3), g the gravitational acceleration (981 cm/s2), D the diameter of emulsion droplet (cm), μ the viscosity of DP (Pa·s).
A large number of experiments showed that emulsification was contribute to enhance oil recovery. The mechanism included entrainment and profile control. On the one hand, the emulsion flowed at a low speed, and the oil droplets of dispersed phase were extruded to kick-off the oil film at the pore wall, which has been named entrainment. On the other hand, it was easier for high viscosity emulsion to enter into high permeability layer preferentially, the large channels were plugged, and the swept region was enlarged. Besides, the emulsion can also reduce the resistance of lipophilic pore and improve the mobility of fluid.

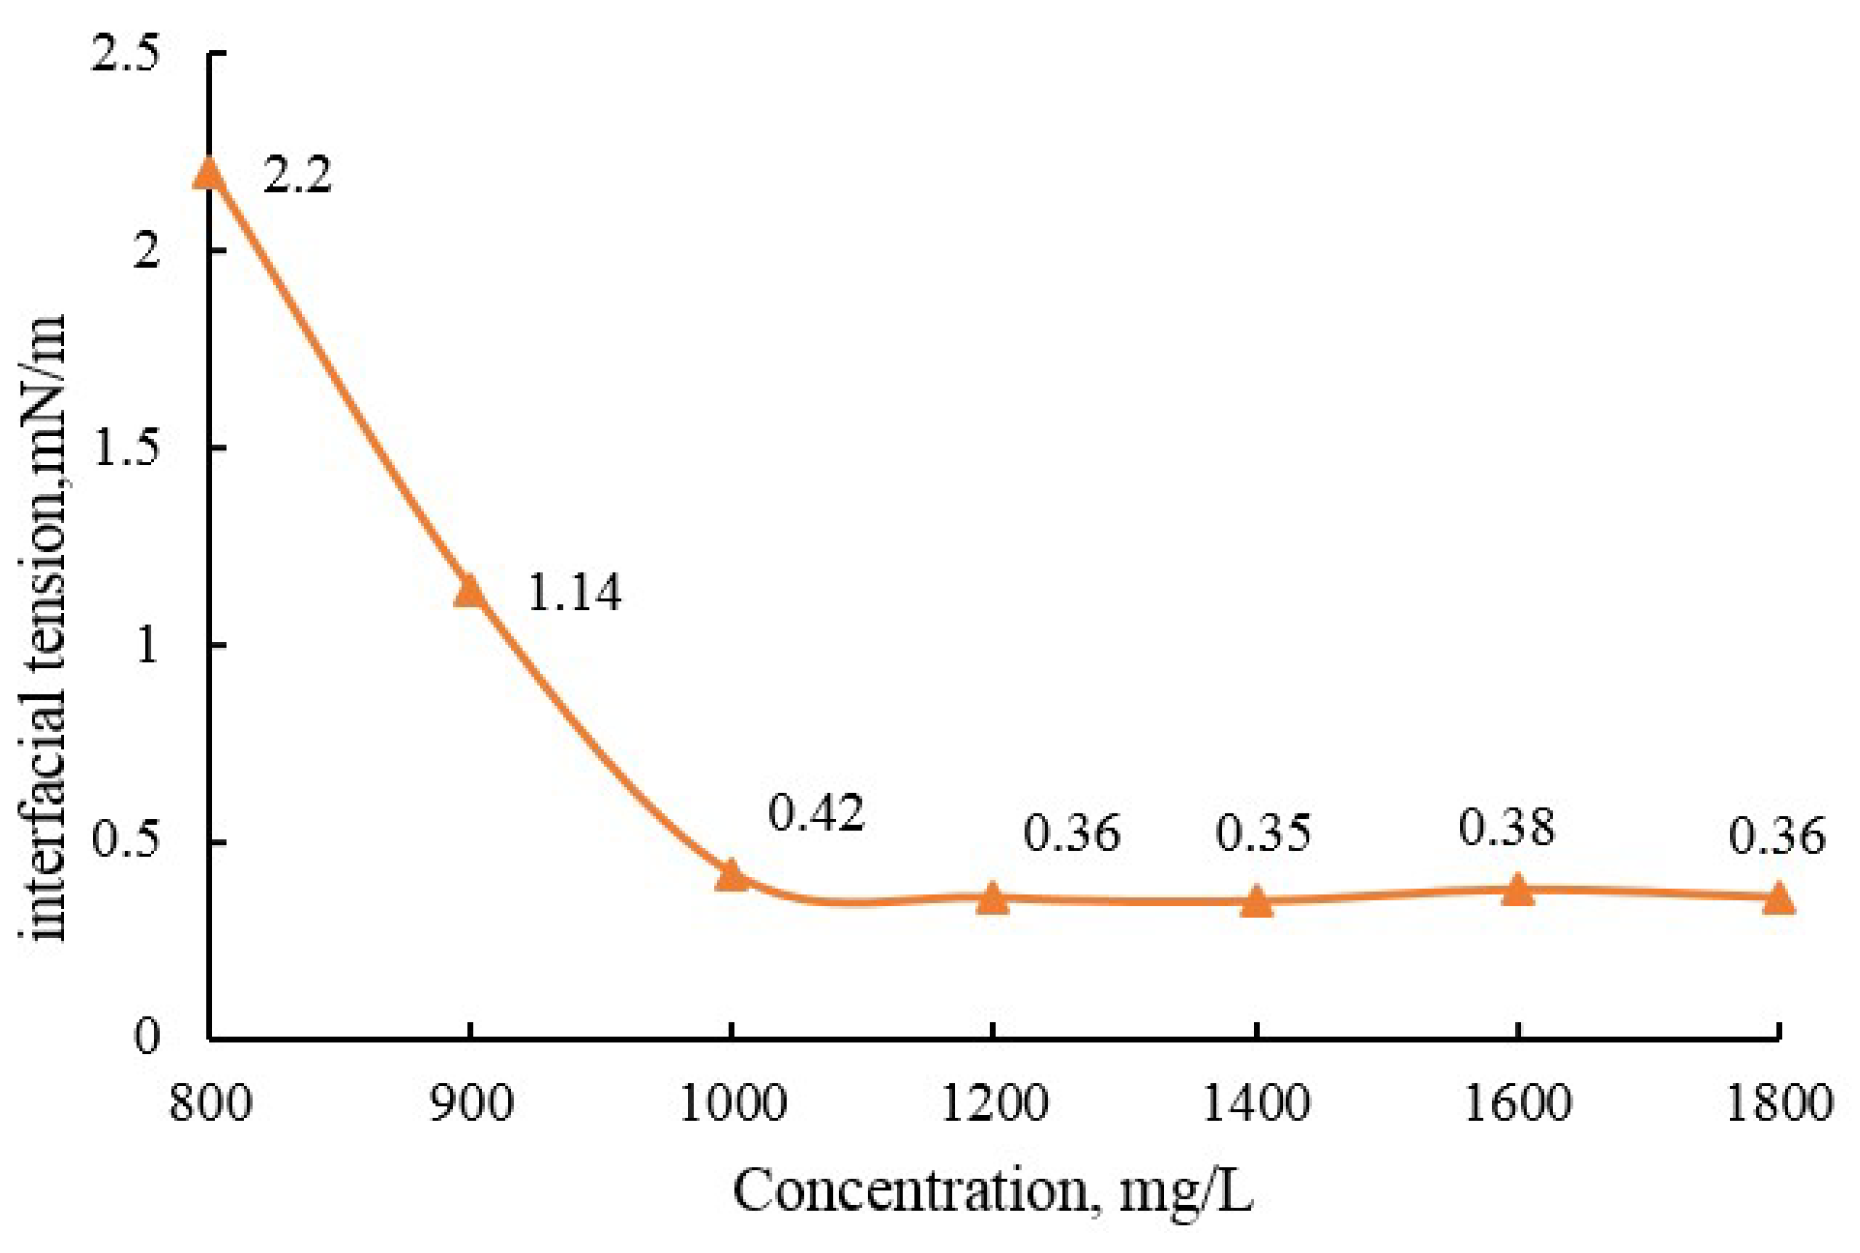
3.2.5. Interfacial Tension Analysis

The interfacial tensions (IFT) at different concentrations were given in Figure 5. It can be determined that the IFT decreased first, and then nearly flat as the concentration increased. The IFT was in order 10 mN/m when the concentration was lower than 1000 mg/L. However, the oil-DP IFT maintained in order 10−1 mN/m when the concentration over 1000 mg/L. Therefore, the DP can reduce interfacial tension to some extent, exhibit the characteristic of surfactants. It was due to the hydrophilic and hydrophobic groups of DP having different directions on the interface as shown in Figure 4b. On the basis of capillary number (Ca) theory [47], the larger the Ca, the lower the residual oil saturation. In general, the Ca of water flooding was about 10−6–10−5, if the higher production was obtained, the Ca needed to be more than 10−3. As a result, it was possible for DP to displace the remaining oil by a higher Ca.

3.3. Oil Displacement Mechanism and Flow Behavior in Etching Glass model

3.3.1. Displacement Mechanism of DP

Figure 6 clearly showed that the residual oil distributions in the micromodel at different stages. The dark brown sections corresponded to oil. It can be seen that there were amounts of residual oil after water flooding. Although the decrease in remaining oil after polymer treatment, some of them was still concentrated at the outlet end as shown in Figure 6c. After the DP injected as showed in Figure 6e, there was obvious effect on recovery, the swept region was enlarged significantly. The reason might be that the viscosity of DP was greater than that of polymer, the ability of expanding sweep volume was stronger. According to the Newton’s law of friction (Equation (3)), the high viscosity increased the internal friction between liquid layers, which was the main force of fluid flow. Therefore, the shear stress between DP and oil was greater than that between polymer and oil, the displacement efficiency of the former was inevitably enhanced. In addition, the DP possessed the properties of both polymer and surfactant. On the one hand, it can push and pull residual oil in pores and throats with viscoelasticity like polymer flooding. On the other hand, the interfacial tension can be reduced to make the residual oil deform easily, meanwhile, accompanied by emulsification, which can enhance the carrying capacity [48].
τ = μ d v d y
where τ is the shear stress (N/m2), dv/dy the velocity gradient (s−1), μ the viscosity of DP (Pa·s).

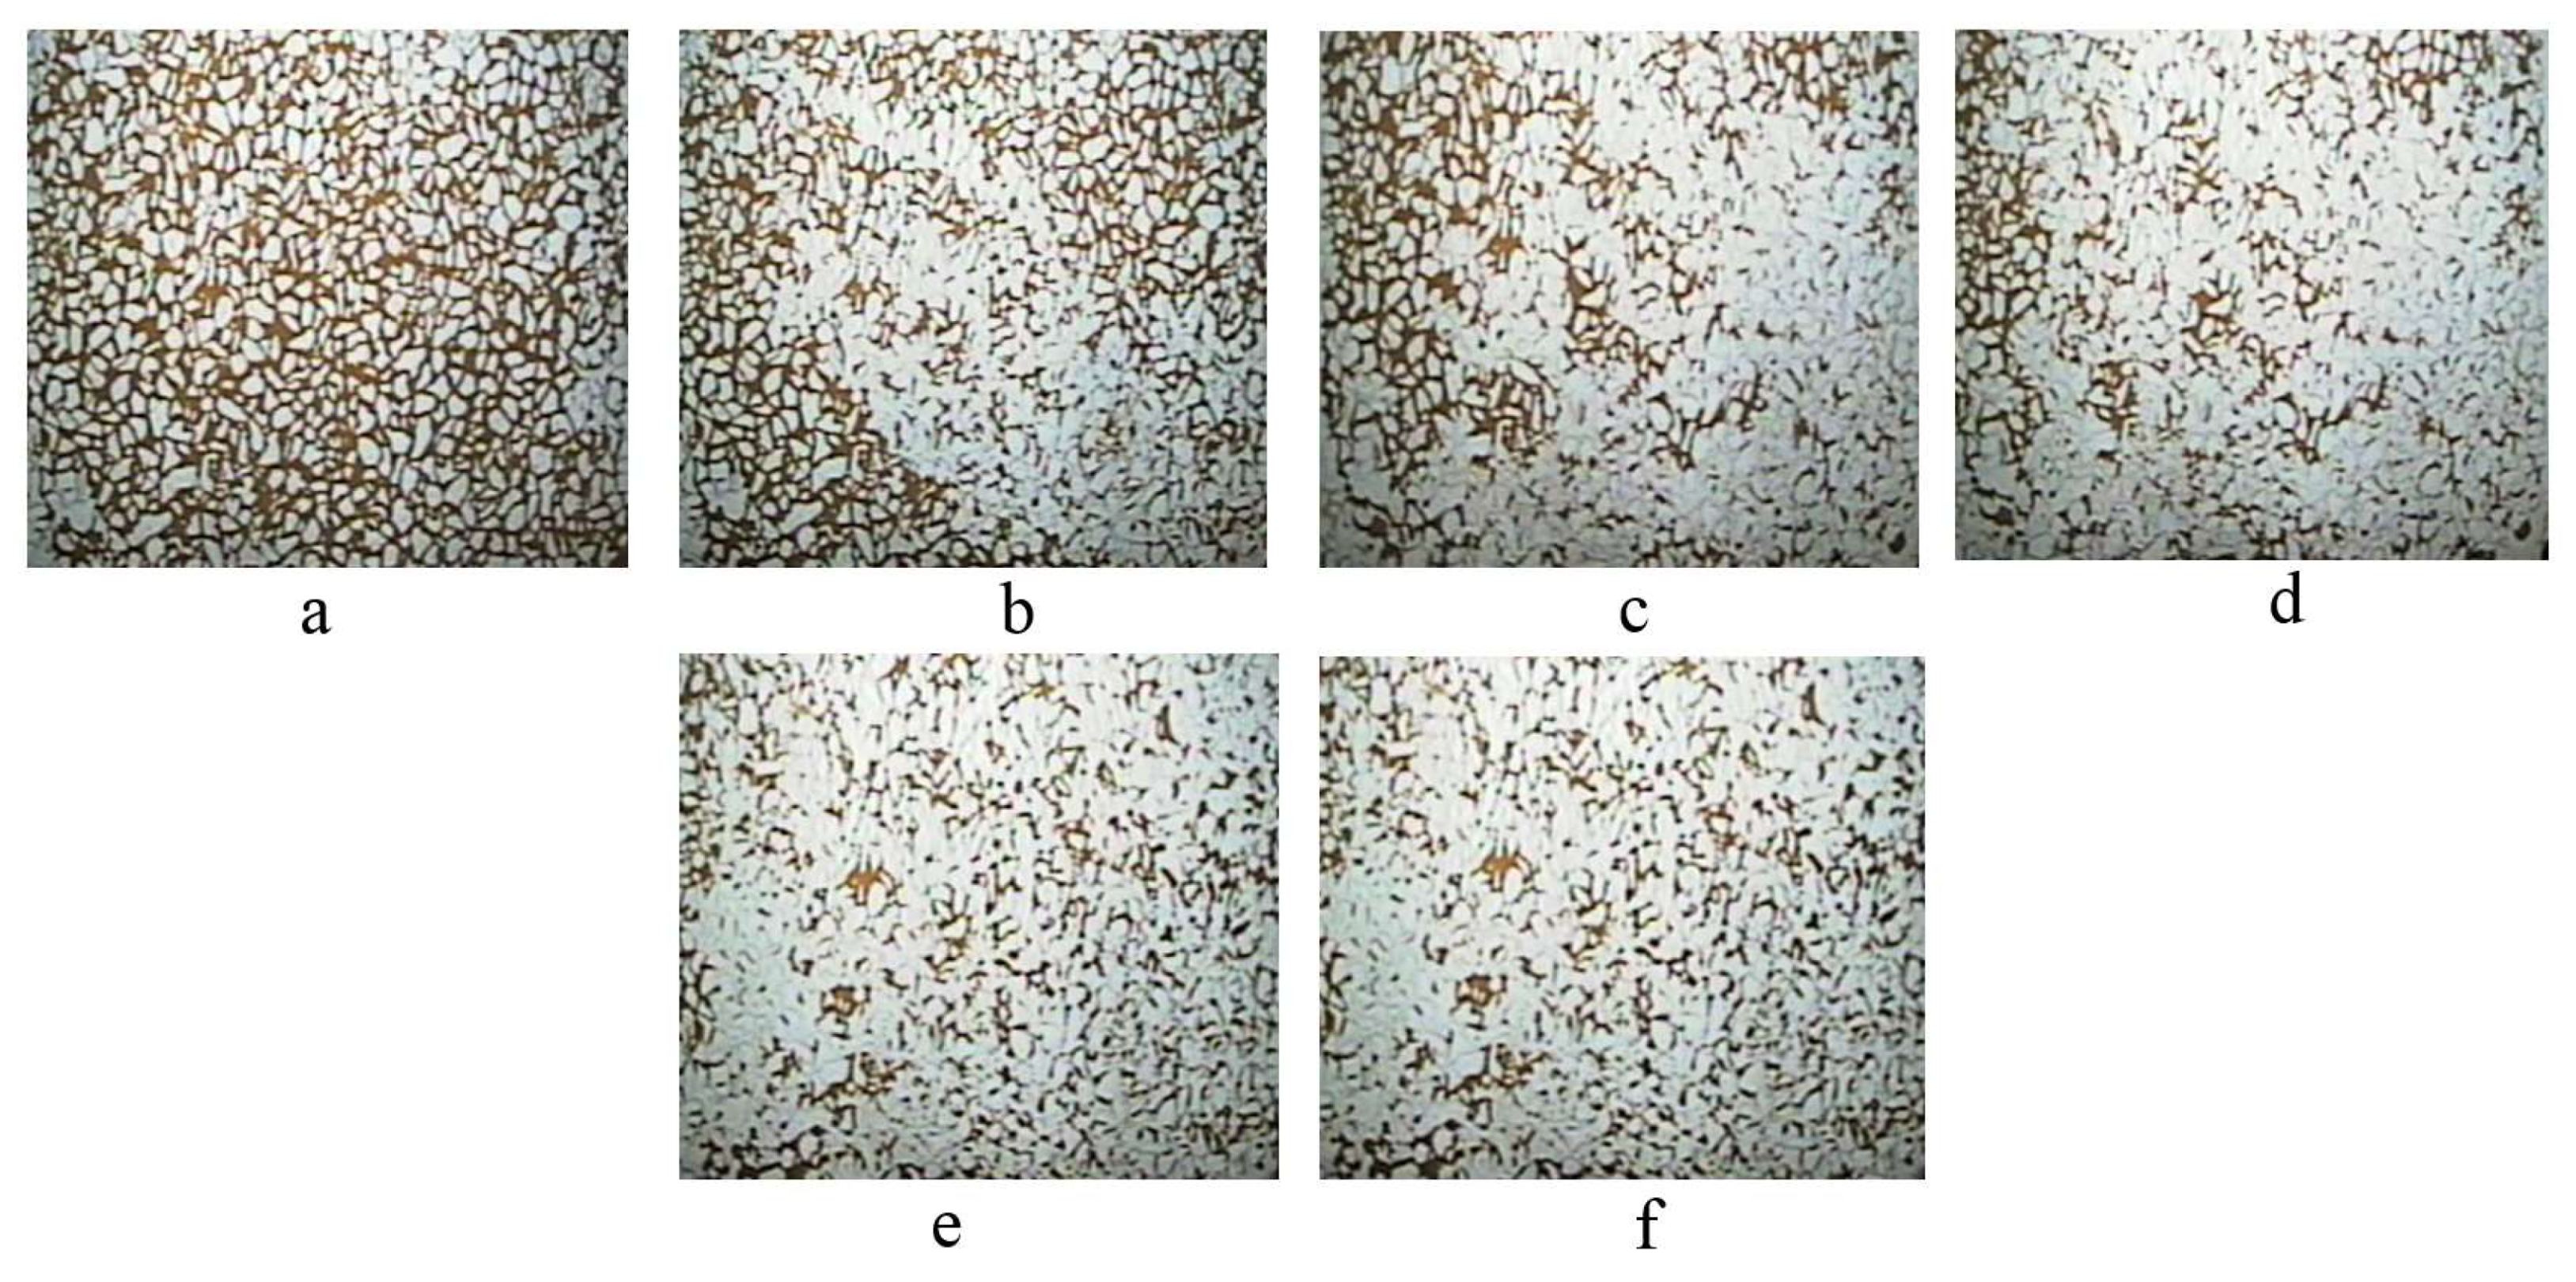
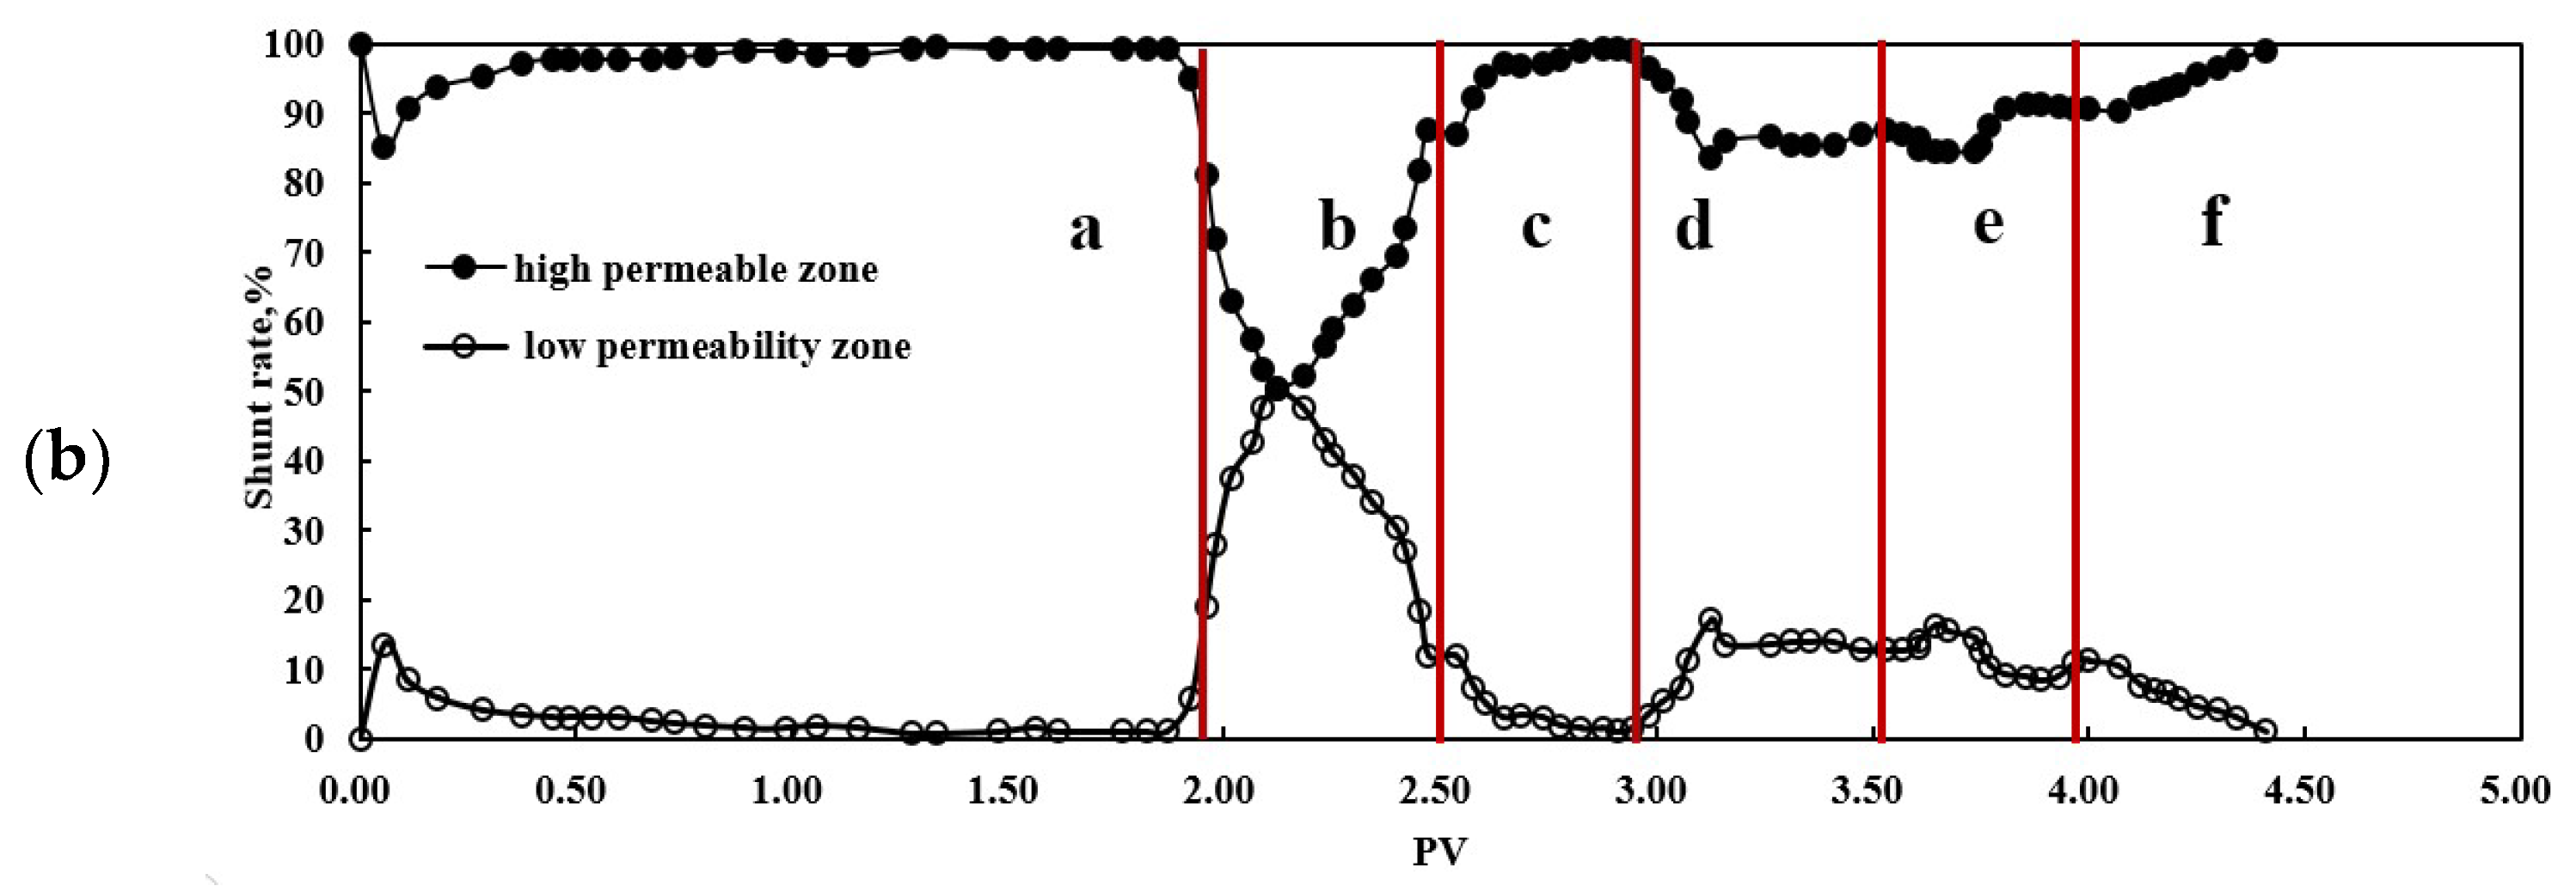
3.3.2. Flow Behavior of DP in Non-Homogeneous Porous Media

(1) Pull and Drag
At the beginning, the DP was adsorbed on the pore wall according to the creeping principle, the flow resistance of oil was reduced, the flow speed was accelerated, and they passed through the macropores and small pores smoothly. Concurrently, the DP carried residual oil through the throat as shown in Figure 7a-(i), then the residual oil was stretched and deformed which was similar to the amoeba effect in the small pore [49]. However, the deformation was not confined to small pores. Under the action of shear force, the band-shaped oil was extended, and transformed into slender oil filaments with large ends and slim middle shown in Figure 7a-(ii),a-(iii). Finally, the front of the filament was cut off into oil droplets. Those above illustrated that the mode was mainly based on shear stress, the remaining oil in the channel was elongated-sheared into small droplets by ‘pull and drag’.
(2) Entrainment
Figure 7b-(i),b-(ii) exhibited that with the injection of DP, the oil film adhered to the pore wall was kicked-off and entrained by the DP solution to form small oil droplets, which was mainly depended on the emulsification. From Figure 6 we can see that the distribution of remaining oil after polymer flooding was more scattered. When the residual oil encountered the DP, the oil-in-water emulsion was formed. With the range of emulsification became larger, the flow resistance of emulsified small oil droplets was much smaller. Consequently, the original non-flowing residual oil was transformed from the bulk volume into small volume after emulsification, and then flowed again. This process was called emulsification start-up. At the intersection of channels, those small emulsified and dispersed oil droplets were entrained and accumulated into large oil droplets as shown in Figure 7b-(iii), this course was denoted as the emulsification entrainment.
(3) Bridging
Figure 7c represented the bridging mode in non-homogeneous porous media. The oil film might be absorbed on the pore wall when the rock surface was oil-wet. As shown in Figure 7c-(i), the Pore 1 and Pore 2 was enclosed by oil film, and Pore 1 was in the upstream direction of Pore 2. With the continuous injection of DP, the oil film around Pore 1 moved downstream along the pore wall as depicted in Figure 7c-(ii). Immediately, the extruded oil contacted the oil film around downstream Pore 2, this process was named bridging, after that the oil films was connected, the remaining oil in the upstream was transported downstream by the action of bridging as shown in Figure 7c-(iii). Then the oil film was stretched and deformed by shear stress as it passed through the throat. Meanwhile, the oil droplets formed by emulsification and deformation cutting were aggregated further. Consequently, the flow channel expanded, and the remaining oil flowed to the outlet end gradually.

3.4. Comparing Efficiency of Oil Displacement and Concentration Reduction Multi-Slug Injection of DP

The displacement experimental results were presented in Table 4, the variation rate of recovery increment under different concentrations were described in Figure 8. Curves and statistical analysis showed that with the increased of the concentration, the ultimate oil recovery increased. When the concentration of DP was lower than 800 mg/L, the displacement effect was not as good as polymer flooding, and the variation rate of recovery increment was below 20%. However, when the concentration was more than 800 mg/L, the recovery increment was over 11%. The ultimate oil recovery reached 63.7% at 1000mg/L, and the recovery improvement achieved 16.2%, the variation rate of recovery increment was as high as 37.87%. It proved that DP was a promising agent, which can contribute to the enhanced oil recovery further compared to polymer.
Figure 9a,b showed the experimental result of concentration reduction multi-slug injection of DP. The curves can be divided into six parts, a represented the water flooding stage, b referred to polymer flooding, c stood for succeeding water flooding, d was DP flooding (1500 mg/L), e represented DP flooding (1000 mg/L), and f was subsequent water injection. It implied that with the increase of PV injected, the recovery percent showed an increasing trend, especially after polymer flooding, the recovery was improved by approximately 11% at part b. From the part d, there was a rising stage in the curve of injection pressure, which was the injection of DP (1500 mg/L), then the injected pressure was immediately declined and became nearly flat after 3.5 PV, which was the injection of DP (1000 mg/L). A reasonable explanation was that the high-permeability tube might be plugged by the chemical agent with 1500 mg/L. Afterward, the mobility was changed with the injection of a slightly low concentration DP, meanwhile, the chemical agent with 1000 mg/L entered into the low-permeability tube so that the injection pressure declined. Concurrently, the curve of water content has two descending stages, one was the injection of DP (1500 mg/L), the other was the injection of DP (1000 mg/L). This meant that the two kinds of concentrations of DP had the effect of increasing oil production and decreasing water-cut. As shown in Figure 9b, the shunt rate of high permeability layer decreased while that of the low permeability layer increased at the two injection stages of DP. Those above illustrated that the DP achieved a better effect of profile control. It should be mentioned that the recovery efficiency can be improved better by concentration reduction multi-slug injection, especially for low permeability zones. Further research concerned the optimization of slug number, slug size, injection rate under different concentrations, and the mechanism of profile control should be taken into account.

4. Conclusions

(1)
The DP simultaneously possessed characteristics of polymer and surfactant, exhibiting good salt tolerance, viscosification, viscosity stability, lower interfacial tension, and emulsification properties.
(2)
The experiment conducted in an etching glass model indicated that the displacement mechanism of DP included viscoelasticity, viscosification, lower interfacial tension, and emulsification. The flow behaviors were concluded to be ‘pull and drag’, ‘entrainment’, and ‘bridging’.
(3)
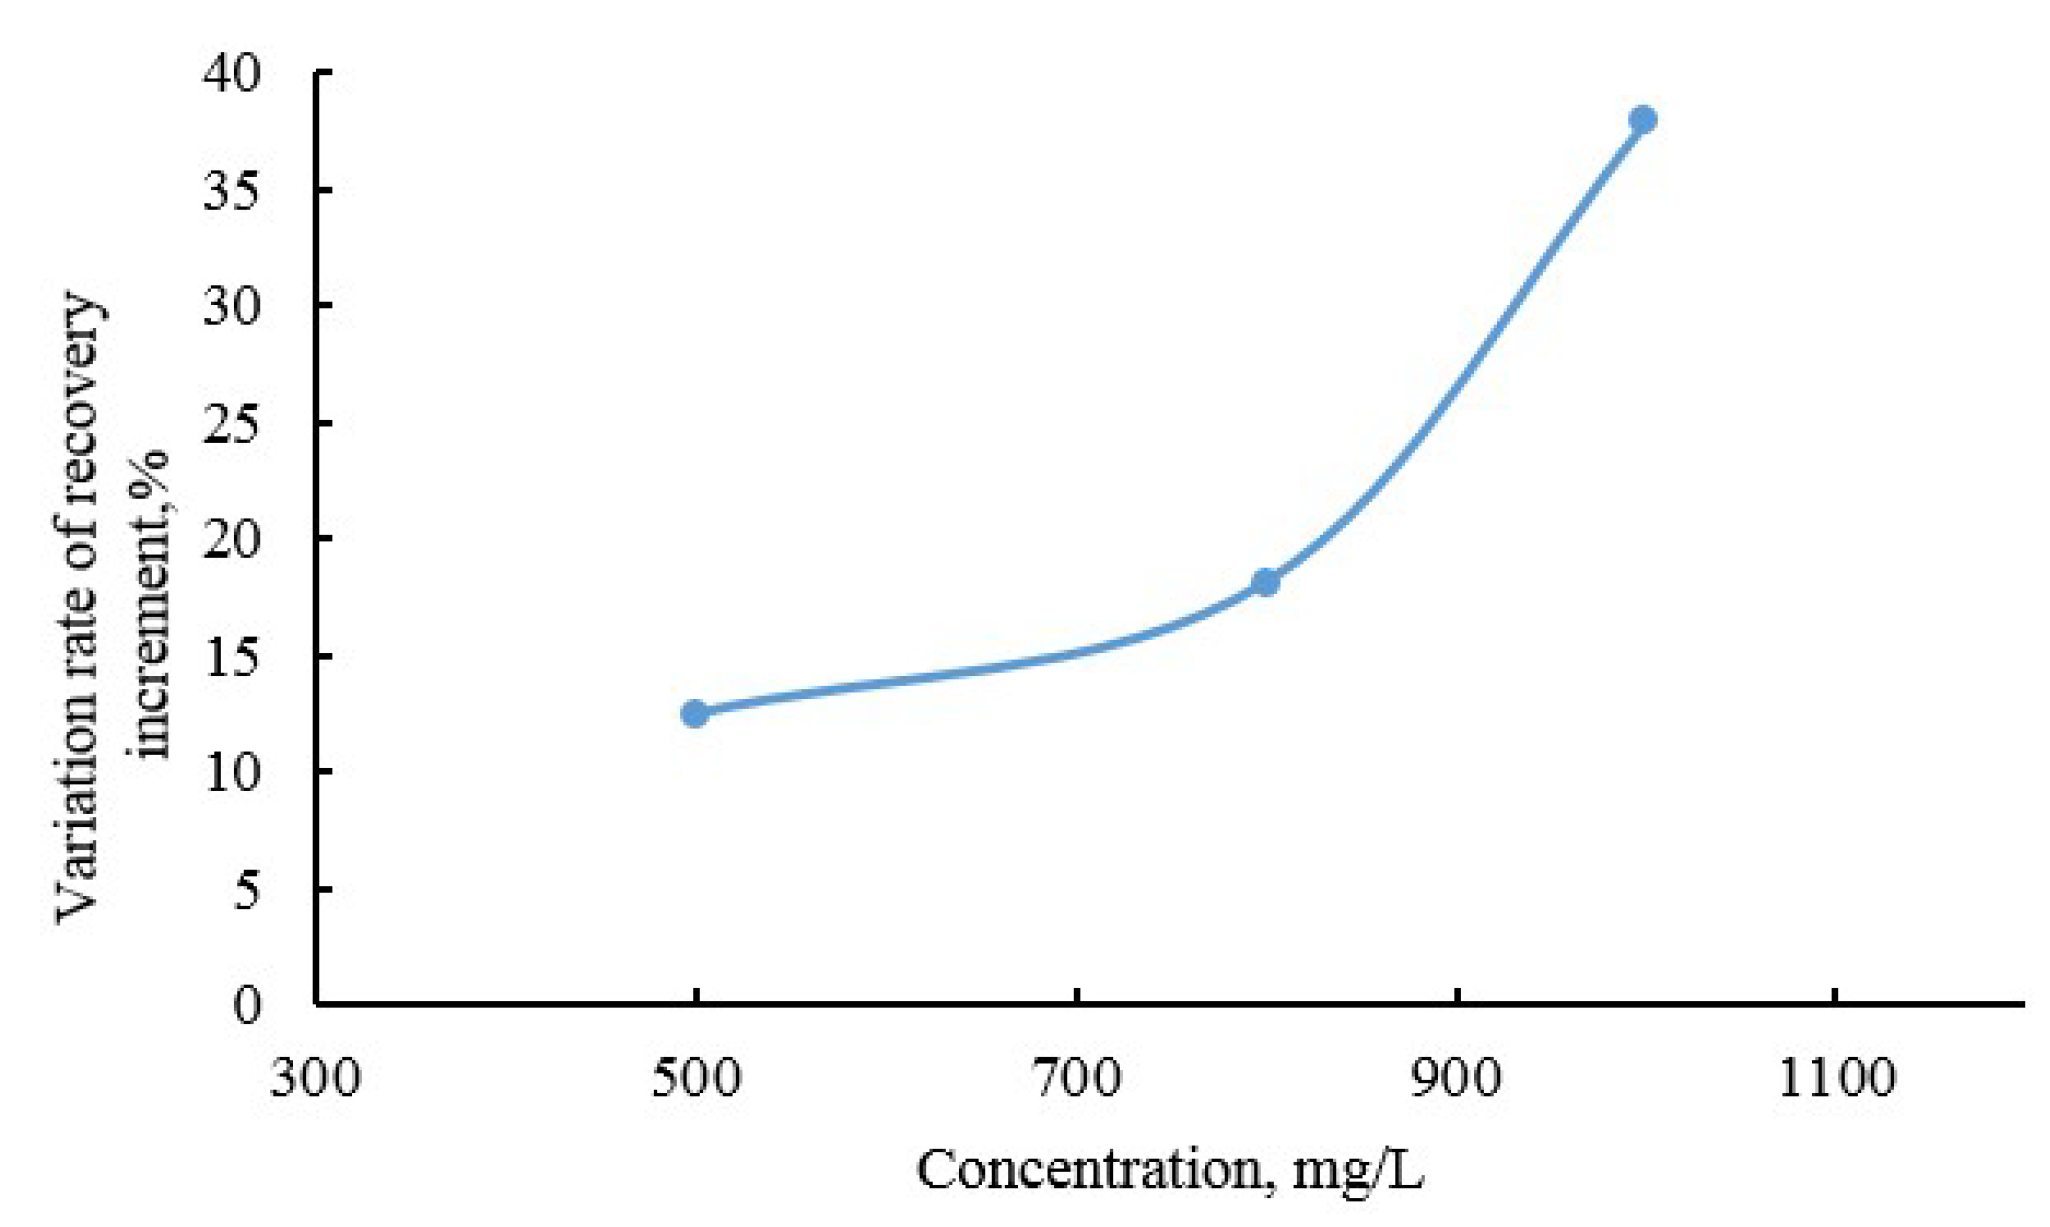
Oil displacement experimental results clearly illustrated that the recovery increment of DP was about 11–16% higher than that of polymer flooding when the concentration was more than 800 mg/L. Additionally, the mode of concentration reduction multi-slug injection was favorable to enhance recovery by means of profile control, especially for a low permeability layer.

Author Contributions

Conceptualization, H.Y.; Methodology, Q.Y.; Validation, A.S.; Investigation, Y.L.; Resources, S.H. and S.L.; Data curation, S.L. and Q.Y.; Writing—original draft preparation, S.L. and Y.L.; Writing—review and editing, S.L. and M.B.; Supervision, Y.L.

Funding

This paper was funded by the National Natural Science Foundation of China, grant number 51804078 and the University Nursing Program for Young Scholars with Creative Talents in Heilongjiang Province, grant number UNPYSCT-2017031.

Conflicts of Interest

The authors declare no conflict of interest.

References

  1. Pye, D.J. Improved secondary recovery by control of water mobility. SPE J. 1964, 16, 911–916. [Google Scholar] [CrossRef]
  2. Sandiford, B.B. Laboratory and field studies of water floods using polymer solutions to increase oil recoveries. SPE J. 1964, 16, 917–922. [Google Scholar] [CrossRef]
  3. Riahinezhad, M.; Romero-Zerón, L.; McManus, N.; Penlidis, A. Evaluating the performance of tailor-made water-soluble copolymers for enhanced oil recovery polymer flooding applications. Fuel 2017, 203, 269–278. [Google Scholar] [CrossRef]
  4. Shi, L.T.; Chen, L.; Ye, Z.B.; Zhou, W.; Zhang, J.; Yang, J.; Jin, J.B. Effect of polymer solution structure on displacement efficiency. Pet. Sci. 2012, 9, 230–235. [Google Scholar] [CrossRef]
  5. Salmo, I.C.; Pettersen, Ø.; Skauge, A. Polymer flooding at an adverse mobility ratio: Acceleration of oil production by crossflow into water channels. Energy Fuels 2017, 31, 5948–5958. [Google Scholar] [CrossRef]
  6. Li, M.; Romero-Zerón, L.; Marica, F.; Balcom, B.J. Polymer flooding enhanced oil recovery evaluated with magnetic resonance imaging and relaxation time measurements. Energy Fuels 2017, 31, 4904–4914. [Google Scholar] [CrossRef]
  7. Meybodi, H.E.; Kharrat, R.; Wang, X. Study of microscopic and macroscopic displacement behaviors of polymer solution in water-wet and oil-wet media. Transp. Porous Media 2011, 89, 97–120. [Google Scholar] [CrossRef]
  8. De Oliveira, L.F.L.; Schiozer, D.J.; Delshad, M. Impacts of polymer properties on field indicators of reservoir development projects. J. Pet. Sci. Eng. 2016, 147, 346–355. [Google Scholar] [CrossRef]
  9. Janiga, D.; Czarnota, R.; Stopa, J.; Wojnarowski, P.; Kosowski, P. Performance of nature inspired optimization algorithms for polymer enhanced oil recovery process. J. Pet. Sci. Eng. 2017, 154, 354–366. [Google Scholar] [CrossRef]
  10. Zhang, Z.; Li, J.C.; Zhou, J.F. Microscopic roles of “viscoelasticity” in hpma polymer flooding for eor. Transp. Porous Media 2011, 86, 199–214. [Google Scholar] [CrossRef]
  11. Wang, D.M.; Cheng, J.C.; Yang, Q.Y. Viscous-elastic polymer can increase micro-scale displacement efficiency in cores. In Proceedings of the SPE Annual Technical Conference and Exhibition, Dallas, TX, USA, 1–4 October 2000. [Google Scholar]
  12. Xia, H.F.; Wang, D.M.; Liu, Z.C. Study on the mechanism of polymer solution with visco-elastic behavior increasing microscopic displacement efficiency. Acta Petrolei Sin. 2001, 22, 60–65. [Google Scholar]
  13. Wang, D.M.; Cheng, J.C.; Xia, H.F. Improvement of displacement efficiency of cores by driving forces parallel to the oil–water interface of viscous-elastic fluids. Acta Petrolei Sin. 2002, 23, 47–52. [Google Scholar]
  14. Zhong, H.Y.; Zhang, W.D.; Yin, H.J.; Liu, H.Y. Study on mechanism of viscoelastic polymer transient flow in porous media. Geofluids 2017, 2017. [Google Scholar] [CrossRef]
  15. Sharafi, M.S.; Jamialahmadi, M.; Hoseinpour, S.A. Modeling of viscoelastic polymer flooding in core-scale for prediction of oil recovery using numerical approach. J. Mol. Liq. 2018, 250, 295–306. [Google Scholar] [CrossRef]
  16. Maghzi, A.; Kharrat, R.; Mohebbi, A.; Ghazanfari, M.H. The impact of silica nanoparticles on the performance of polymer solution in presence of salts in polymer flooding for heavy oil recovery. Fuel 2014, 123, 123–132. [Google Scholar] [CrossRef]
  17. Silva, I.P.G.; Aguiar, A.A.; Rezende, V.P.; Monsores, A.L.M.; Lucas, E.F. A polymer flooding mechanism for mature oil fields: Laboratory measurements and field results interpretation. J. Pet. Sci. Eng. 2018, 161, 468–475. [Google Scholar] [CrossRef]
  18. Wang, Q.M.; Liao, G.Z.; Niu, J.G. Practice and Understanding of Polymer Flooding Technology. Pet. Geol. Oilfield Dev. Daqing 1999, 18, 3–7. [Google Scholar]
  19. Manrique, E.J.; Thomas, C.P.; Ravikiran, R. EOR: Current Status and Opportunities. In Proceedings of the SPE Improved Oil Recovery Symposium, Tulsa, Oklahoma, 24–28 April 2010. [Google Scholar]
  20. Howe, A.M.; Clarke, A.; Giernalczyk, D. Flow of concentrated viscoelastic polymer solutions in porous media: Effect of mw and concentration on elastic turbulence onset in various geometries. Soft Matter 2015, 11, 6419–6431. [Google Scholar] [CrossRef] [PubMed]
  21. Feng, Q.H.; Qi, J.L.; Yin, X.M.; Yang, Y.; Bing, S.X.; Zhang, B.H. Simulation of fluid-solid coupling during formation and evolution of high-permeability channels. Pet. Explor. Dev. 2009, 36, 498–502. [Google Scholar]
  22. Cui, C.Z.; Li, K.K.; Yang, Y.; Huang, Y.S.; Cao, Q. Identification and quantitative description of large pore path in unconsolidated sandstone reservoir during the ultra-high water-cut stage. J. Pet. Sci. Eng. 2014, 122, 10–17. [Google Scholar]
  23. Zhang, P.; Huang, W.Z.; Jia, Z.F.; Zhou, C.Y.; Guo, M.L.; Wang, Y.F. Conformation and adsorption behavior of associative polymer for enhanced oil recovery using single molecule force spectroscopy. J. Polym. Res. 2014, 21, 523. [Google Scholar] [CrossRef]
  24. Lai, N.J.; Li, S.T.; Liu, L.; Li, Y.X.; Li, J.; Zhao, M.Y. Synthesis and rheological property of various modified nano-sio2/am/aa hyperbranched polymers for oil displacement. Russ. J. Appl. Chem. 2017, 90, 480–491. [Google Scholar] [CrossRef]
  25. Li, F.; Luo, Y.; Hu, P.; Yan, X.M. Intrinsic viscosity, rheological property, and oil displacement of hydrophobically associating fluorinated polyacrylamide. J. Appl. Polym. Sci. 2016, 134, 44672. [Google Scholar] [CrossRef]
  26. You, Q.; Wang, K.; Tang, Y.C.; Zhao, G.; Liu, Y.F.; Zhao, M.W.; Li, Y.Y.; Dai, C.L. Study of a novel self-thickening polymer for improved oil recovery. Ind. Eng. Chem. Res. 2015, 54, 9667–9674. [Google Scholar] [CrossRef]
  27. Cheraghian, G. Effect of nano titanium dioxide on heavy oil recovery during polymer flooding. Pet. Sci. Technol. 2016, 7, 633–641. [Google Scholar] [CrossRef]
  28. Cheraghian, G. Thermal resistance and application of nanoclay on polymer flooding in heavy oil recovery. Pet. Sci. Technol. 2015, 17–18, 1580–1586. [Google Scholar] [CrossRef]
  29. Cheraghian, G. Effects of titanium dioxide nanoparticles on the efficiency of surfactant flooding of heavy oil in a glass micromodel. Pet. Sci. Technol. 2016, 3, 260–267. [Google Scholar] [CrossRef]
  30. Cheraghian, G. Improved Heavy Oil Recovery by Nanofluid Surfactant Flooding-An Experimental Study. In Proceedings of the 78th EAGE Conference and Exhibition, Vienna, Austria, 30 May–2 June 2016. [Google Scholar]
  31. Cheraghian, G. Evaluation of clay and fumed silica nanoparticles on adsorption of surfactant polymer during enhanced oil recovery. J. Jpn. Pet. Inst. 2017, 2, 85–94. [Google Scholar] [CrossRef]
  32. Cheraghian, G. Synthesis and properties of polyacrylamide by nanoparticles, effect nanoclay on stability polyacrylamide solution. Micro Nano Lett. 2017, 1, 40–44. [Google Scholar] [CrossRef]
  33. Kang, W.L.; Jiang, J.T.; Lu, Y.; Xu, D.R.; Wu, H.R.; Yang, M.; Zhou, Q.; Tang, X.C. The optimum synergistic effect of amphiphilic polymers and the stabilization mechanism of a crude oil emulsion. Pet. Sci. Technol. 2017, 35, 1180–1187. [Google Scholar] [CrossRef]
  34. Shu, Q.L.; Yu, T.T.; Gu, L.; Fan, Y.L.; Geng, J.; Fan, H.M. Viscosifying ability and oil displacement efficiency of new biopolymer in high salinity reservoir. J. China Univ. Pet. (Ed. Nat. Sci.) 2018, 42, 171–178. [Google Scholar]
  35. Yadali Jamaloei, B.; Kharrat, R.; Torabi, F. Analysis and correlations of viscous fingering in low-tension polymer flooding in heavy oil reservoirs. Energy Fuels 2010, 24, 6384–6392. [Google Scholar] [CrossRef]
  36. Zhao, G.; Dai, C.L.; You, Q. Characteristics and displacement mechanisms of the dispersed particle gel soft heterogeneous compound flooding system. Pet. Explor. Dev. 2018, 45, 481–490. [Google Scholar] [CrossRef]
  37. Wei, P.; Pu, W.F.; Sun, L.; Pu, Y.; Wang, S.; Fang, Z.K. Oil recovery enhancement in low permeable and severe heterogeneous oil reservoirs via gas and foam flooding. J. Pet. Sci. Eng. 2018, 163, 340–348. [Google Scholar] [CrossRef]
  38. Liu, S.H.; Zhang, D.H.; Yan, W.; Puerto, M.; Hirasaki, G.J.; Miller, C.A. Favorable attributes of alkaline-surfactant-polymer flooding. SPE J. 2008, 13, 5–16. [Google Scholar] [CrossRef]
  39. Lai, N.J.; Zhang, Y.; Wu, T.; Zhou, N.; Liu, Y.Q.; Ye, Z.B. Effect of sodium dodecyl benzene sulfonate to the displacement performance of hyperbranched polymer. Russ. J. Appl. Chem. 2016, 89, 70–79. [Google Scholar] [CrossRef]
  40. Han, P.H.; Su, W.M.; Lin, H.C.; Gao, S.L.; Cao, R.B.; Li, Y.Q. Evaluation and comparison of different EOR techniques after polymer flooding. J. Xi’an Shiyou Univ. (Nat. Sci. Ed.) 2011, 26, 44–48. [Google Scholar]
  41. Li, K.X.; Jing, X.Q.; He, S.; Ren, H.; Wei, B. Laboratory study displacement efficiency of viscoelastic surfactant solution in eor. Energy Fuels 2016, 30, 4467–4474. [Google Scholar] [CrossRef]
  42. Zhu, Y.; Gao, W.B.; Li, R.S.; Li, Y.Q.; Yuan, J.S.; Kong, D.B.; Liu, J.Y.; Yue, Z.C. Action laws and application effect of enhanced oil recovery by adjustable-mobility polymer flooding. Acta Petrolei Sin. 2018, 2, 189–200. [Google Scholar]
  43. Cao, R.B.; Han, P.H.; Sun, G. Oil displacement efficiency evaluation of variable viscosity polymer slug alternative injection. Oil Drill. Prod. Technol. 2011, 6, 88–91. [Google Scholar]
  44. Li, Y.Q.; Liang, S.Q.; Lin, L.H. Comparison and evaluation on injection patterns of polymer driving. Pet. Geol. Recov. Effic. 2010, 6, 58–60. [Google Scholar]
  45. Fu, M.L.; Zhou, K.H.; Zhao, L.; Zhang, D.H. Research on viscosity stability of polymer solution made up by sewage. OGRT 2000, 7, 6–8. [Google Scholar]
  46. Czarnota, R.; Janiga, D.; Stopa, J.; Wojnarowski, P. Wettability Investigation as a Prerequisite During Selecting Enhanced Oil Recovery Methods For Sandstone and Dolomite Formations. In Proceedings of the 17th International Multidisciplinary Scientific Geo Conference, Albena, Bulgaria, 29 June–5 July 2017; Volume 14, pp. 1013–1020. [Google Scholar]
  47. Kutter, B.L. Effects of capillary number, bond number, and gas solubility on water saturation of sand specimens. Can. Geotech. J. 2013, 50, 133–144. [Google Scholar] [CrossRef]
  48. Zhou, Y.Z.; Yin, D.Y.; Cao, R.; Zhang, C.L. The mechanism for pore-throat scale emulsion displacing residual oil after water flooding. J. Pet. Sci. Eng. 2018, 163, 519–525. [Google Scholar] [CrossRef]
  49. Wang, Y.L.; Jin, J.F.; Bai, B.J.; Wei, M.Z. Study of displacement efficiency and flow behavior of foamed gel in non-homogeneous porous media. PLoS ONE 2015, 10, e0128414. [Google Scholar] [CrossRef] [PubMed]
Figure 1. (a) Coreflooding experimental setup; (b) oil displacement mechanism experiment device.
Energies 12 00562 g001
Figure 2. (a) Chemical structure of the DP; (b) Microstructure of polymer (1.5 × 10⁷); (c) Microstructure of DP.
Energies 12 00562 g002
Figure 3. (a) Apparent viscosity curves of different chemical agents; (b) correlation between viscosity and days at different concentrations.
Energies 12 00562 g003
Figure 4. (a) Emulsification results of DP with different concentrations (200, 300, 500, 800, and 1000 mg/L); (b) arrangement of DP at oil–water interface.
Energies 12 00562 g004
Figure 5. Correlation between interfacial tension and concentration.
Energies 12 00562 g005
Figure 6. Visual evaluation of oil displacement for DP: (a) saturated by crude oil; (b) after water flooding; (c) polymer treatment; (d) after polymer treatment (water flooding); (e) DP(1000 mg/L) treatment; (f) water flooding again.
Energies 12 00562 g006
Figure 7. (a) A schematic of pull and drag mode: (i) Residual oil in the throat; (ii) Residual oil was stretched and deformed; (iii) Residual oil was drawn into filaments; (iv) Oil filaments broken into droplets. (b) A schematic of entrainment mode: (i) Oil film on pore wall; (ii) Oil film was entrained to form oil droplets; (iii) oil droplets aggregation. (c) A schematic of bridging mode: (i) Oil film enclosed pore wall; (ii) Oil film flowed along pore wall; (iii) Oil film bridging; (iv) Oil film merging together.
Energies 12 00562 g007
Figure 8. Relationship between variation rate of recovery increment and concentration.
Energies 12 00562 g008
Figure 9. (a) Curves of oil recovery, water cut, and injection pressure versus PV injected. (b) Curves of shunt rate versus PV injected.
Energies 12 00562 g009aEnergies 12 00562 g009b
Table 1. Composition of water from First Oil Production Plant of Daqing Oilfield.
Water TypeContent (mg/L)
Na+ + K+Ca2+Mg2+HCO3ClSO42−Total Salinity
Formation water 2186.314.952.42054.42267.754.16778
Injection water 231.234.124.3225.188.736729
Injection
wastewater
126532.17.31708.56780.129.614013
Table 2. Key parameters of cores.
Core NumberPermeability (μm2)Porosity (%)Initial Oil Saturation (%)Injection Chemicals and Concentrations (mg/L)
11.12623.872.3P(1000)
21.07822.872.5DP(300)
31.08223.273.6DP(300)
41.1224.674.2DP(500)
51.11424.473.9DP(500)
61.10521.872.9DP(800)
71.12720.974.2DP(800)
81.09421.771.5DP(1000)
91.10223.472.8DP(1000)
101.1522.471.6P(1000) + DP(1500) + DP(1000)
0.15320.152.9
Note: P refers to polymer, DP refers to decorated polyacrylamide, and the concentrations were in the brackets.
Table 3. Viscosities under different salinities of chemical agents.
Concentration of NaCl
(mg/L)
Polymer Viscosity
(mPa·s)
DP Viscosity (mPa·s)
100090.7540.60
300052.5480.00
500037.01329.55
600032.24349.85
700029.85322.39
900022.69220.90
Table 4. Displacement efficiency of different cores.
Core NumberWater Flooding Oil Recovery (%)Recovery Increment (%)Ultimate Oil Recovery (%)
147.511.258.7
247.38.655.9
347.69.156.7
447.510.257.7
547.29.756.9
647.411.458.8
747.712.159.8
847.815.863.6
947.216.663.8

