A Lifecycle Analysis of the Corporate Average Fuel Economy Standards in Japan

Graduate School of Economics, Kyushu University, 744 Motooka, Nishi-ku, Fukuoka 819-0395, Japan
Energies 2019, 12(4), 677; https://doi.org/10.3390/en12040677
Submission received: 9 January 2019
/
Revised: 6 February 2019
/
Accepted: 10 February 2019
/
Published: 20 February 2019
(This article belongs to the Special Issue Advances in Low Carbon Technologies and Transition)
Abstract
:This study estimated the corporate average fuel economy (CAFE) and CAFE targets of Japan’s domestic automobile manufacturers and evaluated whether manufactures have achieved these estimated CAFE targets. Furthermore, an analysis framework was proposed for estimating what impact the introduction of the CAFE standards in Japan will have on motor vehicle-derived lifecycle CO2 emissions. As a result, the following was found: (1) Automobile manufacturers can maximize their sales under the constraints of the CAFE standards, but vehicle sales plans based on sales maximization will lower their CAFE standard scores. (2) Economically optimal automobile manufacturer behavior—striving to achieve CAFE standards while maximizing sales—will increase the manufacturers’ overall carbon footprint and actually worsen the environment.
1. Introduction
The Paris Agreement, adopted in December 2015, attempts to tackle the growing problem of global warming by setting carbon dioxide (CO2) emission reduction targets for each country in order to meet the goal of limiting the rise in the average global temperature to below 2 °C relative to the pre-industrial revolution level [1]. To achieve this goal, limiting emissions from the transportation sector, which accounts for 29% of the CO2 emissions of Organization for Economic Co-operation and Development (OECD) countries, is of paramount importance [2]. In Japan, the transportation sector accounts for 20% of total CO2 emissions, and 90% of these emissions are generated by the motor vehicle sector [3]. Accordingly, reducing tailpipe CO2 emissions derived from motor vehicles is essential, especially by means of improving motor vehicle fuel economy.
In the United States, the Corporate Average Fuel Economy (CAFE) standard has been in effect since 1975 [4]. This standard aims at improving the fuel economy of motor vehicles to ensure that the fuel economy of a relevant company does not drop below a fuel economy standard value (CAFE standard), a target which is a motor vehicle sales weighted average [4]. In Japan, on the other hand, the fuel economy values of the most efficient vehicle models in specific vehicle weight categories (i.e., the best performing vehicles) are adopted as targets to drive improvements in the fuel economy of each vehicle model [5]. This could be called the ‘Top Runner Approach’. Japan plans to adopt CAFE standards in 2020, to use in addition to its current ‘Top Runner Approach’, with the dual objectives of reducing transportation sector CO2 emissions and promoting more flexible motor vehicle sales by companies [5].
There are several problems with CAFE standards, however. The first is that even if the aggregated CAFE of a relevant company exceeds the CAFE target, the fuel economy of some of the company’s vehicle models may still fall below the fuel economy standard value by vehicle weight category, and vehicle models with poor fuel economy will likely end up on the motor vehicle market. Increasing sales of hybrid vehicles is likely another factor that may drive up the CAFEs of companies. There is also a problem that hybrid vehicles (i.e., electric-petroleum hybrids) impose a heavier environmental burden in manufacturing than conventional gasoline vehicles because they require additional parts and materials (e.g., [6]).
Thus, CAFE standards may not well work toward reducing gasoline consumption and environmental burden through the fuel economy improvements over all the vehicle weight categories and vehicle types. Regarding this problem of CAFE standards, previous studies studied the optimal design of the CAFE standard [7,8,9,10,11,12] analyzed the welfare effects of tightening the CAFE standard in the U.S. [13,14,15,16] compared reductions in fuel consumptions through increasing gasoline taxes and tightening the CAFE standards.
It is important to note that since the demand-side energy policy of a higher gasoline tax has already been imposed in many countries, the supply-side energy policy of improving the CAFE is needed to reduce the environmental burdens associated with the automobile. Studies estimated direct CO2 emissions associated with fuel combustions of the transport sector, e.g., [17,18], whereas an importance of the life cycle analysis has been increased [19]. To the best of our knowledge, there are very few studies evaluating how companies meeting the CAFE standards affects lifecycle CO2 emissions through the automobile lifecycle.
It is essential to consider the lifecycle CO2 emissions of motor vehicles rather than just fuel economy. In this study, CAFEs and CAFE targets of Japan’s domestic automobile manufacturers were estimated and it was assessed how well the manufacturers met their targets. The impact that the introduction of the CAFE standards in Japan will have on motor vehicle-derived lifecycle CO2 emissions was also analyzed.
Specifically, the 2015 sales performance figures of seven of Japan’s automobile manufacturers (Toyota Motor Corporation, Nissan Motor Co., Ltd., Honda Motor Co., Ltd., Mitsubishi Motors Corporation, Mazda Motor Corporation, Suzuki Co., Ltd., and Subaru Co., Ltd.) and the published fuel economy values of the sold vehicle models were investigated, in order to estimate the CAFE of each company, as well as their CAFE target, and to assess how well the manufacturers met their targets in 2015.
The car sales of a specific company affect not only the CAFE based on the weighted-average fuel economies of the car sales but also the lifecycle CO2 of motor vehicles sold by the company. To estimate the lifecycle CO2 of motor vehicles, it is important to estimate the lifecycle CO2 emission intensity of a specific vehicle model sold by the company expressed in ton-CO2 per vehicle. This is because several studies treated a wide variety of vehicles as a specific homogeneous product and analyzed a life cycle assessment of the specific vehicle (e.g., aggregated conventional gasoline vehicle) with a comparison of the environmental burdens of conventional vehicles with vehicles equipping other engines, electric vehicles, hybrid vehicles, plug-in hybrid vehicles, and hydrogen fuel cell vehicles [20,21,22,23].
Using the pooled observations of cars sold by the above seven manufactures in 2015, a statistically specified relationship was created between car prices and car weights as a regression equation. When the car price of an ‘average vehicle’ described in the Japanese commodity-by-commodity input-output table (Ministry of Internal Affairs and Communications, Japan, 2010) was inserted into the specified relationship between car prices and car weights, a car weight of the average vehicle could be obtained. Using the ratio between the embodied CO2 emission intensity of the ‘average vehicle’ provided by the Embodied Energy and Emission Intensity Data for Japan using Input-Output Tables [24] and the car weight of the ‘average vehicle’ estimated in this study, the embodied CO2 emission intensity of the specific vehicle model of the company was proportional to the weight of the car. Using the proposed methodology, a new database of disaggregated lifecycle emissions of motor vehicles sold by the Japanese auto manufactures was compiled.
Estimating the disaggregated lifecycle inventory database of motor vehicles, the impact that the introduction of the CAFE standards in Japan is likely to have on motor vehicle-derived lifecycle CO2 emissions was evaluated, to assess the validity of the CAFE standards from an environmental perspective.
Companies would maximize profits from car sales under the CAFE standards. This study therefore formulated an optimization problem of maximizing profit, as the objective function, under constraints with respect to both car sales and the CAFE standards and examined how the optimized car sales of each company differed from the actual car sales and what effect achieving the CAFE standards would have toward reducing lifecycle CO2 emissions under the optimized car sales.
2. Methodology
2.1. CAFEs and CAFE Targets for Automobile Manufacturers
The CAFE of each automobile manufacturer, C (km/L), was estimated based on the number of new vehicle sales and the published fuel economy values using the following equation:
where X is the number of new vehicle sales of a particular automobile manufacturer j, zi (km/L) is the fuel economy value of vehicle model i of the automobile manufacturer, and xi is the number of vehicle model i that the automobile manufacturer sold for the year. Furthermore, N is the number of different vehicle models sold by the relevant automobile manufacturer. As the CAFE obtained from Equation (1) increases, the fuel economy of the ‘average vehicle’ sold by the relevant automobile manufacturer improves. The CAFE target, (km/L), is calculated as follows [4]:
where (km/L) is the target fuel economy value for a predefined passenger vehicle weight category k, xk is the total number of sales of vehicle models belonging to vehicle weight category k by a particular automobile manufacturer, and M is the number of vehicle weight categories.
2.2. Sales Maximization
In this section, the optimal number of unit sales for each vehicle model for automobile manufacturers to maximize sales while satisfying the CAFE standards given by Equation (2) is estimated. This is done so by solving the linear programming problem illustrated in Equations (3) through (6) below.
such that
where pi is the price for each vehicle model, xi* is the actual number of units sold, α is a parameter for determining the upper limit of vehicle models i, β is a parameter determining the upper limit of total units sold, and ε represents the rate of fuel economy improvement. Equation (4) is a constraint for the linear programming problems in which the relevant company must meet the CAFE standards. In this study, four scenarios are considered: Scenario I, fuel economy for the vehicle models is the baseline value (ε = 1.0); and Scenarios II, III, and IV, in which fuel economy for the vehicle models is uniformly improved from the baseline fuel economy by 10%, 15%, and 20%, respectively (ε = 1.1, ε = 1.15, and ε = 1.2). Next, Equation (5) is the constraint for sales patterns in which the relevant company’s current number of units sold for vehicle model i grows by a factor α, which is set as α = 2 for this study. Finally, Equation (6) is the constraint for the total number of units sold, which is set as β = 1 for this study. This study solves the sales maximization problem within the four fuel economy improvement scenarios given above (Scenarios I–IV) to estimate the optimal sales pattern for the vehicle models of the relevant automobile manufacturers.
2.3. Lifecycle CO2 Emissions of the Automobile Manufacturers
For gasoline-engine and hybrid vehicle models i, the average lifecycle emission intensity per vehicle is found as fm by taking the weighted average by number of units sold for the lifecycle emission intensity ( and ) derived from the manufacturing, transportation, and sales origin for a single vehicle. Here, one can estimate the lifecycle CO2 emissions (t-CO2) derived from the automobiles as sold by the relevant companies in Japan for 2015 as follows:
where Ng is the set of gasoline-engine vehicles models, Nh is the set of hybrid vehicle models, fg,i is the CO2 emission intensity during travel for vehicle model i and fh,i is the CO2 emission intensity during disposal of vehicle model i.
For a relevant automobile manufacturer, the weighted average fuel economy for a passenger vehicle i is defined as as ei (km/L) and the lifetime travel distance of passenger vehicles as d (km). Thus, gi (L), the lifetime gasoline consumption of a passenger vehicle i, is obtained as follows:
The CO2 emissions due to gasoline consumption during travel per vehicle can then be estimated by multiplying the CO2 emission intensity generated per liter of gasoline burned rg by the quantity of gasoline consumed gi from Equation (6):
In addition, the CO2 emissions associated with refining the gasoline necessary for travel per vehicle can be estimated by multiplying the CO2 emission intensity generated per liter of gasoline refined rc by the quantity of gasoline consumed gi from Equation (8):
Thus, the embodied CO2 emission intensity during travel per vehicle fg,i in Equation (7) is the sum of fg,idirect, the direct emissions generated by gasoline consumption during travel, and fg,iindirect, the indirect emissions generated in refining the gasoline:
3. Data
In this study, the vehicle models of each company sold in 2015 were as follows: Toyota, 42; Nissan, 21; Honda, 17; Mitsubishi, 10; Mazda, 9; Subaru, 9; and Suzuki, 8. The number of vehicles of each model sold by each company, which is necessary for calculating the CAFE and CAFE target, can be obtained from data on the number of vehicles sold by brand [25]. For the fuel economy of each vehicle model the fuel economy figures for each vehicle model in JC08 mode cycle was used, as published in the Automobile Fuel Economy List [26]. The vehicle weight categories for the CAFE standards due to be introduced in MY2020 are shown in Table A1.
The CO2 emission intensities per passenger vehicle in manufacturing, during travel, and in disposal were estimated using the Embodied Energy and Emission Intensity Data for Japan Using Input-Output Tables [24]. The passenger vehicle lifetime travel distance d was assumed to be 100,000 km and therefore estimated the emission intensity during travel rg to be 0.00231 t-CO2 and rc to be 0.00063 t-CO2. In addition, in accordance with a previous study [6], the emission intensity in disposal fh,i was set to be 0.0574 t-CO2.
In order to estimate the life cycle CO2 emission intensity of vehicles, the life cycle CO2 emission intensity derived from both manufacturing and driving must be estimated for each vehicle model. While by no means a simple task, in this study, the lifecycle CO2 emission intensity for each vehicle model was estimated by specifying a relationship for model sales prices and new vehicle weight. First, the sales price information was obtained for 82 gasoline-engine vehicle models sold by the automakers (Toyota, Nissan, Honda, Mitsubishi, Mazda, Subaru, and Suzuki) in 2015 from Autoc One [27], an informational site that releases comprehensive vehicle sales information. Vehicle weight information was also obtained for the same 82 models from the MLIT automotive information site [26]. From the sales price and vehicle weight data for the 82 models, a regression analysis was run and the following results were obtained.
where (kg) is the vehicle weight for vehicle model i and (10,000 s of Japanese yen) is the sales price for vehicle model i. The numbers in parentheses below the parameters are the t-values, and each of the estimated parameters is statistically significant at the 1% level in a two-sided test. The relationship given in Equation (12) shows us that an increase of 100 kg in vehicle weight corresponds to an increase of 350,000 yen in sales price.
From the 2005 Input-Output Tables, the average vehicle sales price in 2005 was 2.2 million yen. Given this, the relationship specified in Equation (12) can be used to estimate the average vehicle weight as kg. Meanwhile, from the Embodied Energy and Emission Intensity Databook (3EID) ([24]) as based on the 2005 Input-Output Table as released by the National Institute for Environmental Studies, the average lifecycle emission intensity for vehicle production is 1.93 t-CO2 per 1 million yen, and the lifecycle emission intensity for transportation and sales services incidental to sales price for one vehicle unit is 1.2 t-CO2 per 1 million yen. Accordingly, one can estimate a lifecycle CO2 emission intensity of t-CO2 as derived from manufacturing one average vehicle in 2005 with a sales price of 2.2 million yen and vehicle weight of 1264 kg. Next, the lifecycle CO2 emission intensity was estimated, as derived from manufacturing a relevant vehicle model by taking the ratio of the vehicle weight of that model to the average vehicle weight (1264 kg) and multiplying by the unit intensity derived from manufacturing. To estimate the lifecycle CO2 emission intensity incidental to transportation and sales services for one unit of a relevant vehicle model, the lifecycle emission intensity for transportation and sales services was taken as 1.2 t-CO2 per 1 million yen and multiplied this quantity by the sales price of the relevant vehicle model. The lifecycle CO2 emission intensity for a single gasoline vehicle model i was then solved for by adding up the lifecycle CO2 emission intensities derived from manufacturing and from transportation and sales for the relevant model. It is important to note that although we can estimate the lifecycle CO2 emissions by multiplying the average lifecycle emission intensity for vehicle production (1.93 t-CO2 per 1 million yen) by each vehicle price, and that the estimated emissions are not consistent with the vehicle weight important for the CAFEs.
Similarly, a separate regression analysis for 42 hybrid vehicle models was run and the following relationship for sales price and vehicle weight was obtained:
where (kg) is the vehicle weight for hybrid vehicle model i and (10,000s of yen) is the sales price for hybrid vehicle model i. Again, the numbers in parentheses below the parameters are the t-values, and each of the estimated parameters is statistically significant at the 1% level in a two-sided test. The relationship given in Equation (13) shows us that an increase of 100 kg in vehicle weight for hybrid vehicles corresponds to an increase of 410,000 yen in sales price. The lifecycle CO2 emission intensity derived from manufacturing and from transportation and sales for a single hybrid vehicle model i was solved for with the same methods described above for calculating unit intensity for a gasoline vehicle model. The detailed lifecycle CO2 emission intensity data by vehicle model as estimated in this study are described in Table S3 of the Supporting Information.
4. Results
4.1. Life-Cycle CO2 Emission Intensities of Vehicle Models
Table 1 shows the data showing mean, standard deviation, maximum value and minimum value of the life cycle CO2 emission intensities of vehicle models of seven automobile manufactures in Japan estimated by Equations (12) and (13). According to Table 1, the maximum value of the life cycle CO2 intensity in seven firms is 60.74 t-CO2/car Toyota CENTURY (gasoline vehicle) and the minimum value is 14.8 t-CO2/car Toyota AQUA (Hybrid vehicle). Thus, there is a large difference in life cycle CO2 intensities within a firm as well as between firms. The mean of the intensities of each firm is caused by the number attributes (e.g., body weight, fuel economy, etc.) of cars sold by the firm and it means that firms with a higher standard deviation of the intensities like Toyota have more varieties of cars.
The last column of Table 1 shows the life cycle CO2 emissions of each firm in 2015 that is the benchmark emissions in this analysis. Importantly, Toyota has the largest number of vehicle models sold (see first column of Table 1) and it has the largest life cycle CO2 emissions, amounting to 28.4 million t-CO2 in 2015. This is because the life cycle CO2 emissions depend on the number of sold cars as well as the number of sold vehicle models. The total of CO2 emissions of Japan in 2015 was 1325 million t-CO2 [28] and the sum of the life cycle CO2 emissions of seven automobile manufactures in 2015 was 54.2 million t-CO2 that accounts for 4% of the total CO2 emissions of Japan. Therefore, it is essential to management the life cycle CO2 emissions in automobile industry.
4.2. CAFEs and CAFE Targets of Seven Automobile Manufacturers in Japan
Table 2 shows the CAFEs and CAFE targets of Japan’s seven major automobile manufacturers (Toyota, Nissan, Honda, Mitsubishi, Mazda, Subaru, and Suzuki), as estimated using Equations (1) and (2).
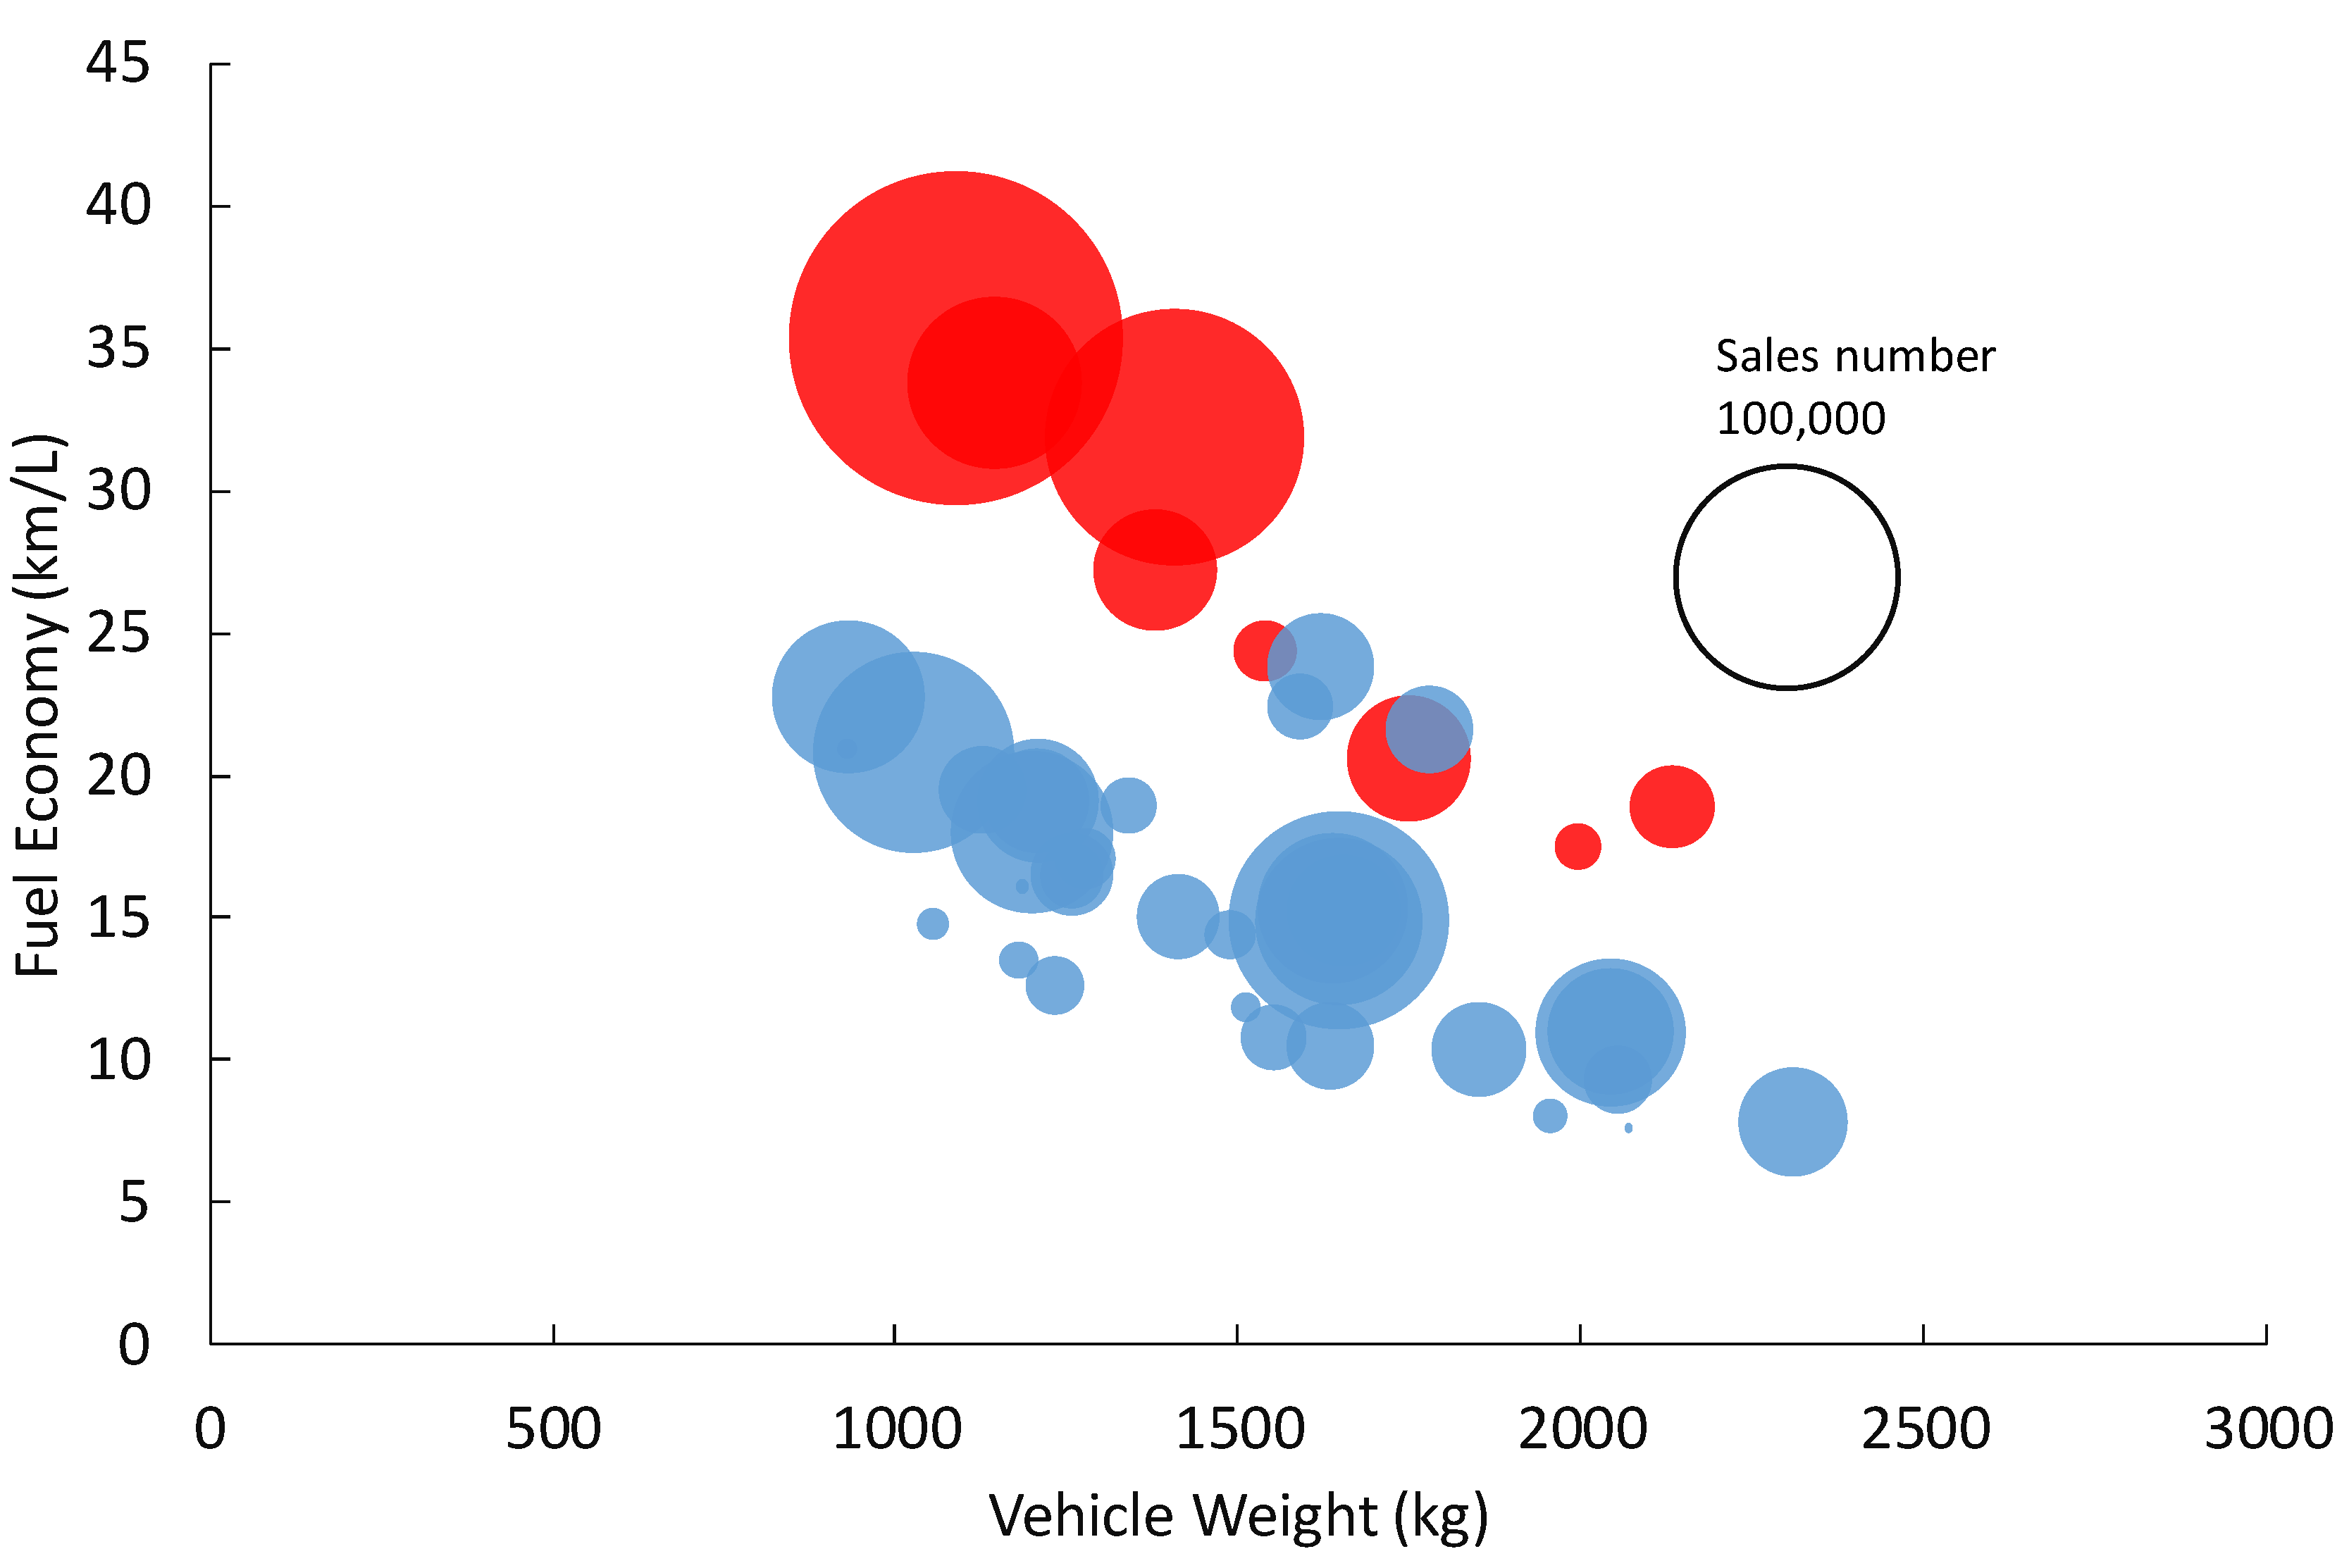
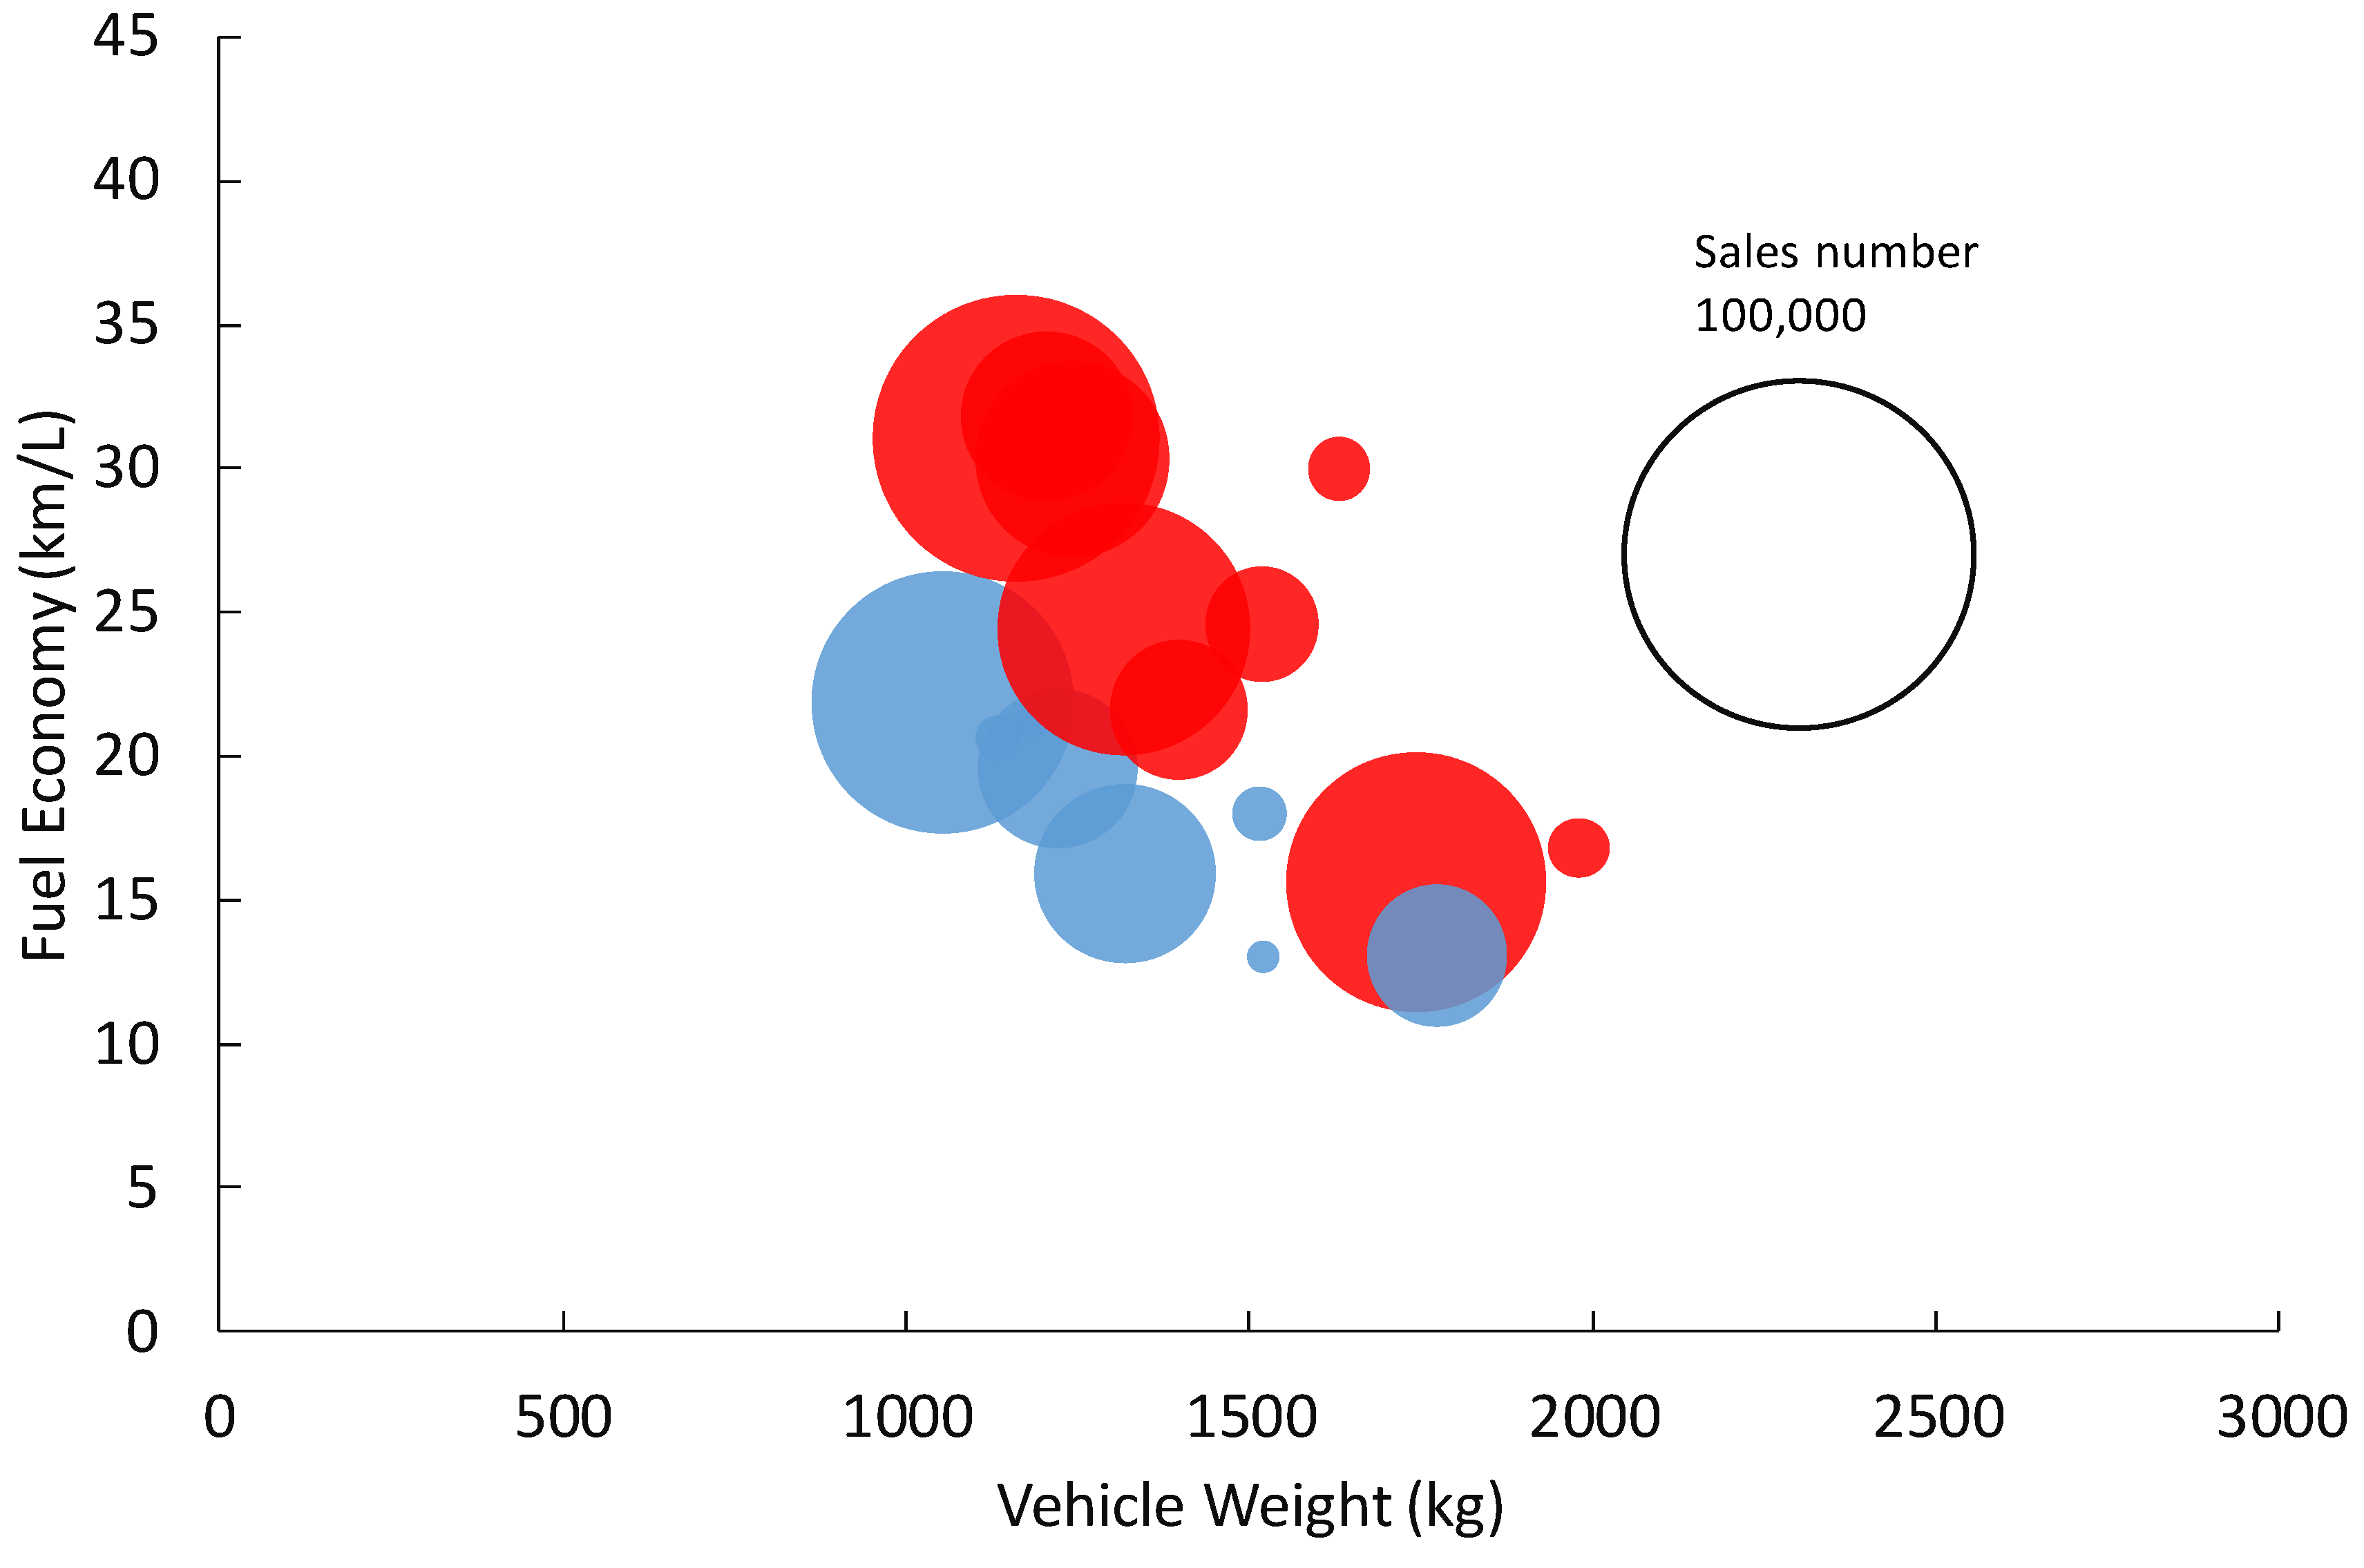
Table 2 shows that the CAFEs of Toyota and Honda exceeded their CAFE targets, while those of Nissan, Mitsubishi, Mazda, Subaru, and Suzuki fell below their CAFE targets. When the CAFE standards are introduced in 2020, Nissan, Mitsubishi, Mazda, Subaru, and Suzuki which cannot currently meet their targets, will need to step up their efforts to improve fuel economy. The relationships between fuel economy by vehicle model, vehicle weight, and the number of vehicle sales by model for the two automobile manufacturers that met their CAFE targets, Toyota and Honda, are plotted in Figures S1 and S2 of the Supporting Information, respectively. Figure S1 shows that Toyota sells a large number of vehicle models that have exceptionally good fuel economies. The fact that Toyota sells a much larger number of hybrid vehicles than the other six automobile manufacturers appears to be a factor in Toyota’s success in meeting the CAFE standards. On the whole, Honda sells fewer vehicle models with poor fuel economies than does Toyota, and for that reason, it too managed to meet the CAFE standards (Figure S2). Thus, differences in sales patterns and fuel economy technology between companies account for the gaps in their ability to achieve their targets.
4.3. Sales Maximization Under the CAFE Standards
Before delving into the results for sales maximization, let us first review the state of Japan’s seven major automobile manufacturers as of 2015. According to the Japan Automobile Dealers Association, approximately 2.7 million passenger vehicles (standard-sized vehicles (white plate vehicles) and Kei passenger cars (yellow plate vehicles)) were sold in 2015. It should be noted that Kei passenger car has an engine of 660 cc or smaller, whereas standard-sized vehicles has a larger internal-combustion engine than 660 cc. Sales shares by company were led by Toyota at 46% (1.25 million vehicles), followed by Honda at 14% (380,000), Nissan at 11% (290,000), Mazda at 7% (180,000), Subaru at 5%, (120,000), Suzuki at 3% (70,000), and Mitsubishi at 1% (30,000). Japan’s automotive-related industries combined for a market scale of 64 trillion yen [29].
While these 2015 sales figures do not account for CAFE standards, as given in the previous section, fuel economy and sales patterns for each vehicle model are two necessary elements for achieving the CAFE standards. Thus, the sales for each scenario will now be given with regards to the CAFE standards by performing sales maximization as specified in Equation (3).
Figure 1
shows the rate of change in current sales for Scenarios I through IV compared to 2015 sales. Sales tend to increase with the rate of fuel economy improvements but are still decreasing for some companies; this likely depends on the sales patterns of the different companies. The slumping sales of certain companies can be explained by the poor fuel economy of each vehicle model and limited vehicle models that can be sold to satisfy the CAFE standard constraint. In contrast, sales for Nissan and Suzuki, two manufacturers who have not met their CAFE targets, increased in Scenario I, illustrating the vital importance of sales patterns (Figure 1). In Scenario IV (fuel economy improved 20%), total sales across all seven manufacturers increased by 13.7 trillion yen, with each manufacturer increasing as follows: 10 trillion yen at Toyota, 2 trillion at Nissan, 700 billion yen at Mazda, 600 billion yen at Subaru, 200 billion yen at Honda, 100 billion yen at Mitsubishi, and 100 billion yen at Suzuki. Overall, the automotive market would increase 20% (Figure 1). For the optimal sales patterns for each company, please refer to the Supporting Information.
Currently, five of the seven manufacturers—Nissan, Mitsubishi, Mazda, Suzuki, and Subaru—have not achieved their CAFE targets (Table 1). As shown in Table 3, however, all seven can implement sales plans for maximizing sales and still achieve the CAFE standards in all of the fuel economy scenarios. Even though the sales optimization has the CAFE standards imposed as an inequality constraint, note that the CAFEs, which are based on the endogenously determined optimal vehicle model sales figures, are the same as the CAFE target. One important point is that Toyota’s CAFE target based on its actual units sold for 2015 is 17.0, whereas its CAFE target based on optimized units sold would have been 15.6. This illustrates that sales activity aimed at sales maximization will bring down the CAFE target and consequently lead to a lack of discipline.
If the above CAFE standards are instated, each company can fashion their sales activity to maximize sales by shifting their sales patterns. In the next section, the environmental loads brought about by the sales activity of each company if this happens are analyzed.
4.4. Lifecycle CO2 Emissions Under the Optimized Sales Pattern
The original purpose of the CAFE system was to restrict CO2 and air pollutant emissions by making fuel economy standards more flexible. Thus, a simple analysis of CAFE standard achievement rates would be insufficient; one needs to analyze how the CAFE standards relate to the lifecycle CO2 emissions associated with vehicles. Therefore, this section analyzes the lifecycle CO2 emissions derived from vehicles with the CAFE standards introduced.
As estimated with Equation (7), the lifecycle CO2 emissions associated with vehicles manufactured by their relevant automobile manufacturer (the carbon footprint of that automobile manufacturer) in 2015 were as follows: 20 million tons for Toyota, 8 million tons for Honda, 7 million tons for Nissan, 3.6 million tons for Mazda, 3 million tons for Subaru, 1.4 million tons for Suzuki, and 730,000 tons for Mitsubishi. These constitute a footprint of approximately 40 million tons for all seven manufacturers. Thus, the Japanese automotive industry’s carbon footprint accounts for roughly 30% of CO2 emissions attributed to Japan’s transportation sector [3].
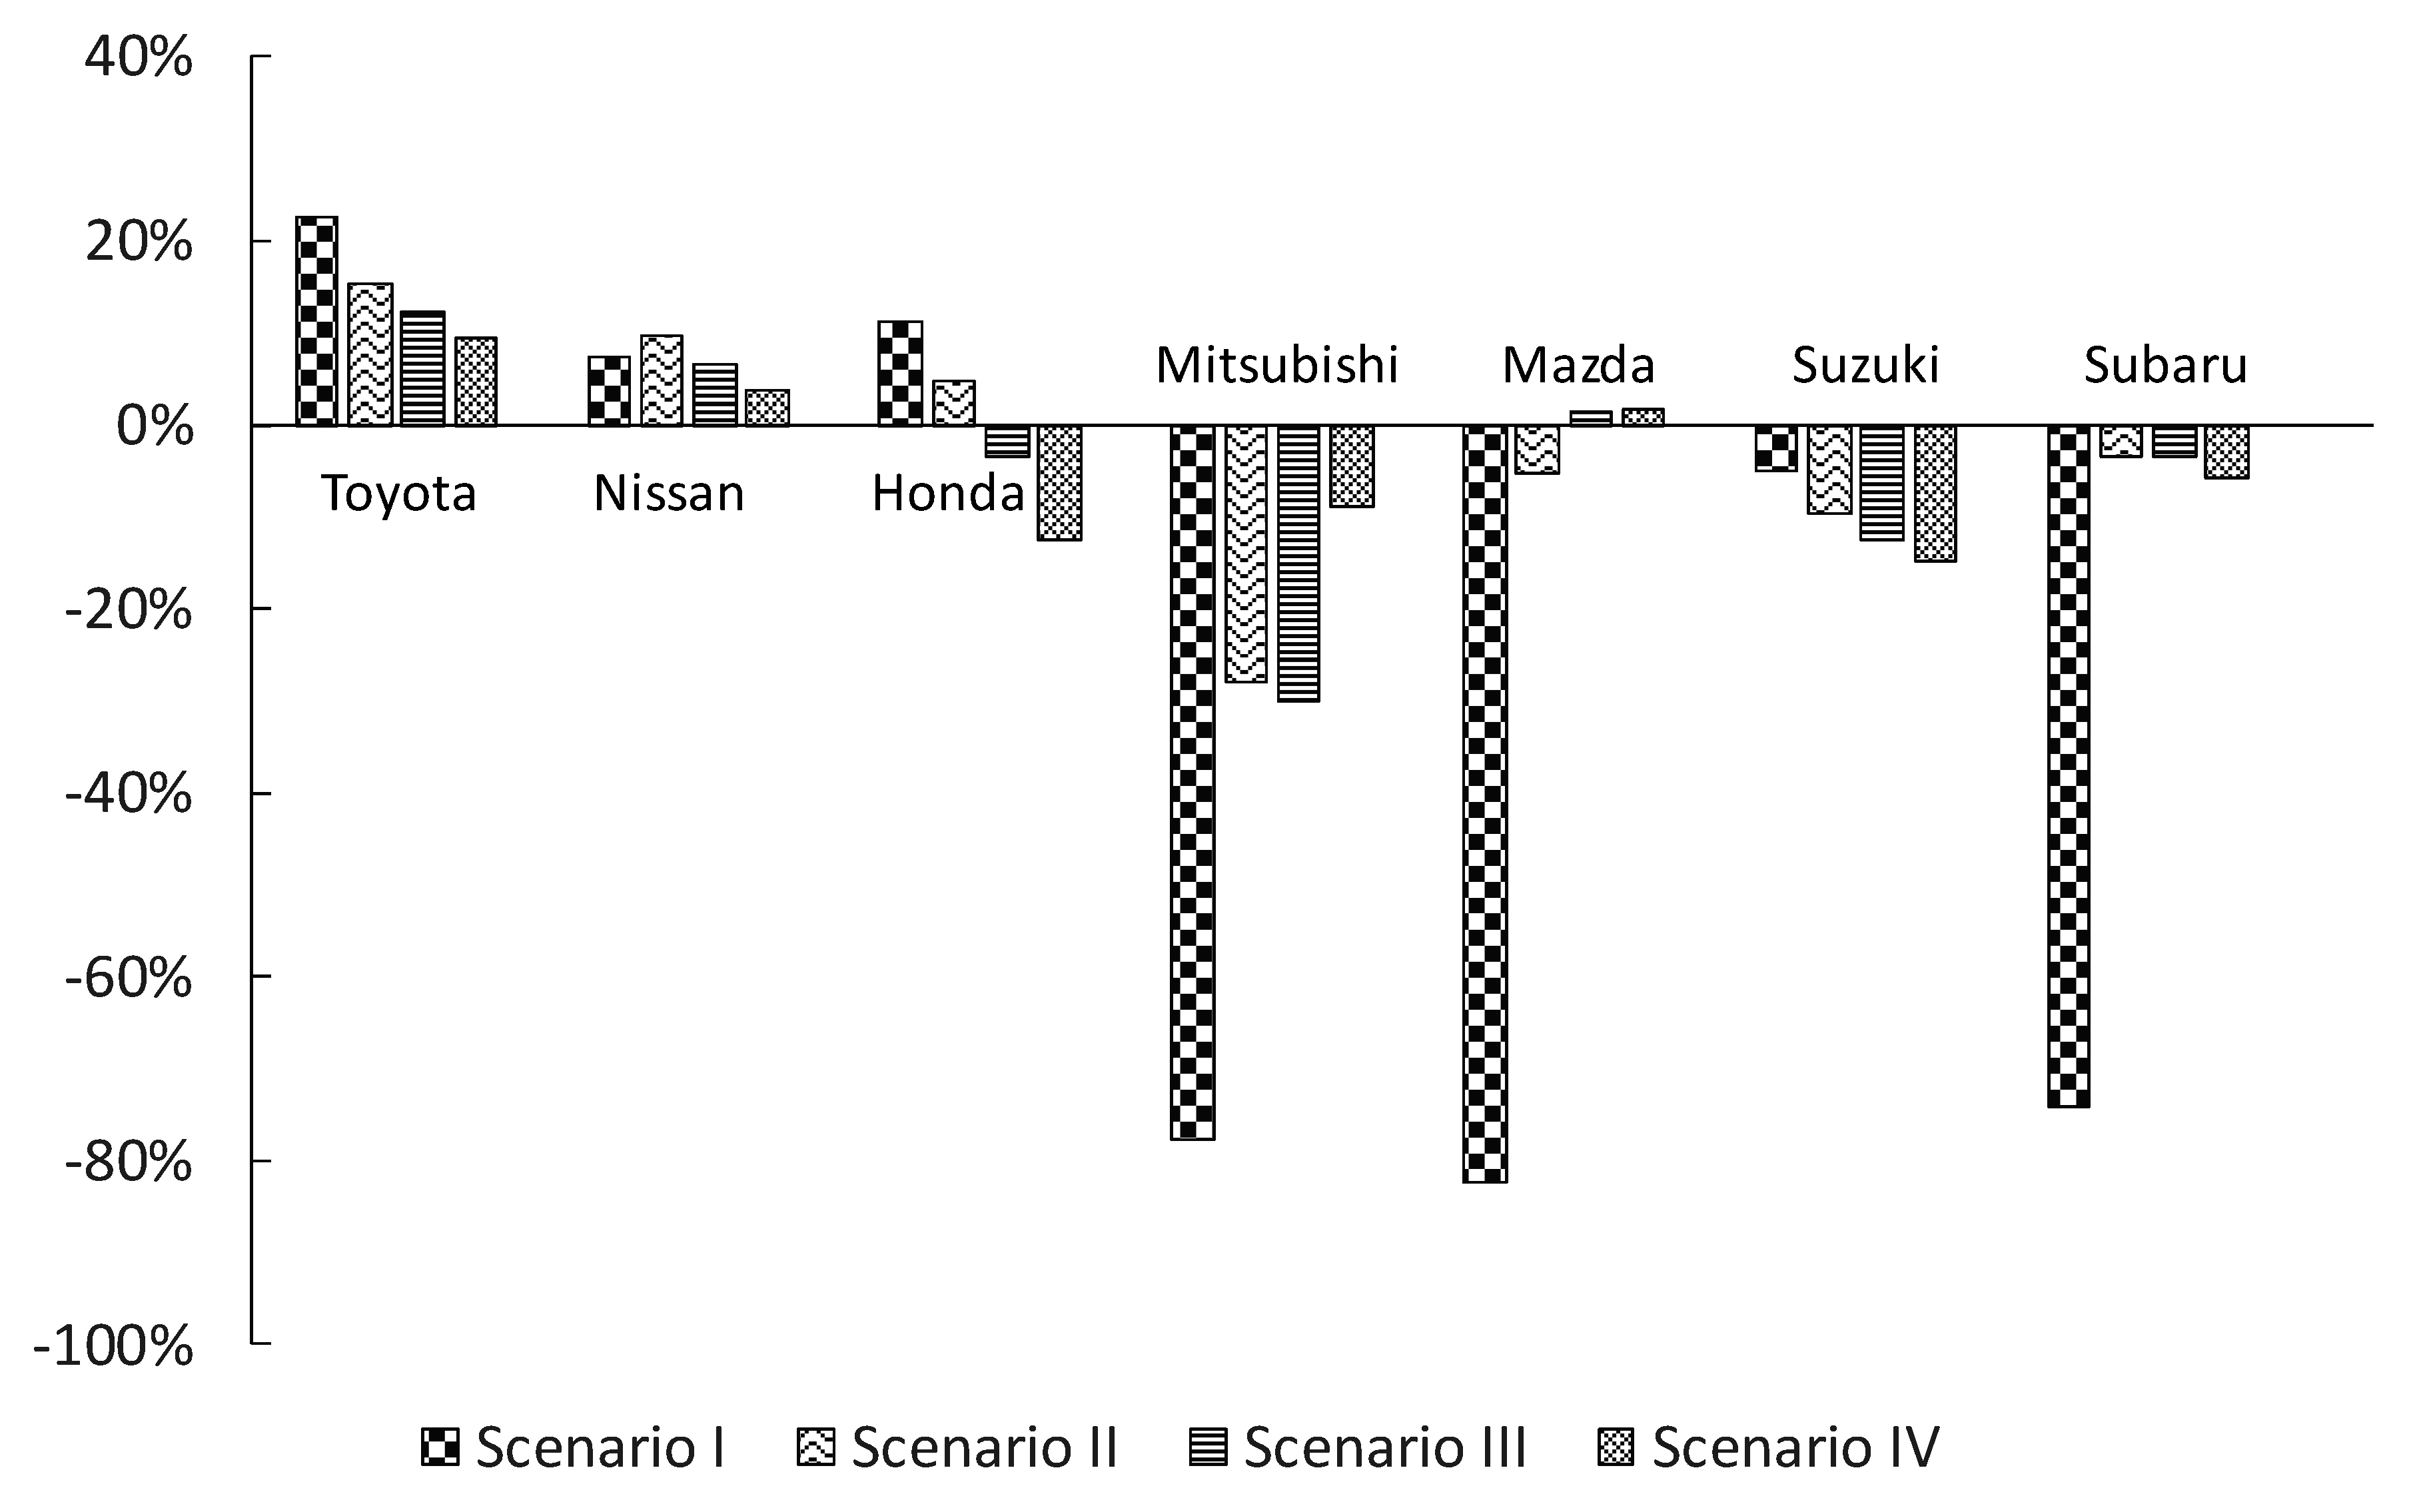
Next, Figure 2 shows the rate of change in carbon footprint for each company from their baseline carbon footprints, based on the optimal units sold for each company in fuel economy improvement Scenarios I through IV if they maximize their sales while meeting the CAFE standards. From Figure 2, one can see that as the fuel economy improvement rates increase and gasoline consumption decreases, a company’s carbon footprint will also tend to decrease.
In addition, from Figure 1 and Figure 2, although optimal vehicle sales patterns under the CAFE standard constraint would help to increase sales, they would also increase carbon footprints and thus be bad for the environment (see the Toyota and Nissan values in Figure 1 and Figure 2). Based on the estimated optimal sales patterns for each company in Scenario IV, where fuel economy for the vehicle models sold is improved 20%, the overall carbon footprint for all seven companies would be approximately 53 million tons, a 1.2-fold increase over their 2015 carbon footprint. In looking to maximize sales, manufacturers have tended to sell heavier vehicles, given the correlation between weight and price. Thus, their carbon footprint based on the optimal sales patterns has not decreased compared to the 2015 baseline value. One important finding in this study is that automobile manufacturer behavior—striving to achieve CAFE standards with the goal of maximizing car sales—will increase their carbon footprint and actually worsen the environment. It is therefore concluded that it is necessary for automobile manufacturers to mitigate the carbon footprint associated with vehicle lifecycle under the CAFE standards.
5. Conclusions and Policy Implications
This study estimated the CAFEs and CAFE targets of seven Japanese automobile manufacturers, and identified the manufacturers that met their CAFE targets and those that did not. It was clearly observed that the manufacturers that met their CAFE targets were of two distinct types: a company that offered a wide range of vehicle models with good fuel economy (Honda) and a company that focused on selling vehicle models with exceptionally good fuel economy (Toyota).
This study further proposed an optimization problem with an objective function of maximizing the profit under constraints with respect to both car sales and CAFE standards, and addressed the question of how the optimized car sales of each company differ from the actual car sales and what the effect of meeting the CAFE standards would have on reduction in lifecycle CO2 emissions under the optimized car sales.
Our main findings were as follows:
- (1)
- Automobile manufacturers can maximize their sales under the constraints of the CAFE standards, but vehicle sales plans based on sales maximization will lower their CAFE standard scores and could cause a moral hazard among automobile manufacturers.
- (2)
- Economically optimal automobile manufacturer behavior—striving to achieve CAFE standards while maximizing sales—will increase the manufacturers’ overall carbon footprint and actually worsen the environment.
Toyota published an environmental report [30] concluding that “In the United States, Toyota’s model year 2013 fleet achieved the required U.S. Corporate Average Fuel Economy (CAFE) standards and Toyota met the required greenhouse gas standards in both the United States and Canada”. Although it is important to communicate environmental outcomes to the public, it seems that the relationship between CAFE and GHG emissions is still unclear, because the GHG emissions reported by Toyota took into consideration only CO2 emissions generated by fuel consumption in a defined distance; the 2013 report did not assess how a strategy to achieve the CAFE standards would affect the overall CO2 emissions through the automobile lifecycle.
Although one of the objectives of the Japanese CAFE standards is to promote more flexible motor vehicle sales by companies [5], the standard ignores an important aspect of life cycle CO2 emissions. This paper suggests that automakers should pay more attention to the corporate life cycle CO2 emissions and publish a more comprehensive sustainability report including answers to the questions of how meeting the CAFE standards would affect the corporate lifecycle CO2 emissions, and what strategy can be effective for reducing the corporate lifecycle CO2 emissions under the CAFE standards. This study demonstrates that the CAFE analysis framework proposed in this paper is powerful for addressing the above questions. In addition, the results reveal that Japanese automakers can significantly reduce CO2 emissions under the CAFE standards.
It is also important to note that automobile manufactures that violate the CAFE standards in Japan will be fined one million Japanese yen after implementation of the CAFE standards, thus the fine under the Japanese CAFE standards will be much less than those in the U.S.A. and European countries [5]. To strengthen these currently weak regulations, the Japanese government should monitor the achievement status of all automobile manufactures and obligate the Japanese automobile manufactures to submit comprehensive sustainability reports as described above to the government. Such sustainability reports including the results estimated using the analysis framework proposed in this study can be practically useful for policy makers in arguing how the CAFE standards can contribute to reducing societal CO2 emissions, and what might be a more effective policy centered around automobile lifecycle management under the CAFE standards.
Supplementary Materials
The following are available online at https://www.mdpi.com/1996-1073/12/4/677/s1.
Funding
This research received no external funding.
Acknowledgments
The author gratefully acknowledges the helpful comments of Shigemi Kagawa, Keisuke Nansai, Shogo Eguchi, Shunichi Hienuki, and two anonymous referees.
Conflicts of Interest
The author declares no conflict of interest.
Appendix
Red circle: Vehicle model of achieving the target fuel efficiency value for a predefined passenger vehicle weight category.
Blue circle: Vehicle model of not achieving the target fuel efficiency value for a predefined passenger vehicle weight category.
Figure A1.
The relationships between fuel efficiency by vehicle model, vehicle weight, and the number of vehicle sales by model for Toyota.
Figure A1.
The relationships between fuel efficiency by vehicle model, vehicle weight, and the number of vehicle sales by model for Toyota.

Figure A2.
The relationships between fuel efficiency by vehicle model, vehicle weight, and the number of vehicle sales by model for Honda.
Figure A2.
The relationships between fuel efficiency by vehicle model, vehicle weight, and the number of vehicle sales by model for Honda.


Table A1.
Weight categories.
| Class | Vehicle Weight (kg) | Target Fuel Economy (km/L) |
|---|---|---|
| 1 | 0–740 | 24.6 |
| 2 | 741–855 | 24.5 |
| 3 | 856–970 | 23.7 |
| 4 | 971–1080 | 23.4 |
| 5 | 1081–1195 | 21.8 |
| 6 | 1196–1310 | 20.3 |
| 7 | 1311–1420 | 19.0 |
| 8 | 1421–1530 | 17.6 |
| 9 | 1531–1650 | 16.5 |
| 10 | 1651–1760 | 15.4 |
| 11 | 1761–1870 | 14.4 |
| 12 | 1871–1990 | 13.5 |
| 13 | 1991–2100 | 12.7 |
| 14 | 2101–2270 | 11.9 |
| 15 | 2271–2600 | 10.6 |
References
- United National Framework Convention Climate Change (UNFCCC). 2015. Available online: http://unfccc.int/paris_agreement/items/9485.php (accessed on 10 December 2018).
- International Energy Agency. Recent Trends in the OECD: Energy and CO2 Emissions. 2016. Available online: http://www.iea.org/media/statistics/Recent_Trends_in_the_OECD.pdf (accessed on 10 December 2018).
- Ministry of Land, Infrastructure, Transport and Tourism. CO2 Emissions in the Transport Sector in Japan. 2017. Available online: http://www.mlit.go.jp/sogoseisaku/environment/sosei_environment_tk_000007.html (accessed on 10 December 2018).
- National Highway Traffic Safety Administration (NHTSA), U.S.A. 2016. Available online: https://www.nhtsa.gov/laws-regulations/corporate-average-fuel-economy (accessed on 10 December 2018).
- Ministry of Land, Infrastructure, Transport and Tourism. Report on Fuel Economy Standard in Japan in 2020. 2011. Available online: http://www.mlit.go.jp/common/000170128.pdf (accessed on 10 April 2018).
- Kagawa, S.; Hubacek, K.; Nansai, K. Better cars or older cars? Assessing CO2 emission reduction potential of passenger vehicle replacement programs. Glob. Environ. Chang. 2013, 23, 1807–1818. [Google Scholar] [CrossRef]
- Whitefoot, K.; Skerlos, S. Design incentives to increase vehicle size created from the U.S. footprint-based fuel economy standards. Energy Policy 2012, 41, 402–411. [Google Scholar] [CrossRef]
- Luk, J.; Saville, B.A.; MacLean, H.L. Vehicle attribute trade-offs to meet the 2025 CAFE fuel economy target. Transp. Res. Part D: Transp. Environ. 2016, 49, 154–171. [Google Scholar] [CrossRef]
- Kiso, T. Evaluating New Policy Instruments of the Corporate Average Fuel Economy Standards: Footprint, Credit Transferring, and Credit Trading. Environ. Resour. Econ. 2007, 72, 1–32. [Google Scholar] [CrossRef]
- Levinson, A. Environmental Protectionism: The Case of CAFE. Available online: https://www.sciencedirect.com/science/article/pii/S0165176517303427 (accessed on 12 February 2019).
- Goldberg, P.K. The Effects of the Corporate Average Fuel Economy Standards in the U.S. J. Ind. Econ. 1998, 46, 1–33. [Google Scholar] [CrossRef]
- Kleit, A.N. Impact of long-range increases in the fuel economy (CAFE) standard. Econ. Inquiry 2004, 42, 279–294. [Google Scholar] [CrossRef]
- Bento, B.; Goulder, L.; Jacobsen, M. Distributional and Efficiency Impacts of Increased US Gasoline Taxes. Am. Econ. Rev. 2009, 99, 667–699. [Google Scholar] [CrossRef] [Green Version]
- Jacobsen, M. Evaluating US fuel economy standards in a model with producer and household heterogeneity. Am. Econ. J. Econ. Policy 2013, 5, 148–187. [Google Scholar] [CrossRef]
- Parry, I.W.H.; Walls, M.; Harrington, W. Automobile externalities and policies. J. Econ. Lit. 2007, 45, 373–399. [Google Scholar] [CrossRef]
- Austin, D.; Dinan, T. Clearing the air: The costs and consequences of higher CAFE standards and increased gasoline taxes. J. Environ. Econ. Manag. 2005, 50, 562–582. [Google Scholar] [CrossRef]
- Woo, J.; Moon, H.; Lee, M.; Jo, M.; Lee, J. Ex-ante impact evaluation of Corporate Average Fuel Economy standards on energy consumption and the environment in South Korea. Transp. Res. Part D: Transp. Environ. 2017, 53, 321–333. [Google Scholar] [CrossRef]
- Jenn, A.; Azevedo, I.; Michalek, J. Alternative Fuel Vehicle Adoption Increases Fleet Gasoline Consumption and Greenhouse Gas Emissions under United States Corporate Average Fuel Economy Policy and Greenhouse Gas Emissions Standards. Environ. Sci. Technol. 2016, 50, 2165–2174. [Google Scholar] [CrossRef] [PubMed]
- Guinee, J.B.; Heijungs, R.; Huppes, G.; Zamagni, A.; Masoni, P.; Buonamici, R.; Ekvall, T.; Rydberg, T. Life cycle assessment: Past, present, and future. Environ. Sci. Technol. 2011, 45, 90–96. [Google Scholar] [CrossRef] [PubMed]
- Samaras, C.; Meisterling, K. Life cycle assessment of greenhouse gas emissions from plug-in hybrid vehicles: Implications for policy. Environ. Sci. Technol. 2008, 42, 3170–3176. [Google Scholar] [CrossRef] [PubMed]
- Thomas, C.E. Fuel cell and battery electric vehicles compared. Int. J. Hydrog. Energy 2009, 34, 6005–6020. [Google Scholar] [CrossRef] [Green Version]
- Hawkins, T.R.; Singh, B.; Majeau-Bettez, G.; Strømman, A.H. Comparative Environmental Life Cycle Assessment of Conventional and Electric Vehicles. J. Ind. Ecol. 2013, 17, 53–64. [Google Scholar] [CrossRef]
- Bauer, C.; Hofer, J.; Althaus, H.; Del Duce, A.; Simons, A. The environmental performance of current and future passenger vehicles: Life cycle assessment based on a novel scenario analysis framework. Appl. Energy 2015, 157, 871–883. [Google Scholar] [CrossRef]
- Nansai, K.; Moriguchi, Y. Embodied Energy and Emission Intensity Data for Japan Using Input–Output Tables (3EID): For 2005 IO Table, CGER, National Institute for Environmental Studies, Japan. 2012. Available online: http://www.cger.nies.go.jp/publications/report/d031/index.html (accessed on 9 February 2019).
- Japan Automobile Dealers Association. New Car Sales in Japan 2016. 2016. Available online: http://www.jada.or.jp/contents/data/index.html (accessed on 10 December 2018).
- Ministry of Land, Infrastructure, Transport and Tourism. Inventory Data of Fuel Economies of New Cars in Japan in 2015. 2016. Available online: http://www.mlit.go.jp/jidosha/jidosha_fr10_000027.html (accessed on 10 December 2018).
- Autoc-One. 2018. Available online: http://autoc-one.jp/ (accessed on 10 December 2018).
- Ministry of Environment. Japan’s National Greenhouse Gas Emissions in Fiscal Year 2015 (Final Figures). 2017. Available online: https://www.env.go.jp/en/headline/2309.html (accessed on 10 December 2018).
- Ministry of Finance. Financial Statements Statistics of Corporations by Industry, Annually. 2016. Available online: https://www.mof.go.jp/pri/publication/zaikin_geppo/hyou/g774/774.htm (accessed on 10 December 2018).
- TOYOTA. North American Environmental Report. 2013. Available online: https://www.toyota.com/usa/environmentreport2013/ (accessed on 10 December 2018).
Figure 1.
Percentage changes in car sales under optimal Scenarios I–IV relative to the actual sales.
Figure 1.
Percentage changes in car sales under optimal Scenarios I–IV relative to the actual sales.
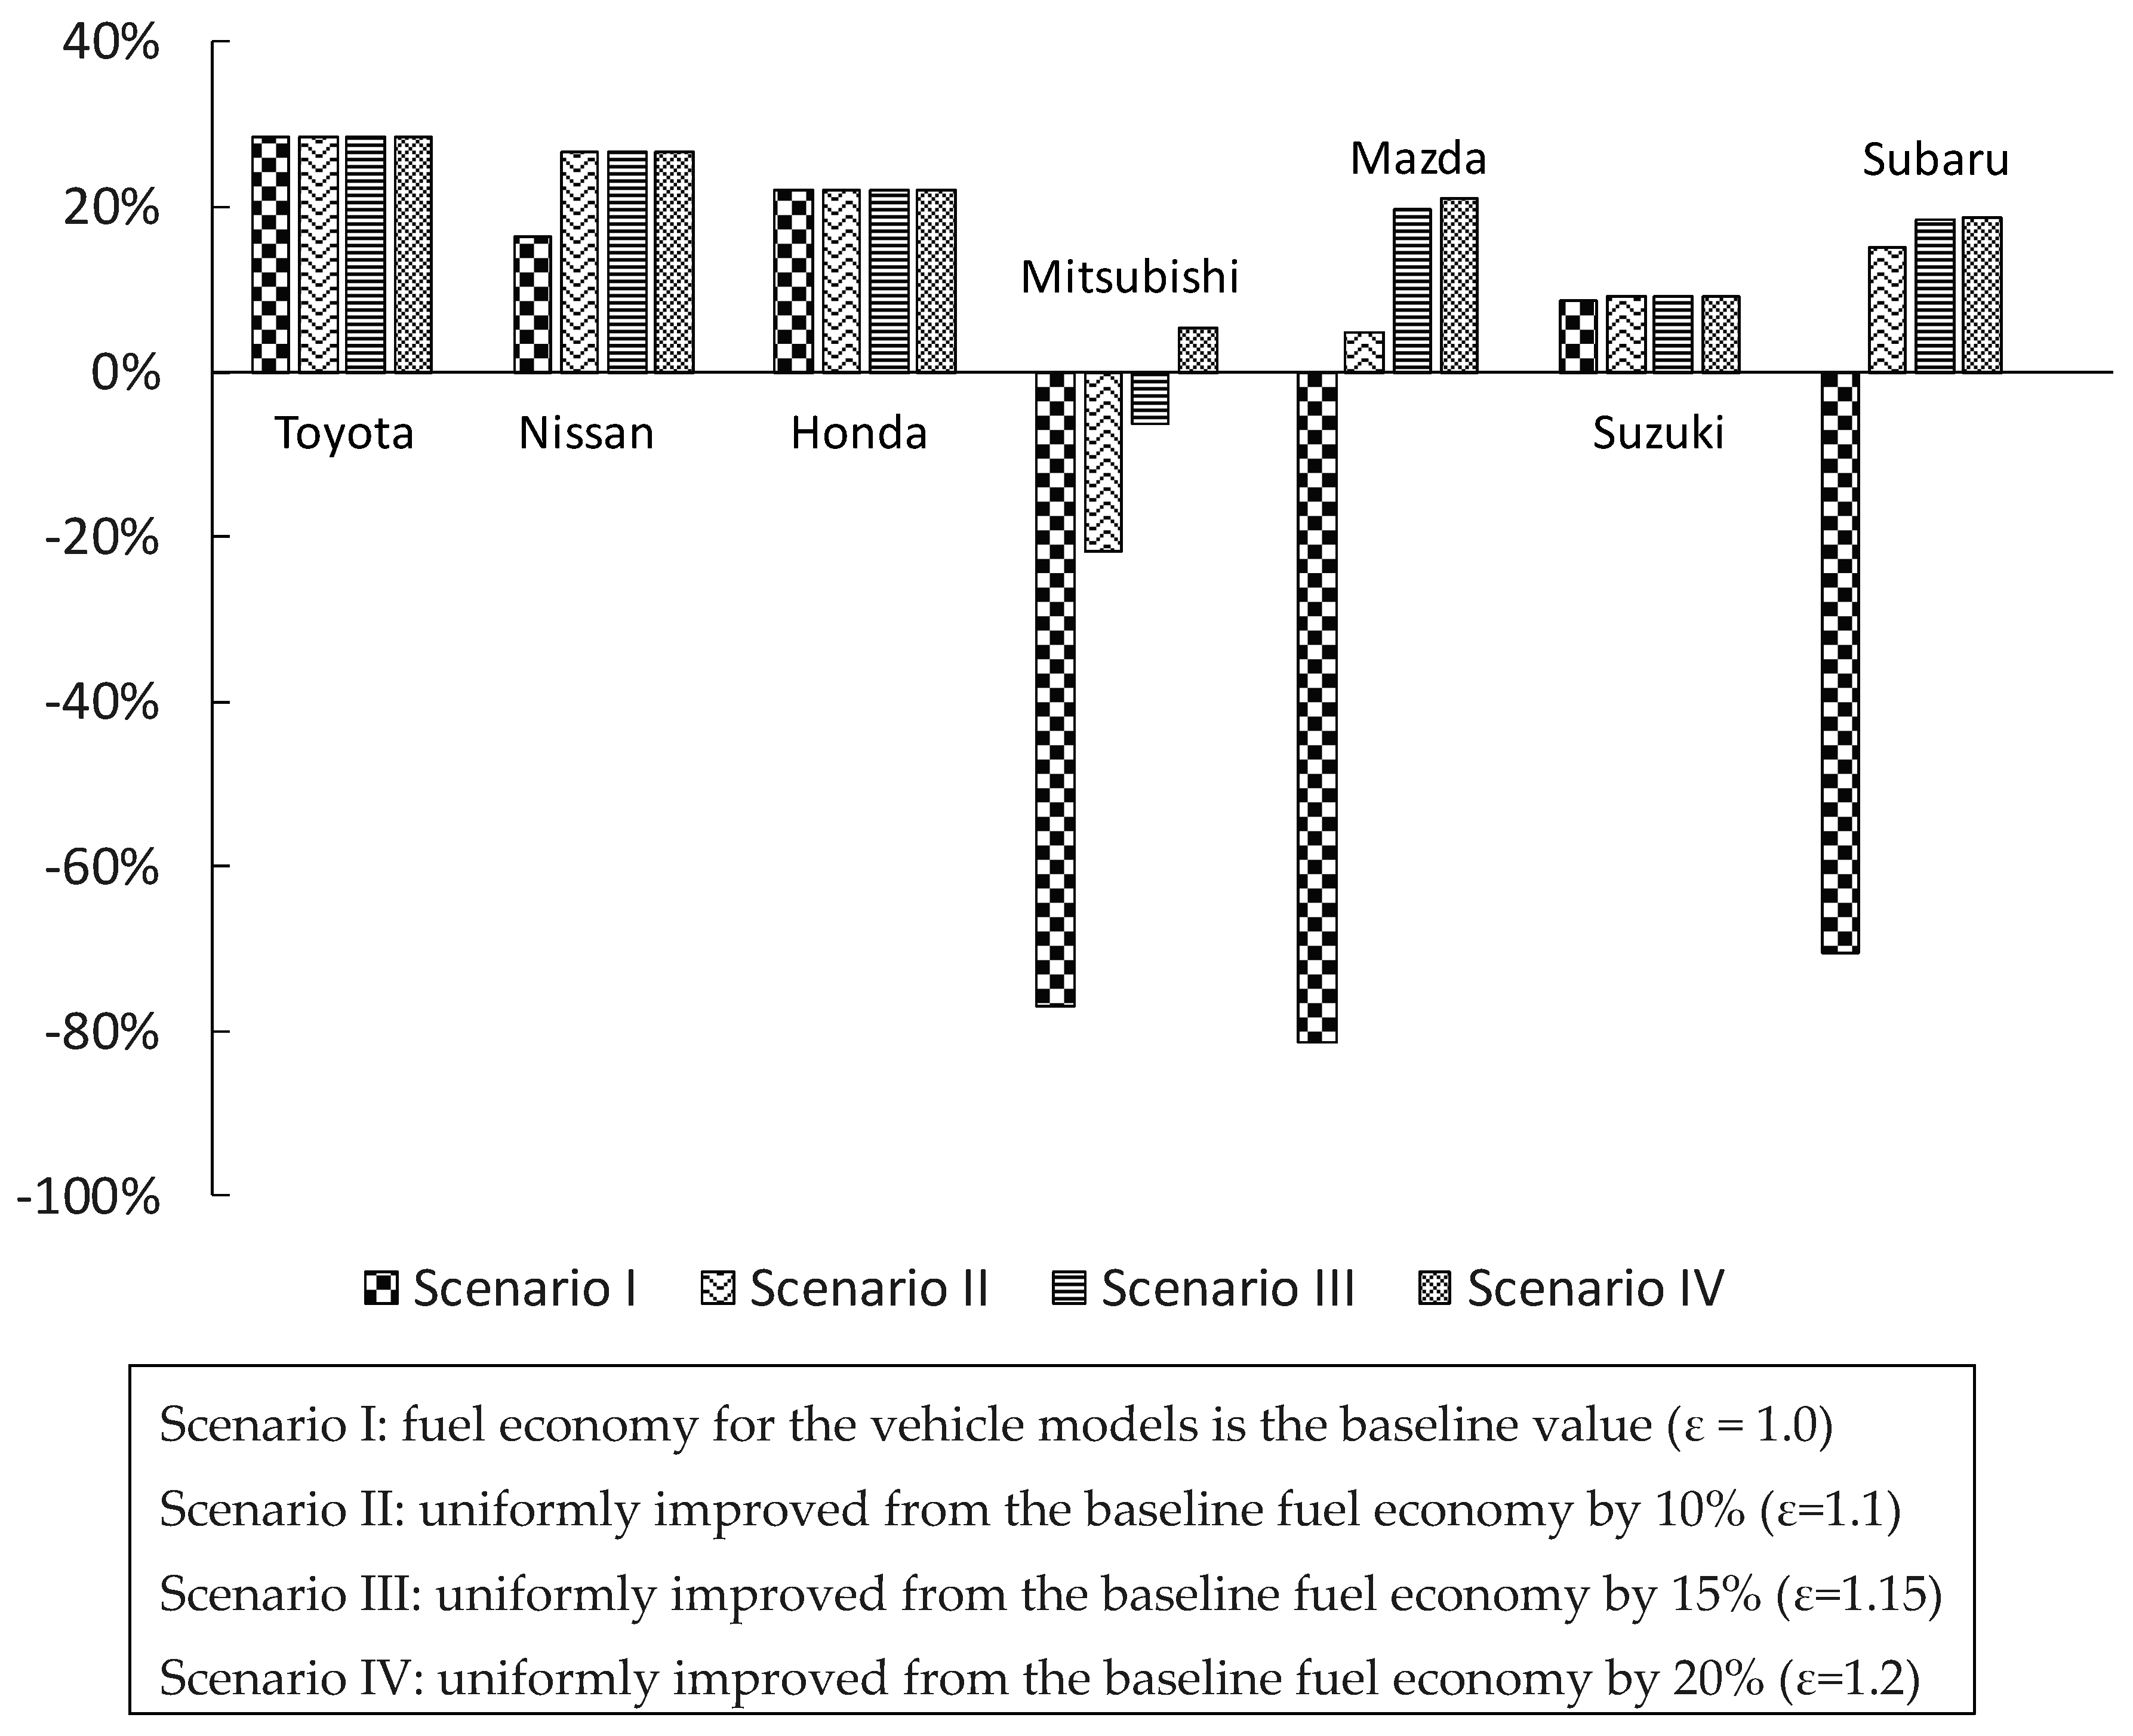
Figure 2.
Percentage changes in lifecycle CO2 emissions under optimal scenarios I–IV relative to the actual emissions.
Figure 2.
Percentage changes in lifecycle CO2 emissions under optimal scenarios I–IV relative to the actual emissions.

Table 1.
Lifecycle CO2 intensities and life cycle CO2 emissions in 2015.
| Company Name | The Number of Vehicle Models | Estimated Life Cycle Emission Intensity | Baseline (2015) Life Cycle CO2 Emissions (Million t-CO2) | ||||
|---|---|---|---|---|---|---|---|
| Mean (t-CO2/car) | Weighted Mean of the Number of Sold Vehicles | Standard Deviation (t-CO2/car) | Maximum Value (t-CO2/car) | Minimum Value (t-CO2/car) | |||
| Toyota | 42 | 28.5 | 23.7 | 47.3 | 60.7 | 14.8 | 28.4 |
| Nissan | 21 | 32.7 | 24.9 | 39.3 | 54.4 | 18.3 | 8.0 |
| Honda | 17 | 22.8 | 21.2 | 13.8 | 32.6 | 15.9 | 8.0 |
| Mitsubishi | 10 | 28.0 | 27.7 | 32.6 | 45.3 | 18.0 | 0.7 |
| Mazda | 9 | 28.0 | 24.9 | 17.7 | 37.7 | 20.2 | 3.9 |
| Suzuki | 8 | 31.3 | 25.7 | 20.5 | 43.1 | 23.8 | 1.9 |
| Subaru | 9 | 28.1 | 27.7 | 9.0 | 35.7 | 20.9 | 3.4 |
Table 2.
CAFEs and CAFE targets of seven automobile manufacturers (unit: km/L).
| Company Name | CAFE Target | CAFE |
|---|---|---|
| Toyota | 17.6 | 19.0 |
| Nissan | 18.0 | 17.9 |
| Honda | 19.1 | 21.6 |
| Mitsubishi | 16.4 | 13.3 |
| Mazda | 20.6 | 18.2 |
| Suzuki | 23.2 | 21.2 |
| Subaru | 17.4 | 15.1 |
Table 3.
CAFEs and CAFE targets of seven automobile manufacturers for the actual and optimal cases.
| Actual Case | Optimal Case under Scenario I | |||||
|---|---|---|---|---|---|---|
| Company Name | CAFE Target | CAFE | Achievement Status (Yes/No) | CAFE Target | CAFE | Achievement Status (Yes/No) |
| Toyota | 17.6 | 19.0 | Yes | 15.6 | 15.6 | Yes |
| Nissan | 18.0 | 17.9 | No | 16.6 | 16.6 | Yes |
| Honda | 19.1 | 21.6 | Yes | 17.3 | 20.0 | Yes |
| Mitsubishi | 16.4 | 13.3 | No | 22.6 | 22.6 | Yes |
| Mazda | 20.6 | 18.2 | No | 20.1 | 20.1 | Yes |
| Suzuki | 23.2 | 21.2 | No | 23.2 | 23.2 | Yes |
| Subaru | 17.4 | 15.1 | No | 16.9 | 16.9 | Yes |
| Mean | 18.9 | 18.0 | 18.9 | 19.3 | ||
| S.D | 2.3 | 3.0 | 3.1 | 3.0 | ||
© 2019 by the author. Licensee MDPI, Basel, Switzerland. This article is an open access article distributed under the terms and conditions of the Creative Commons Attribution (CC BY) license (http://creativecommons.org/licenses/by/4.0/).
Share and Cite
MDPI and ACS Style
Kaneko, M. A Lifecycle Analysis of the Corporate Average Fuel Economy Standards in Japan. Energies 2019, 12, 677. https://doi.org/10.3390/en12040677
AMA Style
Kaneko M. A Lifecycle Analysis of the Corporate Average Fuel Economy Standards in Japan. Energies. 2019; 12(4):677. https://doi.org/10.3390/en12040677
Chicago/Turabian StyleKaneko, Mitsuki. 2019. "A Lifecycle Analysis of the Corporate Average Fuel Economy Standards in Japan" Energies 12, no. 4: 677. https://doi.org/10.3390/en12040677
Note that from the first issue of 2016, this journal uses article numbers instead of page numbers. See further details here.