Article

Techno-Economic and Life Cycle Impacts Analysis of Direct Methanation of Glycerol to Bio-Synthetic Natural Gas at a Biodiesel Refinery

by
Robert White
1,2,*,
Freddy Segundo Navarro-Pineda
3,
Timothy Cockerill
2,4,
Valerie Dupont
2 and
Julio César Sacramento Rivero
3
1
Centre for Doctoral Training Bioenergy, Faculty of Engineering, University of Leeds, Leeds LS2 9JT, UK
2
School of Chemical and Process Engineering, Faculty of Engineering, University of Leeds, Leeds LS2 9JT, UK
3
Faculty of Chemical Engineering, Universidad Autónoma de Yucatán, Mérid 97000, Mexico
4
Centre for Integrated Energy Research, School of Mechanical Engineering, University of Leeds, Leeds LS2 9JT, UK
*
Author to whom correspondence should be addressed.
Energies 2019, 12(4), 678; https://doi.org/10.3390/en12040678
Submission received: 2 January 2019 / Revised: 12 February 2019 / Accepted: 14 February 2019 / Published: 20 February 2019

Abstract

:
An economic and environmental feasibility study were carried out on the thermochemical conversion of glycerol to medium methane content biological synthetic natural gas (bio-SNG). A plant that processed 497 kg·h−1 of glycerol to bio-SNG was modelled as an on-site addition to a soybean biodiesel plant based in Missouri (USA) that produced 30 million litres of soybean biodiesel per year. Assuming the glycerol contained only 80 wt% free glycerol, the bio-SNG could substitute up to 24% of the natural gas at the soybean biodiesel plant. The discounted cash flow analysis showed it was possible to generate positive NPVs and achieve internal rates of return within the hurdle rate (12%) for biomass gasification technologies. From the environmental analysis it was found that the bio-SNG could reduce global warming potential by 28% when compared to conventional natural gas in the USA and translates to roughly 7% reduction in biodiesel natural gas emissions, if the maximum 24% of natural gas were to be substituted by bio-SNG. The work highlights the potential to divert waste glycerol to an onsite energy vector at soybean biodiesel plants with minimal change to the main biodiesel production process and potential reductions to soybean biodiesel global warming potential.

1. Introduction

Global biodiesel production has increased rapidly in the last ten years. Replacing conventional fossil fuel energy with renewable alternatives such as biodiesel, has become a priority for countries wishing to meet their sustainable energy obligations. The most popular method of producing biodiesel is by transesterification of vegetable or animal fats which produces the by-product glycerin (low-purity glycerol), at a rate of 10 wt% for every kg of biodiesel. With the increasing pressure of sustainability obligations, world biodiesel production, and therefore the production of by-product, is forecasted to increase year upon year by the Organisation for Economic Co-operation and Development (OECD) [1,2]. For some biodiesel producers, unrefined crude glycerol has become an inconvenience. Before the surge of biodiesel production, it was a source of profit, but in recent years it has become more akin to a waste product [2,3,4,5]. The surplus of supply combined with the lack of demand and limited processing methods has caused the price to plummet.
The value of glycerol depends on purity or what percentage is pure glycerol. Hansen et al. [6] reported the content of crude glycerol samples from Australian biodiesel plants fell within the range of 29–97% and depended on a variety of factors including the process and feedstock, whilst samples analysed by Hu et al. [7] were in the range of 23–63%.
The spot price trend of pure glycerol (99.7 wt% kosher) and crude glycerol soap-lye glycerol (80 wt%) has been recorded by Oleoline Ltd. and is reproduced with their permission in Figure 1. Overall the price of glycerol in pure form has dropped by 50% from 1998 to 2017. A similar trend occurred with crude glycerol (80 wt%). As biodiesel production surged, the supply of has become independent of demand [8].
Conversion of crude glycerol into a value-added product increases profits for biodiesel producers. Usually the most profitable conversion method is to purify the crude glycerol to pharmaceutical or food grade, but many refineries do not have access to the required equipment and may have to pay large fees for transport, storage and equipment use. In addition, purifying may not guarantee a saleable product if the demand of pure glycerol has already been met. Consequently, research has been focussed on finding other methods of utilising for energy and chemicals [3,10,11].
A relatively new idea of converting crude glycerol to a high methane content energy vector in the form of biological substitute natural gas (bio-SNG) has been simulated in earlier work [12]. Traditionally steam reforming occurs at medium to high temperatures in order to produce hydrogen [3]. To produce methane, the temperature is reduced below usual steam reforming conditions and the pressure is increased above the atmosphere to thermodynamically favour methane production over hydrogen and water gas shift. Hydrogen and carbon monoxide that are liberated from glycerol decomposition are combined by carbon monoxide methanation to produce methane by direct methanation in a single reactor. This avoids the traditional multi step methanation process, reducing the number of reactors and avoiding severe exothermic and endothermic steps.
The first experimental work on direct methanation by steam reforming of glycerol was reported by Imai et al. [13]. Based on these bench scale reactions, it was possible to obtain 70–85% of the theoretical maximum CH4 using their setup. Both the process modelling and experimental work utilise pure glycerol as an ideal feedstock.
Soybean biodiesel plants in the USA were chosen because of well documented life cycle energy analysis [14] and their need for combustion of natural gas on-site. The energy generated from natural gas combustion is used to produce steam which is combined with the soybeans to raise their temperature to a level suitable for crushing. By producing bio-SNG from the glycerol and co-firing it with natural gas, it would be possible to offset a portion of the natural gas and reduce fossil fuel use and grid dependence. Work has been carried out to determine the impact of co-firing gases with lower calorific values such as biogas and bio-SNG with natural gas [15]. It was found that co-firing with biogas had slight positive impacts on power and efficiency but alterations to fuel flow control systems and injector flow areas may be necessary.
The USA contains the largest number of biodiesel plants that use soybeans (soybean oil) as their feedstock for biodiesel production and these plants are listed in Table 1.
The first aim of this work is to expand upon this research by producing an assessment of the techno-economic feasibility of a glycerol low-temperature steam reforming (GLT-SR) process to produce bio-SNG from glycerol onsite at a soybean biodiesel plant in the USA, using a major equipment (factored) estimate. The bio-SNG would be combusted on-site to produce steam for the soybean crushing process, generating revenue and improving sustainability by offsetting the demand for natural gas. The second aim is to assess the environmental performance of the steam created from crude glycerol bio-SNG. The economic and environmental performance of steam production from combustion of bio-SNG will be compared against traditional steam production from natural gas.

1.1. GLT-SR Simulation

GLT-SR at a soybean biodiesel plant has been modelled in earlier work using Aspen Plus® (Version 8.1, Aspen Tech, MA, USA) [12]. The process flow diagram is shown in Figure 2. The process model used for the base case scenario in this work has a pure glycerol feed of 497 kg·h−1. This value was based on a biodiesel production plant with the capacity to produce soybean biodiesel at a rate of 38.6 ML·y−1 and 3975 t·y−1 of soybean at a rate of 0.119 kg·L−1 biodiesel, using the biodiesel density of 0.8746 kg·L−1 from the GREET life cycle analysis model [14,17]. Consequently the plant has been sized such that all of the glycerol produced from the biodiesel plant can be utilised.
An inlet stream of pure glycerol and steam was fed to a reactor in chemical equilibrium (RGIBBS). Utilising a series of 4 heat exchangers (H1–H4) and a condenser as well as recycling some of the bio-SNG to generate reactant steam on site, a biomass-to-fuel efficiency of 80% was obtained indicating that at least 20% of the energy in the glycerol was lost either as waste heat or used as energy to produce steam for the chemical conversion process. The water and electricity requirement were negligible as the water could be recycled by the condenser and the electricity was only needed to drive pumps (P1–P4) and a fan (F1). The main product of the process was bio-SNG with a LHV of 16.7 MJ·kg−1 and was produced at a rate of 1.06 MJ per litre of biodiesel, under the assumption that crude glycerol contained 80 wt% of glycerol. The total natural gas energy required for the production of one litre of soybean biodiesel was 4.40 MJ based on calculations from Pradhan et al. [14], giving a potential natural gas substitution of 24%.

1.2. Bio-SNG and Natural Gas Value

The price of glycerol-based bio-SNG will be heavily dependent on that of natural gas. Historically, natural gas spot prices in the USA have experienced several distortions. Figure 3 displays data on the average price at the Henry Hub (HH) in the USA per million British thermal units (mmBtu, used in the USA as a standard measure for energy of natural gas) whereas the International Monetary Fund (IMF) has recorded the trend between 1991 and 2017, and the U.S energy information administration (EIA) reports data from 2016 with forecasts up to 2050. Additionally, the World Bank (WB) reports data from 2014 and forecasts to 2030. Historical data from the WB and IMF show agreement, but deviations occur when natural gas prices are forecasted.
Based on Figure 3, the last 40 years have displayed periods of normal gas supply (1990–2000 and 2008–2017) and scarcity (2000–2008). Increasing domestic shale-gas production was a significant factor in resuming normal gas supply after 2008. Whilst the Henry Hub (HH) is used as a price marker, the average HH price is not representative of the gas price that industry has paid in different states. Using April 2017 as an example, the lowest value was $2.26 MMBtu−1 (West Virginia) whilst $11.62 MMBtu−1 (Maryland) was the highest value, and there was an outlier price of $17.06 MMBtu−1 in Hawaii [18]. Comparatively the average USA price was $4.17 MMBtu−1. Missouri is an ideal candidate for this study as it had a relatively high gas price in 2017 (average $6.6 mmBTU−1) and is home to several large soybean biodiesel plants e.g., Paseo-Cargill Energy LLC at 56 million litre capacity.
Spot prices of natural gas give an indicator of the history and present value of natural gas. They are not an indicator of whether investment should be made in natural gas or SNG technologies as it does not account for the investment cost or future value of money.
On the other hand, levelized costs of energy mechanisms do allow comparison of different energy generating methods. The levelized cost is the average total cost to build and operate a power-generating asset over its lifetime divided by the total energy output of the asset over the same period and gives the required cost of the energy at a particular investor’s rate of return to allow the plant to break even.
Usually, levelized costs are calculated for electricity. Significant analysis has been carried out by Lazard and the UK government on levelized costs of electricity (LCOE) and compares conventional generation versus renewables [22,23]. Several authors have advocated for levelized cost of heat (LCOH), because some technologies can utilise heat directly without the need to convert to electricity, reducing the number of stages in energy conversion and improving efficiency [24,25,26]. Additionally, the impact of a carbon price based on life cycle carbon assessments on renewable energy technologies has been explored and, if introduced, will benefit technologies that produce lower carbon emissions by lowering their LCOE or LCOH [27].
There are several criticisms of levelized cost calculations as energy metrics. As levelized costs are inherently simple they ignore the following: distinctions between capital and operational costs, fluctuations in interest rates, risk, environmental impacts of the technology, transmission constraints, additional systems, and infrastructure costs. Using a levelized cost alone as a comparison can lead to misleading conclusions. To counter these misgivings when applying levelized costs to judge economic competitiveness, additional analysis are explored. Firstly, by calculating the selling price of the Bio-SNG to achieve particular internal rates of return, secondly by determining the value of the if it is processed by GLT-SR and lastly by performing sensitivity analysis on these values.

2. Economic Analysis Methodology

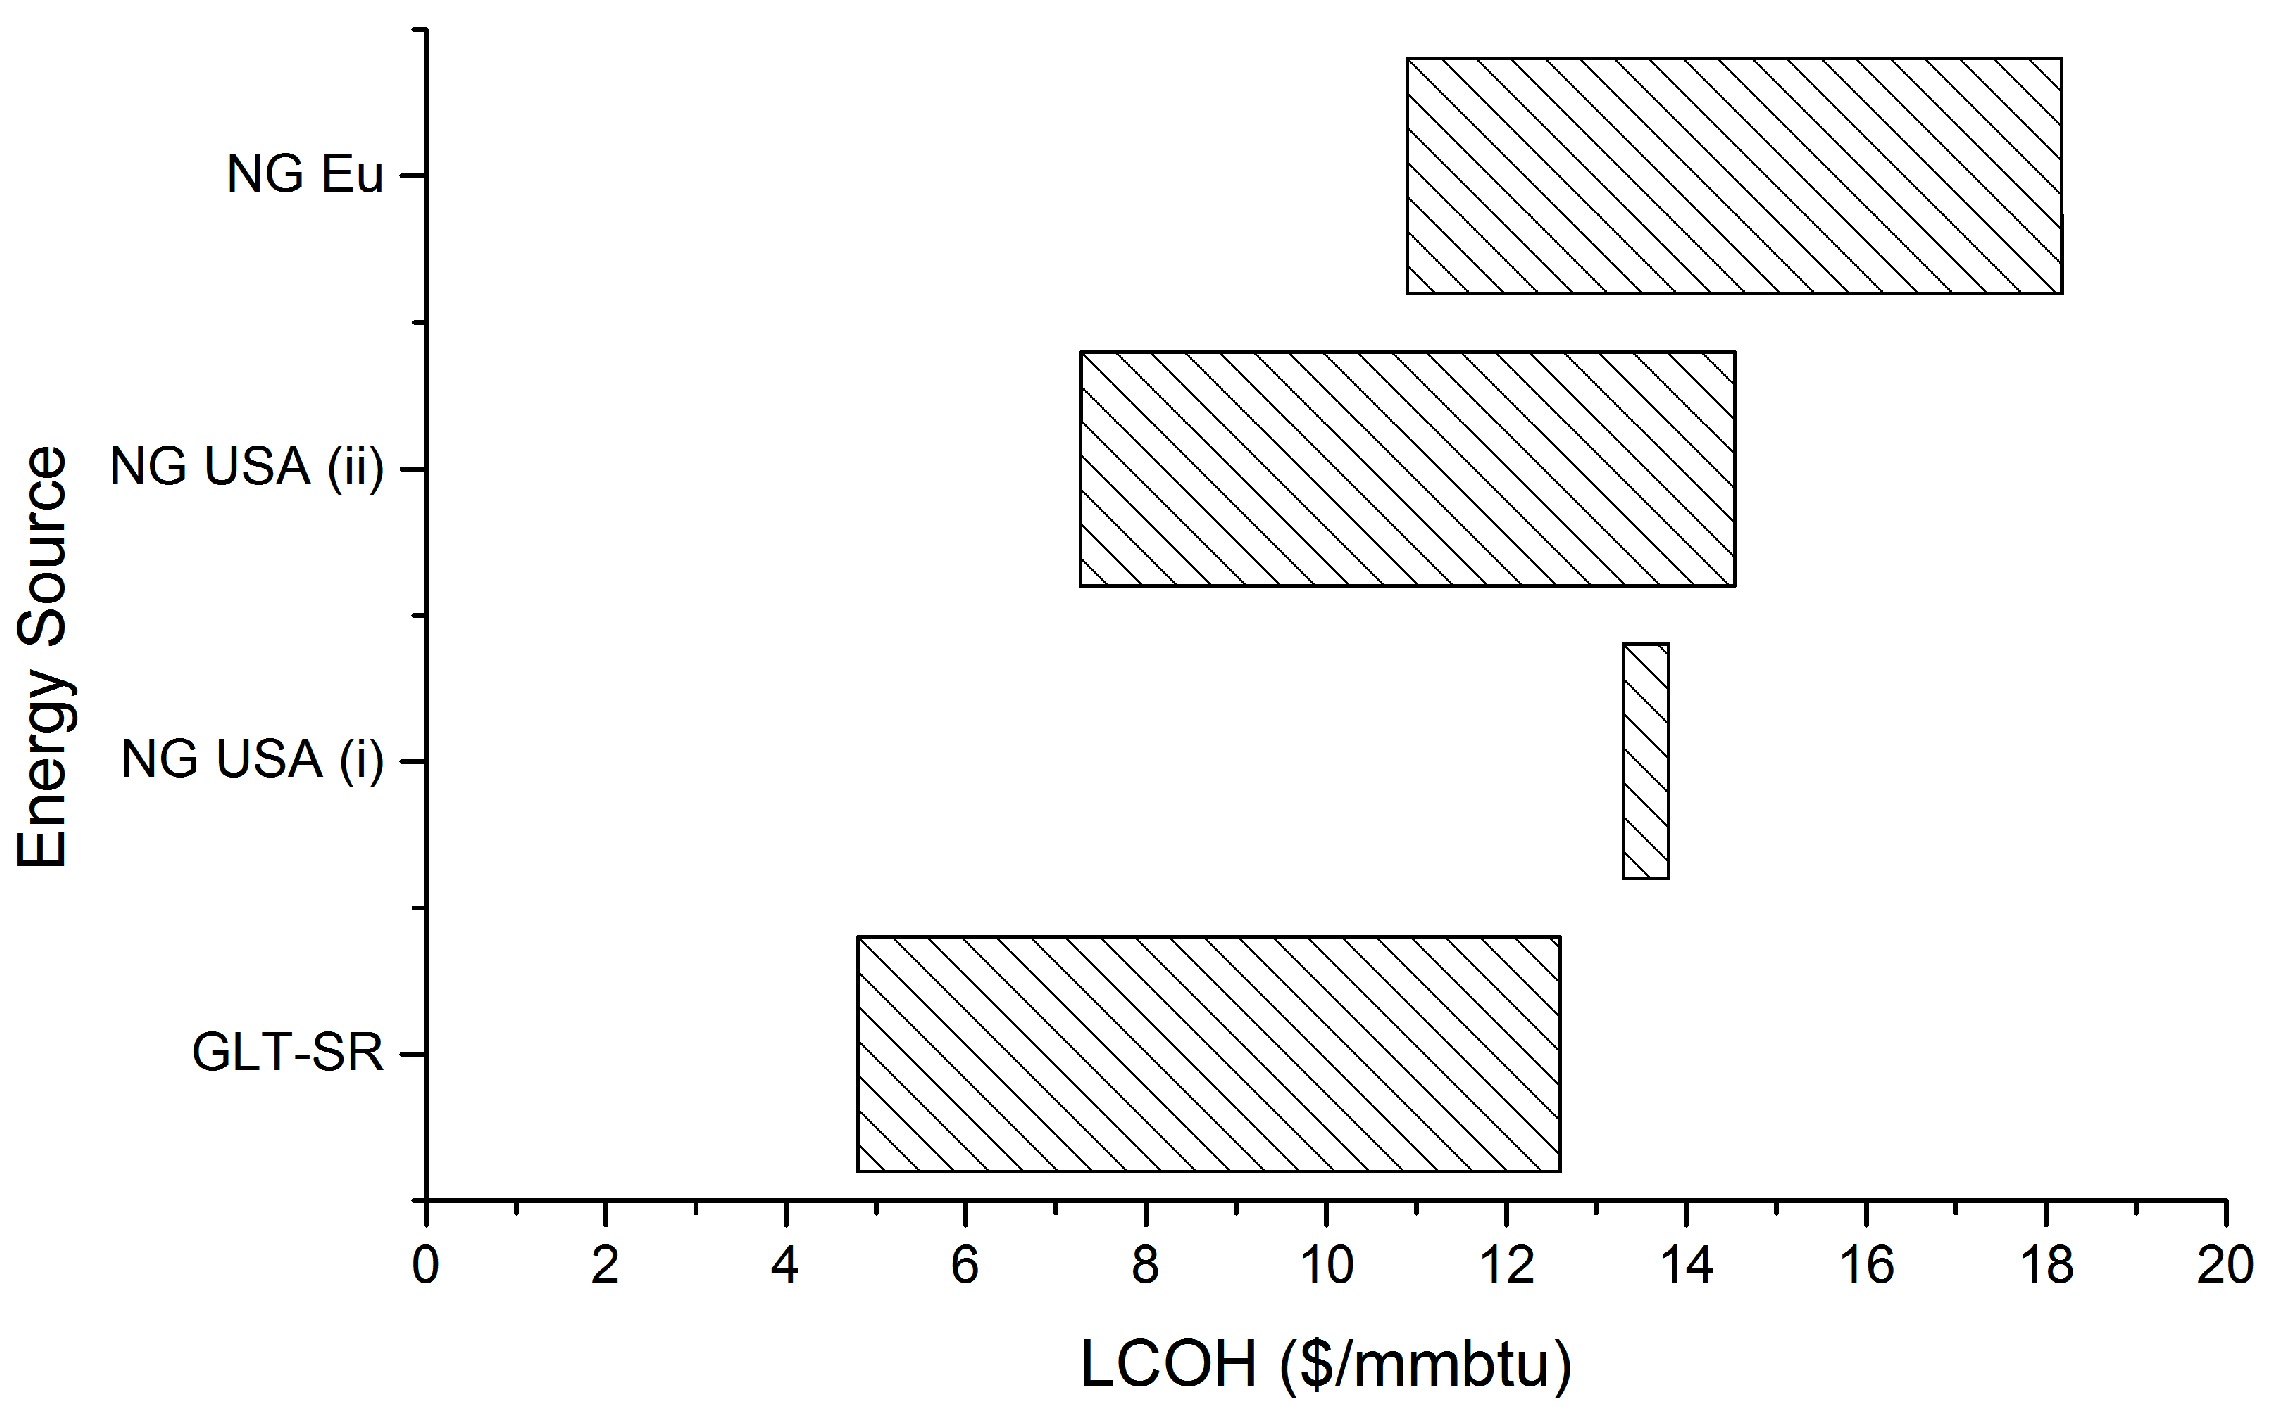
Stages involved in this economic analysis include estimating: capital expenditure (CAPEX), annual capital cost (CACC), annual operating cost (CAOC), and revenue (R). From these estimates it was possible to calculate the following economic metrics: cash flow (Cf), Net Present Value (NPV), production cost (CAPC), Levelized Cost of Heat (LCOH), and internal rate of return (IRR).

2.1. Estimation of Capital Expenditure

CAPEX was estimated using a similar method to Rotunno et al. [28]. The base equipment cost curve analysis used values from Turton et al. [29] and the plant cost estimation methodology by Gerdes et al. [30] of the national energy technology laboratory (NETL). The NETL methodology has been used in several recently published technoeconomic studies by Ogidiama [31,32].
NETL defines capital cost at five different consecutive levels; BEC, EPCC, TPC, TOC and TASC that are respectively the Bare Erected Cost, the Engineering, Procurement and Construction Cost, the Total Plant Cost, the Total Overnight Cost and the Total As Spent Capital. NETL assumes that two years of capital expenditure are required before a steam methane reforming plant begins operation e.g., construction time [33], three years for a natural gas power plant, and 5 years for a coal power plant [30]. For this work, due to the small scale (497 kg·h−1 glycerol) and that the plants location is on-site at the biodiesel refinery, it was assumed that only a year was required before plant operation.
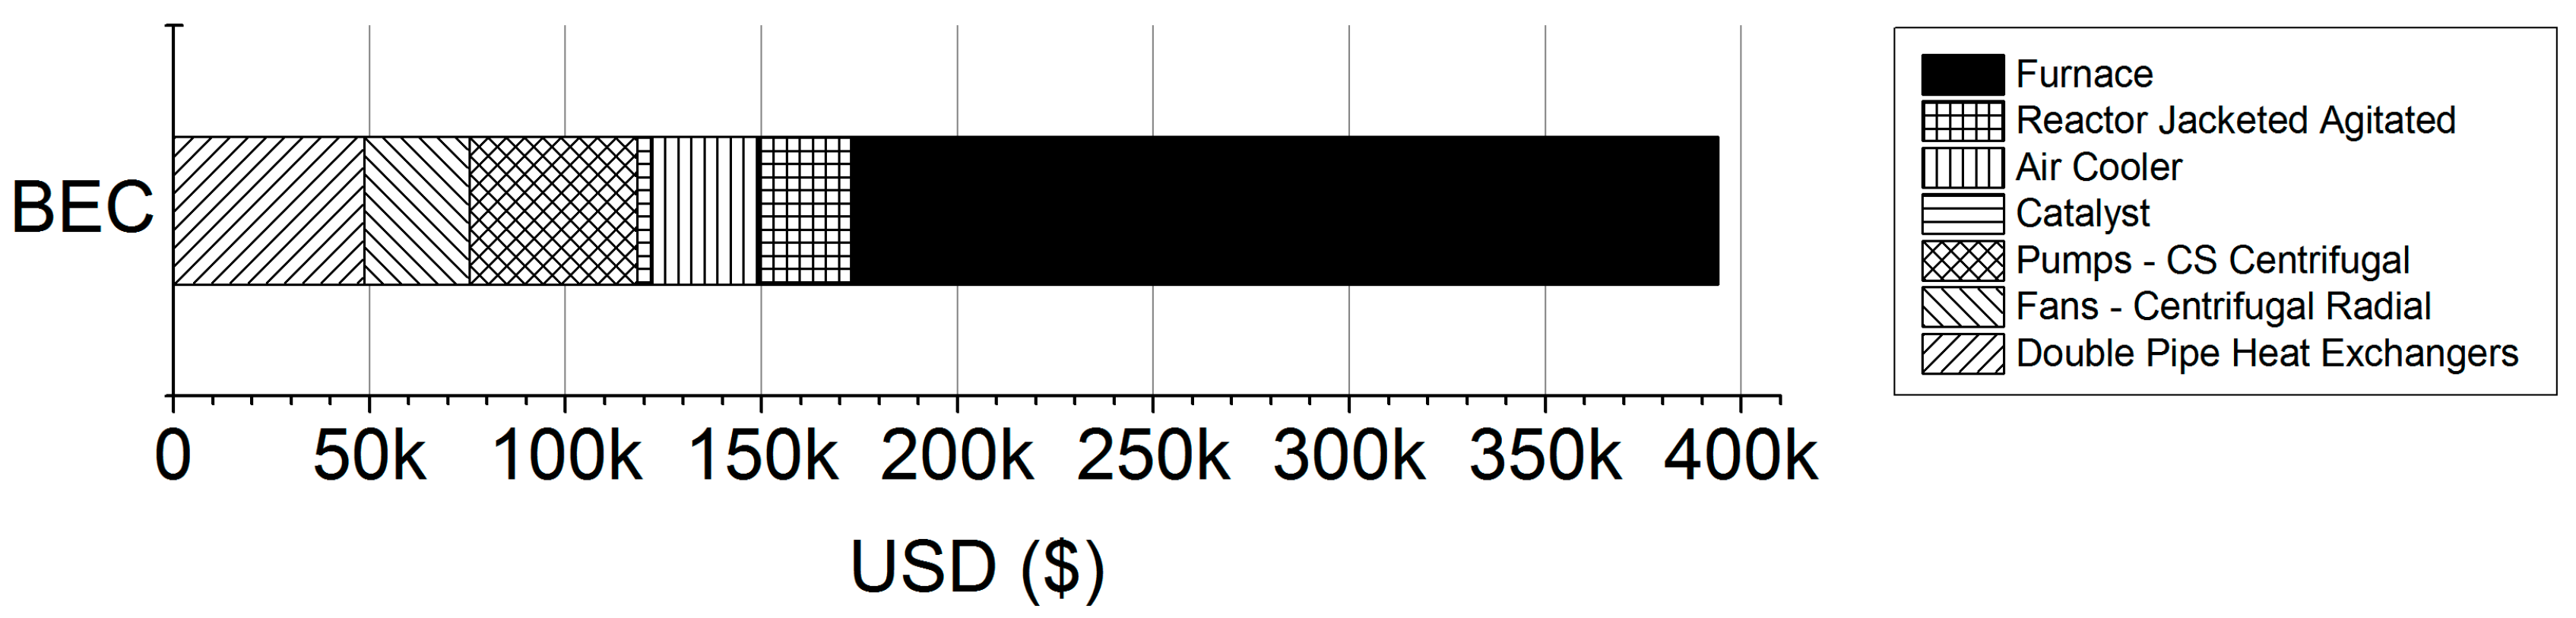
When determining the BEC, the costs for the direct and indirect labour required to produce and install the machinery of the plant were considered. BEC is synonymous with the bare module equipment cost (CBM) and was calculated according to Equation (1), accounting for the operating pressure of the equipment and material of the equipment as carbon steel. None of the equipment operated above 10 bar and therefore was not subject to the pressure factor.
C B M = C p o F B M
where CBM is the bare module equipment cost including the direct and indirect costs for each unit, FBM is the bare module cost factor which accounts for the specific materials of construction, operating pressure and installation costs including: installation materials and labour, freight, insurance and taxes, construction overhead, and contractor engineering expenses. C p o is the purchased cost for the base conditions of the equipment e.g., ambient pressure and carbon steel. FBM is calculated by the addition of the two constants relevant for the pressure and material factor. In this work, the pressure did not exceed 10 bar and the materials of construction were all carbon steel. A is the sizing value associated with the equipment.
l o g 10 C p o = K 1 + K 2 l o g 10 ( A ) + K 3 [ l o g 10 ( A ) ] 2
K values and the type of unit for A are listed in Table 2 and were taken from Turton et al. [29]. The values for A were calculated using Aspen Plus® for each module. Catalyst was included in the BEC calculation at $20 kg−1 at a mass of 170 kg to achieve a WHSV of 6.7 similar to Imai et al. [13].
Cost data for the reference equipment, and therefore the scaled cost data, will only be valid for that year. Costs vary with time; therefore a cost index method must be applied to update the costs that have been taken from previous years, for use in the current cost analysis which is shown in Equation (3). In this case, Equation (2) from Towler and Sinnot utilises an index from 2010 that must be updated using Equation (3) for the current year:
C p r = C o ( I p r I o )
where Cpr is the present cost, Co is the original cost, Ipr is the present index value, and Io is the original index value.
The cost indices are published in the literature. For this work, the Chemical Engineering Cost Index (CEPCI) is utilised. Once the cost of equipment has been determined, additional costs can be estimated using Lang, Guthrie’s or the NETL method. These costs include direct costs, such as installation of equipment, or indirect costs such as legal expenses. The cost of a plant is usually calculated in USD.
EPCC is estimated as 8–10% of the value of BEC. This includes the cost of site staffing, home office engineering and procurement services, as well as field construction management. It was assumed that as the plant is an add-on to the biodiesel refinery, there will be no additional land purchase costs.
The TPC is dependent on process and project contingencies which are an estimate of the value of unforeseen or omitted costs. Process contingency costs are based on a percentage of the associated process capital and are applied to a plant based on its current technology status. For a new concept such as GLT-SR, this percentage can be >40% and 30–70% if there is bench scale data. Project contingency is 15–30% of the sum of BEC, EPC fees and process contingency.
TOC refers to costs incurred prior to plant start up or pre-production costs. These costs are estimated at 2% of the TPC. Additionally, the cost of six months operating labour of three engineers with a salary of $35,000 per year and one month’s fuel cost at full capacity. Other pre-production costs were valued each on 0.416% of TPC (where one year is worth 5% of the TOC) and included: 1-month maintenance materials at full capacity, 1 month non-fuel consumables at full capacity, and 1 month waste disposal. Working capital and royalties are assumed to incur zero cost. Inventory capital accounts for a sixty-day supply at full capacity of non-fuel consumables e.g. chemicals and catalysts, in addition to the cost of spare parts estimated at 0.5% of TPC. Land costs are $3000 per acre. Financing costs are estimated at 2.7% of the TPC. This estimate contains costs for securing financing including fees and closing costs but not including interest during construction. Other owner’s costs are estimated at 15% of TPC. This does not include risk premiums, transmission interconnection, capital cost taxes (exempt) or unusual site improvements.
TASC estimates are based on global economic assumptions and a particular finance structure. The global assumptions in this work are the same as the NETL analysis and are shown in Table 3. Finance structures are developed for an investor owned utility (IOU) or independent power producer (IPP) in high and low risk scenarios. Whilst the technology for GLT-SR is not new, the concept, catalyst and potential products have only been modelled, therefore a high-risk scenario is adopted as the basis.

2.2. Annual Operating Expenditure and Production Cost

In this work, the annual operating expenditure (CAOC) included operating labour, maintenance, and electricity. The cost for labour will depend on the number of plant operators where required. The annual salary of each operator was assumed to be $35,000 and the number of operators was 3. The cost of maintenance is considered as 10% of the BEC value. Electricity for operation was 23.2 MJ·h−1 and consisted of the energy for pumps and fans. For water, the best-case scenario was assumed whereby the water was obtained from surface sources, e.g., rivers. The main source of water consumption will be the production of product steam. There is no fuel cost, aside from during plant start up, as bio-SNG from the process is recycled to produce steam. Both the electricity and water costs are negligible in the process and the heat from the bio-SNG allows it to be self-sustaining. Maintenance is another operating cost and is calculated as 3% if the CAPEX value. This includes catalyst costs.
Annual cost of CAPEX (CACC) is defined as the monetary value paid back to the lender and is dependent on the interest rate the loan was lent at, the length of the loan and the original value of the loan. The annual capital cost is the yearly repayment including interest for the capital borrowed in years −2, −1, and 0 to build the plant. It was assumed the capital was borrowed in three instalments over these years of 50%, 30%, and 20% respectively. The original value of the capital with the added interest is the true value of the capital loan. Using the MS Excel function PMC, the annual repayment can be calculated by setting the length of time over which to repay and the interest rate. Interest is charged on the capital even during plant construction. For this work the length of time to repay was 10 years and the interest rate was set at 5%.

2.3. Revenue and Opportunity Cost

The revenue stream is based on the price of the product. For direct substitution of natural gas, gas price was used to calculate the revenue in line with the energy content of the bio-SNG as the bio-SNG will be burnt on site for steam to offset the natural gas demand. Taxes have not been included in revenue and it is assumed that the plant will always be operating at a load factor of 90% for the base case and the glycerol feed contains 80 wt%. In the first and last years of operation, the plant will operate at 67.5% load factor to account for start-up and shut down time during plant construction, similarly to Spath and Mann [33].
Opportunity cost refers to the revenue the plant could have received, but gave up, to take another course of action. In the case of the soybean biodiesel plant, the default choice was to sell crude glycerol. The selling price of crude glycerol at a soybean biodiesel plant in the model produced by Hofstrand was $0.03 lb−1 ($0.066 kg−1) [34]. This is similar to the range of values of crude glycerol as reported by Johnson et al. [2] of $0.025–0.05 lb−1. The difference in revenue between the default and the alternative choice is the opportunity cost or benefit, if the alternative is less or more lucrative, respectively.

2.4. Net Present Value and Internal Rate of Return

The worth of money changes with time. The present value of cash is lower than the future value because money in the present is more valuable than in the future. The relationship is described in Equation (5) and converts the present value of money into the future value by applying a discount.
P V = F V ( 1 + r ) n
where PV is present value, FV is future value, r is the discount or interest rate and n is the number of years of investment.
The cash flow of a plant is the revenue minus the operating expenditure (OPEX) to generate that revenue. Values can be calculated for each year that the plant is projected to run. The present value cash flow can be converted to the future value and is known as the discounted cash flow (DCF) and accounts for the time value of money.
The net present value (NPV) is defined as the cumulative DCF. Equation (5) can be used to calculate the NPV whereby Cf is the cash flow in any given year n, r is the discount or interest rate, and TPL is the plant life.
N P V = n = 0 n = T P L C f ( 1 + r ) n
The cash flow (Cf) can be calculated as in Equation (6), where R is revenue, CAOC is annual operating cost, and CACC is annual capital cost:
C f = R C A O C C A C C
A positive NPV indicates a profitable venture, a zero NPV indicates the venture breaks even, and a negative NPV indicates a venture that produces a loss. The discount rate heavily impacts the NPV and is usually based on the rate of inflation. For the base case the discount rate is 12%.
In addition to the NPV, a profitability analysis is essential to determine the feasibility of a project. The payback time and internal rate of return are common methods of determining project feasibility. The payback time is the number of operating years required to reach the financial breakeven point. The financial breakeven point occurs when the cumulative cash flow is zero. The discount rate that creates an NPV value of zero at the end of a project is known as the internal rate of return (IRR). The hurdle rate is the minimum IRR that is required for investors to be willing to commit capital to a project. Usually, hurdle rates for energy generation technologies range between 6–16% [35]. The Solver add-in in MS Excel was used to find the IRR. Parameters describing the base scenario plant are recorded in Table 4. No taxes or subsidies were included.

2.5. Levelized Cost of Heat (LCOH)

LCOH is calculated as in Equation (4). The efficiency of the direct conversion of the bio-SNG to heat for use within the biodiesel plant is set at 90%, the same as within the GLT-SR process:
LCOH = n = 0 n = T P L C A C C + C A O C ( 1 + r ) n E B i o - S N G ( 1 + r ) n
where CACC is annual capital cost, CAOC is annual capital cost, r is the discount rate, n is the year, EBio-SNG is the energy from bio-SNG that is converted at an efficiency of 90% to heat for steam production, and TPL is and plant life in years.

3. Environmental Analysis Methodology

Environmental factor assessments involve methods to estimate the potential environmental impacts derived from a production process [36,37]. Examples of these assessments include an Environmental Impact Assessment (EIA), Strategic Environmental Impact (SEA), and LCA. LCA includes the environmental impacts derived from the feedstock including; production and acquisition, transport, and transformation, as well as distribution, use, and waste management including disposal and recycling of any products and has been reviewed by Finnveden et al. [38].
In this work, the environmental performance of the steam generated through the combustion of -based bio-SNG was analysed by means of a LCA considering the steps recommended by the ISO 14040: (1) goal and scope definition, (2) life cycle inventory, (3) environmental impact assessment, and (4) interpretation. The following sections explain in more detail these steps.

3.1. Goal and Scope Definition

The aim of the LCA was to assess the environmental performance of the steam generated through the combustion of -based bio-SNG and compare it with that of the conventional steam generated from natural gas. Therefore, the functional unit selected was 1 kg of steam at 10 ATM. The whole system is described in Figure 4 The system boundaries of the steam production from -based bio-SNG include the soybean production and crushing, the transesterification of its oil, the methanation of the, and the combustion of the resulting Bio-SNG to generate steam at 10 atm. The distribution and use of the co-products (soybean and biodiesel), as well as of the -based steam were excluded of the analysis. Infrastructure activities were also excluded of the analysis. Figure 4 also shows the alternative system for comparison purposes whose system boundaries included the natural gas extraction, processing and transport, and the steam generation (at 10 atm) through combustion. It was assumed that 90% of the energy from the natural gas or Bio-SNG was transferred from the boiler to the water during steam generation.

3.2. Life Cycle Inventory

Table 5 shows the inventory data for the methanation (GLT-SR block of Figure 4) and bio-SNG combustion (gas boiler combustion block of Figure 4) stages. These data were estimated from the simulation (see Figure 2). The emissions derived from the gas boiler combustion block correspond to the combustion gases from the burning of the bio-SNG and therefore, the carbon dioxide is considered as biogenic, that is, it is considered to have zero potential environmental impact as this carbon dioxide was fixed by soybean through photosynthesis during its cultivation. Further data, including names of the modules from the Simapro® software can be found in the supplementary information.
As this work focuses on the methanation of the glycerol to produce bio-SNG, the potential environmental impacts of the soybean production and crushing, as well as of the transesterification of the soybean oil are included (Figure 4). The corresponding emissions of these processes were estimated using the data of the United States Life Cycle Inventory Database (USLCI, soybean production stage) and the Ecoinvent database v3.0.4 (soybean crushing and transesterification) [39]. Table 6 summarizes these results. The soybean production stage contributes the most to all the analyzed environmental impacts (38–81%) and are dominated by the application of pesticides and fertilizers to cultivate soybeans. The results of Table 6 will be added to the potential environmental impacts of the GLT-SR and gas combustion blocks depicted in Figure 4.

3.3. Environmental Impact Assessment

The potential environmental impacts were assessed using the CML-IA v3.03 (2013) global methodology [40]. The following environmental impacts categories were considered: Abiotic Depletion Potential (ADP), Abiotic Depletion Potential (fossil fuels) (ADP-FF), Global Warming Potential (GWP), Ozone layer Depletion Potential (ODP), Human Toxicity Potential (HTP), Freshwater Aquatic Ecotoxicity Potential (FWAEP), Marine Aquatic Ecotoxicity Potential (MAEP), Terrestrial Ecotoxicity Potential (TEP), Photochemical Oxidation Potential (POP), Acidification Potential (AP), and Eutrophication Potential (EP). Simapro® (V8.4, PRé Sustainability, The Netherlands) was used to undertake all the calculations concerning the environmental impact assessment.

3.4. Interpretation

When carrying out an LCA the method of allocation is important. Table 6 shows the potential environmental impacts derived from the production of 1 kg of soybean along with 0.12 kg of glycerol. What is the best allocation method for the total potential environmental impacts between these two products is still under debate.
Physical allocation (mass or energy) criteria have been used in the literature. Each allocation alters the proportion of emissions, and therefore life cycle impacts, associated with each product. An economic allocation is also possible based on the prices of the final products. This is important in the case of glycerol as it has a significantly lower energy content and economic value compared to biodiesel, and is produced in lower mass quantity. Another option is to assume that glycerol has no any environmental impact as it is a waste stream of the biodiesel industry, which implies that biodiesel assumes the total potential environmental impact. There is no consensus regarding the appropriate allocation criteria among the different certification schemes for biofuels production either. For instance, the Roundtable on Sustainable Biomaterials suggests an economic allocation [41] while the European renewable energy directive insists on energy allocation when concerned with biofuels production [42].
In this work, an allocation for the glycerol resulting from the transesterification of the soybean oil (Figure 4) based on the economic criteria was assumed as a base scenario considering a selling price of $0.977 kg−1 and $0.066 kg−1 for biodiesel and crude glycerol, respectively [34]. Additionally, a sensitivity analysis was performed to compare the results under different allocation methods including mass, energy, and no allocation for glycerol. It was assumed that 1 kg of biodiesel was produced along with 0.12 kg of glycerol with a lower heating value of 40.64 MJ·kg−1 and 14.44 MJ·kg−1 respectively. Finally, the no allocation scenario assumes that the potential environmental impacts of the soybean production, soybean crushing, and oil transesterification stages (Figure 4) are allocated entirely to the biodiesel and treats glycerol as a waste product.
Table 7 summarises the resulting allocation factors of the total potential environmental impacts of the soybean production, soybean crushing, and oil transesterification stages (Figure 4 and Table 6) between biodiesel and glycerol under different allocation criteria. A sensitivity analysis on GWP was performed to analyse the effect of the factors that contribute the most to this environmental. GWP was the environmental category selected due to its current relevance worldwide.

4. Economic Performance

The Base Equipment Cost (BEC) was calculated using the 2016 CEPCI value. The breakdown of costs is displayed in Figure 5.
The total cost including the furnace was $394,135. The major cost was the furnace accounting for 55% of the expenditure. By removing the furnace, the BEC was $172,823. At a soybean biodiesel plant, a furnace is required to produce steam for soybean crushing. Therefore, the BEC value with the furnace omitted was used in further CAPEX calculations as it was assumed the soybean biodiesel plant would already have a furnace and would not need any additional capacity as the soybean bio-SNG will substitute the natural gas. On the other hand, modifications to the furnace may be necessary to accommodate the lower quality bio-SNG, resulting in a larger CAPEX value.
Calculating TASC provided a minimum and maximum value depending on the risk associated with the project. Minimum, maximum, and average TASCs of $414,530, $642,790, and $528,660 were respectively calculated and the average value was used in the base case which is synonymous with CAPEX. This relates to an investment cost of $0.0014–0.0021 MMBtu−1·y−1.

4.1. Value of Glycerol and IRR

The required gas revenue to achieve a particular glycerol value and internal rate of return is shown in Figure 6. The value of glycerol in this scenario is $0.02 kg−1. In this process, glycerol value will be capped at the value of natural gas and for the case of Missouri is represented by the average Missouri gas price between May 2017 and May 2018.
To achieve sale value of crude glycerol of $0.066 kg−1, a gas price of $12.3 MMBtu−1 was required, which is larger than the highest average historical U.S gas price by over 25% and would achieve an IRR of 55%.
In the past, natural gas purchase prices in the USA have been as high as $9 MMBtu−1 as shown in Figure 3. Data from 2016–2017 shows that prices have averaged between $3–4 MMBtu−1. Future prices are based on a slow and relatively constant increase in the gas price with predicted values of up to $5 MMBtu−1 by 2030 from the World Bank, and 2050 by the United States energy information administration (EIA). At these prices, the value of the glycerol shown in Figure 6 is less than $0.01 kg−1 and an IRR of <2% would be achieved, making the plant unfeasible.
The recommended hurdle rates for biomass conversion technologies were 10–13.2% [35]. To achieve this rate of return, a gas price of at least $5.5 to $6.0 MMBtu−1 would be necessary. The gas price varies with state and Missouri was a state that had an average gas price of $6.88 MMBtu−1 between May 2017 and May 2018, and also contained soybean biodiesel plants [16,18]. Under this gas price, an IRR of 18% could be achieved, which exceeds the hurdle rate.
The opportunity cost of selecting this technology, purely based on revenue, is in favour of selling the crude glycerol. The potential revenue of selling crude glycerol is M$6.0 over a 25 year lifetime of the plant, whereas bio-SNG from GLT-SR is only M$2.21, resulting in an opportunity cost of M$3.79. This assumes that there is no cost on the biodiesel producer for selling the crude glycerol. On the other hand, if the glycerol was consigned as a waste, significant fees would be incurred. Therefore, if it is not possible to sell the crude glycerol, using a GLT-SR plant could provide an avenue to avoid waste and generate energy and revenue for the plant.

4.2. Levelized Cost of Heat

A comparison between the LCOH of GLT-SR in the base case with conventional natural gas is shown in Figure 7. The LCOH varied with discount rate and created the range of $5.7–18.5 MMBtu−1 corresponding to discount rates between 1% and 50%. The range produced falls within the LCOH associated with producing heat from natural gas heating plants in the USA and the European Union. Reducing the energy output of the plant, either through load factor, glycerol content in the glycerol feed, or the conversion efficiency of gas to heat, will increase the levelized cost. Similarly, the LCOH will be sensitive to CAOC and CACC.
A tornado diagram has been used in Figure 8 to illustrate the sensitivity of each variable, within a range unique to that variable, tabulated in Table 8. Glycerol content had a significant influence as it controls the energy available for conversion to bio-SNG. It would be unlikely that 100% glycerol would be utilised as it is worth significantly more when sold, and requires additional processing. Glycerol at 50 wt% has potential to be used if a biodiesel plant has no purification equipment for methanol, but would have greater levels of contaminants increasing the likelihood of reduced glycerol to bio-SNG conversion. Gas conversion to heat efficiency was also important as a drop of 10% efficiency results in an increase in LCOH by nearly 17%. Maintaining high boiler and heat exchanger efficiency will be necessary to maintain low LCOH.
Fluctuations in market values such as CAPEX, loan interest rate, and cost of labour were important factors that could cause the GLT-SR LCOH to increase above natural gas when higher IRR are desired. Omitting the furnace significantly reduces the CAPEX value and the LCOH, as shown by the maximum CAPEX value which reflects the cost of including the furnace at 1.25 million USD. Utilising the existing furnace at a soybean biodiesel plant is an important measure to reduce the LCOH. However it is important to note that if modifications to the existing furnace were necessary, this would increase the CAPEX required. As long as the modification costs are less than the cost of a new furnace, the LCOH will be similar to that of NG USA.

5. Environmental Performance

Figure 9 shows the distribution of the potential environmental impacts of the glycerol-based bio-SNG steam. The economic criterion was used to allocate the potential environmental impacts of the soybean production, soybean crushing, and oil transesterification stages to the glycerol. In this case, the gas boiler combustion stage contributes the most to APP-FF (34%), HTP (52%), FWAEP (61%), MAEP (60%), and EP (44%) due to the use of conventional electricity from the US grid to compress the required air for the boiler. The use of alternative and cleaner energy sources, such as photovoltaic and wind energy, could reduce these impacts. The soybean production stage, on the other hand, contributes the most to ADP (87%), GWP (43%), TEP (45%), and AP (35%) due to the use of pesticides and mineral fertilizers during the soybean cultivation. The oil transesterification stage contributes the most to ODP (37%) due to the use of methanol to undertake the reaction. Finally, the soybean crushing stage contributes heavily (67%) to POP due to the emission of hexane to chemically recover the soybean oil. The contribution of the GLT-SR block (methanation process) on the results is negligible as a portion of the glycerol based bio-SNG is used to produce the steam required.
Table 9 shows the environmental impacts of the bio-SNG-based steam and natural gas-based steam when considering an economic allocation for the glycerol derived from biodiesel production. Glycerol based bio-SNG has the potential to mitigate 33–87% of almost all of the potential environmental impacts but ADP, FWAEP, MAEP, TEP, and EP due to the use of pesticides and mineral fertilizers for the soybean cultivation, and conventional electricity from the US grid to compress the air for the boiler. Natural-gas production contributes the most to the environmental impacts of natural-gas based steam.
Figure 10 compares the environmental performance of the conventional natural gas-based steam with those of the bio-SNG based steam using different allocation criteria for crude glycerol. The bio-SNG-based steam has a better environmental performance than natural-gas-based steam in almost all the environmental categories but FWAEP when using no allocation for the glycerol. Under a mass-allocation criterion, bio-SNG-based steam has a worse environmental performance than natural-gas-based steam in all the environmental categories as 10.7% of the impacts derived from the soybean cultivation, soybean crushing, and oil transesterification stages are allocated to the glycerol (Table 7). A similar situation occurs when using an energy allocation criteria but, in this case, the bio-SNG-based steam outperforms the natural-gas-based steam in 2 out of 11 environmental categories (ADP-FF and GWP).
A sensitivity analysis of the GWP of the bio-SNG-based steam was performed to analyse the glycerol and electricity requirements of the system. The glycerol requirement (how much glycerol was used to produce 1 kg of steam) was one of the factors selected for the sensitivity analysis as the glycerol feedstock is a major contributor to the potential environmental impacts of the soybean production, soybean crushing, and oil transesterification stages, as described in Figure 9. Similarly, the electricity requirement is the main contributor of the gas boiler combustion stage with results shown in Figure 11.
The relationship between the GWP of the bio-SNG-based steam and the glycerol requirement is linear based on this model. Furthermore, the effect of the glycerol requirement on the GWP is significant as a 10% variation on the latter would result in a 7% variation on the GWP. This is not the case for the electricity requirement, as a 10% variation on this factor constitutes a 3% variation on the GWP but is more significant compared to the impact on LCOH. When compared to LCOH, a variation in 10% on electricity had less than 1% impact on overall LCOH. The lower impacts of electricity when compared to glycerol requirement is attributed to the low electricity requirement for the pumps and fans when operating at low pressures. As the glycerol becomes of a lower quality, the GWP will increase.
In the USA, the maximum capacity of soybean biodiesel production was recorded as 770 ML·y−1 in 2017. Based on the life cycle energy analysis of Pradhan et al. [14], the natural gas requirement per litre of biodiesel was 4.40 MJ and equates to 3385 TJ·y−1 for all soybean biodiesel plants. If ~24% of the natural gas demand can be substituted by glycerol based bio-SNG, there is potential to save up to 812.4 TJ·y−1 (780,600 MMBtu·y−1) of natural gas. This would result in the overall GWP of steam production increasing by 12% under a mass allocation and decreasing by 10% and 2% for economic and energy allocations, respectively.

6. Conclusions

An environmental and economic analysis to determine the feasibility of a theoretical glycerol low temperature steam reforming (GLT-SR) plant. The aims of this analysis were to provide evidence that producing bio-synthetic natural gas from soybean biodiesel glycerol can be a profitable venture both economically, via a techno-economic analysis, and for the environment, via life cycle impact analysis, using the state of Missouri in the USA as a case study. Based on the glycerol low temperature steam reforming process, up to 24% of the natural gas demand of a soybean biodiesel plant could be substituted with glycerol based bio-SNG resulting in monetary savings.
At current Missouri gas prices it was possible to achieve up to 18% internal rate of return, which is greater than the hurdle rate for biomass gasification technologies, or a crude glycerol value of $0.02 kg−1 when the is converted to bio-SNG. A similar production cost to heat from natural gas sources was observed and using crude glycerol in this way could offset up to 24% of the natural gas dependence of the biodiesel plant and reduce the use of natural gas by 812.4 TJ·y−1 (780,600 MMBtu·yr−1). Levelized costs of heat were also competitive with current natural gas heat producing technologies in the USA and Europe with a margin of M$0.6 CAPEX available, should modifications to the furnace be necessary for co-firing bio-SNG with natural gas.
The environmental impacts analysis determined that the impacts are significantly sensitive both to the allocation method and glycerol requirement (weight percentage of glycerol contained in every kg of glycerol) to produce 1 kg of steam from glycerol based bio-SNG.
Up to 780,600 MMBtu·y−1 of natural gas could be saved, if the glycerol produced in all USA soybean biodiesel plants was converted to bio-SNG and combusted on site to substitute the natural gas demand for production of steam, in the soybean crushing process.
Based on the assumptions in this work, under certain conditions, conversion of glycerol to an energy vector in the form of bio-SNG is economically and environmentally feasible. If the option of selling crude glycerol is unavailable, GLT-SR offers an alternative which could prevent additional costs from waste disposal and storage whilst potentially reducing some environmental impacts.
Further work should be carried out to optimise the GLT-SR process at the laboratory scale with the aim of using 80 wt% crude glycerol and create simulations and experiments to determine the potential impact of contaminants on the yield of Bio-SNG for simulation validation.

Supplementary Materials

The following are available online at https://www.mdpi.com/1996-1073/12/4/678/s1.

Author Contributions

F.S.N.-P. carried out the life cycle analysis modelling and writing of the life cycle analysis methodology and formal analysis of the life cycle analysis results with supervision support from J.C.S.R.; R.W. produced the original and final drafts of the manuscript as well as the formal analysis, methodology and investigation of the process plant and economic analysis, with supervision from T.C. and V.D.

Funding

Work carried out by R.W was supported by the UK’s Engineering and Physical Sciences Research Council’s (EPSRC) Centre for Doctoral Training on Bioenergy (EP/L014912/1) based at The University of Leeds and contributions from F.S.N.P were supported by Project CONACYT 250014 “Cluster Biodiesel Avanzado”.

Conflicts of Interest

The authors declare no conflict of interest.

References

  1. OECD; FAO. OECD-FAO Agricultural Outlook 2016; OECD Publishing: Paris, France; FAO: Rome, Italy, 2016. [Google Scholar] [CrossRef]
  2. Johnson, D.; Taconi, K. The glycerin glut: Options for the value-added conversion of crude glycerol resulting from biodiesel production. Environ. Prog. 2007, 26, 338–348. [Google Scholar] [CrossRef]
  3. He, Q.; McNutt, J.; Yang, J. Utilization of the residual glycerol from biodiesel production for renewable energy generation. Renew. Sustain. Energy Rev. 2017, 71, 63–76. [Google Scholar] [CrossRef]
  4. Haron, R.; Yun, H.A.H.; Mat, R.; Mohammed, M. Overview of biodiesel wastes utilization for hydrogen production. Chem. Eng. Trans. 2017, 56, 391–396. [Google Scholar] [CrossRef]
  5. Pagliaro, M. Glycerol The Renewable Platform Chemical, 1st ed.; Elselvier: Amsterdam, The Netherlands, 2017. [Google Scholar]
  6. Hansen, C.; Hernandez, A.; Mullan, B. A chemical analysis of samples of crude glycerol from the production of biodiesel in Australia, and the effects of feeding crude glycerol to growing-finishing pigs on. Anim. Prod. 2009, 49, 154–161. [Google Scholar] [CrossRef]
  7. Hu, S.; Luo, X.; Wan, C.; Li, Y. Characterization of crude glycerol from biodiesel plants. J. Agric. Food Chem. 2012, 60, 5915–5921. [Google Scholar] [CrossRef]
  8. Ciriminna, R.; Pina, C.D.; Rossi, M.; Pagliaro, M. Understanding the glycerol market. Eur. J. Lipid Sci. Technol. 2014, 116, 1432–1439. [Google Scholar] [CrossRef]
  9. Oleoline. Glycerine Market Report. 2017, pp. 3–26. Available online: http://www.hbint.com/datas/media/590204fd077a6e381ef1a252/sample-quarterly-glycerine.pdf (accessed on 19 Feburary 2019).
  10. Yang, F.; Hanna, M.A.; Sun, R. Value-added uses for crude glycerol—A byproduct of biodiesel production. Biotechnol. Biofuels 2012, 5, 13. [Google Scholar] [CrossRef]
  11. Rodrigues, A.; Bordado, J.C.; dos Santos, R.G. Upgrading the Glycerol from Biodiesel Production as a Source of Energy Carriers and Chemicals—A Technological Review for Three Chemical Pathways. Energies 2017, 10, 1817. [Google Scholar] [CrossRef]
  12. White, R.; Dupont, V.; Cockerill, T. Thermodynamic modelling and energy balance of direct methanation of glycerol for Bio-SNG production. Energy Convers. Manag. 2018, 160, 354–363. [Google Scholar] [CrossRef]
  13. Imai, H.; Yamawaki, M.; Xiaohong, L. Direct Synthesis of Methane from Glycerol by Using Silica-modified Nickel Catalyst. J. Jpn. Pet. Inst. 2017, 60, 311–321. [Google Scholar] [CrossRef] [Green Version]
  14. Pradhan, A.; Shrestha, D.S.; Mcaloon, A.; Yee, W.; Haas, M.; Duffield, J.A. Energy Life Cycle Assessment of Soybean Biodiesel Revisited. Am. Soc. Agric. Biol. Eng. 2011, 54, 1031–1039. [Google Scholar] [CrossRef]
  15. Young, J.; Won, D.; Seop, T.; Beom, K. Economic evaluation of biogas and natural gas co- fi ring in gas turbine combined heat and power systems. Appl. Therm. Eng. 2014, 70, 723–731. [Google Scholar] [CrossRef]
  16. Biodiesel Magazine. Biodiesel US Plants. 2017. Available online: http://www.biodieselmagazine.com/plants/listplants/USA/ (accessed on 11 April 2018).
  17. Huo, H.; Wang, M.; Bloyd, C.; Putsche, V. Life-Cycle Assessment of Energy Use and Greenhouse Gas Emissions of Soybean-Derived Biodiesel and Renewable Fuels. Environ. Sci. Technol. 2009, 43, 750–756. [Google Scholar] [CrossRef]
  18. eia. Natural Gas Industrial Prices by Month 2018. Available online: https://www.eia.gov/dnav/ng/ng_pri_sum_a_EPG0_PIN_DMcf_m.htm (accessed on 14 February 2018).
  19. World Bank. World Bank Commodities Price Forecast; World Bank: Northwest, WA, USA, 2017; pp. 1–4. [Google Scholar]
  20. eia. Henry Hub Natural Gas Spot Price 2017. p. 1. Available online: https://www.eia.gov/dnav/ng/hist/rngwhhdm.htm (accessed on 14 February 2018).
  21. IMF. Henry Hub Natural Gas Spot Price 2017. Available online: http://www.imf.org/external/np/res/commod/index.aspx (accessed on 14 February 2018).
  22. Lazard. Levelised Cost of Energy Analysis. 2017. Available online: https://www.lazard.com/perspective/levelized-cost-of-energy-2017/ (accessed on 20 Feburary 2019).
  23. BEIS. Electricity Generation Costs. 2016. Available online: https://www.gov.uk/government/publications/beis-electricity-generation-costs-november-2016 (accessed on 20 Feburary 2019).
  24. Tanton, T. Levelized Cost of Energy: Expanding the Menu to Include Direct Use of Natural Gas. 2017. Available online: https://higherlogicdownload.s3.amazonaws.com/APGA/1151c1f6-49e1-4598-badd-127e33da42cd/UploadedFiles/KyQ7jphQTGK6IWtFOD95_2017--Levelized-Cost-of-Energy-Study.pdf (accessed on 20 Feburary 2019).
  25. Beckers, K.F.; Lukawski, M.Z.; Anderson, B.J.; Moore, M.C.; Tester, J.W. Levelized costs of electricity and direct-use heat from Enhanced Geothermal Systems. J. Renew. Sustain. Energy 2014, 6, 013141. [Google Scholar] [CrossRef]
  26. Nian, V.; Sun, Q.; Ma, Z.; Li, H. A Comparative Cost Assessment of Energy Production from Central Heating Plant or Combined Heat and Power Plant. Energy Procedia 2016, 104, 556–561. [Google Scholar] [CrossRef]
  27. Tran, T.T.D.; Smith, A.D. Incorporating performance-based global sensitivity and uncertainty analysis into LCOE calculations for emerging renewable energy technologies. Appl. Energy 2018, 216, 157–171. [Google Scholar] [CrossRef]
  28. Rotunno, P.; Lanzini, A.; Leone, P. Energy and economic analysis of a water scrubbing based biogas upgrading process for biomethane injection into the gas grid or use as transportation fuel. Renew. Energy 2017, 102, 417–432. [Google Scholar] [CrossRef]
  29. Turton, R.; Bailie, R.C.; Whiting, W.B.; Shaeiwitz, J.A. Analysis, Synthesis and Design of Chemical Processes, 3rd ed.; Pearson Education Inc.: Boston, MA, USA, 2013; Volume 53. [Google Scholar]
  30. Gerdes, K.; Summers, W.M.; Wimer, J. Cost Estimation Methodology for NETL Assessments of Power Plant Performance DOE/NETL-2011/1455; National Energy Technology Laboratory: Pittsburgh, PA, USA, 2011; p. 26. [Google Scholar]
  31. Ogidiama, O.V.; Abu-Zahra, M.R.M.; Shamim, T. Techno-economic analysis of a poly-generation solar-assisted chemical looping combustion power plant. Appl. Energy 2018, 228, 724–735. [Google Scholar] [CrossRef]
  32. Ogidiama, O.V.; Shamim, T. Techno-economic evaluation of a chemical looping combustion plant with waste heat utilization. Energy Procedia 2017, 142, 2990–2995. [Google Scholar] [CrossRef]
  33. Spath, P.L.; Mann, M.K. Life Cycle Assessment of Hydrogen Production via Natural Gas Steam Reforming; NREL/TP-570-27637; National Renewable Energy Laboratory: Golden, CO, USA, 2001. [Google Scholar]
  34. Hofstrand, D. Tracking biodiesel profitability. Ag Decision Maker Newsletter. 2015, 13, pp. 13–15. Available online: https://lib.dr.iastate.edu/agdm/vol13/iss9/2 (accessed on 15 February 2019).
  35. Hern, R.; Radov, D.; Carmel, A.; Spasovska, M.; Guo, J. Electricity Generation Costs and Hurdle Rates Lot 1: Hurdle Rates update for Generation Technologies. 2015. Available online: https://www.nera.com/content/dam/nera/publications/2016/NERA_Hurdle_Rates_for_Electricity_Generation_Technologies.pdf (accessed on 15 February 2019).
  36. Spargo, P.L. Green Engineering: Environmentally Conscious Design of Chemical Processes; Allen, D.T., Shonnard, D.R., Eds.; Prentice Hall PTR: Upper Saddle River, NJ, USA, 2002; 552p, ISBN 0-13-061908-6. [Google Scholar]
  37. Sikdar, S.K. Sustainable development and sustainability metrics. AIChE J. 2004, 49, 1928–1932. [Google Scholar] [CrossRef]
  38. Finnveden, G.; Hauschild, M.Z.; Ekvall, T.; Guinée, J.; Heijungs, R.; Hellweg, S.; Koehler, A.; Pennington, D.; Suh, S. Recent developments in Life Cycle Assessment. J. Environ. Manag. 2009, 91, 1–21. [Google Scholar] [CrossRef] [Green Version]
  39. Ecoinvent. Ecoinvent 2018. Available online: https://www.ecoinvent.org/ (accessed on 8 March 2018).
  40. Guinee, J.B. Handbook of Lifecycle Assessment: Operational Guide to the ISO Standards, 1st ed.; Springer: Dordrecht, The Netherlands, 2002. [Google Scholar]
  41. Roundtable on Sustainable Biofuels. RSB GHG Calculation Methodology. 2012. Available online: http://rsb.org/wp-content/uploads/2017/08/RSB-STD-01-003-01-RSB-GHG-Calculation-Methodology-v2.3.pdf (accessed on 20 Feburary 2019).
  42. European Parliament. Directive 2009/28/EC of the European Parliament and of the Council. 2009, pp. 16–62. Available online: https://eur-lex.europa.eu/legal-content/EN/TXT/PDF/?uri=CELEX:32009L0028&rid=8 (accessed on 20 Feburary 2019).
  43. Gabbrielli, R.; Castrataro, P.; Del Medico, F.; Di Palo, M.; Lenzo, B. Levelized cost of heat for linear Fresnel concentrated solar systems. Energy Procedia 2013, 49, 1340–1349. [Google Scholar] [CrossRef]
Figure 1. USA spot prices for 99.7% Kosher glycerol and 80% crude soap-lye glycerol 1998–2018. Source: Oleoline Ltd. [9].
Energies 12 00678 g001
Figure 2. Aspen Plus V8.8 process flow sheet for GLT-SR. Burgundy streams with notation ‘RE’ are feed inlets, blue streams with notation ‘R’ are recycled water, red streams with notation ‘W’ are waste outlets and green streams are product outlets. Italicised and emboldened labels are blocks whereas standard font are streams. A = air, BG = bio-SNG, BGD = Dry bio-SNG, C = cooler, E = exhaust, F = fan, FG = flue gas, FGR flue gas recirculation, G = glycerol, H = heat exchanger, HPW = high pressure water, LPW = low pressure water, LPS = low pressure steam, P = pump, S = steam, SBG = splitter bio-SNG, SW = splitter water, WG = water glycerol. Mass and energy flows can be found in the reference White et al. [12].
Energies 12 00678 g002
Figure 3. Natural gas price history and future price projections based on the Henry Hub as recorded by the World Bank [19] (WB), energy information association (EIA) [20] and the International Monetary Fund (IMF) [21]. Data from the IMF and EIA agrees pre-2017 but only IMF is shown for clarity.
Energies 12 00678 g003
Figure 4. Scheme of the production of steam from glycerol-based bio-SNG and natural gas. Blocks outside the dashed lines are out of the system boundaries of the LCA. The system described in Figure 2 is represented by the GLT-SR block.
Energies 12 00678 g004
Figure 5. Breakdown of equipment contribution to the Base Equipment Cost.
Energies 12 00678 g005
Figure 6. Value of crude glycerol (kg) when converted to Bio-SNG and required gas revenue to achieve each IRR.
Energies 12 00678 g006
Figure 7. Floating bar graph comparison of LCOH for GLT-SR between different technologies where NG USA (i) is a gas furnace power vent from [24] and NG USA (ii) and NG EU are from gas heating plants [43].
Energies 12 00678 g007
Figure 8. Tornado diagram for a sensitivity analysis on different variables influencing the LCOH for the base case scenario with a discount rate of 12%.
Energies 12 00678 g008
Figure 9. Distribution of the potential environmental impacts of the Bio-SNG-based steam. Units expressed per Functional Unit (FU), that is, 1 kg of steam at 10 atm. The potential environmental impacts of the soybean production, soybean crushing, and oil transesterification stages (Figure 4) were allocated to the glycerol using the economic criteria.
Energies 12 00678 g009
Figure 10. Comparison of the bio-SNG steam environmental impacts with conventional steam using mass, energy, economic and waste allocation criteria for 1 kg of steam.
Energies 12 00678 g010
Figure 11. Sensitivity analysis of the GWP of the bio-SNG-based steam production varying the glycerol requirement to produce 1 kg of steam from bio-SNG and electricity requirements.
Energies 12 00678 g011
Table 1. Locations of soybean biodiesel plants in the USA with their capacity [16].
NameStateCityCapacity (ML)
Delta American Fuel LLCARHelena40.0
Ag Processing Inc. (Algona)IAAlgona60.0
Ag Processing Inc. (Sergeant Bluff)IASergeant Bluff30.0
Cargill Inc. (Iowa Falls)IAIowa Falls56.0
Incobrasa Industries Ltd.ILGilman32.0
Stepan Co. (Joliet)ILJoliet21.0
Louis Dreyfus Agricultural Industries LLCINClaypool90.0
Owensboro Grain Biodiesel LLCKYOwensboro45.0
Minnesota Soybean ProcessorsMNBrewster30.0
Ag Processing Inc. (St. Joseph)MOSt. Joseph30.0
Deerfield Energy LLCMODeerfield30.0
Mid-America BiofuelsMOMexico50.0
Paseo-Cargill Energy LLCMOKansas City56.0
JNS BiofuelsMSNew Albany7.5
World Energy NatchezMSNatchez72.0
Cincinnati Renewable Fuels LLCOHCincinnati60.0
Total Soybean Biodiesel (USA)--709.5
Table 2. Constants associated with Equation (2) for equipment module cost.
EquipmentUnit for AK1K2K3
Double Pipe Heat ExchangerArea, m23.340.27−0.05
Centrifugal Radial FanFlow, m3·s−13.54−0.350.45
FurnaceDuty, kW3.070.660.02
Pump SS centrifugalkW3.390.050.15
Air CoolerArea, m24.030.230.05
Reactor, jacketed agitatedVol, m34.110.470.00
Table 3. Conversion factors from TOC to TASC.
Finance StructureHigh Risk IOULow Risk IOU
Capital Expenditure Period (years)3535
TASC/TOC1.0781.1401.0751.134
Finance StructureHigh Risk IPPLow Risk IPP
Capital Expenditure Period (years)3535
TASC/TOC1.1141.2111.1071.196
Table 4. Constants and assumptions used in this work.
DescriptionValue
Feed497 kg·h−1
Bio-SNG produced (80%)4.34 MMBtu·h−1
Bio-SNG to heat conversion (boiler) efficiency0.9
Plant Operating Hours8000 h·y−1
Load100%
Plant Construction Time3 years
Plant Lifetime25 years
Plant Operation years 1, 2, 24, 2540%, 70%, 70%, 40%
Loan Grace Period0 years
Loan Length10 years
Loan deposit20%
Loan annual interest5%
Discount rate12%
Catalyst Mass170 kg
Catalyst Cost$20 kg−1
WHSV6.7 h−1
Electricity Cost$0.12 kWh
Table 5. Inventory data of the GLT-SR and gas boiler combustion blocks detailed in Figure 4. Data expressed per kg of steam at 10 atm and 181 °C.
ParameterUnitValue
Inputs
GLT-SR Block
Crude glycerol glycerolkg2.12 × 10−1
Waterkg1.15 × 10−1
Gas Boiler Combustion Block
Airkg1.86 × 10−1
Waterkg1.00
Electricity (medium voltage)kWh9.34 × 10−3
Emissions
GLT-SR block
Steam at 2 atm (112 °C)kg1.15 × 10−1
Steam at 8 atm (20 °C)kg1.79 × 10−2
Gas Boiler Combustion Block
Steamkg2.48 × 10−2
Hydrogenkg1.44 × 10−6
Carbon monoxidekg4.89 × 10−5
Nitrogen oxidekg1.01 × 10−5
Nitrogen dioxidekg1.48 × 10−9
Dinitrogen monoxidekg7.26 × 10−10
Carbon dioxide (biogenic)kg5.09 × 10−2
Table 6. The potential environmental impacts of the production of 1 kg of soybean biodiesel and 0.12 kg of glycerol using the CML-IA v3.03 (2013) method. Numbers in brackets represent the share of the corresponding stage over the total potential environmental impact.
Impact CategoryUnitSoybean ProductionSoybean CrushingOil TransesterificationTotal
ADPkg Sb eq2.13 × 10−6(92%)1.74 × 10⁻⁸(1%)1.62 × 10⁻⁷(7%)2.31 × 10⁻⁶
ADP-FFMJ2.93(28%)2.54(24%)5.14(48%)10.6
GWPkg CO2 eq0.677(62%)0.219(20%)0.197(18%)1.09
ODPkg CFC−11 eq4.63 × 10−8(39%)1.08 × 10⁻⁸(9%)6.26 × 10⁻⁸(52%)1.20 × 10⁻⁷
HTPkg 1,4-DB eq4.95 × 10−2(29%)5.72 × 10⁻²(34%)6.35 × 10⁻²(37%)0.170
FAEPkg 1,4-DB eq5.07 × 10−2(33%)5.31 × 10⁻²(34%)5.21 × 10⁻²(33%)0.156
MAEPkg 1,4-DB eq1.35 × 102(25%)2.03 × 10²(38%)1.92 × 10²(36%)5.30 × 10²
TEPkg 1,4-DB eq8.44 × 10−4(63%)1.83 × 10⁻⁴(14%)3.12 × 10⁻⁴(23%)1.34 × 10⁻³
POPkg C2H4 eq4.32 × 10−5(6%)5.78 × 10⁻⁴(84%)7.06 × 10⁻⁵(10%)6.92 × 10⁻⁴
APkg SO2 eq2.04 × 10−3(46%)1.14 × 10⁻³(26%)1.27 × 10⁻³(28%)4.44 × 10⁻³
EPkg PO43− eq1.27 × 10−3(65%)3.65 × 10⁻⁴(19%)3.15 × 10⁻⁴(16%)1.95 × 10⁻³
Table 7. Allocation factors of the total potential environmental impacts of the soybean production, soybean crushing, and oil transesterification stages (Figure 4 and Table 6) between biodiesel and glycerol under different allocation criteria.
Allocation CriteriaBiodieselGlycerol
Economic (base)99.2%0.8%
Mass89.3%10.7%
Energy95.9%4.1%
No allocation100%0%
Table 8. Value ranges for variables in Figure 8.
VariableMinimumBaseMaximum
Gas Conversion to Heat Efficiency (%)609095
Feed Content [Requirement] (%)5080100
Load Factor (%)8090100
Loan Lend Time (y)51015
Electricity Cost ($·y−1)400060008000
Maintenance Cost (M$·y−1)0.010.050.025
Labour Cost (M$·y−1)0.090.120.141
CAPEX value (M$)0.40.61.20
Loan Interest Rate (%)2.5520
Table 9. Potential environmental impacts of 1 kg of 10 atm steam from glycerol-based bio-SNG (using an economic allocation criteria) and 1 kg of 10 atm conventional natural-gas based steam.
Impact CategoryUnit10 atm Steam from -Based Bio-SNG10 atm Conventional Steam From Natural gasMitigation Potential
ADPkg Sb eq3.47 × 10−81.25 × 10⁻⁹−2686%
APP-FFMJ0.2291.7687%
GWPkg CO2 eq2.20 × 10−21.03 × 10−179%
ODPkg CFC−11 eq2.37 × 10−98.71 × 10−973%
HPTkg 1,4-DB eq5.09 × 10−37.96 × 10−336%
FWAEPkg 1,4-DB eq5.64 × 10−33.03 × 10⁻³−86%
MAEPkg 1,4-DB eq18.711.6−61%
TEPkg 1,4-DB eq2.68 × 10−59.09 × 10⁻⁶−194%
POPkg C2H4 eq1.22 × 10−51.81 × 10−533%
APkg SO2 eq8.84 × 10−53.01 × 10−471%
EPkg PO4 eq4.99 × 10−51.75 × 10⁻⁵−185%

