Article

Modeling Vehicles to Grid as a Source of Distributed Frequency Regulation in Isolated Grids with Significant RES Penetration

by
Neofytos Neofytou
1,
Konstantinos Blazakis
1,
Yiannis Katsigiannis
2,* and
Georgios Stavrakakis
1
1
School of Electrical and Computer Engineering, Technical University of Crete, University Campus, GR-73100 Chania, Greece
2
Department of Environmental and Natural Resources Engineering, Technological Educational Institute of Crete, Romanou 3, GR-73100 Chania, Greece
*
Author to whom correspondence should be addressed.
Energies 2019, 12(4), 720; https://doi.org/10.3390/en12040720
Submission received: 15 January 2019 / Revised: 18 February 2019 / Accepted: 19 February 2019 / Published: 22 February 2019
(This article belongs to the Special Issue Alternative Sources of Energy Modeling and Automation)

Abstract

:
The rapid development of technology used in electric vehicles, and in particular their penetration in electricity networks, is a major challenge for the area of electric power systems. The utilization of battery capacity of the interconnected vehicles can bring significant benefits to the network via the Vehicle to Grid (V2G) operation. The V2G operation is a process that can provide primary frequency regulation services in the electric network by exploiting the total capacity of a fleet of electric vehicles. In this paper, the impact of the plug-in hybrid electric vehicles (PHEVs) in the primary frequency regulation is studied and the effects PHEVs cause in non-interconnected isolated power systems with significant renewable energy sources (RES) penetration. Also it is taken into consideration the requirements of users for charging their vehicles. The V2G operation can be performed either with fluctuations in charging power of vehicles, or by charging or discharging the battery. So an electric vehicle user can participate in V2G operation either during the loading of the vehicle to the charging station, or by connecting the vehicle in the charging station without any further demands to charge its battery. In this paper, the response of PHEVs with respect to the frequency fluctuations of the network is modeled and simulated. Additionally, by using the PowerWorld Simulator software, simulations of the isolated power system of Cyprus Island, including the current RES penetration are performed in order to demonstrate the effectiveness of V2G operation in its primary frequency regulation.

1. Introduction

Plug-in hybrid electric vehicles (PHEVs) have the ability to recharge their batteries with electricity from an off-board source (such as the electric utility grid). PHEVs as a new type of load and due to their large-scale integration in the power system will have a significant impact on power system operation and planning, especially in isolated power systems [1,2]. The increased load in power systems due to the charging of electric vehicles should be taken into account in the optimal operation of power systems as well as in investment planning. The major challenge for the area of electric power systems is the utilization of battery capacity of the interconnected vehicles during their charging in charging stations [3]. More precisely, PHEVs can act as small mobile energy storage units and at the same time as controllable loads [4]. An integration of PHEVs in the power grid with appropriate communications and information systems can provide ancillary services to the power grid [5]. Frequency regulation is an important ancillary service that PHEVs can provide because the time duration of this service is short (i.e., a few minutes) and moreover can provide great economic rewards to the owners of vehicles especially in isolated power grids with significant RES penetration [6,7]. With V2G operation PHEVs can participate in electricity balancing markets to provide regulation services [8,9]. The frequency regulation service can be offered by vehicle-to-grid (V2G) operation, which achieves bidirectional power flow between PHEVs and a power grid [10]. When the system frequency goes downwards, PHEVs acting as power producers can prevent further frequency drop. On the other hand, PHEVs could absorb the power from the grid to prevent from a further increase in frequency [11,12]. In this paper, we focus as a case study on the V2G control participating in Primary Frequency Control (PFC) at the isolated power system of Cyprus. PHEVs can participate in PFC because the frequency signal is available at any location of a power system where a PHEV is connected. Except for frequency droop control, V2G control strategies (centralized and decentralized V2G control for PFC) include both maintaining the BSOC (Battery Sate of Charge) and achieving charging demand. When the remaining battery energy is low, the customer has to charge the EV to a higher BSOC level. On the other hand, if the residual BSOC is sufficiently high in the day time, the EV customer is generally willing to maintain the BSOC and recharge the EV in the night considering the low off-peak electricity price [2,13]. In our study, we chose a simple V2G strategy that includes only the droop control and the scheduled charging power of PHEV if the driver wants to charge more the vehicle. The actually charging duration is estimated on the basis of the actual plug-in duration. The optimal driving range of PHEVs to achieve the minimum social cost is examined in Reference [14], where the electric driving range is found to be sensitive to factors, such as the battery pack cost and the gasoline price. These aspects are out of the scope of the present paper, thus they are not taken into consideration here.
The main contribution of this paper is the modeling and simulation of the dynamic operation of the isolated insular power system of Cyprus, which is the largest island in Eastern Mediterranean Sea, with significant RES penetration (mainly from wind turbines), based on real data. These data include mainly load demand, wind turbine production, conventional units technical data, as well as data from system frequency response in real disturbances. In this study it is shown that the frequency droop control that the significant PHEVs integration can offer is able to improve remarkably the primary frequency regulation of the Cypriot power system, which is more sensitive to dynamic variations compared to the large interconnected ones.
This paper is organized as follows. In Section 2, the framework of V2G operation to join in the PFC of a power grid is presented. The V2G control that we chose to achieve frequency regulation, as well as scheduled charging is addressed in Section 3. In Section 4, the PHEVs V2G control block for frequency regulation is presented and discussed. Simulations and discussions that illustrate the performances of the PHEVs V2G control block and V2G control are shown in Section 5. Section 6 discusses the key features of the isolated power system of Cyprus. Section 7 contains a brief description of the adopted wind turbine simulation model. In Section 8 the overall simulation model of the isolated Cyprus Island power system, including the significant RES penetration is presented, and the frequency response is simulated and verified under a real scenario that is related to a conventional power unit loss. Section 9 presents the PHEVs fleet which is integrated in the power system of Cyprus, as well as the simulation results of frequency response with and without V2G grid operation for four cases that are related with a sharp increase or decrease of power system load during a peak load day. Moreover, in this section the BSOC of PHEVs and the exchange power from the power grid side is presented for each case. Finally, the conclusions of this paper are presented in Section 10.

2. System Framework of V2G Operation

Figure 1 illustrates the framework of V2G operation for PHEVs to join in the PFC of a power system. As can be seen, an aggregator is needed for the participation of PHEVs in PFC. The V2G aggregator monitors the fleet of vehicles, which are integrated into the power grid. Actually creates an aggregate profile of a virtual power plant, which depends on the number of vehicles that are connected and capable for V2G, every hour of the day. In addition, the power of the virtual power plant depends on the available power and energy that can provide the fleet of vehicles. The aggregator can receive signals/commands by the transmission system operator and then forward them to the fleet of vehicles, according to the power grid requirements.
In a market environment, aggregator should estimate the regulation capability of the PHEVs fleet and choose an optimal bidding strategy. After market clearing, the aggregator will inform the chosen PHEVs to participate in the PFC [15,16,17].
PHEVs are connected to the power grid with electric vehicle supply equipment through which bidirectional energy exchange can be achieved. The V2G controller makes decisions based on real-time frequency and BSOC sent from the battery management system (BMS), respectively. It is considered that V2G controller has an embedded frequency detection block which monitors the system frequency in real time. The real-time command is produced and sent from the V2G controller to the charger/discharger block. The charger/discharger is a device that controls the power interchange between the power grid and the PHEV battery to suppress frequency fluctuation. Simultaneously undertakes to achieve charging demand.
The battery management system (BMS) monitors the BSOC and health of the battery. Also, provides an interface between the battery and the rest of the vehicle. With BMS the driver can define some parameters which are associated with the desired SOC, the charging time of the battery and the length of the next trip. Furthermore, the system or the driver of the vehicle must be able to define the maximum discharge depth of the battery [19,20,21].

3. V2G Control Method for PFC

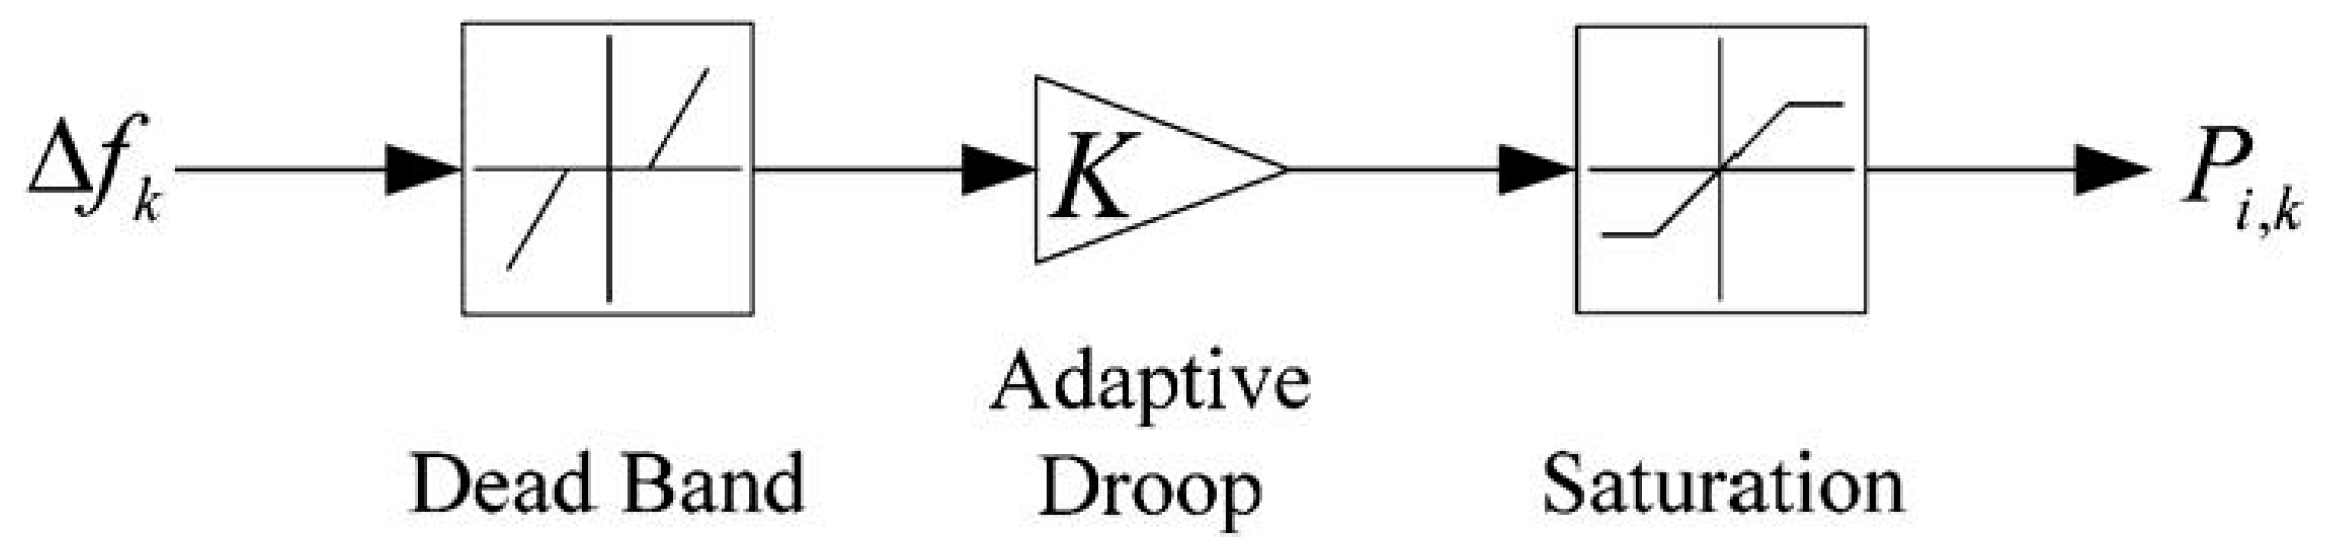
3.1. Description of V2G Control Method

As illustrated in Figure 1, PHEVs can act as small mobile energy storage units to take part in PFC. In addition, the PHEVs charging demand must be achieved simultaneously. Therefore, frequency regulation and charging demand are two important concerns that need to be handled in the V2G control process. When a PHEV gets to the parking place, the customer will check if the residual BSOC is sufficient for the next trip. If the battery energy at the time of plug-in is sufficient, the PHEV customer usually wants to maintain the residual battery energy. Customers are more willing to charge their vehicles at home, because the electricity price is low off at night. On the other hand if battery energy at the time of plug-in is not sufficient for the next trip, the PHEV customer has to charge the EV to a higher SOC level. Therefore, the requirements from the EV customers can be generally categorized into two types: Maintaining BSOC and achieving charging demand.
In Reference [2], a Decentralized V2G Control (DVC) for PFC is proposed for the two types of PHEVs customers. The proposed DVC method mainly includes Battery SOC Holder (BSH) and Charging with Frequency Regulation (CFR) for PHEVs to participate in PFC. In this paper we use these two types of V2G control, with the exception that we use a constant value that represents the frequency deviation signal. With these assumptions, if the frequency response has the form as in Figure 2 then the constant value that represents the frequency deviation signal is the maximum deviation value, from the nominal frequency. We consider that, the transmission system operator sends commands to the aggregator, according to this frequency error value. In this case, PHEVs must not respond, until the maximum frequency deviation value has reached. Also, if the frequency deviation does not exist or is negligible then PHEVs must not respond.

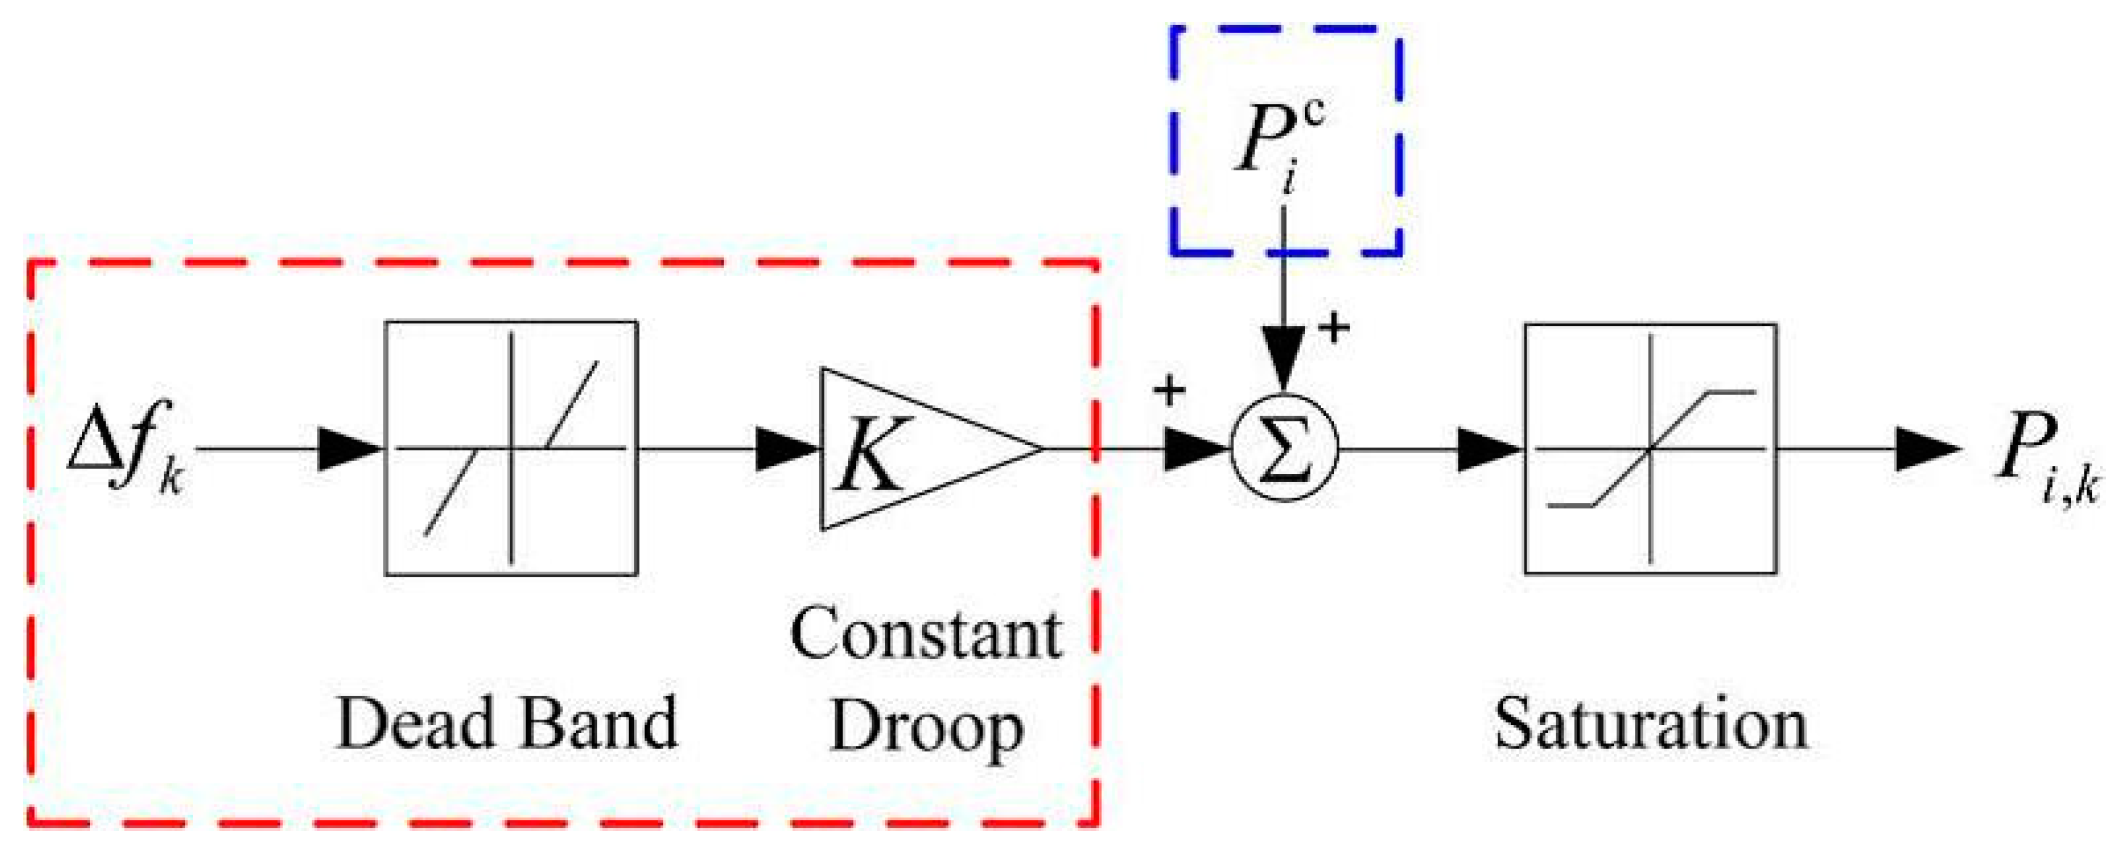
3.2. V2G Control to Maintain the Residual Battery Energy

For those PHEVs that need to maintain their SOC levels while joining in PFC, a specific control method is needed to be designed. The BSH which is proposed in Reference [2] is illustrated in Figure 3. We chose the same control method, but with non-adaptive droop and a constant value for frequency error signal. Actually, after plug-out time, the SOC level of PHEV will not be the same as the initial SOC level at the time of plug-in, but very close to it.
The PHEV battery can absorb/inject power from/to a power grid, according to the frequency deviation value and the constant droop K (kW/Hz). For this purpose, a saturation block with upper and lower limits must be included. In addition, a dead-band is added to reduce the charging/discharging operations on the PHEV battery. When the system frequency deviation is out of the predefined dead-band, the power is exchanged between the PHEV and the power grid to suppress frequency fluctuation.

3.3. V2G Control to Achieve Charging Demand

Necessary energy must be supplied to an EV if the residual BSOC is not sufficient for the next trip or the PHEV owner wants to charge the battery overnight. In Reference [2], CFR is proposed to meet charging demand and suppress frequency deviation at the same time. Considering the scheduled charging power, the CFR is presented in Figure 4. As in Section 3.2, we chose the same control method, but with non-adaptive droop and a constant value for frequency error signal. When frequency deviation lies in the predefined dead-band, just scheduled charging power works. Once frequency deviation is out of the dead-band, both scheduled charging power and frequency droop control will work.
The scheduled charging power of a PHEV can be estimated by the following form as a constant:
P i c = ( S O C i e S O C i i n ) · E i r / ( t i o u t t i i n ) ,
where P i c (in kW) is the constant scheduled charging power at the battery side of the ith PHEV for achieving the charging demand, S O C i e is the expected state of charge of the ith PHEV battery at plug-out time, S O C i i n is the initial state of charge of the ith EV battery at the time of plug-in, t i o u t (in hours) is the plug-out time of the ith PHEV, t i i n is the plug-in time of the ith PHEV, and E i r (in kWh) is the rated capacity of the the ith PHEV battery.
The plug-out time, as well as the expected SOC should be provided by the PHEV customer in advance. It should be noted that an EV will not participate in PFC when the scheduled charging power P i c is equal to or larger than the maximum charging power.

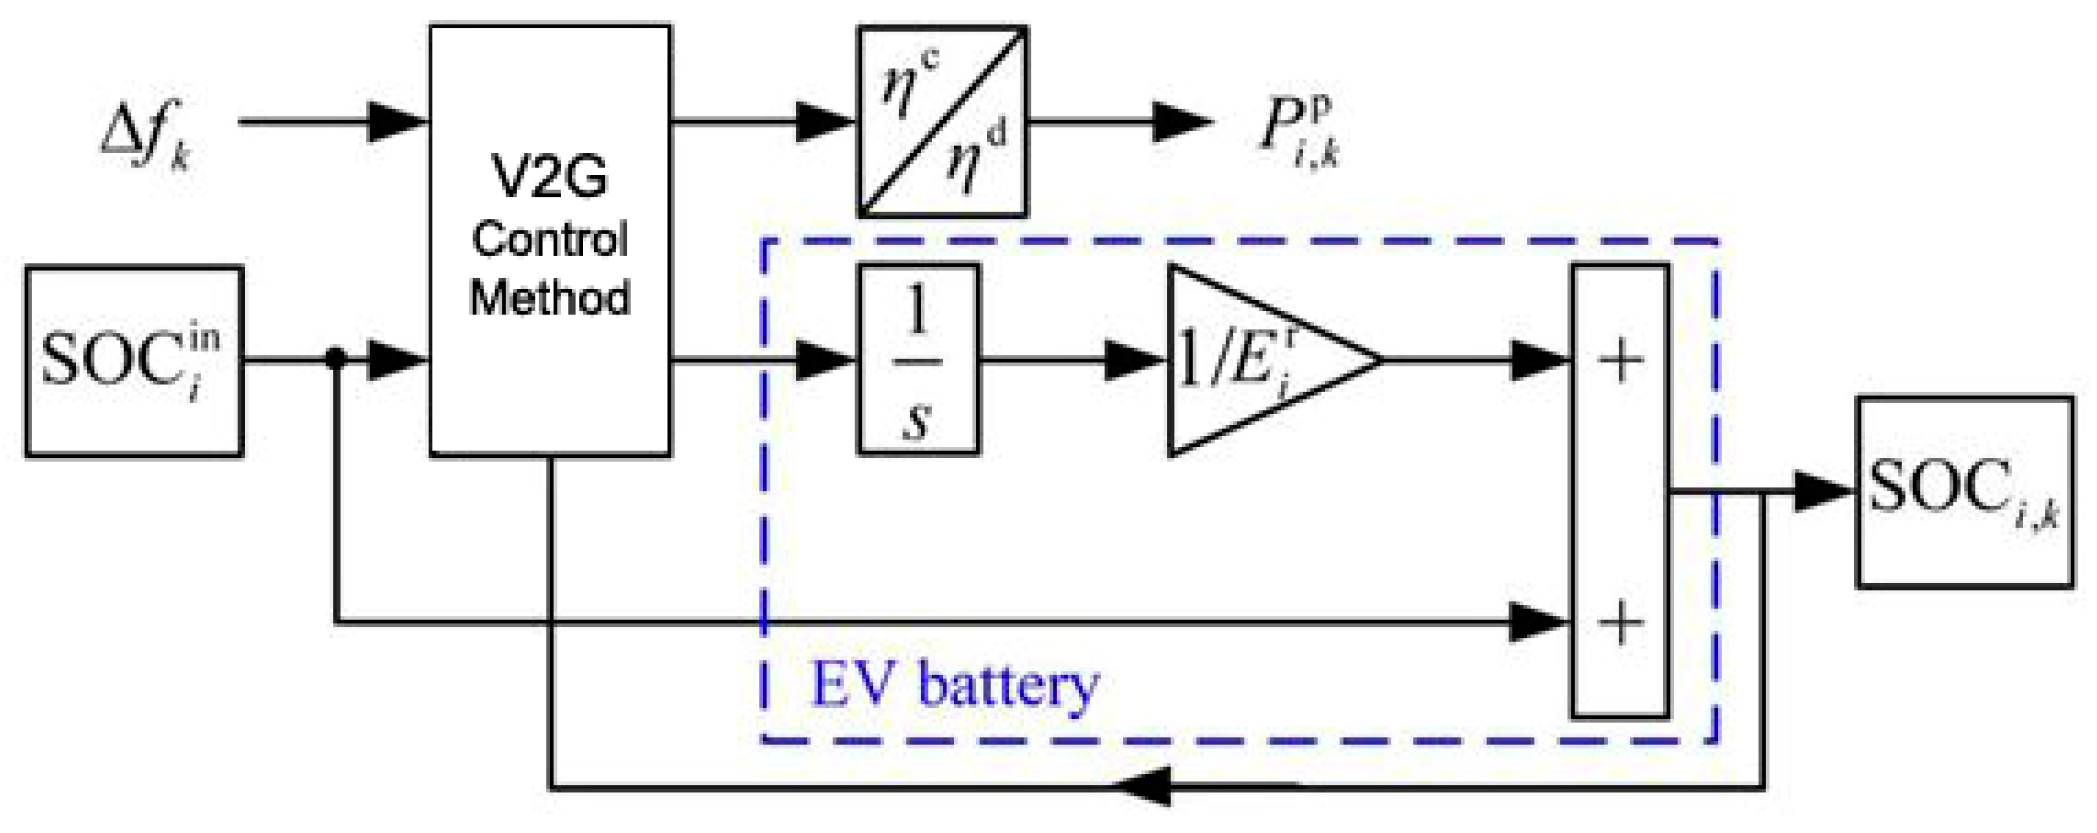
4. PHEVs with a Simplified V2G Control Block

The simulation model of PHEV is the model proposed in Reference [2], but with a simplified V2G control method presented for the first time here. In PHEV model, real-time BSOC is built to acquire the dynamic change of the battery energy during the V2G operation. As it is shown in Figure 5, the aggregated battery output is controlled based on the input signal Δ f k which represents the frequency deviation at time k. When the control method is applied the input signal converted into power (kW). The estimated power at the connecting point of a charging/discharging device from/to the power grid has the following form:
P i , k p = { P i , k η c , ( P i , k 0 ) P i , k · η d , ( P i , k < 0 ) .
where η c is charging efficiency of the PHEVs and where η d is the discharging efficiency of the PHEVs, P i , k (in kW) is the V2G power at the battery side of the ith EV at time k, and P i , k p (in kW) is the V2G power at the power grid side of the ith EV at time k.
The energy variation of the ith PHEV battery during the charging/discharging process can be estimated by the integration of the V2G power (in kW) at the battery side at time period [0–k] as [22,23,24]:
Δ E i = 0 k P i ( k ) d k .
The BSOC usually expressed as a percentage of the rated capacity of the battery, is defined as the available capacity of the battery. The BSOC at time k has the following form:
S O C i , k = S O C i i n + 1 E i r Δ E i .
where S O C i , k is the state of charge of the ith PHEV battery at time k, and S O C i i n is the initial state of charge of the ith PHEV battery at the time of plug-in.

5. Test of PHEV Block with V2G Control Application

5.1. Simulation Parameters Values

The PHEV model was implemented by writing code in the Matlab environment. The code is initialized with some parameters which are related to PHEVs and V2G control. The simulation parameters are listed in Table 1. The module of V2G control method was implemented as a function, which performs the operation of the V2G control system. The input signal is the frequency of the power system and is delayed considering the V2G activation and communication delays. The frequency deviation signal is estimated by the code. Afterwards the operation which is described in Section 4 is performed.

5.2. Simulation Scenarios and Discussion of Results

In the first two simulation scenarios, an input frequency signal with negative frequency deviation is considered. For the other simulation scenarios, an input signal with a positive frequency deviation is considered. The two input signals are illustrated in Figure 6 and Figure 7. In simulation scenarios in which users want to maintain their BSOC level, the simulation time is 80 s in order to study the response of charging power and BSOC of PHEVs, before and after the frequency deviation. In simulation scenarios in which users want to charge their vehicles to a higher BSOC level, the simulation time is three hours (10,800 s).
In the first case, PHEVs users need to increase their BSOC level from 50% to 80%. Figure 8 shows the real time SOC and the total V2G power at the power grid side. PHEVs are charging during simulation time. In the 29th second the charging rate is reduced, because a part of charging power is used for power grid needs. Therefore, the scheduled charging power is reduced from 52.17 MW to 32.66 MW. In the 41st second both scheduled charging power and charging rate are reset to their initial values, because the frequency dead band is activated.
In the second case, PHEVs users want to maintain their BSOC level to 80%. As shown in Figure 9, in the 29th second the BSOC of vehicles are reduced, because a part of their stored energy is used for power grid needs. In the 41st second the PHEVs discharging is interrupted, because the frequency dead band is activated. In Figure 9 the initial BSOC of PHEVs is 80% and after the simulation time, the BSOC has reduced by 0.02% of the initial state of charge. Users cannot realize this minimal reduction of BSOC. Therefore, we consider that the state of charge is maintained at its initial level. PHEVs batteries are not discharged significantly because the maximum V2G droop has a small value. If the maximum V2G droop has a large value, the PHEVs batteries will be discharged significantly and the BSOC, after plug-out time, will not approximate the initial BSOC.
In the next two cases, we consider that users have the same desires as the first and second case. For input signal, we set the frequency response that is illustrated in Figure 7. As shown in Figure 10 the charging rate is increased in the 29th second, because the PHEVs absorb more energy from the power grid, in order to reduce the frequency deviation. The scheduled charging power of PHEVs is increased between the 29th and 41st second and after that is reset to its initial value, because the frequency dead band is activated.
In Figure 11, the PHEVs charge their batteries in order to reset the frequency to 50 Hz. When the frequency deviation is negligible, the frequency dead band is activated and the PHEVs do not react with the power grid. After the simulation time, the BSOC has increased by 0.02% of the initial state of charge. Therefore, we consider that the state of charge is maintained at its initial level.

6. Presentation of the Isolated Power System of Cyprus

Cyprus Island has a small isolated power network running at 50 Hz. The generation system consists of three power stations located at the coast side of the island. The first power station is located in Vasilikos and is composed by 3 × 130 MW Steam Turbine Units (ST), 2 × 220 MW Combined Cycle Gas Turbine Units (CCGT) and one 37.5 MW Gas Turbine (GT) unit. The second power station is located in Dhekelia and consists of 6 × 60 MW ST Units and one Internal Combustion Engine (ICE) of 100 MW. The third power station is located in Moni and consists of 4 × 37.5 MW GT Units. Thus, today the total conventional installed capacity is 1477.5 MW [25]. In addition, renewable energy sources are included in the generation system of Cyprus. Six wind parks with a total installed capacity of 157.5 MW, photovoltaic plants with 77 MW installed capacity and a biomass plant of 10 MW installed capacity, are connected to the Cyprus Island power system [26].
The isolated transmission system of Cyprus is operated at 132 kV and interconnects the major cities and big loads with the three power stations of the island. The interconnections are achieved by using overhead and underground cables. For the year 2017, the maximum demand of the Cyprus Island was recorded to be 1108 MW (during summer) and the minimum demand 310 MW was recorded (during spring) [27].

7. Wind Turbines Simulation Model

For the simulation of wind turbines in Cyprus Island, a Type 2 variable rotor resistance induction generator model was considered. This model consists of the following components (Figure 12): (a) Induction generator, (b) wind turbine, (c) pseudo governor, and (d) rotor resistance controller.
For the generator, a standard induction generator is used excluding its inertial equation. For the wind turbine, the inertial model of the wind turbine-generator is used, in which the stiffness constant is a function of the first shaft torsional resonant frequency. The pseudo governor mode uses two inputs (rotor speed deviation and generator electrical power), whereas its output is the mechanical power on the rotor blade side. The adjustment of the rotor resistance is implemented via the rotor resistance controller. This controller has as inputs the rotor speed and generator electrical power, while the output is the portion of the available rotor resistance that has to be added to the rotor resistance included in the generator module. For more information about the above mentioned models, the reader is referred to [26]. Thus, the installed asynchronous generator wind turbines in the Cypriot power system cannot contribute to virtual inertia ancillary services, which is possible only with modern variable speed wind turbines interfaced through back-to-back converters, completely decoupling their inertia from the grid [29].

8. Simulation Model of the Cyprus Island Isolated Power System Incorporating RES

8.1. Description of the Developed Simulation Model

The simulation model of the isolated power system of Cyprus Island was designed in the PowerWorld Simulator environment. In Figure 13, the one-line diagram simulation model is presented. As shown in the picture, the power units, the RES units and the load of the power system are included in the model.
The model includes a total of twelve buses. Three buses are used to represent the power stations of Cyprus, and each of them includes the power units of the station. The wind farms of Cyprus Island are simulated by using a bus which includes an equivalent wind generator that represents the total wind power production. The biomass generator of 10 MW is not considered in our analysis because its capacity (10 MW) is negligible compared to the total capacity of conventional generation units (1477.5 MW). Regarding photovoltaics, their effect to frequency stability is also negligible, as their current annual penetration in total electricity production is not significant (less than 3%). It has been shown that the effect of photovoltaics at the frequency of the power system is negligible, even for penetrations up to the level of 20% [30]. This penetration level of photovoltaics could be surpassed marginally only in the case that all photovoltaics operate at their peak power and simultaneously the load demand presents its minimum annual value, which is not possible to happen in the current operational status of the Cyprus Island power system.
The total power generation is transferred through transmission lines with a nominal transfer power of 600 MVA. In addition, two parallel transmission lines transfer the total power generation to a bus which includes the total system load. This load represents the load of the system and the losses of transmission lines. The two parallel transmission lines have a nominal transfer power of 1500 MVA. A capacitor is added in order to maintain the reactive power balance on the bus. The load of PHEVs is not considered at this bus.
As shown in Figure 13, in the simulation model there are even five load buses that represent the PHEVs of each city. Each load represents the aggregate load of the charging stations of the city. In this study the internal operation of the charging stations is considered as “active” loads, which can change depending on the signals that they receive from the aggregator. The load buses are connected via transmission lines with negligible resistance in the bus named “System Load”.
In this paper the voltage stability of the power system is not studied. All buses of the model have a nominal voltage of 132 kV which is the nominal voltage of the power transmission system of Cyprus Island. Also, a slack bus is used to balance the active power and reactive power in the system while performing a power flow study. The slack bus is used in power systems to provide for system losses by emitting or absorbing active and/or reactive power to and from the system. If the system load is less than the generation, then the conventional generators reduce their production. On the other hand, if the system load is bigger than the generation, then the conventional generators increase their production.
For each conventional generator of the simulation model, the GENROU machine model is used, which provides a very good approximation of the dynamic behavior of synchronous generators. In addition, the exciter model IEEET1 of IEEE is added in each synchronous generator. For the STs the TGOV1 governor model is used, that is designed to simulate the operation of a simple governor of an ST. For the ICE, DEGOV1 model is used, whereas tor the GT engines the governor model GAST_GE is used.

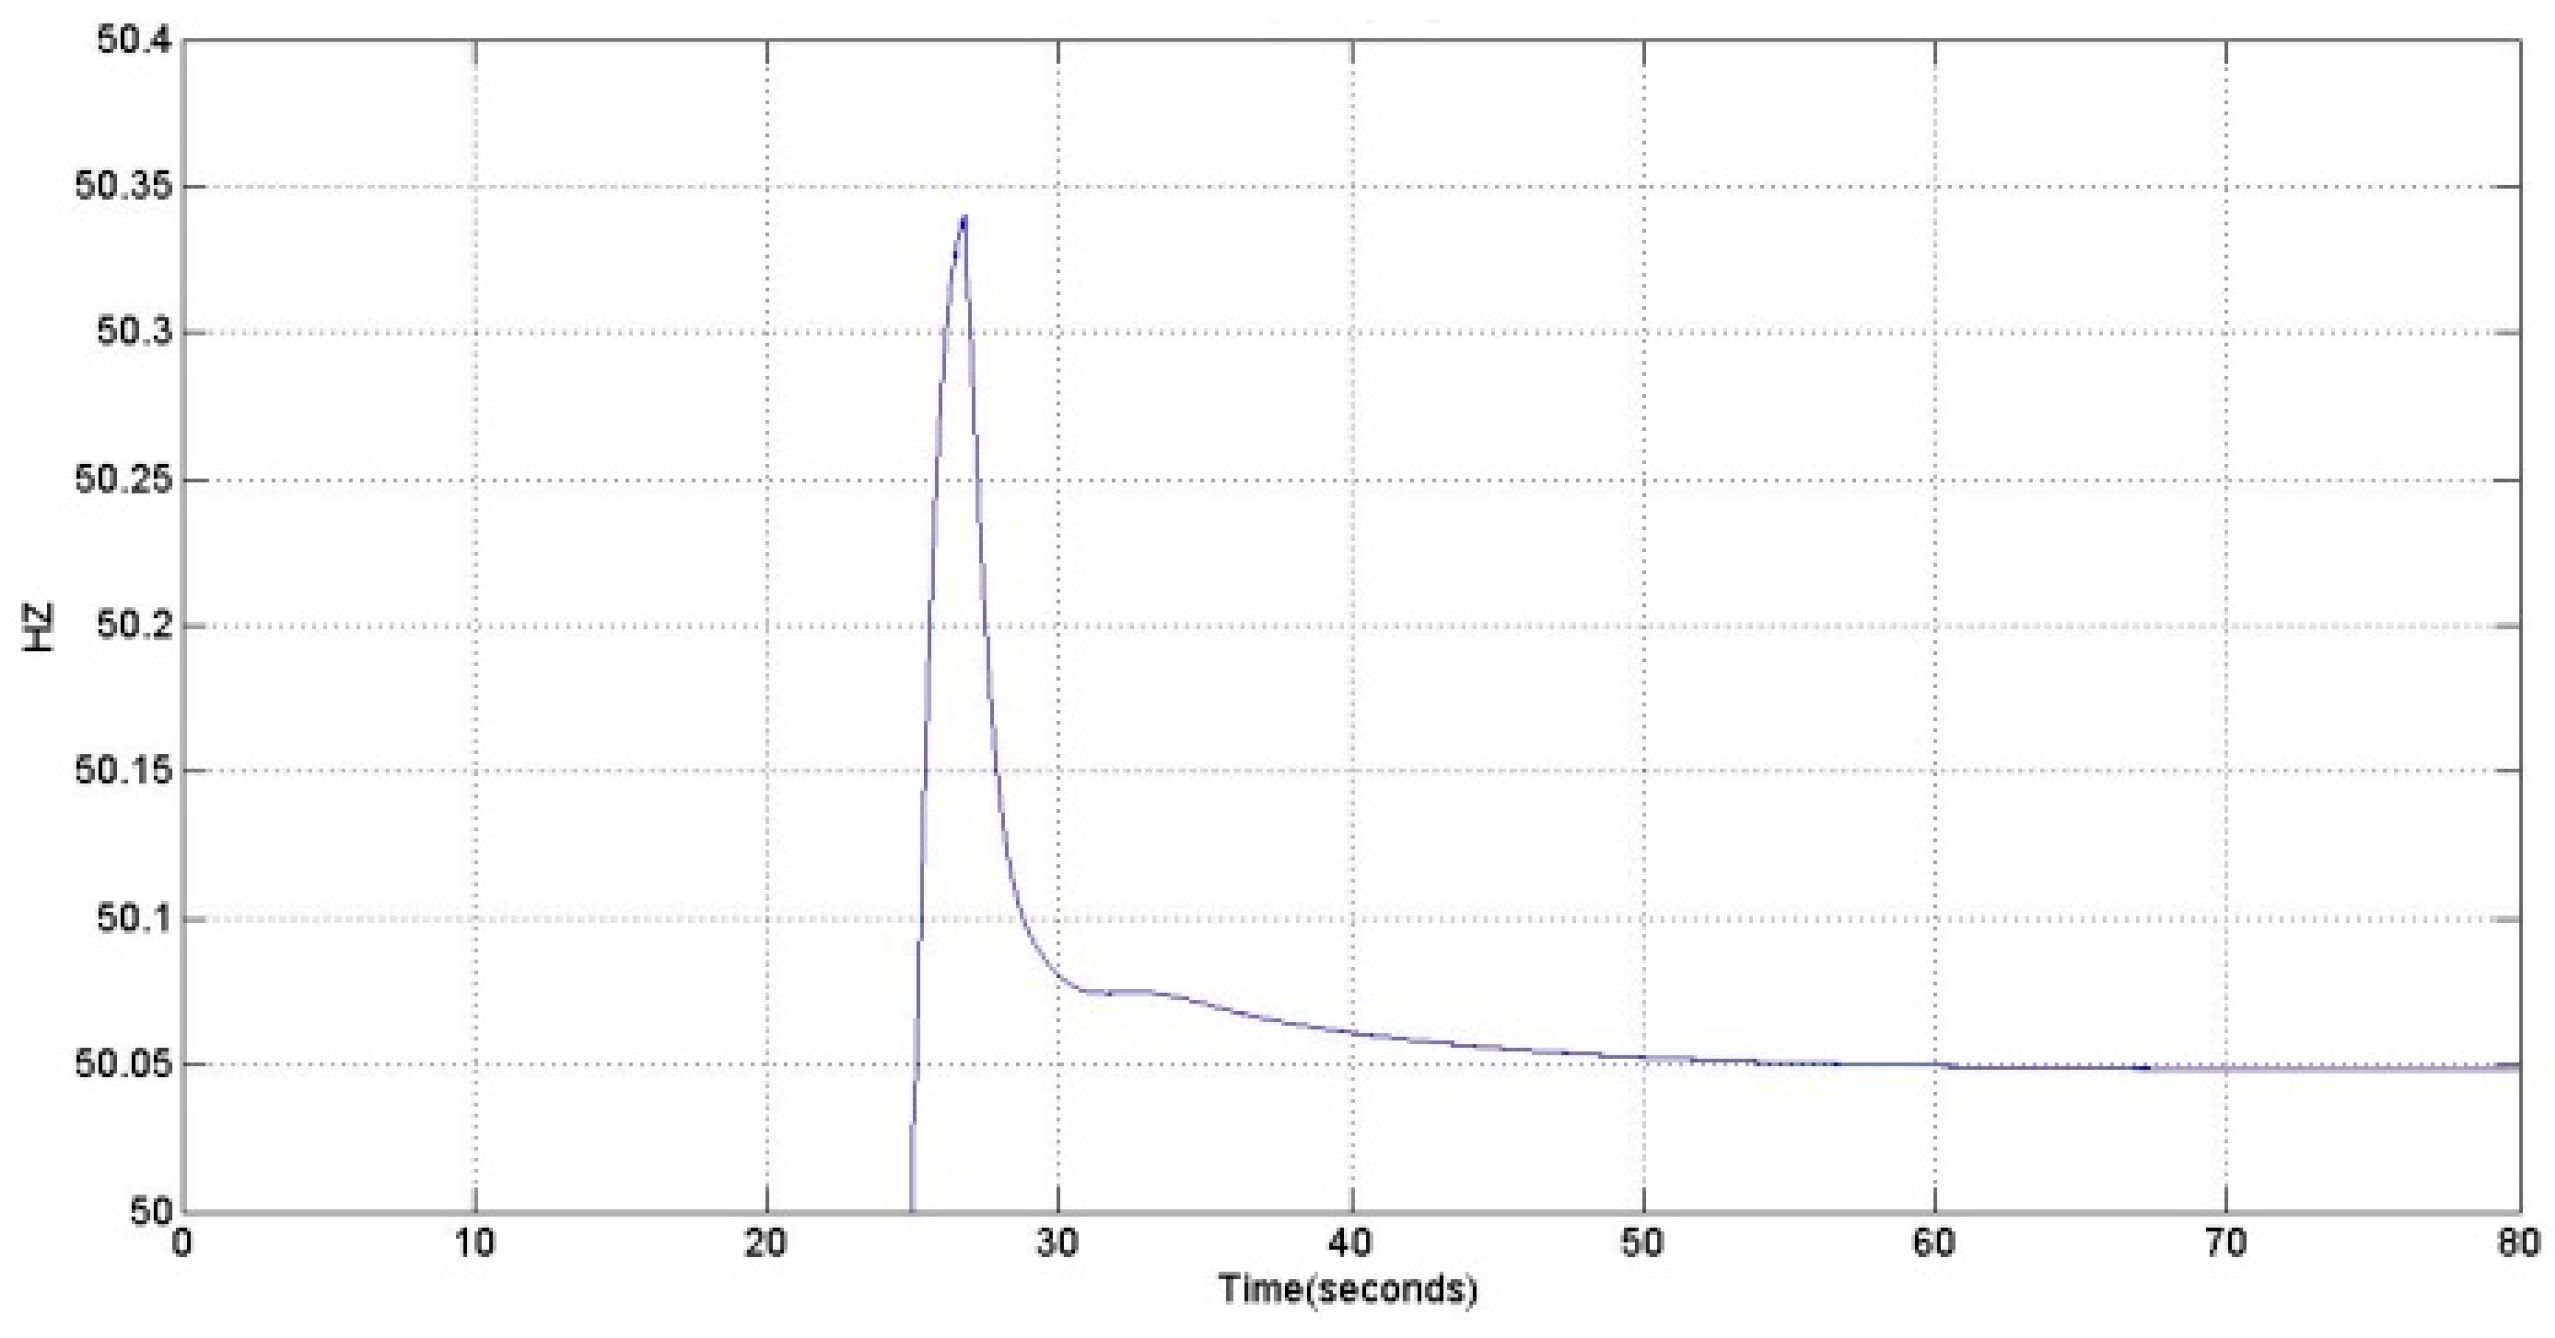
8.2. Simulation of the Cyprus Island Power System Dynamic Frequency Response

In order to simulate the frequency response of the isolated power system of Cyprus Island, it is necessary to set the parameters of the generators which affect the frequency response of the system. The most important parameters that are needed to set are the following: The inertia of the generator (in the GENROU model denoted by H), the droop of generator R, the gain K of governor control system and the parameters related to the time delay for the shifting of regulators speed, in the case of change of the frequency of the network. These parameters are called time delays and are given in Reference [31].
In Figure 14 is illustrated the simulated and the real frequency response of the system, when a steam turbine is lost. As is shown, the time period that the frequency drops down from its nominal value is approximated very closely. In addition, the frequency is recovered closely to the nominal value inside the real time bounds. As seen in Figure 14, in both curves frequency is not recovered to the nominal value, but very closely of it. This happens because these curves show the frequency value after the PFC, but not after the secondary frequency regulation. The generators of PowerWorld Simulator are able to simulate only the PFC. In the real network, the units which perform the secondary regulation, undertake to restore the frequency to the nominal value. Table 2 includes the load of each unit and the total load of the system at the time where the unit lost. The load of PHEVs is not considered in the system for this simulation.

9. Simulations with V2G Operation in the Power Grid

9.1. PHEVs Fleet Estimation

In 2017, the total registered vehicles in Cyprus were 794,464. In order to get an intuitive view about the PHEVs as energy sources, a total number that is equal to 5% of the registered vehicles (39,724 vehicles) is considered. Furthermore, we considered that all PHEVs have a battery with a nominal capacity of 22 kWh. Assuming that all PHEVs are fully charged once a day and that the 80% of their energy potential is available, then PHEVs represent a total energy storage capacity equal to:
39,724 PHEVs × 22 kWh × 0.8 = 699.14 MWh.
By using the Matlab and with help of the function “randsample”, we distributed the PHEVs of every city in four groups depending on the users SOC requirements which determined randomly. With this way we created a fleet of PHEVs which is presented in Table 3.

9.2. Simulation Results

By using the model of Figure 13 in PowerWorld Simulator along with the V2G control system, a number of simulations were performed, in order to study the V2G operation in PFC. For each simulation scenario the real load data for each unit were used, which were obtained from the TSO of Cyprus Island in order to verify the correct operation of the power system. In addition, we initially add to the system the total load of PHEVs for each one of the five Cyprus towns. Table 3 presents this load, which is divided by the charging efficiency of the vehicles’ batteries (148.581 MW/0.92 ≈ 162 MW). Under these circumstances, the system was brought to blackout. This happened because the total production of the units was not enough to undertake the load of vehicles. The result of this action proves that if a large proportion of users try to recharge their vehicles, at a time during the evening, the system will not be able to satisfy the PHEVs demand. To avoid such a serious incident in the power network, forecasting of the PHEVs load should be implemented first. In this study, we should put into operation more conventional generators in order to face this problem. In a real power system, the load distribution in generation units is based on the economic cost of units we used a function from Reference [32], which returns the optimal economical load distribution of the units.
In the following paragraphs, two of the simulations scenarios of this study are presented. In each scenario a table of results is presented, which includes the generation units that are operating and the system load. By joining more units to the power system the operating conditions are changed. For this reason, in the following simulations, we considered that initially the PHEVs are in total a common load on the system, and subsequently we considered that PHEVs are able to perform the V2G operation.
Scenario 1: In this scenario is simulated the frequency response of the system, when the system load is increased sharply. At the time t = 600 seconds, the load at the bus system load is increased by 10%. Initially the load was 1005 MW + 35 MVar and after the fluctuation the load became 1105.5 MW + 35 MVar. The load at the bus System Load was already high before the fluctuation. So we can assume that it represents a moment of a day during summer, where there is a high consumption of electricity. Also, the positive load change may represent a time when most people turn on the air condition systems, as usually happens during the summer noon. Table 4 includes the load of each unit and the total load of the system with and without penetration of PHEVs to the grid. Figure 15 shows the frequency response of the system without V2G operation. As can be seen, the frequency is stabilized around 49.82 Hz after the PFC. In Figure 16, the frequency response, including V2G operation is presented, and the frequency stabilization is improved to 49.9 Hz. As a result, PHEVs are proven to have a positive effect in the PFC of the power grid. In the case of V2G operation, a small frequency vibration due to the voltage vibrations is also observed. The voltage vibrations, are caused by the reaction of the PHEVs with the grid at time t = 611 seconds.
In Figure 17, the BSOC of Nicosia’s PHEVs is illustrated. The PHEVs batteries are charged all the time of simulation. At time t = 611 seconds the charging rate is decreased in order to support the PFC of the power grid.
Figure 18 shows the charging power of Nicosia’s PHEVs from the grid side. The charging power of each group of vehicles is reduced at time t = 611 seconds and is maintained at a lower level than the initial power, during the PFC of the power grid. When the frequency of the power grid is returned to its nominal value, the charge rate and the charging power of PHEVs will return to their initial values. However this case cannot be studied in this paper because PowerWorld Simulator does not simulate the Secondary Frequency Regulation.
The considered power grid contains not only PHEVs that their owners desire to charge their batteries, but also PHEVs that their owners desire to maintain their BSOC and to participate in V2G operation simultaneously. In order to study this case, the PHEVs fleet that presented in Table 3 was increased by the addition of 25,000 PHEVs that they are connected into the power grid, and they simultaneously desire to maintain their initial BSOC. Table 5 shows the fleet distribution of these 25,000 PHEVs.
The total load of the system is not changed with the addition of 25,000 PHEVs because the drivers of vehicles, don’t desire to charge their cars. So, the 25,000 PHEVs can be considered as backup energy storage units that are connected to power grid. The scenario was implemented with the same load at the System Load bus and at the time t = 600 seconds increased by 10%. The frequency response with V2G operation from the new fleet of PHEVs is presented in Figure 19. As we can see, the frequency is stabilized around 49.95 Hz after the PFC, which is very close to its nominal value. This has happened because the V2G operation was strengthened by the 25,000 PHEVs, which acted as emergency power sources at the time of fluctuation. In this way, the work of the secondary frequency control becomes even easier. A small frequency vibration is observed due to the voltage vibrations.
In Figure 20, are illustrated the BSOC and the transmitted power to the grid from Nicosia’s PHEVs, which desire to maintained their BSOC to initial level. PHEVs are discharged at the time of fluctuation in order to participate in PFC of the power grid. The discharging rate is the same for all PHEVs because the gain K (kW/Hz) remains the same for all vehicle groups. The BSOC of each vehicle was reduced approximately by 0.13%, which is negligible. This means that the driver of PHEV cannot perceive this minimum discharge of the battery.
At time t = 611 seconds, PHEV batteries are discharged in order to support the power grid. PHEVs discharge their batteries until the frequency stabilized in a constant value. The amount of power which is provided to the power grid from each group of PHEVs depends on the number of vehicles. In addition, the discharge capacity of each vehicle is considered the same for all vehicles, since all vehicles act based on the V2G droop K (kW/Hz) which is the same for all vehicles.
Scenario 2: In this scenario is simulated the frequency response of the system, when the system load is decreased sharply. At the time t = 600 seconds, the load at the System Load bus is decreased by 10%. Initially the load was 1005 MW + 35 MVar and after the fluctuation the load became 904.5 MW + 35 MVar. The total load of the system with and without penetration of PHEVs to the grid is the same as scenario 1. Figure 21 shows the frequency response of the system without V2G operation. As can be seen, the frequency is stabilized around 50.17 Hz after the PFC. In Figure 22, the frequency response, including V2G operation is presented, and the frequency stabilization is improved to 50.11 Hz, which proves again the positive effect in of PHEVs in PFC of the network. In the case of V2G operation, we observe a small frequency vibration due to the voltage vibrations. The voltage vibrations are caused by the reaction of the PHEVs with the grid at time t = 611 seconds.
In Figure 23 is illustrated the BSOC of Limassol’s PHEVs. The PHEVs batteries are charged all the time of simulation. At time t = 611 seconds the charging rate is increased in order to support the PFC of the power grid.
Figure 24 shows the charging power of Limassol’s PHEVs from the grid side. The charging power of each group of vehicles is increased at time t = 611 seconds and is maintained at a higher level than the initial power, during the PFC of the power grid. When the frequency of the power grid is returned to its nominal value, then the charge rate and the charging power of PHEVs will return to their initial values.
As mentioned in scenario 1, in order to study this case, we increased the PHEVs fleet that by addition of 25,000 PHEVs that they are connected into the power grid and desire to maintain their initial BSOC. The frequency response with V2G operation from the new fleet of PHEVs is presented in Figure 25. As can be seen, the frequency is stabilized around 50.07 Hz after the PFC, which is very close to its nominal value. This has happened because the V2G operation was strengthened by the 25,000 PHEVs addition, which acted as emergency power sources at the time of fluctuation. In this way, the operation of the secondary frequency control becomes even easier. A small frequency vibration is observed due to the voltage vibrations.
In Figure 26, the BSOCs from Limassol’s PHEVs are illustrated. PHEVs are charged at the time of fluctuation in order to participate in PFC of the power grid. The charging rate is same for all PHEVs because the gain K (kW/Hz) remains the same for all vehicle groups. The BSOC of each vehicle was increased approximately by 0.082% of the nominal capacity of its battery, so the change in BSOC of vehicles is negligible. This means that the driver of PHEV cannot perceive this minimum charge of the battery. At time t = 611 seconds, PHEV batteries are charged in order to support the power grid. PHEVs charge their batteries until the frequency stabilized in a constant value. All vehicles act based on the V2G droop K (kW/Hz) which is considered the same for all vehicles. Figure 27 shows the charging power for the additional fleet in Limassol from the grid side for the four PHEVs groups.
It has to be noticed that in the above analysis was considered that all plug-in electric vehicles that were used are PHEVs. However, the category of plug-in electric vehicles includes also battery electric vehicles (BEVs). The diversity of travel demands of different drivers in different days and its influence on designing a proper battery capacity for BEVs are examined in Reference [33]. In the present paper, the impact of the PHEVs fleet as an ancillary system is considered globally and only during the periods that PHEVs are connected to the electricity grid (see Section 9), thus a typical battery capacity is considered for each vehicle, given that is impossible to take into account in a global analysis as the above, proper battery design for each individual vehicle based on the diversity of daily vehicle miles. Additionally, it has to be emphasized that in our study BEVs were not considered as a realistic alternative in the prompt and distant future, because the necessary infrastructure is not envisaged to be available in the Cyprus Island promptly.

10. Conclusions

In this paper, we focused on vehicle to grid (V2G) operation, as well as in the significant benefits by the use of plug-in hybrid electric vehicles (PHEVs) as distributed frequency regulation sources in isolated power systems with significant RES penetration. With the use of appropriate V2G control, the frequency deviation of the system can be suppressed while charging demand is achieved simultaneously. This can be achieved by using the capacity and the stored energy from the batteries of PHEVs. A simple PHEV model was developed in Matlab in order to study this operation and its effects. Moreover, a number of simulations of the isolated power system of Cyprus Island were implemented in PowerWorld Simulator, in order to reveal this operation in a real isolated power system with RES penetration. Through extensive simulations, we observed that after a fluctuation in the power system operation, the frequency dynamic response is closer to the nominal one due to the beneficial V2G operation. Therefore, PHEVs can act as frequency regulation sources in a power system, and especially in an isolated one. A user/owner of PHEV can participate in V2G operation when charging the PHEV in a charging station or simply by the plug-in connection of the vehicle to the network. This may improve the network performance without requiring the installation of new conventional generating units or other costly forms of conventional electric energy spinning reserve. Moreover, the user/owner of PHEV could be paid for these services provided to the power network. Finally, the V2G operation in an isolated power grid incorporating RES, in order to be sustainable, it requires the existence of an appropriate minimum number of electric or hybrid electric vehicles and distributed charging stations. This paper is limited to consider the results achieved from the primary frequency regulation of the Cypriot isolated power system when a significant PHEVs integration occurs in the system, while the secondary frequency regulation procedure is not considered. Nevertheless, this fact does not affect the validity and the importance of the presented results because the most important period for the dynamic stability of the simulated Cypriot isolated power system is the primary frequency regulation duration.

Author Contributions

Conceptualization, G.S. and Y.K.; Methodology, G.S. and Y.K.; Software, N.N. and K.B.; Validation, N.N. and K.B.; Formal Analysis, G.S. and Y.K.; Investigation, G.S. and Y.K.; Resources, G.S. and Y.K.; Data Curation, G.S. and Y.K.; Writing-Original Draft Preparation, N.N., K.B., Y.K. and G.S.; Writing-Review & Editing, G.S. and Y.K.; Visualization, G.S. and Y.K.; Supervision, G.S. and Y.K.; Project Administration, none; Funding Acquisition, none.

Funding

This research received no external funding.

Conflicts of Interest

The authors declare no conflict of interest.

References

  1. Jia, H.; Li, X.; Mu, Y.; Xu, C.; Jiang, Y.; Yu, X. Coordinated control for EV aggregators and power plants in frequency regulation considering time-varying delays. Appl. Energy 2018, 210, 1363–1376. [Google Scholar] [CrossRef]
  2. Liu, H.; Hu, Z.; Song, Y.; Lin, J. Decentralized vehicle-to-grid control for primary frequency regulation considering charging demands. IEEE Trans. Power Syst. 2013, 28, 3480–3489. [Google Scholar] [CrossRef]
  3. Liu, H.; Hu, Z.; Song, Y.; Wang, J.; Xie, X. Vehicle-to-grid control for supplementary frequency regulation considering charging demands. IEEE Trans. Power Syst. 2015, 30, 3110–3119. [Google Scholar] [CrossRef]
  4. Yang, J.; Zeng, Z.; Tang, Y.; Yan, J.; He, H.; Wu, Y. Load frequency control in isolated micro-grids with electrical vehicles based on multivariable generalized predictive theory. Energies 2015, 8, 2145–2164. [Google Scholar] [CrossRef]
  5. Ko, K.S.; Han, S.; Sung, D.K. Performance-based settlement of frequency regulation for electric vehicle aggregators. IEEE Trans. Smart Grid 2018, 9, 866–875. [Google Scholar] [CrossRef]
  6. Hu, Z.; Zhan, K.; Zhang, H.; Song, Y. Pricing mechanisms design for guiding electric vehicle charging to fill load valley. Appl. Energy 2016, 178, 155–163. [Google Scholar] [CrossRef]
  7. Zhang, H.; Hu, Z.; Xu, Z.; Song, Y. Optimal planning of PEV charging station with single output multiple cables charging spots. IEEE Trans. Smart Grid 2017, 8, 2119–2128. [Google Scholar] [CrossRef]
  8. Zhong, J.; He, L.; Li, C.; Cao, Y.; Wang, J.; Fang, B.; Xiao, G. Coordinated control for large-scale EV charging facilities and energy storage devices participating in frequency regulation. Appl. Energy 2014, 123, 253–262. [Google Scholar] [CrossRef]
  9. Dutta, A.; Debbarma, S. Frequency regulation in deregulated market using vehicle-to-grid services in residential distribution network. IEEE Syst. J. 2018, 12, 2812–2820. [Google Scholar] [CrossRef]
  10. Krueger, H.; Cruden, A. Modular strategy for aggregator control and data exchange in large scale Vehicle to Grid (V2G) applications. Energy Procedia 2018, 151, 7–11. [Google Scholar] [CrossRef]
  11. Zhu, X.; Xia, M.; Chiang, H.D. Coordinated sectional droop charging control for EV aggregator enhancing frequency stability of microgrid with high penetration of renewable energy sources. Appl. Energy 2018, 210, 936–943. [Google Scholar] [CrossRef]
  12. Han, H.; Huang, D.; Liu, D.; Li, Q. Autonomous frequency regulation control of V2G (Vehicle-to-grid) system. In Proceedings of the IEEE Control and Decision Conference (CCDC), Chongqing, China, 28–30 May 2017; pp. 5826–5829. [Google Scholar]
  13. Han, S.; Han, S. Economic feasibility of V2G frequency regulation in consideration of battery wear. Energies 2013, 6, 748–765. [Google Scholar] [CrossRef]
  14. Kontou, E.; Yin, Y.; Lin, Z. Socially optimal electric driving range of plug-in hybrid electric vehicles. Transp. Res. Part D Transp. Environ. 2015, 39, 114–125. [Google Scholar] [CrossRef] [Green Version]
  15. Martinenas, S.; Marinelli, M.; Andersen, P.B.; Træholt, C. Implementation and demonstration of grid frequency support by V2G enabled electric vehicle. In Proceedings of the IEEE Power Engineering Conference (UPEC), Cluj-Napoca, Romania, 2–5 September 2014; pp. 1–6. [Google Scholar]
  16. Chukwu, U.C.; Mahajan, S.M. Modeling of V2G net energy injection into the grid. In Proceedings of the IEEE 6th International Conference Clean Electrical Power (ICCEP), Santa Margherita Ligure, Italy, 27–29 June 2017; pp. 437–440. [Google Scholar]
  17. Child, M.; Nordling, A.; Breyer, C. The impacts of high V2G participation in a 100% renewable Aland energy system. Energies 2018, 11, 2206. [Google Scholar] [CrossRef]
  18. An, K.; Song, K.B.; Hur, K. Incorporating charging/discharging strategy of electric vehicles into security-constrained optimal power flow to support high renewable penetration. Energies 2017, 10, 729. [Google Scholar] [CrossRef]
  19. Meng, J.; Mu, Y.; Jia, H.; Wu, J.; Yu, X.; Qu, B. Dynamic frequency response from electric vehicles considering travelling behavior in the Great Britain power system. Appl. Energy 2016, 162, 966–979. [Google Scholar] [CrossRef]
  20. Ota, Y.; Taniguchi, H.; Baba, J.; Yokoyama, A. Implementation of autonomous distributed V2G to electric vehicle and DC charging system. Electr. Power Syst. Res. 2015, 120, 177–183. [Google Scholar] [CrossRef] [Green Version]
  21. Vachirasricirikul, S.; Ngamroo, I. Robust LFC in a smart grid with wind power penetration by coordinated V2G control and frequency controller. IEEE Trans. Smart Grid 2014, 5, 371–380. [Google Scholar] [CrossRef]
  22. Masuta, T.; Yokoyama, A. Supplementary load frequency control by use of a number of both electric vehicles and heat pump water heaters. IEEE Trans. Smart Grid 2012, 3, 1253–1262. [Google Scholar] [CrossRef]
  23. Shimizu, K.; Masuta, T.; Ota, Y.; Yokoyama, A. A new load frequency control method in power system using vehicle-to-grid system considering users’ convenience. In Proceedings of the 17th Power System Computation Conference, Stockholm, Sweden, 22–26 August 2011; pp. 1–8. [Google Scholar]
  24. Shimizu, K.; Masuta, T.; Ota, Y.; Yokoyama, A. Load frequency control in power system using vehicle-to-grid system considering the customer convenience of electric vehicles. In Proceedings of the International Conference of Power System Technology, Hangzhou, China, 24–28 October 2010; pp. 1–8. [Google Scholar]
  25. Transmission System Operator Cyprus: Electrical Energy Generation. December 2018. Available online: https://www.dsm.org.cy/en/cyprus-electrical-system/electrical-energy-generation (accessed on 13 January 2019).
  26. Cyprus Energy Regulatory Authority (CERA): Production of Electricity Using RES Statistics. Available online: https://www.cera.org.cy/en-gb/ilektrismos/details/statistika-ape (accessed on 13 January 2019).
  27. Nikolaidis, P.; Chatzis, S.; Poullikkas, A. Renewable energy integration through optimal unit commitment and electricity storage in weak power networks. Int. J. Sustain. Energy 2018, 1–17. [Google Scholar] [CrossRef]
  28. Ellis, A.; Kazachkov, Y.; Muljadi, E.; Pourbeik, P.; Sanchez-Gasca, J.J. Description and technical specifications for generic WTG models—A status report. In Proceedings of the IEEE Power Systems Conference and Exposition (PSCE), Phoenix, AZ, USA, 20–23 March 2011; pp. 1–8. [Google Scholar]
  29. Tamrakar, U.; Shrestha, D.; Maharjan, M.; Bhattarai, B.; Hansen, T.; Tonkoski, R. Virtual inertia: Current trends and future directions. Appl. Sci. 2017, 7, 654. [Google Scholar] [CrossRef]
  30. Rahmann, C.; Castillo, A. Fast frequency response capability of photovoltaic power plants: The necessity of new grid requirements and definitions. Energies 2014, 7, 6306–6322. [Google Scholar] [CrossRef]
  31. Stavrinos, S.; Petoussis, A.G.; Theophanous, A.L.; Pillutla, S.; Prabhakara, F.S. Development of a validated dynamic model of Cyprus Transmission system. In Proceedings of the 7th Mediterranean Conference and Exhibition on Power Generation, Transmission, Distribution and Energy Conversion, Agia Napa, Cyprus, 7–10 November 2010; pp. 1–11. [Google Scholar]
  32. Katsigiannis, Y.A.; Karapidakis, E.S. The Effect of Pumped Hydro Storage Units Installation on the Operation of the Autonomous Cretan Power System; Power Systems, Energy Markets and Renewable Energy Sources in South-Eastern Europe; Trivent Publishing: Budapest, Hungary, 2016; pp. 297–308. [Google Scholar]
  33. Li, Z.; Jiang, S.; Dong, J.; Wang, S.; Ming, Z.; Li, L. Battery capacity design for electric vehicles considering the diversity of daily vehicles miles traveled. Transp. Res. Part C Emerg. Technol. 2016, 72, 272–282. [Google Scholar] [CrossRef]
Figure 1. Framework of Vehicle to Grid (V2G) operation participating in primary frequency control (PFC) (TSO: Transmission System Operator, SCADA: Supervisory Control and Data Acquisition, EMS: Energy Management System (EMS)) [18].
Energies 12 00720 g001
Figure 2. Frequency deviation signal. The maximum deviation value, from the nominal frequency is −1.02 Hz.
Energies 12 00720 g002
Figure 3. Droop control of the Battery SOC Holder (BSH) for the electric vehicle (EV) charging/dis-charging power.
Energies 12 00720 g003
Figure 4. Droop control of the Charging with Frequency Regulation (CFR) (red part represents frequency droop control and the blue part is scheduled charging power).
Energies 12 00720 g004
Figure 5. Plug-in hybrid electric vehicles (PHEV) V2G control block for frequency regulation (blue part represents the battery of the vehicle).
Energies 12 00720 g005
Figure 6. Frequency response signal with negative deviation.
Energies 12 00720 g006
Figure 7. Frequency response signal with positive deviation.
Energies 12 00720 g007
Figure 8. Scenario 1-Red line represents the real-time Battery Sate of Charge (BSOC) and the green line is the total V2G power at the grid side.
Energies 12 00720 g008
Figure 9. Scenario 2-Red line represents the Real-time BSOC and the green line is the total V2G power at the grid side. PHEVs are discharged in order to reduce the frequency deviation.
Energies 12 00720 g009
Figure 10. Scenario 3-Red line represents the Real-time BSOC and the green line is the total V2G power at the grid side. PHEVs absorb more energy from the power grid, in order to reduce the frequency deviation.
Energies 12 00720 g010
Figure 11. Scenario 4-Red line represents the Real-time BSOC and the green line is the total V2G power at the grid side. PHEVs are charged in order to reduce the frequency deviation.
Energies 12 00720 g011
Figure 12. Wind turbine simulation model (Type 2) for Cyprus Island [28].
Energies 12 00720 g012
Figure 13. The simulation model of the isolated power system of Cyprus with the load of PHEVs of each city.
Energies 12 00720 g013
Figure 14. Frequency response of the system when unit is lost. The red curve represents the real frequency response and the blue line represents the simulated frequency response.
Energies 12 00720 g014
Figure 15. Scenario 1, Frequency response without V2G operation.
Energies 12 00720 g015
Figure 16. Scenario 1, Frequency response with V2G operation.
Energies 12 00720 g016
Figure 17. BSOC of Nicosia’s PHEVs.
Energies 12 00720 g017
Figure 18. Scenario 1, Charging power of Nicosia’s PHEVs. Blue line represents group A, red line for group B, green for group C and purple line for group D.
Energies 12 00720 g018
Figure 19. Scenario 1, frequency response with V2G operation, with the additional fleet of PHEVs.
Energies 12 00720 g019
Figure 20. Scenario 1, the BSOC of an additional fleet of Nicosia’s PHEVs.
Energies 12 00720 g020
Figure 21. Scenario 2, Frequency response without V2G operation.
Energies 12 00720 g021
Figure 22. Scenario 2, Frequency response with V2G operation.
Energies 12 00720 g022
Figure 23. Scenario 2, BSOC of Limassol’s PHEVs.
Energies 12 00720 g023
Figure 24. Scenario 2, Charging power of an additional fleet of Limassol’s PHEVs. Blue line represents the group A, red line for group B, green for group C and purple line for group D.
Energies 12 00720 g024
Figure 25. Scenario 2, Frequency response with V2G operation, with the additional fleet of PHEVs.
Energies 12 00720 g025
Figure 26. Scenario 2, BSOC of an additional fleet of Limassol’s PHEVs.
Energies 12 00720 g026
Figure 27. Scenario 2, Charging power of an additional fleet of Limassol’s PHEVs. Blue line represents the group A, red line for group B, green for group C and purple line for group D.
Energies 12 00720 g027
Table 1. PHEVs and V2G simulation parameters [2].
ParameterMeasurement UnitValue
PHEV number15000
Maximum V2G droopkW/Hz3.2
Battery capacitykWh32
Maximum SOCpu0.1
Minimum SOCpu0.9
Maximum V2G powerkW7
Frequency dead bandHz[−0.05, 0.05]
Charging/discharging efficiencypu0.92/0.92
LFC delays4
Table 2. Composition of units and their loads at the time where the steam unit is lost.
Power StationGeneration UnitUnit Load (MW)
VasilikosSteam turbine-ST1120
Steam turbine-ST2116
Steam turbine-ST30
Combined cycle-CCGT1173
Combined cycle-CCGT20
Gas turbine-GT10
DhekeliaSteam turbine-ST10
Steam turbine-ST20
Steam turbine-ST30
Steam turbine-ST430
Steam turbine-ST50
Steam turbine-ST630
Internal combustion-ICE10
MoniGas turbine-GT10
Gas turbine-GT20
Gas turbine-GT30
Gas turbine-GT40
Wind generationWind turbines37
Total system load506
Table 3. PHEVs fleet per district.
City/DistrictGroup/PHEVsSOCin (%)SOCout (%)Pc (kW)Total Pc (MW)
NicosiaA/709537803.15356.493
B/447324904.84
C/200533806.446
D/185149903.006
LimassolA/266735803.30037.839
B/309346903.226
C/138732904.253
D/351939903.740
LarnakaA/265413704.18028.545
B/194217905.353
C/103629703.006
D/84026904.693
FamagustaA/30538803.08011.071
B/104112804.986
C/76215704.033
D/43221804.326
PafosA/129439803.00614.633
B/194122703.520
C/60127703.153
D/78645802.566
Total load on the system (MW)148.581
Table 4. Composition of units and there loads with and without PHEVs load in the power system.
Power StationGeneration UnitUnit Load (MW)
W/O PHEVsWith PHEVs
VasilikosSteam turbine-ST1102.4100
Steam turbine-ST2102.4100
Steam turbine-ST3102.4100
Combined cycle-CCGT1165.43186.5
Combined cycle-CCGT2165.43186.5
Gas turbine-GT1432
DhekeliaSteam turbine-ST137.79955
Steam turbine-ST237.79955
Steam turbine-ST337.79955
Steam turbine-ST437.79955
Steam turbine-ST537.79955
Steam turbine-ST637.79955
Internal combustion-ICE100
MoniGas turbine-GT120.37919
Gas turbine-GT220.37919
Gas turbine-GT320.37919
Gas turbine-GT400
Wind generationWind turbines7575
Total system load10051167
Table 5. PHEVs fleet of vehicles that desire to maintain their initial BSOC.
City/DistrictGroup/PHEVsSOCin (%)
NicosiaA/200086
B/189865
C/174574
D/185752
LimassolA/123671
B/124853
C/126589
D/125174
LarnakaA/110759
B/115782
C/112453
D/111257
FamagustaA/94469
B/99064
C/103958
D/102766
PafosA/101664
B/100158
C/98665
D/99761
Total PHEVs25,000

