Article

Lignocellulosic Ethanol Biorefinery: Valorization of Lignin-Rich Stream through Hydrothermal Liquefaction

1
RE-CORD, Viale Kennedy 182, Scarperia e San Piero, 50038 Florence, Italy
2
Department of Industrial Engineering, University of Florence, Viale Morgagni 40, 50135 Florence, Italy
3
Chemistry Department “Ugo Schiff”, University of Florence, Via della Lastruccia, Sesto Fiorentino, 50019 Florence, Italy
*
Author to whom correspondence should be addressed.
Energies 2019, 12(4), 723; https://doi.org/10.3390/en12040723
Submission received: 18 January 2019 / Revised: 14 February 2019 / Accepted: 15 February 2019 / Published: 22 February 2019
(This article belongs to the Special Issue Hydrothermal Technology in Biomass Utilization & Conversion)

Abstract

:
Hydrothermal liquefaction of lignin-rich stream from lignocellulosic ethanol production at an industrial scale was carried out in a custom-made batch test bench. Light and heavy fractions of the HTL biocrude were collected following an ad-hoc developed two-steps solvent extraction method. A full factorial design of experiment was performed, investigating the influence of temperature, time and biomass-to-water mass ratio (B/W) on product yields, biocrude elemental composition, molecular weight and carbon balance. Total biocrude yields ranged from 39.8% to 65.7% w/w. The Temperature was the main influencing parameter as regards the distribution between the light and heavy fractions of the produced biocrude: the highest amount of heavy biocrude was recovered at 300 °C, while at 350 and 370 °C the yield of the light fraction increased, reaching 41.7% w/w at 370 °C. Instead, the B/W ratio did not have a significant effect on light and heavy biocrude yields. Feedstock carbon content was mainly recovered in the biocrude (up to 77.6% w/w). The distribution between the light and heavy fractions followed the same trend as the yields. The typical aromatic structure of the lignin-rich stream was also observed in the biocrudes, indicating that mainly hydrolysis depolymerization occurred. The weight-average molecular weight of the total biocrude was strictly related to the process temperature, decreasing from 1146 at 300 °C to 565 g mol−1 at 370 °C.

1. Introduction

The EU-Renewable Energy Directive (RED) defines Advanced Biofuel only on the base of the feedstock (as reported in Annex IX Part A of RED [1]). The use of residual/dedicated lignocellulosic biomass is currently promoted for sustainable biofuel production, a sector that is largely dominated by lipids in Europe. Vegetable and used oils, representing by far the largest share of biofuels in EU [2], even when converted into high-quality hydrocarbons through hydrotreatment and hydroisomerization processes, are criticized for the potential food versus fuel conflicts and the use of high-ILUC (indirect land use change) feedstock, such as imported palm oil. The major Research and Development efforts in the EU focus on developing new industrial-scale technologies able to produce sustainable biofuels/bioenergy from lignocellulosic material. The lignocellulosic ethanol route is among these pathways. It has achieved full industrial scale worldwide as a consequence of the wide diffusion of this process, an increasing amount of a very wet lignin-rich stream (LRS) is made available as co-product at the production site in considerable quantities, constant physical and chemical characteristics, and affordable costs [3]. The current use of the LRS in industrial complexes is still limited to combustion for heat and power generation. However, being lignin the most abundant renewable source of aromatics in nature, its valorization is a very attractive opportunity for green chemistry in a circular economy perspective. Therefore, several research works addressed the economic valorization of lignin-rich streams from lignocellulosic ethanol production, either as chemical or as fuel, highlighting the challenges and importance of co-product valorization to achieve commercial competitiveness of these processes [4,5]. The economic relevance of lignin co-products valorization clearly emerged since the initial modelling studies of the process [6] and it was later confirmed by experimental data from a pilot, demo and first-of-a-kind plants.
Among the different processes and technologies that deal with lignin depolymerization [7], hydrothermal liquefaction (HTL) is a noteworthy thermochemical process which can convert lignocellulosic biomass mostly into a liquid fraction by using solely hot compressed water, or mixtures of water, co-solvents and chemicals [8,9]. HTL is a wet process, which does not require feedstock drying, as it is instead necessary for other thermochemical processes like gasification and pyrolysis. As such, HTL is an attractive approach for the conversion of wet biomass into a liquid product. Therefore, the high water-content, rather a constant composition, and the continuous availability at the industrial site of the lignin-rich co-product makes it a promising candidate for processing under hydrothermal liquefaction conditions into a biocrude. This would significantly improve the overall biorefinery carbon efficiency and economic performances, opening new business opportunities.
Several authors carried out fundamental investigations on HTL of lignin using model compounds, as Vanillin, Monobenzone and 2-2’-biphenol [10]. They showed that ether bonds are more reactive under hydrothermal conditions than C-C bonds. Thus, the liquid yield reduces from monobenzone (almost complete conversion) to vanillin to 2-2’biphenol (minimum conversion). Both fragmentation and condensation reactions occur on phenolic compounds in a hydrothermal environment, probably in competition, depending on the specific conditions. During hydrothermal liquefaction of lignin, α- and β-aryl ether hydrolysis, C—C bonds cleavage, alkylation, deoxygenation and repolymerization reactions take place simultaneously, whereas typically the aromatic structure is not affected by hydrothermal reactions. High molecular weight compounds from lignin HTL come from the partial depolymerization of the initial lignin from selective ether bonds splits but also from alkylation of the aromatic structures.
HTL conversion of lignin stream is often carried out at 350–400 °C, 22 MPa and 10 min residence time [11]. The process generates an energy-dense biocrude as the main fraction, along with gaseous products, solids, and an aqueous-phase byproduct. The biocrude yields can reach typically around 40%–50% w/w, with catechol, phenols, and methoxyphenols as main constituents. Similar results are obtained in the hydrothermal treatment of Kraft pine and organosolv lignin [12]. Most of the known HTL studies addressed lignin from pulp and paper or high-purity model compounds [10,11,12,13,14,15], both of them structurally different from lignin-rich stream originated from lignocellulosic ethanol biorefineries, which is still an unexploited material. To the best of authors’ knowledge, the study publicly available, which shares the closest similarities with the feedstock reported in the present work is due to Jensen et al. [16], who studied the influences of pre-treatment on the product composition for the case of alkaline HTL of a lab-scale, lignin-rich enzymatic hydrolysis residue.
The present work investigates the conversion of a lignin-rich stream from industrial-scale lignocellulosic ethanol into a biocrude suitable for further processing and upgrading into fuels and chemicals. The feedstock considered here is thus the actual stream from the industrial process. A special focus was given to the development and implementation of an extraction method in combination with the batch HTL micro-reactors system used in this research.

2. Materials and Methods

2.1. Lignin-Rich Stream

The lignin-rich stream (LRS) was obtained after ethanol distillation and mechanical separation of water from a demo lignocellulosic ethanol plant fed with poplar. The feedstock was dried in an oven for 48 h at 75 °C, knife-milled and then sieved to 0.25 mm; the LRS arrived as a moist agglomerated powder. After drying these agglomerates were size-reduced by milling. The characterization of this feedstock is given in the results and discussion section.

2.2. Experimental Equipment and Procedure

Batch hydrothermal liquefaction experiments were carried out in a custom-made micro-reactor test bench (MRTB), described in a previous publication by the authors [17]. The reactor consists of an AISI 316 ¾ (outer diameter) tube with a length of 300 mm (~43 mL of internal volume). In order to prepare batch experiments, dried feedstock was dispersed in ultrapure water (0.055 μS cm−1) to attain the desired biomass-to-water mass ratio. The mass of slurry loaded into the reactor was 33 g for each test. Prior to each experiment, a leakage test was performed with argon pressurized at 8 MPa. Then, three purging cycles with nitrogen (0.5 MPa) were carried out in order to remove air and ensure an inert atmosphere in the reactor. An initial pressure of 3 MPa was set using argon, then the reactor was immersed into a fluidized sand bath. Counting of residence time started when the inner reactor temperature reached 2 °C below the set reaction temperature: as the design residence time was completed, the reactor was rapidly cooled by immersion in a water bath. After nearly 20 min, the pressure was gradually released, the reactor opened and disconnected from the test bench.
A full factorial experimental plan with three factors and two levels was adopted, and the influence of temperature, time, the biomass-to-water mass ratio (B/W) and their interactions on the biocrude yield was assessed by means of an analysis of variance (ANOVA) on the experimental results. Each experiment was replicated between two to three times. In Table 1, the factors and the related low and high levels are reported. Besides the experiments planned, higher temperature (370 °C) and longer residence time (15–20 min) were also investigated in order to find the maximum yield of light biocrude.
In the present study, a light and a heavy fraction of the biocrude, named biocrude 1 (BC1) and biocrude 2 (BC2), respectively, were recovered with a two-steps solvent extraction method. The selection of the solvent for the recovery of the light fraction (diethyl ether, in short DEE) was based on a comparison with dichloromethane (GC-MS analysis). The solvent for the extraction of the heavy fraction (acetone, in short DMK) was based on the literature (see Appendix A for detailed results and references). Two different collection procedures were first developed and then evaluated, named Procedure 1 and Procedure 2, whose block diagrams are shown in Figure 1. In regards Procedure 1, once the reactor is disconnected from the test bench, it is rinsed with DEE and its content is vacuum-filtered over a Whatman glass microfiber filter (1 µm). Water and water-soluble organics (WSO) are then recovered by gravity separation, while biocrude 1 is obtained after rotary evaporation of DEE at reduced pressure. The reactor and the solids are then rinsed with DMK; then, the DMK and the DMK-solubles are subjected to rotary evaporation at reduced pressure for the collection of biocrude 2, while the solid residue (SR) is oven-dried at 105 °C overnight. Procedure 2 differs only in the first step, where water and WSO are collected prior to solvent extraction. The products obtained from the experiments defined in the DOE were collected according to Procedure 1.
The mass yield and the carbon yield of the HTL products were evaluated according to Equations (1) and (2) below
Mass   yield = mass   of   product dry   mass   of   LRS × 100
Carbon   yield = carbon   mass   in   the   product carbon   mass   in   the   LRS   ( d . b . ) × 100
The gas yield was estimated assuming the produced gas fraction as composed entirely by CO2, and ideal gas behavior, while the unrecovered products and the WSO fraction, which were not detected in HPLC, were determined by difference. The assumption of considering the gas phase made up entirely of carbon dioxide is legitimated, under a reasonable degree of approximation, by the fact that decarboxylation is one of the main reaction involved in hydrothermal liquefaction, leading to the formation of a CO2-rich gas [18,19]. The products obtained from a typical experiment are shown in Figure 2. BC1 is a viscous brown liquid, while BC2 was recovered as a powder or as a very viscous black liquid, as similarly experienced by the research group of Xu (Ahmad et al. [20], Cheng et al. [21]) in their experiments on hydrothermal depolymerization of lignin.

2.3. Analytical Methods and Chemicals

Prior to feedstock characterization, the LRS was dried at 75 °C for 48 h and milled in a knife mill (RETSCH SM 300) equipped with a 0.25 mm sieve. The drying process was carried out at low temperature in order to minimize the devolatilization of the organic matrix. Moisture, ash content and volatile matter were determined in a Leco TGA 701 instrument according to UNI EN 13040, UNI EN 14775 and UNI EN 15148, respectively. Fixed carbon was calculated by difference. The content of carbon, hydrogen, nitrogen (CHN) was determined through a Leco TruSpec according to UNI EN 15104, while the sulphur content of the feedstock was analyzed by means of a TruSpec S Add-On Module, according to ASTM D4239. The oxygen content was evaluated by difference, considering C, H, N, S and ash content. For the biocrude samples, the sulphur content was neglected in the evaluation of oxygen. Higher heating value (HHV) was measured according to UNI EN 14918 by means of a Leco AC500 isoperibol calorimeter. The HHV of the biocrudes was also estimated with the Channiwala and Parikh equation [22], due to the small available amount of samples. The validity of the latter correlation was assessed by a comparison with the measurement of the HHV of two light and heavy biocrude samples. Details are reported in Appendix D. The determination of the pH of the LRS was performed according to DIN ISO 10390.
The lignin content of the LRS was evaluated by a combination of three NREL procedures:
  • The LRS was subjected to Soxhlet extraction with water and then ethanol in order to obtain the water-soluble and ethanol-soluble extractives (NREL procedure TP-510-42619 [23])
  • The remaining solid residue was subjected to acidic hydrolysis for the evaluation of the acid soluble, acid insoluble lignin and structural sugars (cellulose and hemicellulose) by UV-VIS spectrophotometer and HPLC (NREL procedure TP-510-42618 [24])
  • The ash content of the acid insoluble lignin was measured in order to determine the correct value of the latter (NREL procedure TP-510-42622 [25])
Infrared analyses were carried out with a Fourier transform infrared spectrophotometer (FT-IR, Affinity-1, Shimadzu), equipped with a Specac’s Golden Gate ATR.
The evaluation of the apparent molar mass (polystyrene equivalent) of the BC1 and BC2 was determined by gel permeation chromatography (GPC). The samples were firstly dissolved in tetrahydrofuran (THF), left overnight and then passed through a 0.45 μm syringe filter. Afterwards, 100 μL of sample was injected in an HPLC apparatus (Shimadzu LC 20 AT Prominence) connected to a refractive index detector (RID) and equipped with two in-series columns (Agilent, PL gel 5 µm 100 Å 300 × 7.5 mm) and a guard column (Agilent, PL gel 5 µm 50 × 7.5 mm). The analyses were performed at 40 °C with 1 mL min−1 of THF as eluent. Linear polystyrene standards (Agilent) with a molecular weight ranging from 370 to 9960 g mol−1 were used for calibration.
Qualitative and quantitative analysis of the organic compounds in the light biocrude samples were performed by GC-MS: 2 µL of BC1: isopropanol solution (0.1 g:10 mL) was injected in a GC 2010 with a GCMS-QP2010 mass spectrometer (Shimadzu) equipped with a ZB-5 MS Phenomenex column (30 m length, internal diameter 0.25 mm, film diameter 0.25 μm). The temperature was held at 40 °C for 10 min and then increased to 200 °C (heating rate 8 °C min−1, holding time 10 min) and 280 °C (heating rate 10 °C min−1, holding time 30 min). The qualitative analysis was performed comparing the mass spectra to the NIST 17 library after a previous 4-point calibration with the main compounds observed in the prior qualitative screening, using o-terphenyl as an internal standard.
The concentration of the WSO in the aqueous phase was evaluated by HPLC (LC-20 AT Prominence Shimadzu) equipped with a refractive index detector, a Hi-Plex H column 300 × 7.7 mm (Agilent) and a guard column PL Hi-Plex H 50 × 7.7 mm (Agilent), operating at 40 °C with a flow of 0.6 mL min−1 with 0.005 M sulfuric acid as mobile phase. Twenty five microliter of each aqueous sample was injected after a 0.2 µm syringe filtration. The quantitative analysis was accomplished after a 5-point calibration following the NREL 42623 guidelines [26]. In addition, a Karl Fischer titration (848 Titrino Plus, Metrohm) was performed following ASTM E203-08 to determine the WSO yields.
The total organic carbon (TOC) of the aqueous phase was determined by a Merck TOC test kit and a Shimadzu UV-1800 spectrophotometer (605 nm). Samples were heated in a Merck TR320 thermoreactor for 2 h at 120 °C and then allowed to cool for 1 h in a test tube rack at room temperature. As DEE is slightly soluble in water, the TOC measurement of the aqueous samples collected with Procedure 1 was corrected with the method reported in Appendix C.
All solvents and reagents required for this work were purchased from Carlo Erba and Sigma Aldrich: they were used as received without any further purification. All chemicals were ACS reagent grade. Water for HPLC and THF for GPC were HPLC grade. Ultrapure water (0.055 μS cm−1) for HTL experiments was produced with a TKA Microlab ultrapure water system. Analytical standards for GC and HPLC were ≥ 98% purity. Chemical standards for HHV and CHNS calibrations were purchased from Leco. All gases were purchased from Rivoira. Argon, air, nitrogen and oxygen were supplied with a 99.999% purity, whilst helium was at 99.9995%.
The statistical analysis for the determination of significant operating parameter was carried out with the software Minitab (Minitab Inc.), by considering a significance level of 5%.

3. Results and Discussion

3.1. Feedstock Characterization

Table 2 reports the properties of the feedstock. As it was obtained after mechanical dewatering, the LRS still has a high moisture content, nearly 70% w/w (w.b.), while its ash content is relatively low, as the fermentation feedstock was a hardwood (poplar) and not a herbaceous biomass, for instance. The lignin content is nearly 54% w/w (d.b.).
The detailed results from the analysis of the lignin content are reported in Table 3: 97.4% of the lignin contained in the feedstock was acid insoluble. After the Soxhlet extraction of the extractives, the residual lignin, cellulose and hemicellulose were approximately ash-free; the low amount of ashes from the LRS were concentrated in the extractives due to leaching during the extraction process. A very low amount of cellulose and hemicellulose (structural sugars) was detected, indicating that these compounds were effectively converted into ethanol during poplar fermentation. The mass balance was very well closed (94.62%).

3.2. Comparison of Extraction Procedures

Given the lab-scale size of the experimental apparatus, the recovery of the HTL products is a challenging task, as some can be retained in the reactor wall after the experiments. In order to collect the largest amount of biocrude from these small reactors, a solvent extraction procedure was developed; it is technically not possible to separate the biocrude and the aqueous phase gravimetrically. This would instead be the preferred solution in case of large scale continuous processes and the same approach should be considered also in lab-scale experiments, as reported also by Castello, Pedersen and Rosendahl [9]
Figure 3 reports the effects of the collection procedure on the composition of the light biocrude fraction (biocrude 1) and on the aqueous phase obtained from an experiment performed at 350 °C, 10 min, 10%. It is clearly visible that by using Procedure 1, the light biocrude has a higher amount of organics and, in particular, catechol, creosol, acetic acid, benzoic acid and 4-ethylguaiacol are under the detection limit in the case of Procedure 2. Accordingly, in the aqueous phase, the situation is reversed: a greater concentration of organics is obtained in the sample collected through the Procedure 2; this is true for all the calibrated compounds, except for lactic acid, glycerol and glycolic acid, whose concentrations are comparable. In addition, Table 4 shows the difference in products yield between the two collection procedures: a higher amount of BC1 and a lower amount of WSO are recovered by means of Procedure 1. This behavior is explained by the fact that in Procedure 1 water is not removed prior to DEE extraction of BC1 and therefore water-soluble organics are in part recovered in the light biocrude. From now on, the results showed in this study were based on this latter collection procedure, which was adopted because it allowed for a larger recovery of organics in the biocrude. However, it should be kept in mind that Procedure 2 would be more suitable for a direct comparison with a scaled-up/continuous process, where the biocrude would be gravimetrically separated from the water.

3.3. Yields and Influence of Operating Parameters

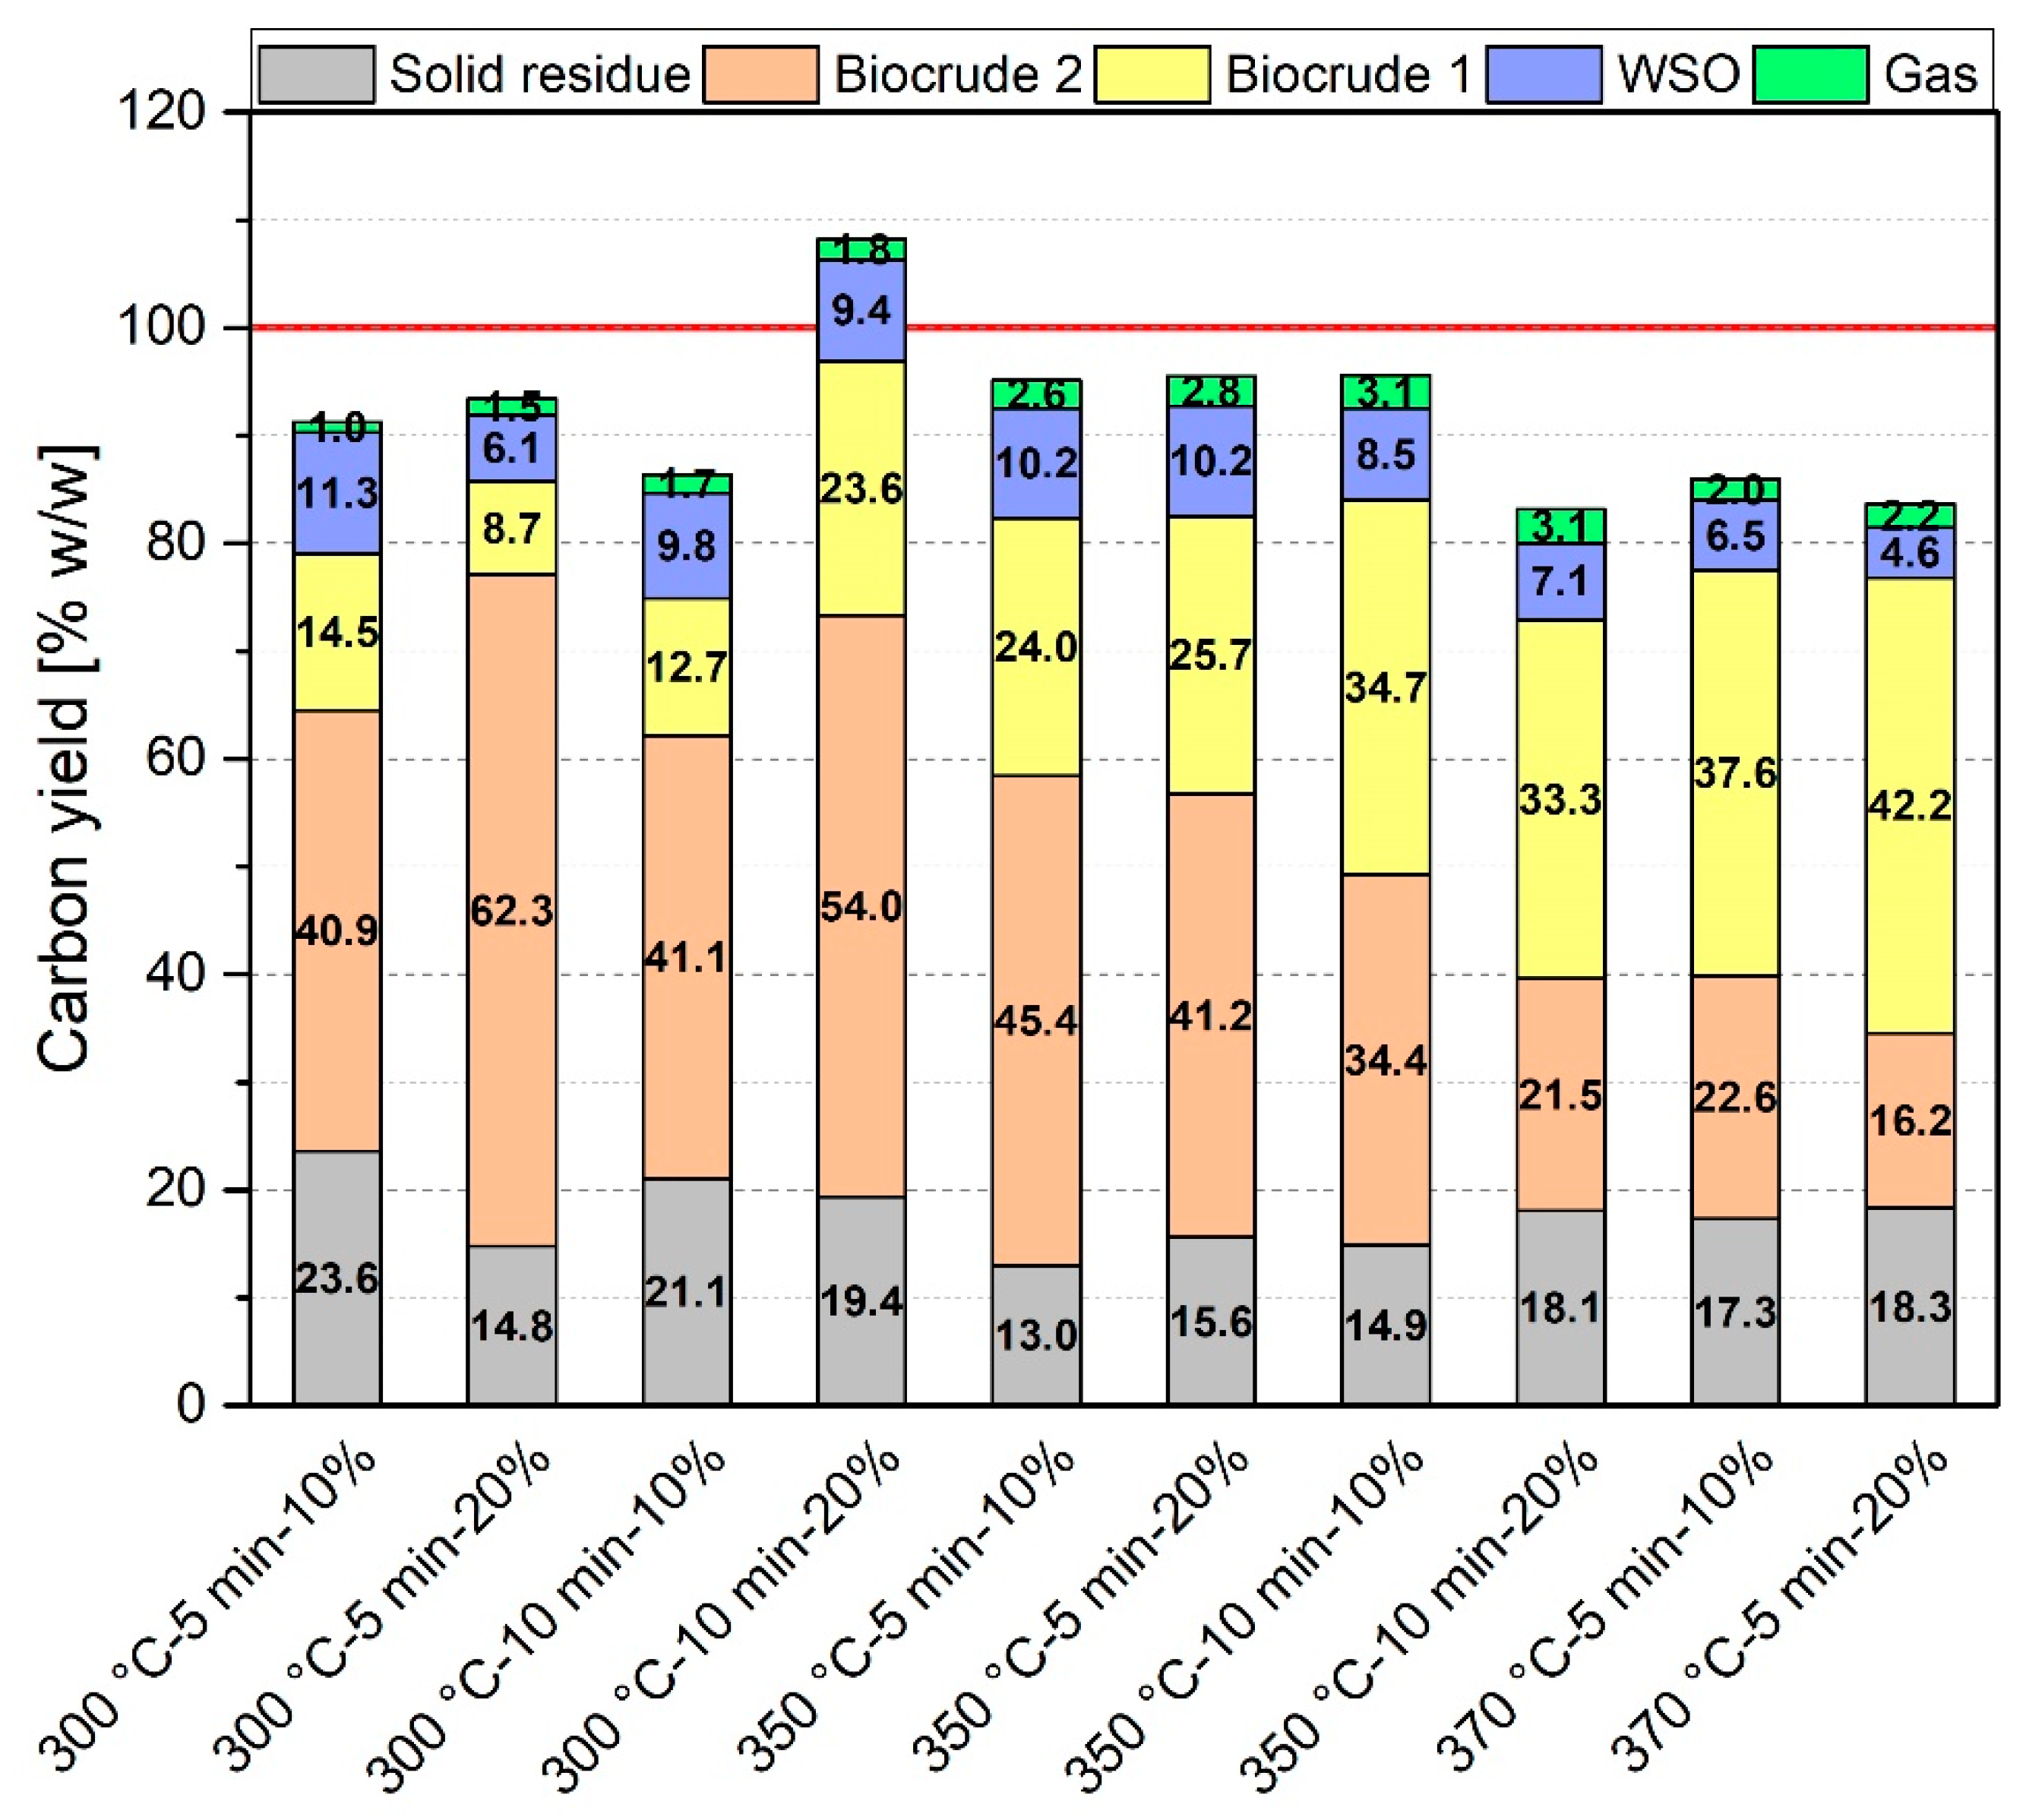
Figure 4 shows the yield of the HTL products, which were obtained at the operating conditions selected according to the experimental plan. The unidentified WSO were evaluated by difference and take into account also the losses due to the collection procedure.
A high yield of total biocrude was obtained, ranging from 44.1% to 65.7% w/w, with the amount of light and heavy fraction changing with reaction conditions. In general, by increasing the reaction temperature, an increase in the yield of BC1 and a decrease in that of BC2 are observed, while the solid residue is approximately constant throughout all operating conditions, being char yields between 11.4% and 19.6% w/w. The maximum total biocrude yield was achieved at 300 °C, 10 min, 20% but nearly 74% of it was composed by BC2. At 350 °C, 10 min, 10%, the total biocrude yield was 51.8% w/w and the maximum BC1 yield was obtained (29.3% w/w). The yields of the detected WSO and of the gas products were lower and the latter experienced an increase at 350 °C, as a higher temperature is known to enhance gasification reactions [27]. It is known from the literature [18] that the hydrothermal liquefaction of lignin is more likely to produce a rather high amount of solid product and therefore the use of alkali catalysts, such as KOH, K2CO3 or NaOH [27,28], and capping agents as phenol or boric acid [15,28,29,30] have been suggested to limit the char formation hampering polymerization, as well as different reaction medium than just water, as ethanol, methanol or water-mixture thereof [21,31,32]. For instance, Arturi et al. [30] investigated the effect of phenol in the HTL of Kraft pine lignin with K2CO3 and, in the temperature range of 280–350 °C, at a concentration of 3.2%–3.6% w/w of phenol obtained comparable solid yields to the present study, where no additives were adopted and with the use of a similar solvent extraction procedure.
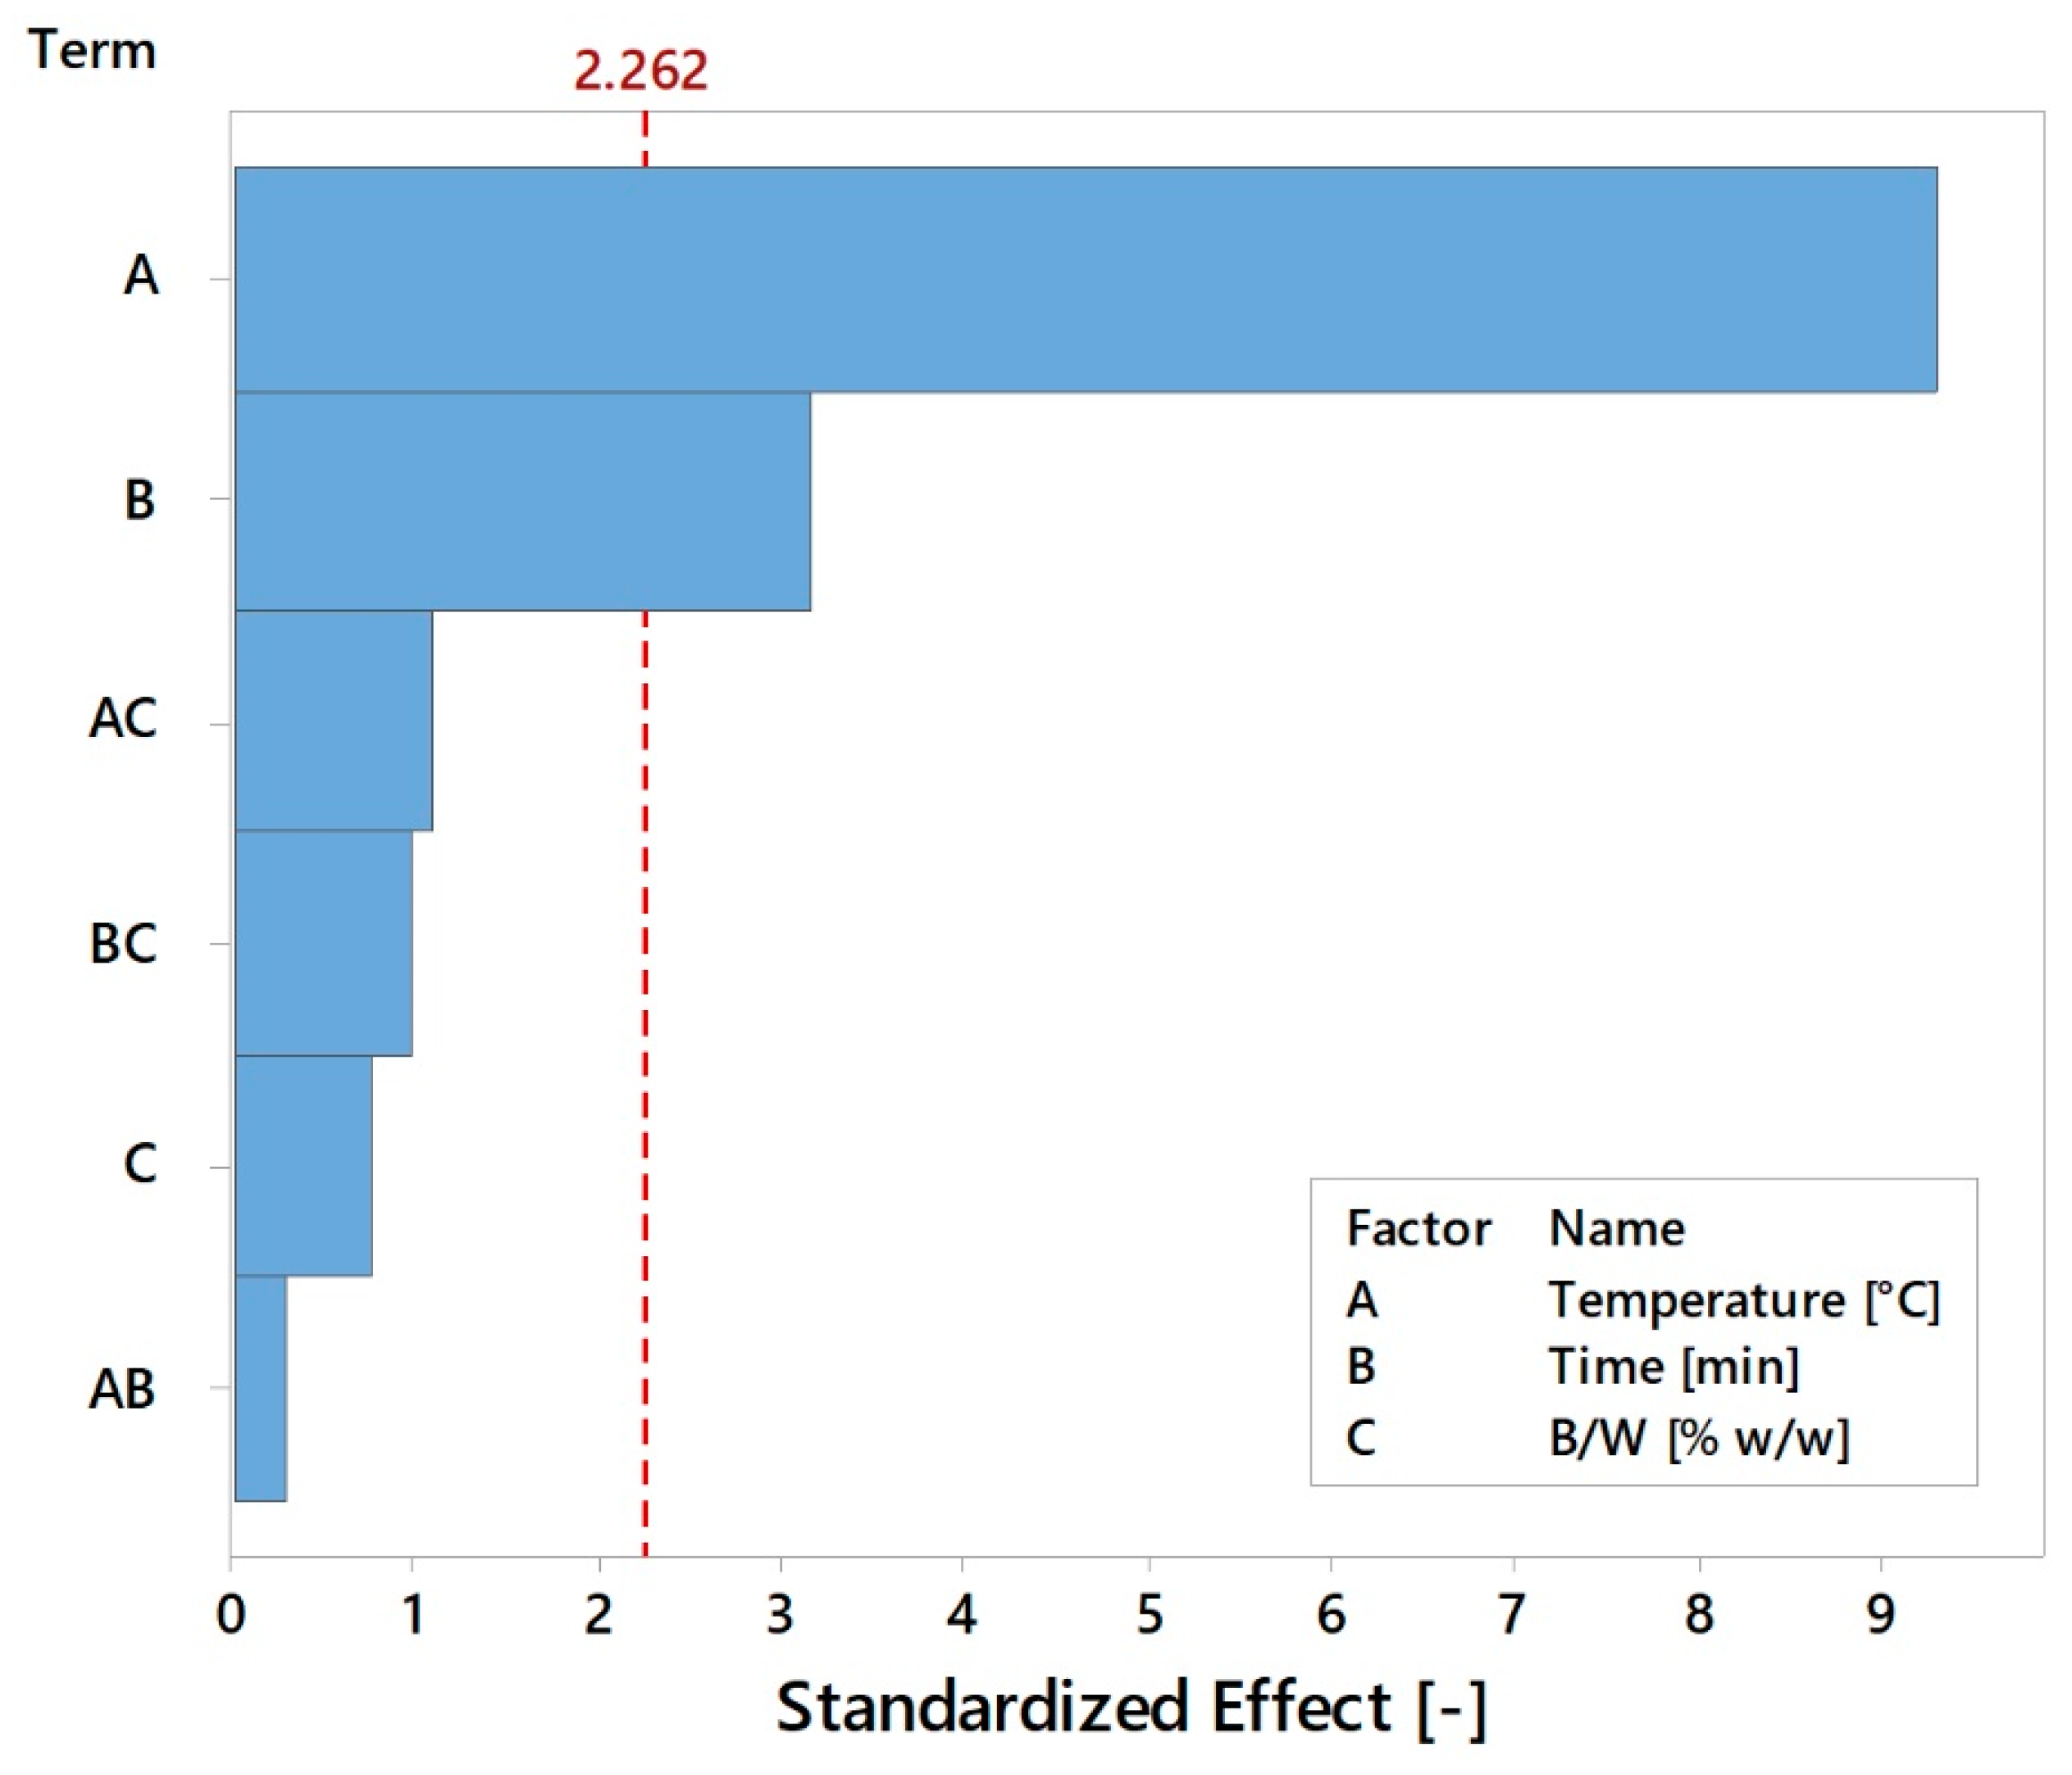
A statistical analysis was also performed in order to assess the influence of process parameters (temperature, time, B/W) and their interaction on BC1, BC2 and total biocrude yield. The significance level for this model was chosen to be 0.05 (95% confidence level). A Pareto plot [33] is reported in Figure 5, Figure 6 and 
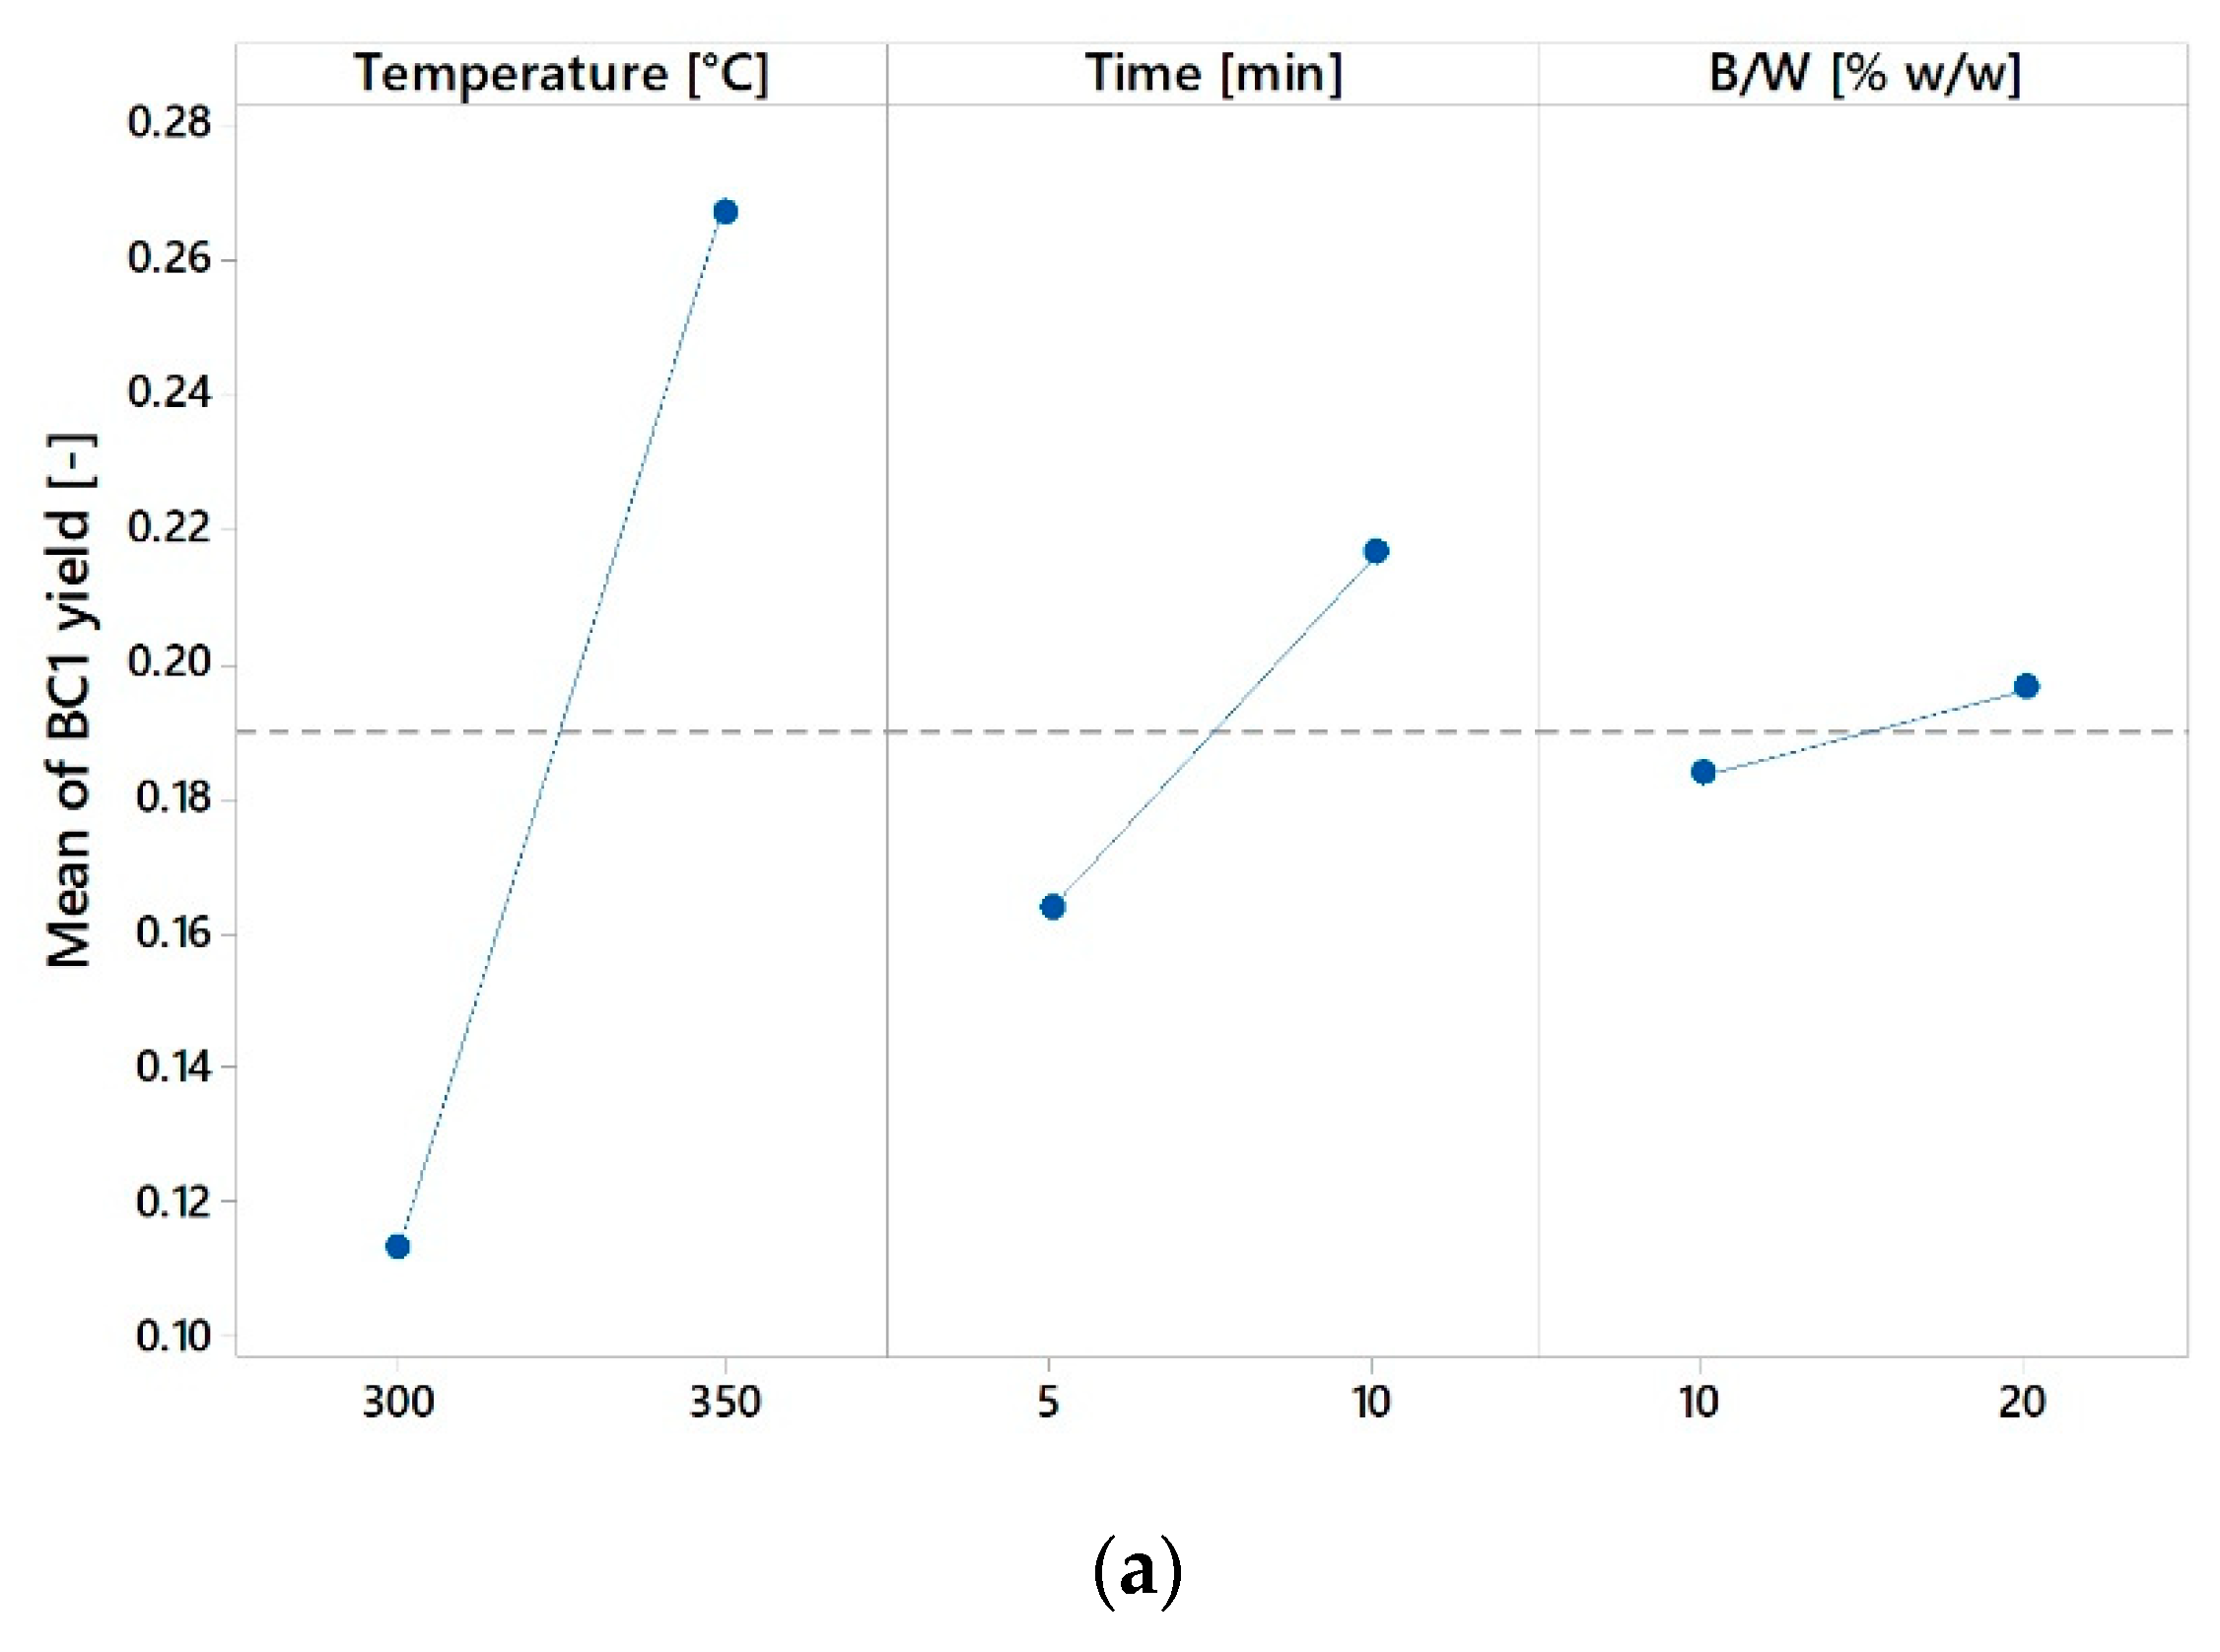
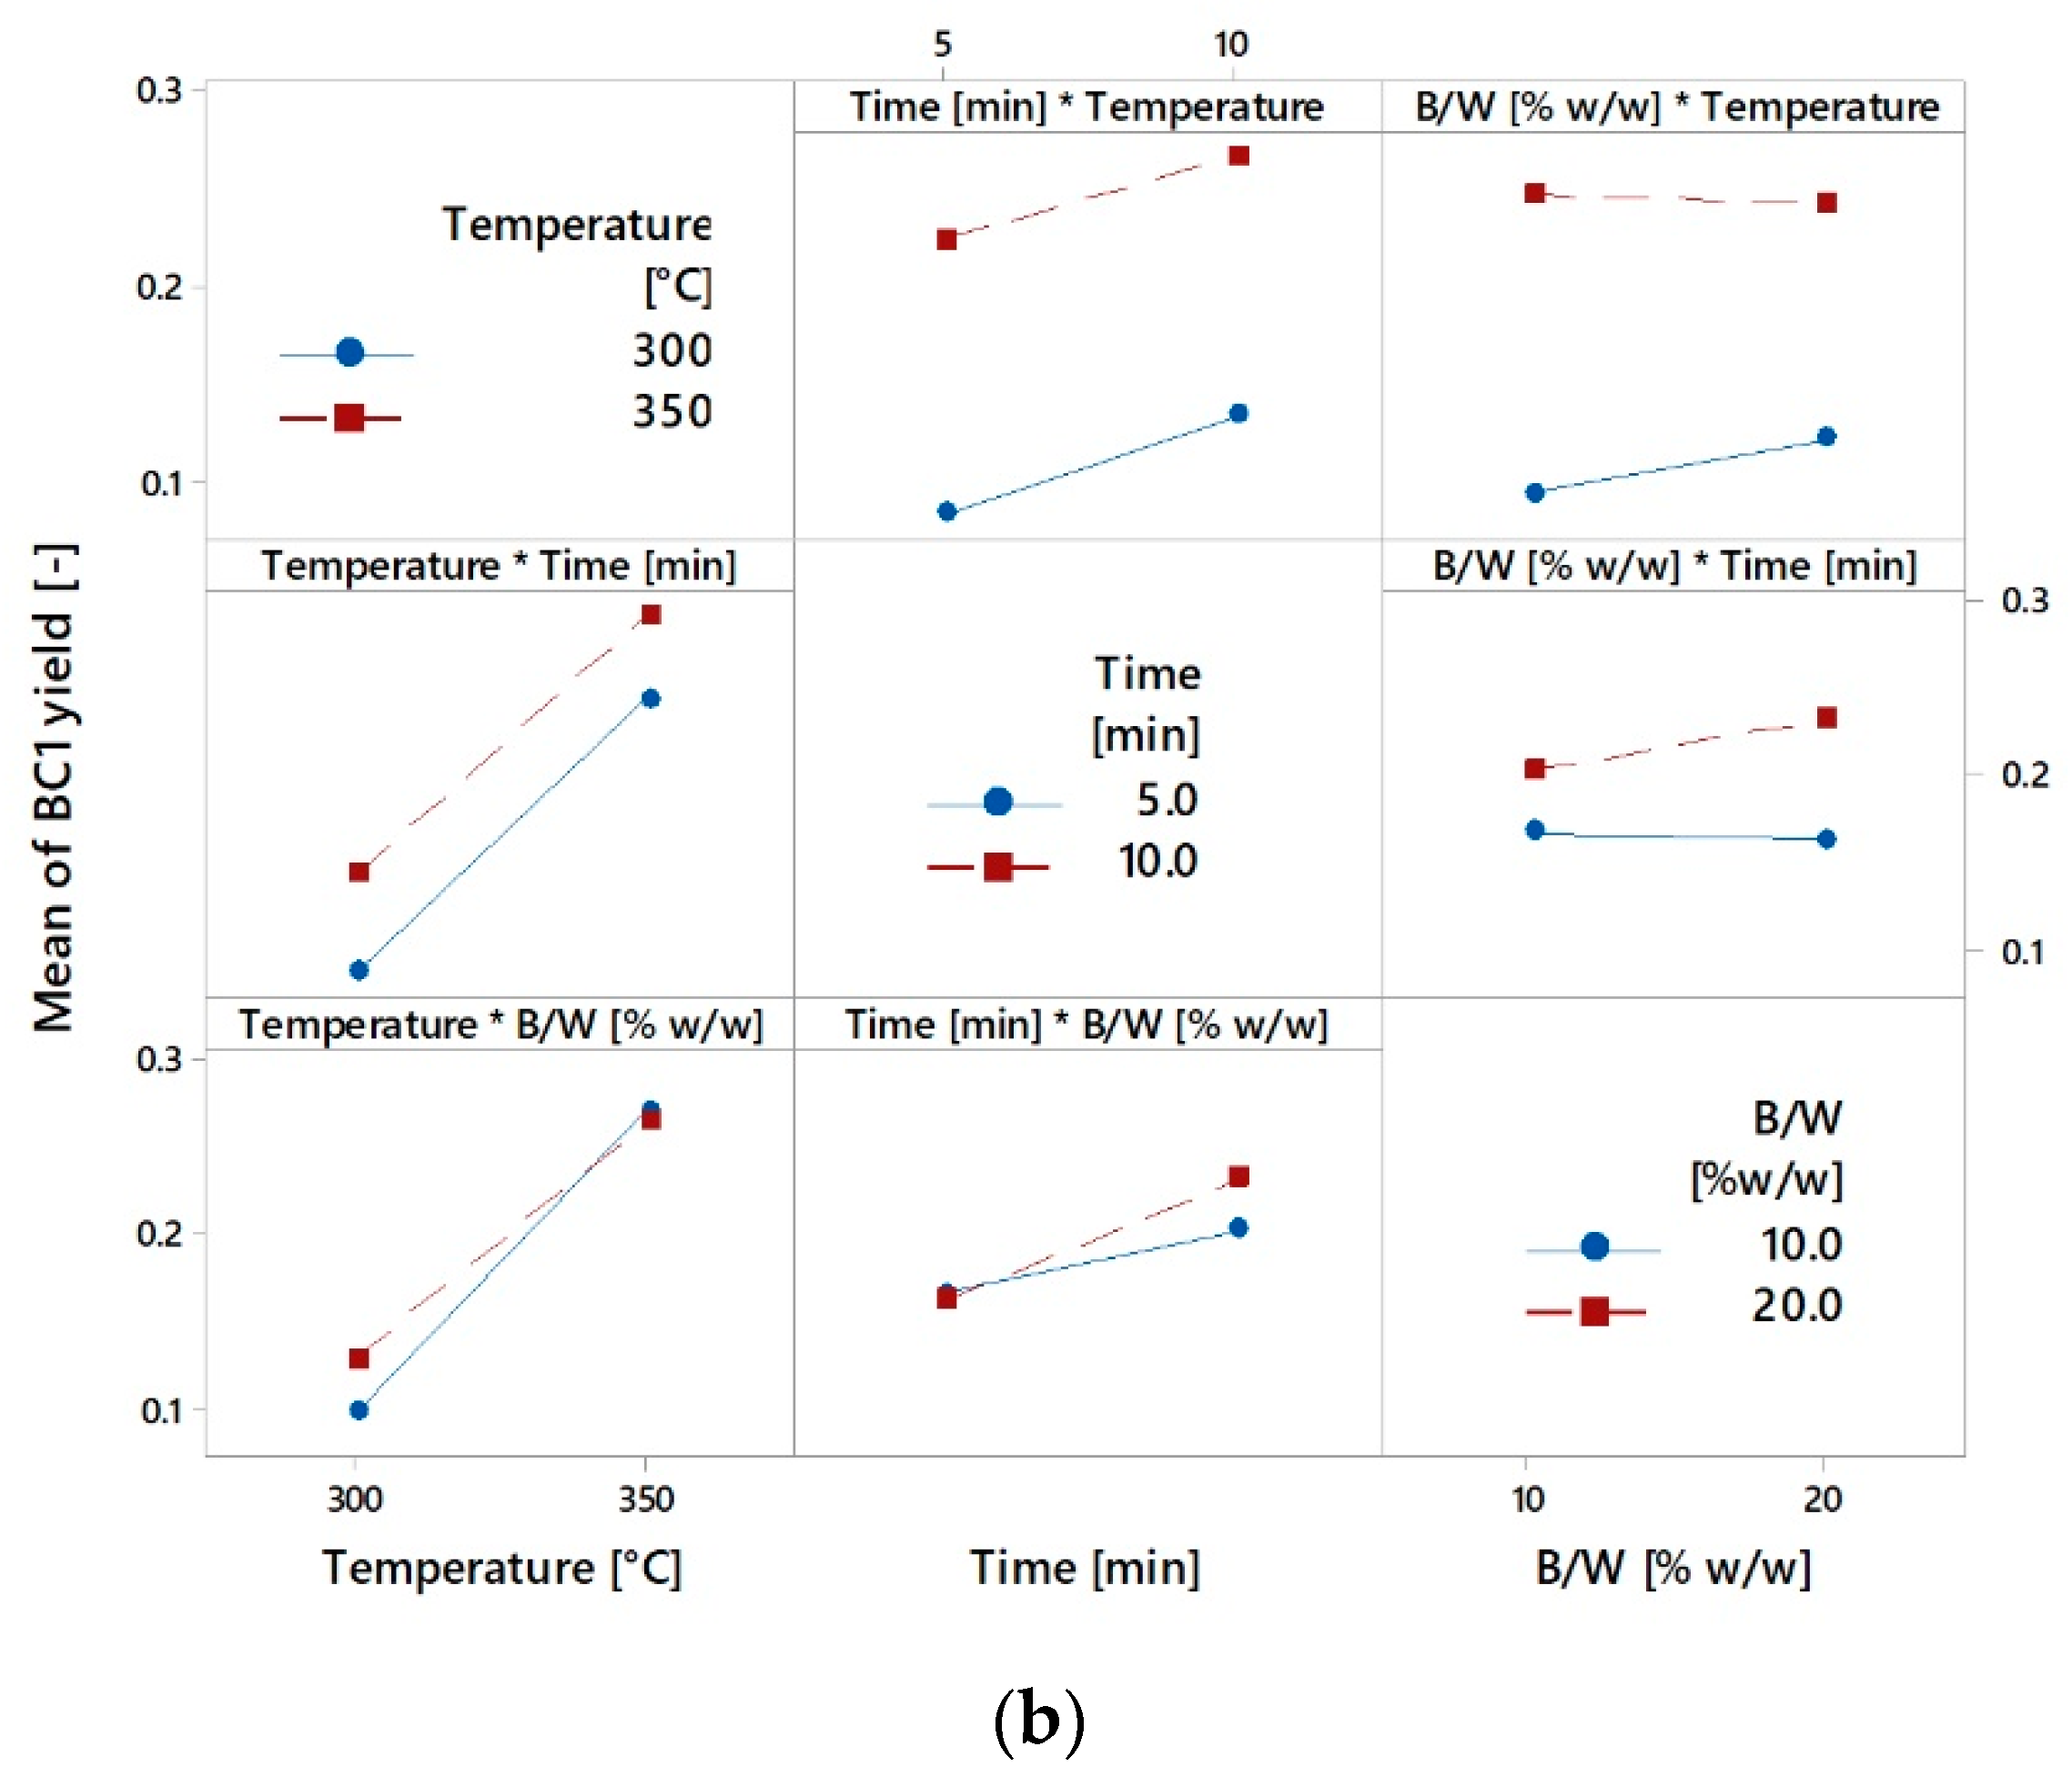
Figure 7 to visually highlight the absolute values of the main factors and the effect of interaction between the three parameters. The reference line in the chart indicates the limit between significance. The Pareto plot is useful to discriminate which process parameters can be neglected and which ones have an importance in the hydrothermal conversion process. However, to have a deeper understating of the positive and negative effects, the main effects plot and the interactions plot are reported in Appendix B (Figure A1, Figure A2 and Figure A3), showing how positively or negatively each parameter or combination thereof affects the biocrude yield.
It can be noticed from Figure 5 that temperature (A) had the greatest effect on BC1 yield, but also the residence time (B) is statistically significant at 95% confidence level, being both above the mentioned reference line. On the contrary, the ratio B/W (C), as well as the combination of factors, can be considered as not significant for the yield of BC1. This validates the fact that the temperature and partially the residence time drive the reactions pathways that lead to the formation of lighter intermediates that forms the BC1, as already shown in other works [30].
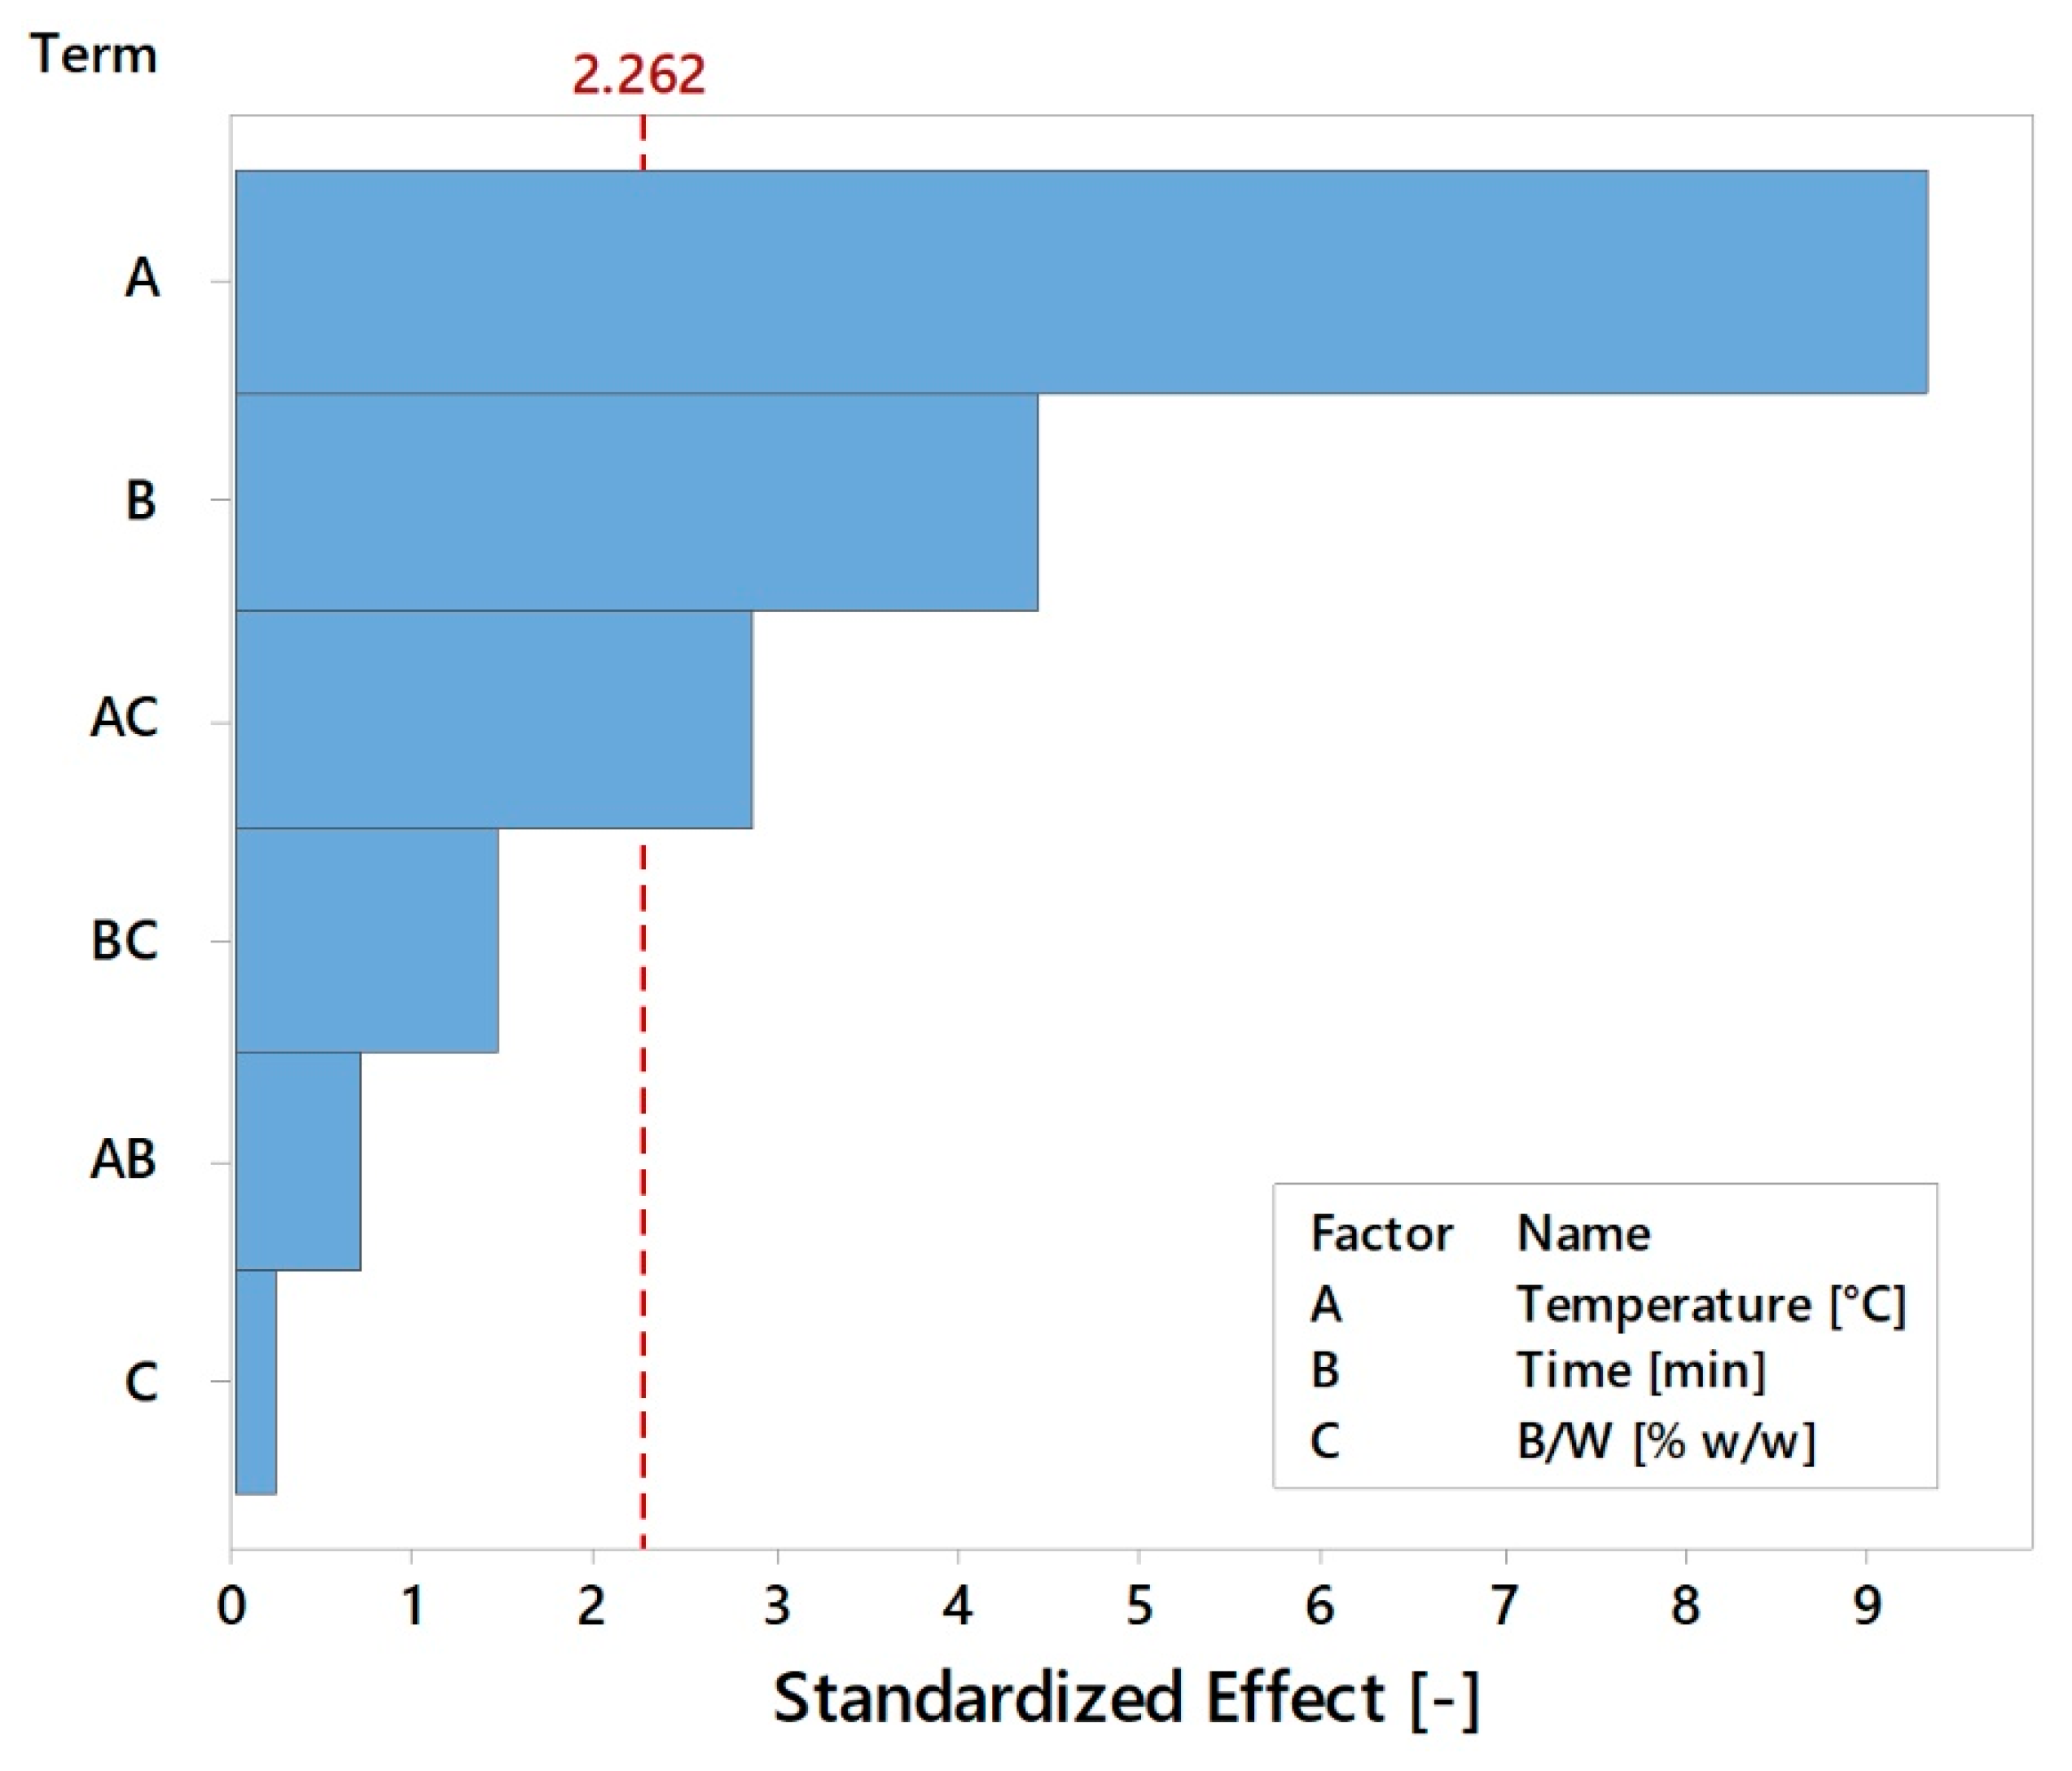
Figure 6 depicts the Pareto chart reporting the absolute standardized effect of the factors for the BC2 yield. In this case, beyond temperature and time that remains important in the generation of BC2 heavy branched molecules, the combined interaction between temperature and B/W becomes significant. This means that a relative variation in the solid material introduced in the slurry, combined with a variation of the reaction temperature, has more influence in the reaction mechanisms that produce BC2 rather than varying the B/W alone.
Interestingly, concerning the total biocrude yield (Figure 7), the most significant factor is the interaction between temperature and B/W, followed by temperature. In this case, time is not significant, suggesting that, in order to detect a statistically significant effect, longer residence time should be investigated. This effect demonstrates that increasing (or decreasing) the biomass content together with a variation in the reaction temperature drive the degradation reactions that form the biocrude (e.g., phenols, methoxyphenols and longer oxygenated aromatics chains). In general, this means that, if the objective is to optimize the process in terms of total biocrude yield without considering its quality, both of these factors have to be jointly taken into account.
In addition to the experiments of the DOE, four other reaction conditions were tested in duplicates, by increasing temperature to 370 °C and time to 15 and 20 min, collecting the products with Procedure 1. Figure 8 reports the solid residue and biocrudes yields from the experiments carried out at a B/W of 10% w/w. At 370 °C, 5 min, 10% an increase in the yield of the light biocrude and a decrease in that of the heavy one is achieved; BC2 yield decreases with residence time, while BC1 yield reaches the maximum value of 41.7% w/w at 15 min.
Although Castello, Pedersen and Rosendahl [9] recently reported that favorable HTL conditions can be obtained also at supercritical condition, it is known that the HTL temperature range where the biocrude is maximized lies between 300 and 350 °C [8,34]. At lower temperatures, partial conversion occurs, whereas at higher values the production shifts towards gases and char. In the present study, the maximum total biocrude yield was obtained at 350 °C, but the peak of its light fraction was achieved at 370 °C, indicating that higher temperatures are needed in order to optimize the conversion of this particular lignin-rich material.

3.4. Elemental Analysis and Higher Heating Value

With respect to the elemental analysis of the LRS (Table 2), both light and heavy biocrude reported an increase in the C and H content and a decrease in O and ash concentration, confirming the energy densification effect of the process. The as-received elemental analysis of biocrude 1 and 2 is reported in Appendix D (Table A3 and Table A4). In general, a lower C content and a higher H and O content characterize the light biocrude fraction. These values are in line with literature: Arturi et al. [30] performed batch HTL of Kraft lignin at 300 °C, 15 min, 6% lignin concentration with the addition of 1.6% of K2CO3 and obtained a biocrude with 69.9% and 23.6% w/w (d.b.) of carbon and oxygen content, respectively. The feedstock, the two biocrudes and the solid residues CHO compositions are given in the van Krevelen diagram of Figure 9. The light biocrudes have a wider range of H/C and O/C molar ratios with changing reaction conditions, while the heavy biocrudes are less dispersed, having an H/C comprised between 1.10 and 1.25 and an O/C between 0.25 and 0.30. The solid residues are the products that mostly differ from the LRS, having O/C ratios similar to BC2 but lower H/C. The H/C and O/C values of the BC2 obtained in this study are in line with those reported in the review of Ramirez, Brown and Rainey [35], concerning HTL of lignocellulosic biomass. The decrease in the O/C and the increase in the H/C ratio of BC1 with respect to the feedstock suggest that the production of light biocrude was mainly due to decarboxylation rather than dehydration, which, on the contrary, was more evident for the production of BC2 and the solid residues.
A significant energy densification effect was achieved through the HTL treatment: the higher heating values of the biocrudes ranged between 24.9 and 29.5 MJ kg−1 (see Table A6 in Appendix D). Although rather similar values were observed, HHVs of heavy biocrudes were generally higher than those of light ones. The HHV of the total biocrude was determined as a yield-based weight-average from that of BC1 and BC2. The maximum increase with respect to the feedstock (27%) was achieved at 350 °C, 5 min, 10%, the same operating condition, which produced the maximum amount of total biocrude at a B/W of 10%. When BC1 and BC2 are considered separately, their yields and energy densifications, in terms of calorific value, have contrasting trends. Indeed, the yield of BC1 increases with severity, while that of BC2 decreases. The opposite is shown for the HHV: that of BC1 nearly decreases, while that of BC2 increases with severity (Figure 10). However, considering the total biocrude as the sum of BC1 and BC2, both yield and HHV reach a maximum at the same condition, i.e., 350 °C, 5 min, 10%, as the HHV of total biocrude is evaluated as a yield-based weight-average from that of BC1 and BC2.
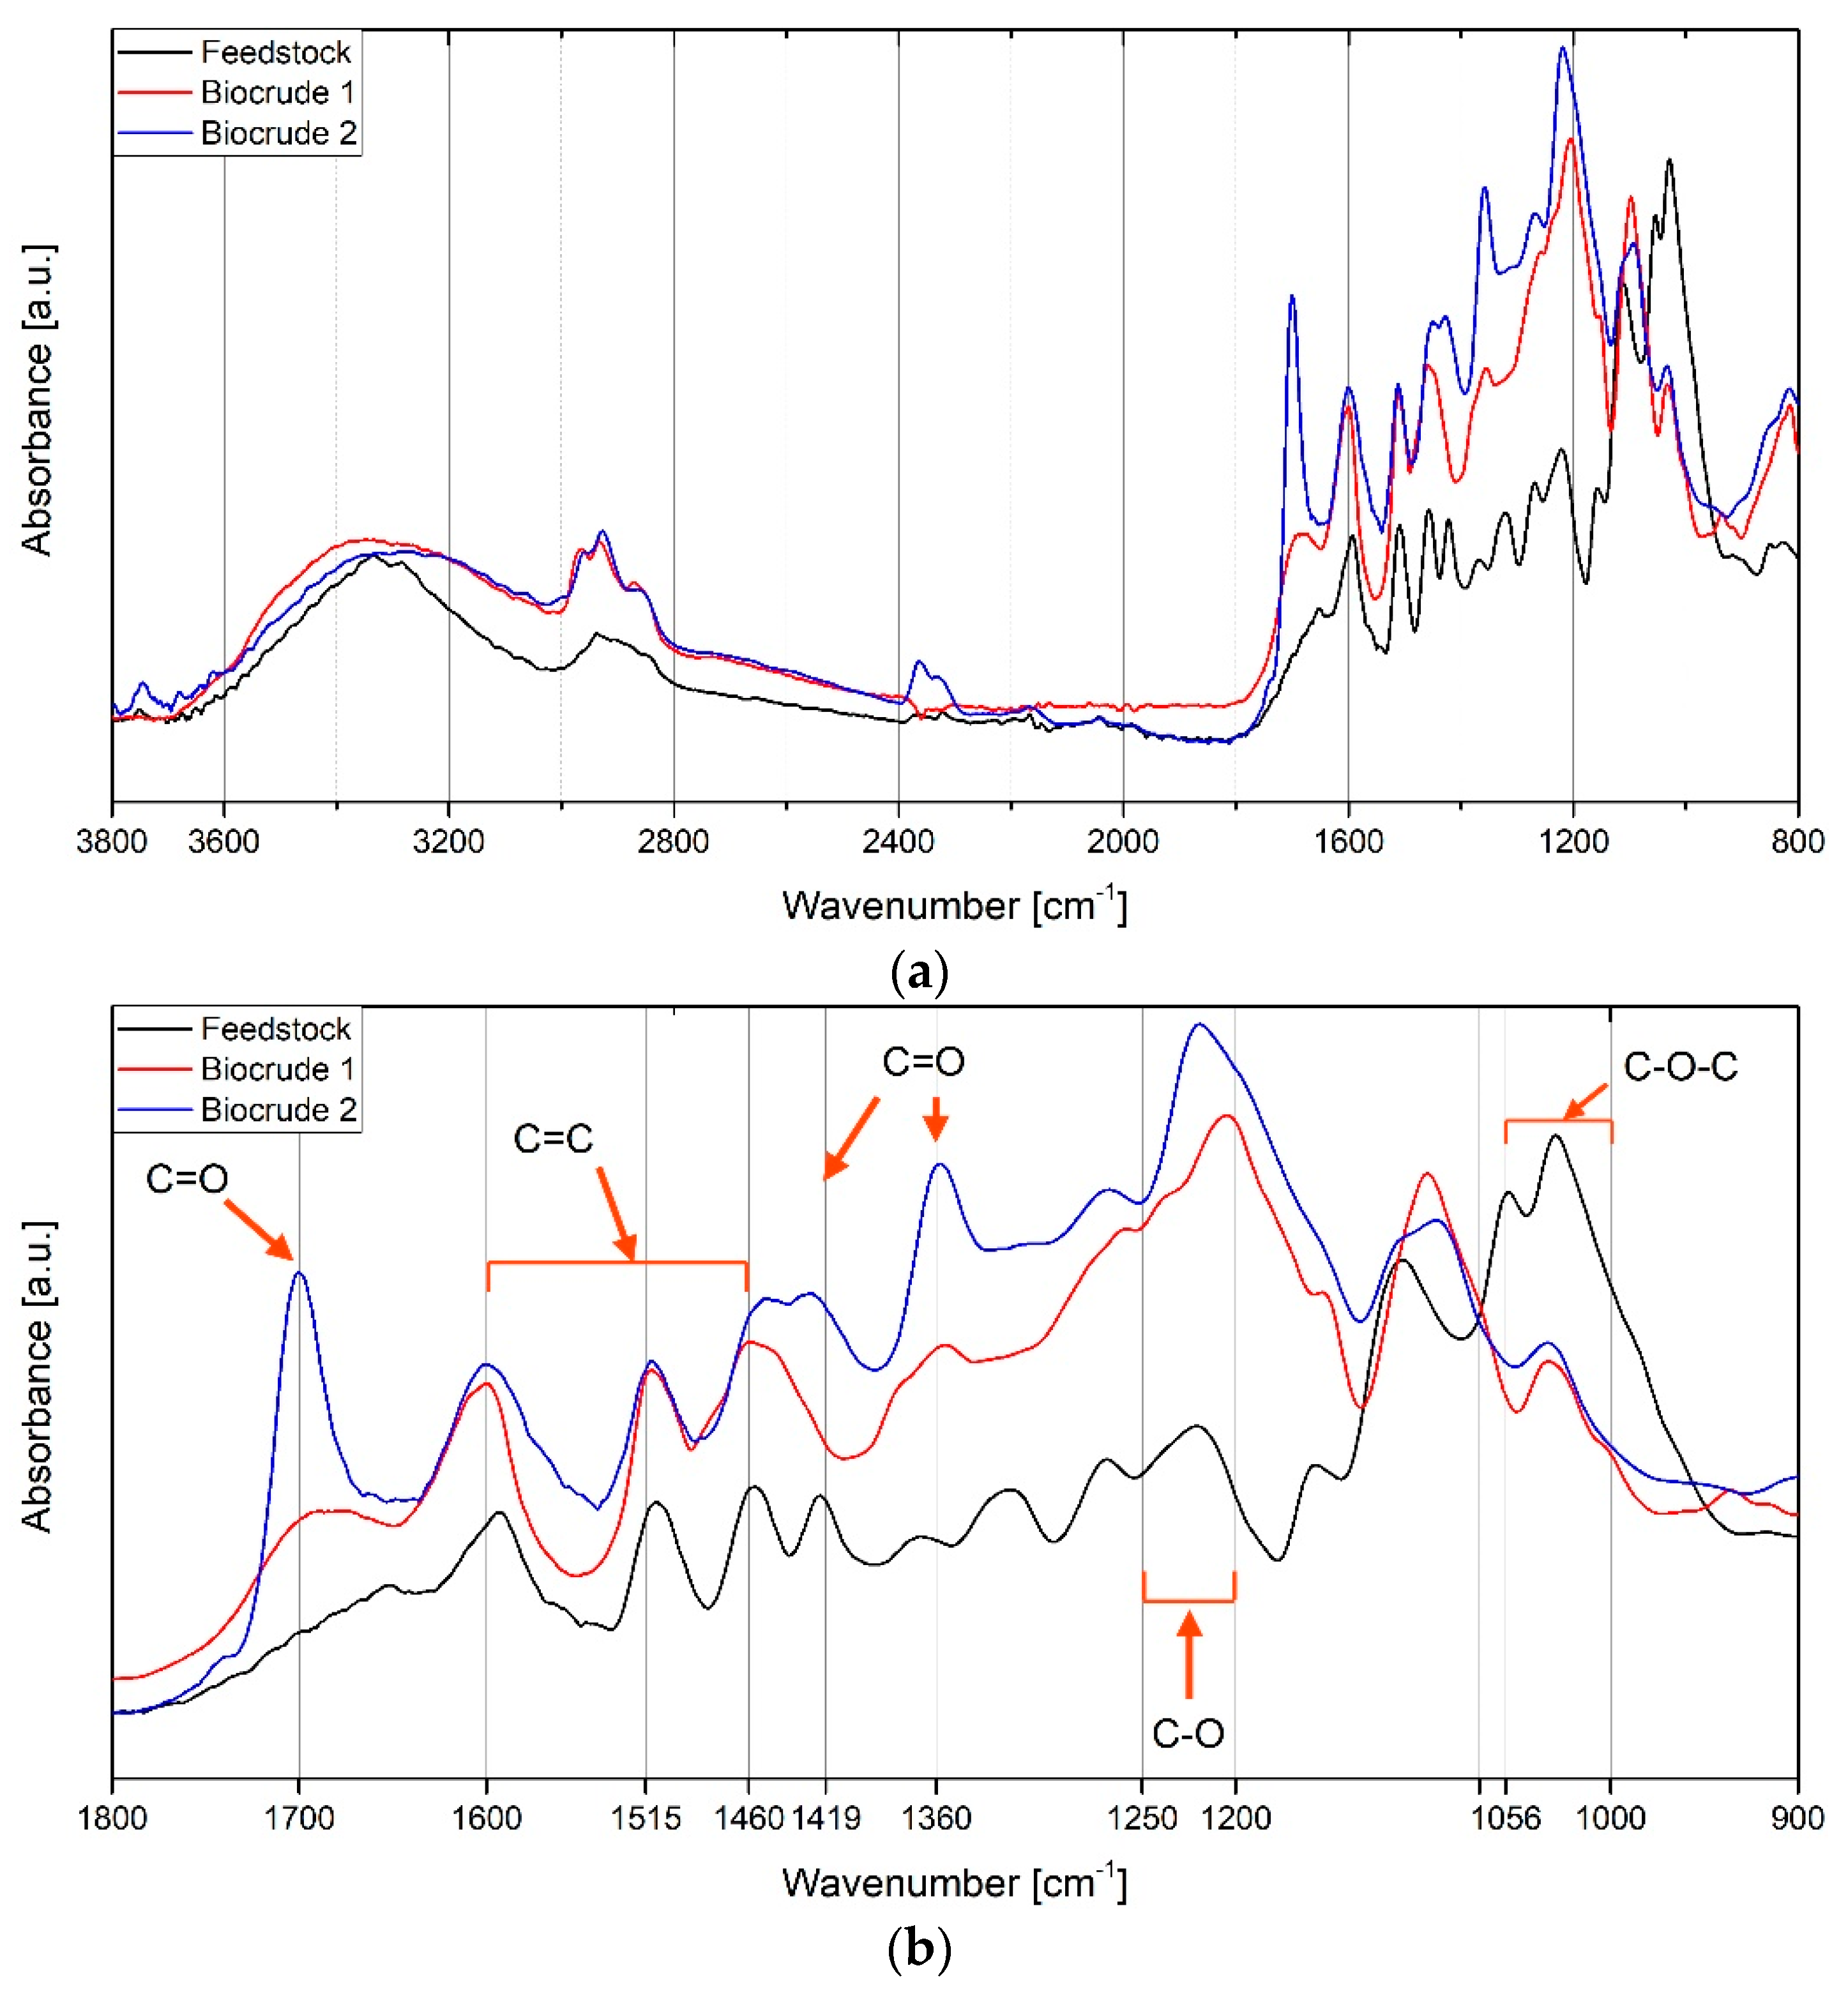
3.5. Carbon Balance

Figure 11 shows the carbon balance from the experiments set in the DOE and those carried out at 370 °C, 5 min, 10% and 20%. The balance was reasonably close, ranging from 83% to 108%, with an average value of 92%. The reasons behind this slight underestimated, or in one case, overestimated closure has to be addressed to the approximation of gas composition and to the propagation of errors through products collection and analysis. The majority of the carbon from the lignin-rich stream is retained in the biocrude (from 53.8% to 77.6%). At a low temperature, in general, it is mainly recovered in the heavy biocrude (from 40.9% to 62.3%), while at higher values, especially at 370 °C, it is largely retained in BC1. The carbon ending in the solid residue is not negligible, ranging from 13.0% to 23.6%, indicating that this product can still represent a valuable resource. The percentage of the feedstock carbon retained in the gas phase is the lowest among all products, which is estimated to lay between 1.0% and 3.1%, while a percentage range of 4.6%–11.3% is trapped in the aqueous phase in form of WSO.

3.6. FTIR Analysis

FTIR spectra of the LRS, BC1 and BC2 were qualitatively analyzed in order to evaluate functional moieties modifications after the HTL treatment (Figure 12). If compared with the feedstock, biocrudes exhibit a decrease in intensity at 1000–1070 cm−1, along with the loss of a peak at 1056 cm−1. This is probably due to breaking the β–O–4 or/and α–O–4 ether bonds of lignin, as also confirmed by other studies [20,36,37], suggesting that the feedstock underwent to hydrolysis depolymerization [10,20]. The macromolecular lignin backbone is in fact preferentially fragmented by ether bonds, which can be more easily broken than the C-C linkages through hydrolysis reactions [10]. The two biocrudes show only slight differences. The presence of a relevant peak in the BC2 spectrum around 1700 cm−1, typical of νC=O [20,36,37,38,39], is presumably related to the presence of acetone residues, confirmed by the peaks around 1360 and 1419 cm−1. The peaks in the region of aromatics, typical of the lignin structure, around 1600, 1515 and 1460 cm−1 [36,37], are always present in the three samples, suggesting that the lignin aromatic rings were, in general, preserved during HTL. An enhancement of the intensity around 1250–1200 cm−1 is probably related to guaiacols and mainly syringols [40], first products of lignin depolymerization [10].

3.7. Molecular Weight Analysis

In order to gain further insight on differences between the light and the heavy biocrude, their molecular weight (or molar mass) was evaluated by gel permeation chromatography (GPC). The weight-average molecular weight (Mw), the number-average molecular weight (Mn) and the polydispersity index (PDI = Mw/Mn) are reported in Appendix E (Table A7). In addition, it was attempted to determine the average molecular weight of the lignin-rich stream, but only ~10% of this was soluble in THF (ambient temperature) and therefore this value was not estimated. Differently, the biocrude samples were completely THF-soluble and, as expected, the molar masses of the light biocrudes were far lower than the ones of the BC2. The former is comprised between 390 and 490 g mol−1, while the latter range between 1030 and 1400 g mol−1. The values of Mw at 10% and 20% B/W for BC1, BC2 and total biocrude are shown in Figure 13. The Mw of the total biocrude was determined as a yield-based weight-average from that of BC1 and BC2. Concerning BC1, a higher B/W, in general, produces a higher molar mass. An increase with residence time is shown at 300 °C, while an opposite behavior is reported at 350 °C. A maximum is reached at 350 °C, 5 min, both at 10% and 20% w/w of B/W, though the latter is subjected to high standard deviation, and the minimum values are reached at 370 °C (400 and 391 g mol−1, respectively). Despite the complex trend of the molecular weight of BC2, the Mw of the total biocrude clearly decreases with temperature and time, changing from 1146 to 565 g mol−1, indicating that a higher extent of depolymerization occurred at harsher reaction conditions.
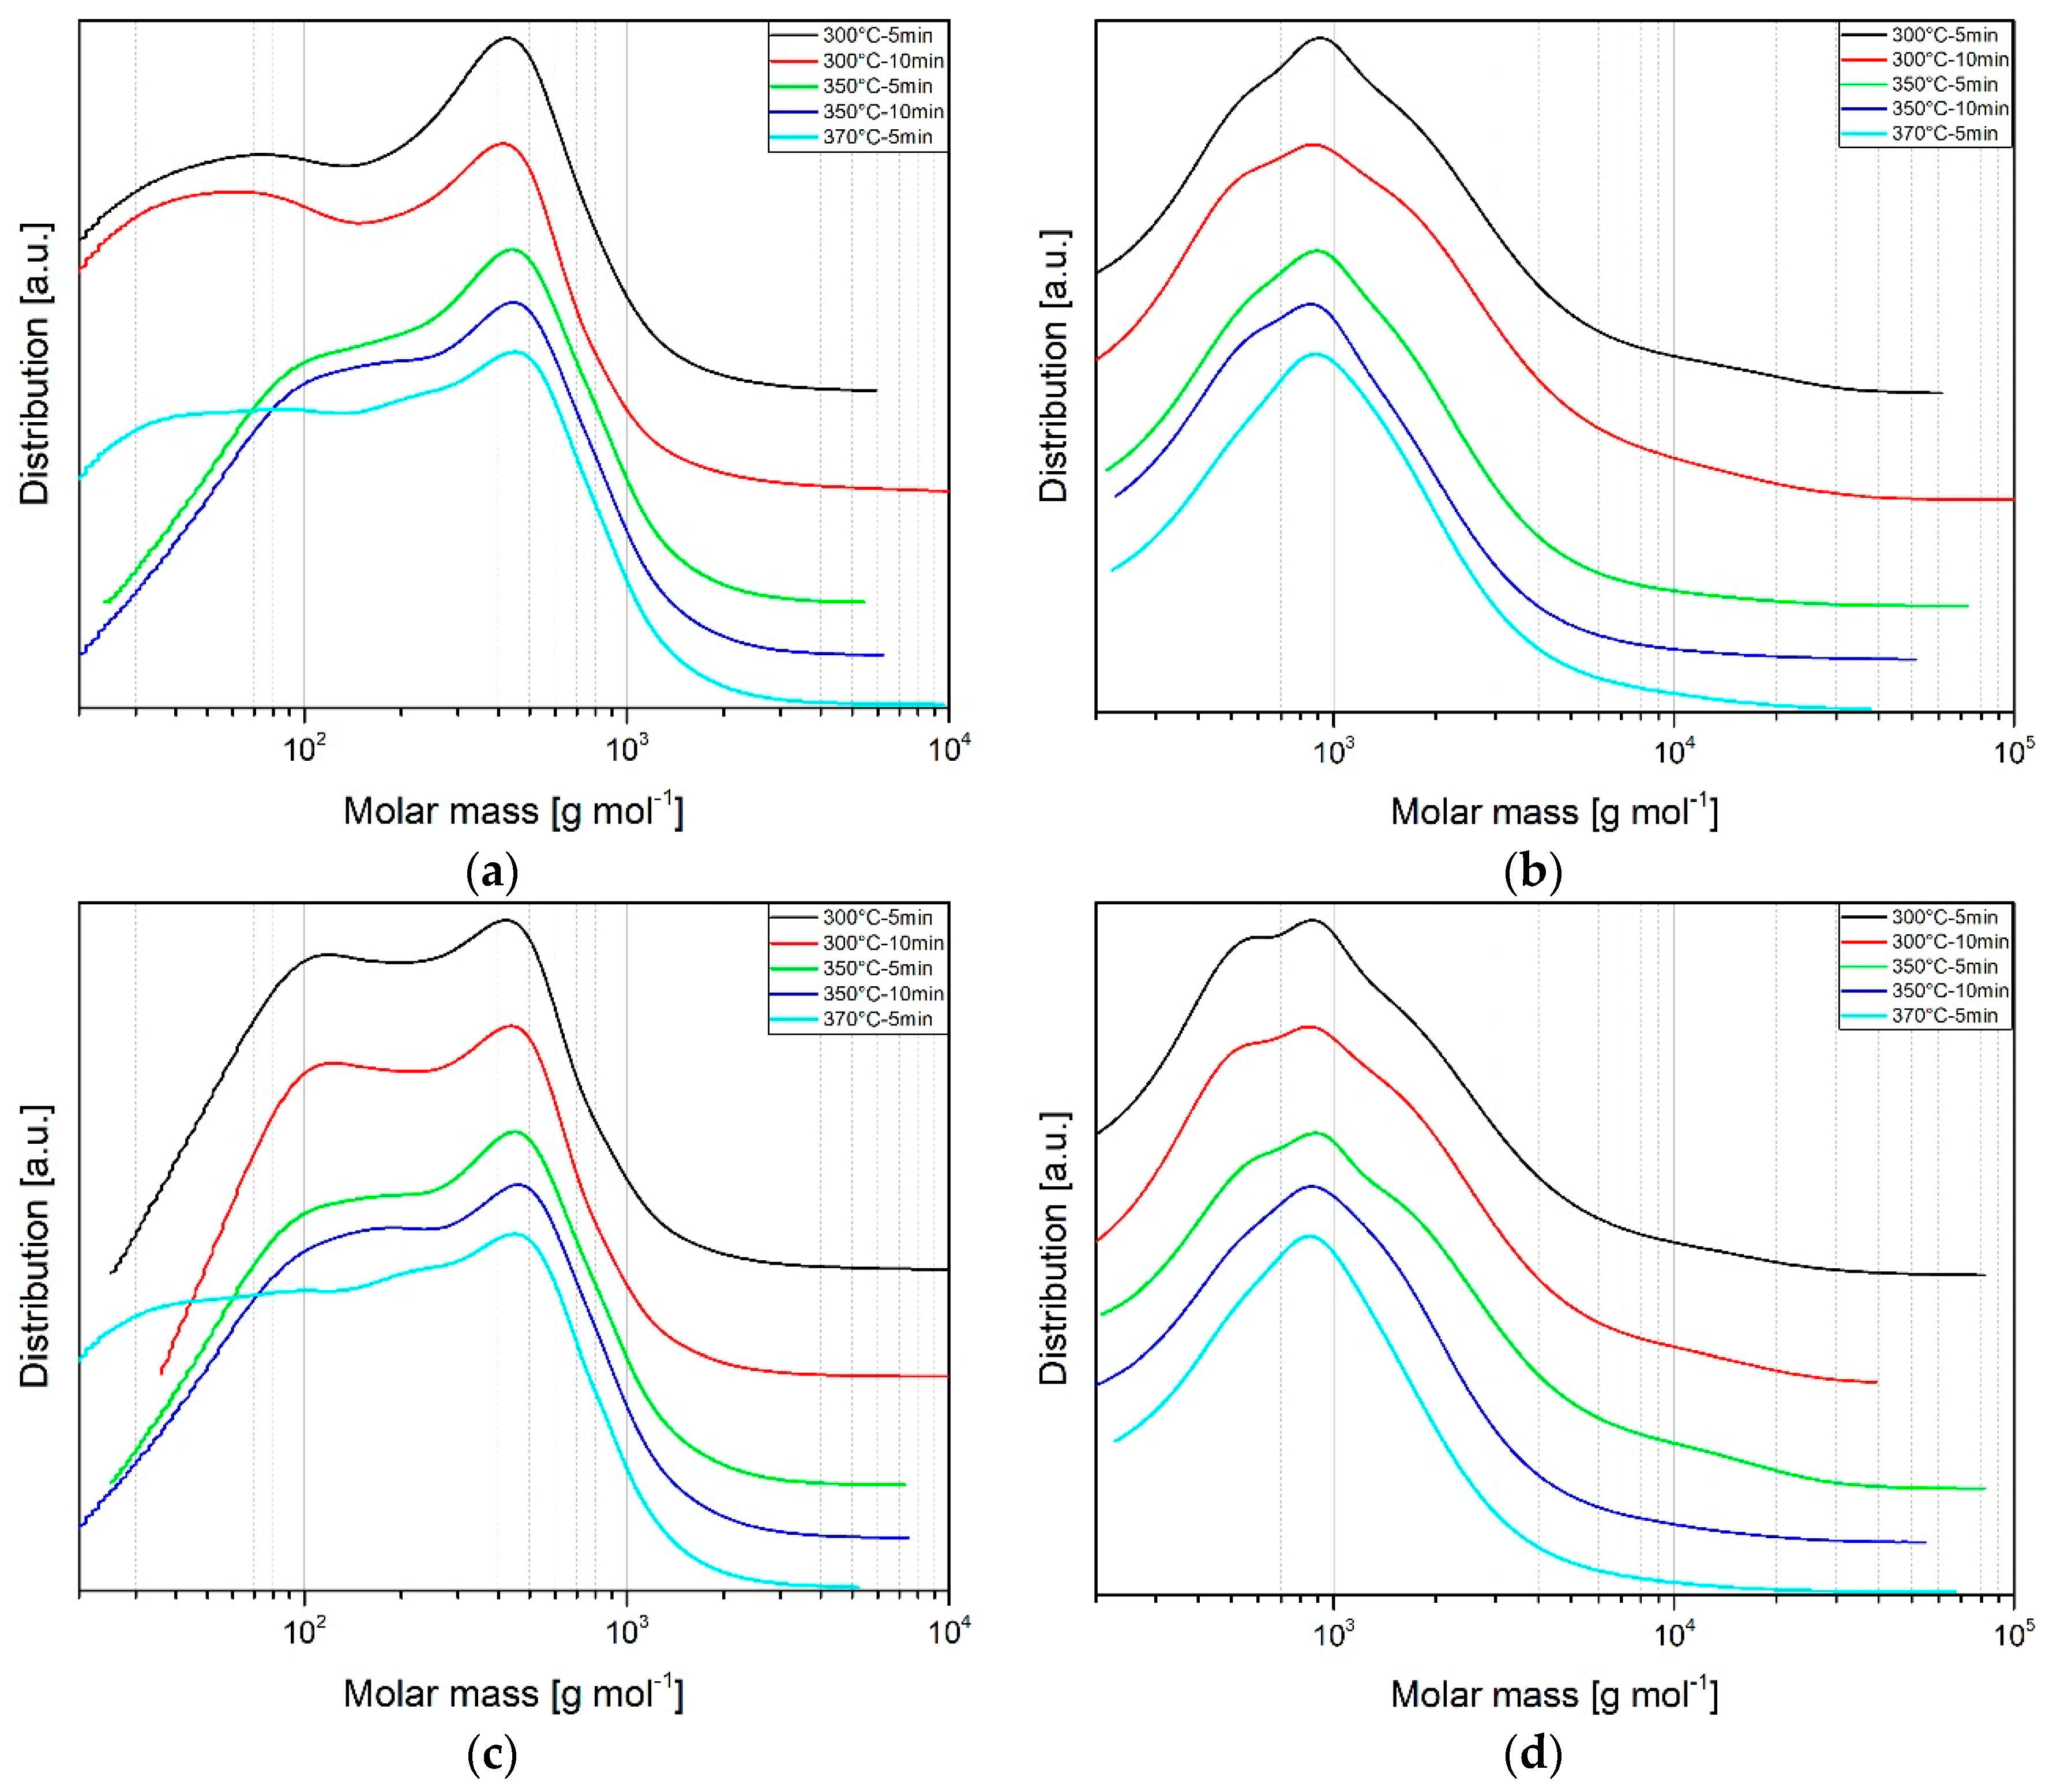
Furthermore, it is interesting to look at the effect of reaction conditions on the molar mass distributions (Figure 14). The shape of the distribution is only slightly altered by changing residence time at fixed temperature and B/W but greatly changes with temperature, suggesting the latter to be a more influencing parameter, at least at the investigated reaction conditions. Concerning the light biocrude, at 300 °C and 10%, there is a contribution of low weight compounds (between 40 and 100 g mol−1), which disappears at 350 °C and reappears, even with a slightly different shape, at 370 °C, confirming the presence of a maximum. On the contrary, the molar masses of the heavy biocrudes are more homogeneous, as confirmed by the lower PDI. Considering the BC1 samples obtained at a B/W of 20%, at 300 °C they still exhibit a low-molecular-weight peak, but, in this case, it is narrower and shifted towards higher values, precisely between 100 and 200 g mol−1. The shapes of the distributions of samples at 350 and 370 °C are more similar to the ones of the 10% case. The distributions of BC2 are comparable to those obtained at 10%, only a more marked hump between 500 and 600 g mol−1 is present in the samples obtained at 300 °C.
These findings, along with the FTIR results, show that LRS was effectively depolymerized during the HTL treatment, even if without any alkali catalyst or capping agent and with far lower residence time than commonly reported in lignin depolymerization experiments, where the reaction time is generally extended up to several tens of minutes or hours [20,21,29,41].

4. Conclusions

In this work, hydrothermal liquefaction of lignin-rich stream (LRS) from a demo-scale lignocellulosic ethanol plant was investigated without the use of any catalyst or capping agent, recovering two biocrude fractions, a light (BC1) and a heavy one (BC2). Batch lab-scale experiments were carried out and two different collection procedures were developed and compared in terms of yields, biocrude and aqueous phase composition. When performing lab-scale experiments, the use of extraction solvents is somehow mandatory, due to technical limitations related to the small size of reactors, and it was demonstrated here that the collection procedure directly affects yields and products composition. Thus, particular attention should be given when comparing the results from different studies. Indeed, if the aqueous phase is not separated prior to biocrude extraction, a larger amount of biocrude is recovered. On the other hand, removing the process water before biocrude recovery allows for a more suitable comparison with an industrial/continuous process, where the biocrude will be reasonably separated from the water by gravity. Moreover, it was statistically demonstrated that, at the investigated reaction conditions, the most significant factor influencing light, heavy and total biocrudes yield was the reaction temperature. Residence time was significant only as regards the yield of BC1 and BC2, while the biomass-to-water mass ratio (B/W) significantly affected only the BC2 and total biocrude yields by its interaction with temperature. The maximum total biocrude yield (65.7% w/w) was achieved at 300 °C, 10 min, 20% while the maximum yield of the light fraction (41.7% w/w) was achieved at 370 °C, 15 min, 10%. These results suggest that the conversion process can be optimized in different ways, depending on the characteristics or on the amount of the biocrude to be obtained. Another interesting result in biorefinery perspective is that the HTL process increased the feedstock energy density up to 27%. The elemental analysis suggests that the light biocrude was mainly produced by decarboxylation reactions rather than dehydration, which was more evident for BC2 and the solid residue. The carbon balance indicated that only a low amount of carbon from the LRS ended up in the aqueous phase as water-soluble organics and its major part was retained in the biocrude (up to 77.6%). At low temperatures, carbon is particularly concentrated in the heavy fraction, while at higher temperatures it moved to the light one (up to 42.2%). The FTIR analysis showed that the lignin aromatic structure was preserved in the two biocrudes, showing that the feedstock was mainly subjected to hydrolysis depolymerization. Indeed, the analysis of the molecular weight confirmed this statement, indicating that a consistent fractionation occurred, especially favored by high temperatures.
The HTL experiments herein reported effectively depolymerized the lignin matrix, preserved the aromatic structure of the feedstock and made available phenolic compounds that are valuable precursors of fuel and chemicals, for further separation, purification and processing. It was therefore shown that LRS has the potential of being a source for valuable chemical intermediates and hydrothermal liquefaction can represent a promising technology for the conversion of this high-moist co-product.

Author Contributions

Conceptualization, A.M.R.; Formal analysis, E.M., S.D. and G.L.; Investigation, E.M., S.D. and G.L.; Methodology, A.M.R. and D.C.; Supervision, D.C.; Validation, A.M.R. and D.C.; Visualization, E.M.; Writing—original draft, E.M.; Writing—review & editing, L.R. and D.C.

Funding

This study was funded by the European Union’s Horizon 2020 research and innovation program, project Heat-to-Fuel, under Grant Agreement number 764675.

Acknowledgments

Authors wish to acknowledge Lorenzo Bettucci for his contribution in laboratory analysis and Alberto Bini for his contribution in performing the HTL experiments, TOC analyses, data collection and visualization.

Conflicts of Interest

The authors declare no conflict of interest.

Appendix A

This appendix provides details on which basis the solvent for the extraction of the light biocrude (BC1) was chosen.
The multi-step solvent extraction method was applied by many authors [14,21,30,42,43,44,45,46,47]. Usually, the first solvent needs to be immiscible in water in order to be easily separated from the aqueous phase. On the other hand, the secondary solvent must dissolve most of the higher molecular weight organic compounds in order to maximize the collections of biocrude. The total yield of biocrude is an over-estimation of the real biocrude obtainable in a scaled-up continuous plant. The maximization of the biocrude yield is necessary on this batch lab-scale bench in order to collect a higher amount of material and facilitate its characterization analysis.
The composition of biocrude obtained from HTL of lignin is known to be mainly composed of aromatic oxygenated compounds (e.g., phenols, methoxyphenols) [30]. Since these classes of compounds have the peculiarity to be polar, the choice of the solvent has fallen on those with similar polarity. The three selected solvents were diethyl ether (DEE), dichloromethane (DCM) and dimethyl ketone (DMK or acetone). The former two were chosen for dissolving the lighter organic compounds since they are polar and slightly miscible in water; while acetone was selected for the heavier fraction dissolution. DEE and DCM have been used for the biocrude extraction in many works, some examples are reported in Reference [14,30,43] and References [44,45,46,47] respectively. As extraction solvent for the heavy biocrude, DMK was chosen only on literature guidelines [21,42,46], as BC2 is composed of complex high-molecular aromatic oxygenated polymers, which are not possible to be characterized with the same analytical techniques applied on the light biocrude and due to its low toxicity. THF and methanol are other suitable candidates for BC2 extraction [15,30,42,48,49].
The choice of the extraction solvent was assessed in Procedure 1. The comparison of the GC-detectable compounds in the BC1 extracted with DCM and DEE is reported in Table A1, while the quantitative comparison by GC-FID is shown in Table A2.
The identification and quantification of the different compound classes were carried out in a gas-chromatograph GC-2010 (Shimadzu) equipped with a mass spectrometer GCMS-QP2010 GC 2010 Plus (Shimadzu) and a GC-FID GC 2010 Plus (Shimadzu), both equipped with ZB 5HT Inferno (Zebron) columns (30 m length, internal diameter 0.25 mm, film diameter 0.25 μm). In particular, the GC-MS apparatus was used to investigate the qualitative composition of the sample, comparing the spectrum with a NIST 17 library; GC-FID was used for the quantitative analysis of the selected compounds after a 4-point calibration with pure molecular standards and using o-terphenyl as an internal standard. The analysis was performed with a column flow of 2.02 mL min−1 for GC- MS and 3.17 mL min−1 in GC- FID, with an initial temperature of 40 °C (holding time 10 min), increased to 200 °C (heating rate 8 °C min−1, holding time 10 min) and then to 280 °C (heating rate 10 °C min−1, holding time 30 min).
Table A1. Comparison of GC-MS identified compounds between DCM and DEE-solubles in BC1 (experiments carried out at 300 °C-10 min-10% with Procedure 1).
Compound ClassDCM-SolublesDEE-Solubles
Acids-Acetic acid
-Propionic acid
-Isovaleric acid
KetonesCyclopentanone2-Cyclopenten-1-one
2-Cyclopenten-1-one2,3-Dimethyl-2-cyclopenten-1-one
2-Methyl-2-cyclopenten-1-one3-Ethyl-2-hydroxy-2-cyclopenten-1-one
3-Ethyl-2-hydroxy-2-cyclopenten-1-oneAcetoin
AcetoinAcetovanillone
AcetosyringoneAcetosyringone
DesaspidinolDesaspidinol
AldehydesVanillinVanillin
SyringaldehydeSyringaldehyde
PhenolsPhenolPhenol
MethoxyphenolsSyringolSyringol
MethoxyeugenolMethoxyeugenol
GuaiacolGuaiacol
CreosolCreosol
4-Propylguaiacol4-Propylguaiacol
4-Ethylguaiacol4-Ethylguaiacol
-Eugenol
-Isoeugenol
Table A2. Comparison of GC-FID quantification between DCM and DEE-soluble compounds in BC1 (experiment carried out at 300 °C, 10 min, 10% with Procedure 1).
Compound ClassConcentration (µg mL−1)
DCM-SolublesDEE-Solubles
Acids0.283.09
Ketones0.050.06
Aldehydes0.170.29
Phenols3.497.28
Methoxyphenols4.047.19
Total8.0317.9
The GC-MS qualitative analysis shows that by using DEE as extraction solvent it is possible to identify more compounds with respect to DCM. Moreover, the quantification by GC-FID in the DEE sample gives a total value that is more than double than in the sample collected via DCM. However, with the DCM extraction, the yield of BC1 and BC2 was, respectively 33.4% and 32.8% w/w (d.b.), while in the case of DEE they are 12.3 and 36.3% w/w (d.b.). Dichloromethane is able to extract a higher amount of heavier compounds that are not detectable in GC, leading to a decrease in concentration of the lighter quantifiable organics. After this consideration, DEE was chosen.

Appendix B

This appendix provides details on the effects of temperature, time, biomass-to-water mass ratio and their interactions on BC1, BC2 and total biocrude yield.
Figure A1a shows that, as far as the light biocrude yield is concerned, the temperature is the most influencing parameter, followed by time and B/W: an increase in the value of these parameters leads to an increase in the BC1 yield. Figure A1b shows the influence of the interaction of the process parameters: only at 350 °C and 5 min the effect of B/W was negligible.
Figure A1. Influence of operating parameters on the yield of biocrude 1: main effects plot (a) and interaction effects plot (b).
Energies 12 00723 g0a1aEnergies 12 00723 g0a1b
Similarly, Figure A2 reports the influence of the operating parameters and their interactions on the yield of BC2. Again, temperature and time are the most influencing factors, but, in this case, along with their interactions, they negatively affect the yield, except for B/W, when the temperature is 300 °C or the time is 10 min.
Figure A2. Influence of operating parameters on the yield of biocrude 2: main effects plot (a) and interaction effects plot (b).
Energies 12 00723 g0a2aEnergies 12 00723 g0a2b
Concerning total biocrude mass yield (Figure A3), an increase in temperature and time leads to a decrease in yield, as for BC2, but B/W imparts an opposite effect, behaving like in the BC1 case. Consequently, the interactions effects are more complex and the total biocrude yield increases with B/W when the temperature is 300 °C or when the residence time is 10 min. It slightly increases with temperature when B/W is 10% w/w and is nearly unaffected by time when B/W is 20% w/w.
Figure A3. Influence of operating parameters on total biocrude yield: main effects plot (a) and interaction effects plot (b).
Energies 12 00723 g0a3aEnergies 12 00723 g0a3b

Appendix C

This appendix provides details on the method adopted for the TOC correction, eliminating the contribution of the DEE dissolved in the aqueous samples collected with Procedure 1.
  • The TOC and the carbon content of the HPLC-detected compounds ( C H P L C ) was determined for the aqueous phase of the experiment whose products were collected with Procedure 2 (350 °C, 10 min, 10%) and thus not contaminated with DEE
  • The carbon content of the unknown water-soluble species ( C u n k n o w n ) was evaluated by the difference
  • By supposing the ratio between C u n k n o w n and C H P L C to be constant at different HTL conditions and collection procedures, the carbon content due to DEE in the aqueous phase from experiments whose products were collected with Procedure 1 ( C D E E ) was evaluated according to Equation (A1)
    C D E E = T O C C H P L C [ 1 + ( C u n k n o w n C H P L C ) P r o c . 2 ]
  • The corrected TOC was determined by subtracting C D E E

Appendix D

This appendix provides details on the biocrudes’ elemental analysis and on the validation of the Channiwala and Parikh equation for the evaluation of the HHV of the BC1 and BC2.
Table A3. Elemental composition of light biocrude fraction (% w/w, as received). Absolute standard deviation, where available, is reported in brackets.
Reaction ConditionBiocrude 1
CHNOAsh
300 °C, 5 min, 10%65.6 (0.3)7.35 (0.03)0.692 (0.028)25.9 (n.d.)0.501 (n.d.)
300 °C, 5 min, 20%61.4 (n.d.)7.07 (n.d.)0.687 (n.d.)30.6 (n.d.)0.230 (n.d.)
300 °C, 10 min, 10%60.6 (2.5)7.20 (0.15)1.11 (0.33)30.6 (n.d.)0.501 (n.d.)
300° C, 10 min, 20%62.3 (n.d.)7.49 (n.d.)0.830 (n.d.)29.1 (n.d.)0.287 (n.d.)
350 °C, 5 min, 10%67.2 (0.6)7.15 (0.04)0.683 (0.002)25.0 (n.d.)(n.d.)
350 °C, 5 min, 20%63.9 (0.2)7.40 (0.04)0.659 (0.015)28.0 (n.d.)0.0108 (n.d.)
350 °C, 10 min, 10%64.2 (0.4)7.51 (0.07)0.930 (0.031)27.3 (n.d.)0.0433 (n.d.)
350 °C, 10 min, 20%62.9 (0.1)7.25 (0.02)0.719 (0.008)29.1 (n.d.)0.00113 (n.d.)
370 °C, 5 min, 10%57.1 (1.0)7.29 (0.04)0.868 (0.073)34.7 (n.d.)0.0160 (n.d.)
370 °C, 5 min, 20%64.2 (1.2)7.51 (0.03)0.930 (0.018)27.3 (n.d.)0.0143 (n.d.)
Table A4. Elemental composition of heavy biocrude fraction (% w/w, as received). Absolute standard deviation, where available, is reported in brackets.
Reaction ConditionBiocrude 2
CHNOAsh
300 °C, 5 min, 10%65.9 (0.6)6.77 (0.09)0.847 (0.043)26.4 (n.d.)0.136 (n.d.)
300 °C, 5 min, 20%66.7 (0.1)6.42 (0.01)0.948 (0.013)25.6 (n.d.)0.146 (n.d.)
300 °C, 10 min, 10%67.1 (0.2)6.91 (0.02)1.13 (0.03)24.9 (n.d.)0.0760 (n.d.)
300° C, 10 min, 20%67.0 (n.d.)6.98 (n.d.)0.860 (n.d.)25.0 (n.d.)0.138 (n.d.)
350 °C, 5 min, 10%68.3 (0.4)6.51 (0.01)1.07 (0.03)24.0 (n.d.)0.124 (n.d.)
350 °C, 5 min, 20%69.2 (0.7)6.32 (0.10)1.13 (0.03)23.2 (n.d.)0.122 (n.d.)
350 °C, 10 min, 10%68.9 (0.4)6.69 (0.06)1.110 (0.001)23.1 (n.d.)0.232 (n.d.)
350 °C, 10 min, 20%68.2 (0.3)4.23 (0.04)1.82 (0.03)25.5 (n.d.)0.240 (n.d.)
370 °C, 5 min, 10%68.0 (0.5)6.61 (0.018)1.28 (0.02)23.7 (n.d.)0.457 (n.d.)
370 °C, 5 min, 20%67.1 (0.2)6.99 (0.15)1.278 (0.001)24.1 (n.d.)0.470 (n.d.)
Because of the low amount of material produced in each experiment, the higher heating value of the BC1 and BC2 was determined by the Channiwala and Parikh unified correlation [22]:
HHV = 0.3491C + 1.1783H + 0.1005S − 0.1034O − 0.0151N − 0.0211Ash,
where C, H, O, N, S and Ash respectively represents carbon, hydrogen, oxygen, nitrogen, sulphur and ash content of the sample expressed in mass percentages on dry basis. In the present evaluation, the sulphur content-term was neglected as the LRS has a very limited amount of S (0.2% w/w, d.b.). In order to validate Equation (A2), the HHV of a sample of BC1 and BC2 was measured according to UNI EN 14918 and this value was compared to the Dulong equation [50], which is a correlation widely used in many studies for HHV calculation of HTL biocrude [31,47,51,52]. The results are reported in Table A5: it can be depicted that Euation (A2) leads to a lower relative error (determined according to Equation (A3)).
Relative error = 100 × |(measured value − calculated value)|/measured value
Table A5. Measured and evaluated HHV of BC1 and BC2 samples produced at 350 °C-5 min-20% (Procedure 1) in MJ kg−1.
ValueBiocrude 1Biocrude 2
Measure28.4729.43
Dulong27.1728.72
Dulong relative error4.5%2.4%
Channiwala and Parikh28.1329.53
Channiwala and Parikh relative error1.2%0.3%
The HHV values calculated with A2 correlation for BC1, BC2 as well as the yield-based weight-average total biocrude are reported in Table A6 below:
Table A6. Higher heating value of the biocrude samples.
Reaction conditionHigher heating value (MJ kg−1)
Biocrude 1Biocrude 2Total biocrude
300 °C, 5 min, 10%28.928.328.4
300 °C, 5 min, 20%26.629.028.6
300 °C, 10 min, 10%26.528.227.8
300° C, 10 min, 20%27.529.028.6
350 °C, 5 min, 10%29.329.029.1
350 °C, 5 min, 20%28.129.528.9
350 °C, 10 min, 10%28.429.228.7
350 °C, 10 min, 20%27.526.127.0
370 °C, 5 min, 10%24.929.126.2
370 °C, 5 min, 20%28.429.228.6

Appendix E

In this appendix the GPC data are listed in terms of weight-average molecular weight (Mw), number-average molecular weight (Mn) and the polydispersity index (PDI = Mw/Mn) for BC1 and BC2 samples.
Table A7. Weight-average, number-average molar mass (in g mol−1) and a polydispersity index of BC1 and BC2; the absolute standard deviation is reported in brackets.
Reaction conditionBiocrude 1Biocrude 2
MwMnPDIMwMnPDI
300 °C, 5 min, 10%412 (2)128 (1)3.21332 (30)720 (8)1.8
300 °C, 5 min, 20%459 (13)204 (2)2.21243 (16)668 (9)1.9
300 °C, 10 min, 10%427 (2)101 (1)4.31359 (14)694 (6)2.0
300 °C, 10 min, 20%473 (13)232 (2)2.01217 (13)623 (2)2.0
350 °C, 5 min, 10%467 (3)223 (5)2.11147 (9)697 (10)1.6
350 °C, 5 min, 20%488 (41)265 (76)1.91397 (23)714 (10)2.0
350 °C, 10 min, 10%457 (2)213 (2)2.11030 (15)657 (20)1.6
350 °C, 10 min, 20%469 (3)222 (4)2.11142 (18)701 (9)1.6
370 °C, 5 min, 10%400 (0)105 (1)3.81151 (30)714 (8)1.6
370 °C, 5 min, 20%391 (2)107 (4)3.71029 (4)670 (27)1.5

References

  1. European Parliament Directive 2015/1513 of the European Parliament and of the Council of 9 September 2015 amending Directive 98/70/EC relating to the quality of petrol and diesel fuels and amending Directive 2009/28/EC on the promotion of the use of energy from renewable sou. Off. J. Eur. Union 2015, L239, 1–29.
  2. Bioenergy 2020+ GmbH IEA Task 39 Demo Plant Database. Available online: https://demoplants.bioenergy2020.eu/ (accessed on 12 December 2018).
  3. Balan, V.; Chiaramonti, D.; Kumar, S. Review of US and EU initiatives toward development, demonstration, and commercialization of lignocellulosic biofuels. Biofuels Bioprod. Biorefining 2013, 7, 732–759. [Google Scholar] [CrossRef] [Green Version]
  4. Farag, S.; Chaouki, J. Economics evaluation for on-site pyrolysis of kraft lignin to value-added chemicals. Bioresour. Technol. 2015, 175, 254–261. [Google Scholar] [CrossRef]
  5. Obydenkova, S.V.; Kouris, P.D.; Hensen, E.J.M.; Heeres, H.J.; Boot, M.D. Environmental economics of lignin derived transport fuels. Bioresour. Technol. 2017, 243, 589–599. [Google Scholar] [CrossRef]
  6. Porzio, G.F.; Prussi, M.; Chiaramonti, D.; Pari, L. Modelling lignocellulosic bioethanol from poplar: Estimation of the level of process integration, yield and potential for co-products. J. Clean. Prod. 2012, 34, 66–75. [Google Scholar] [CrossRef]
  7. Xu, C.; Arancon, R.A.D.; Labidi, J.; Luque, R. Lignin depolymerisation strategies: Towards valuable chemicals and fuels. Chem. Soc. Rev. 2014, 43, 7485–7500. [Google Scholar] [CrossRef]
  8. Cao, L.; Zhang, C.; Chen, H.; Tsang, D.C.W.; Luo, G.; Zhang, S.; Chen, J. Hydrothermal liquefaction of agricultural and forestry wastes: State-of-the-art review and future prospects. Bioresour. Technol. 2017, 245, 1184–1193. [Google Scholar] [CrossRef]
  9. Castello, D.; Pedersen, T.; Rosendahl, L. Continuous Hydrothermal Liquefaction of Biomass: A Critical Review. Energies 2018, 11, 3165. [Google Scholar] [CrossRef]
  10. Barbier, J.; Charon, N.; Dupassieux, N.; Loppinet-Serani, A.; Mahé, L.; Ponthus, J.; Courtiade, M.; Ducrozet, A.; Quoineaud, A.A.; Cansell, F. Hydrothermal conversion of lignin compounds. A detailed study of fragmentation and condensation reaction pathways. Biomass Bioenergy 2012, 46, 479–491. [Google Scholar] [CrossRef]
  11. Wahyudiono; Kanetake, T.; Sasaki, M.; Goto, M. Decomposition of a lignin model compound under hydrothermal conditions. Chem. Eng. Technol. 2007, 30, 1113–1122. [Google Scholar] [CrossRef]
  12. Zhang, B.; Huang, H.-J.; Ramaswamy, S. Reaction kinetics of the hydrothermal treatment of lignin. Appl. Biochem. Biotechnol. 2008, 147, 119–131. [Google Scholar] [CrossRef]
  13. Nguyen, T.D.H.; Maschietti, M.; Åmand, L.E.; Vamling, L.; Olausson, L.; Andersson, S.I.; Theliander, H. The effect of temperature on the catalytic conversion of Kraft lignin using near-critical water. Bioresour. Technol. 2014, 170, 196–203. [Google Scholar] [CrossRef] [Green Version]
  14. Pińkowska, H.; Wolak, P.; Złocińska, A. Hydrothermal decomposition of alkali lignin in sub- and supercritical water. Chem. Eng. J. 2012, 187, 410–414. [Google Scholar] [CrossRef]
  15. Saisu, M.; Sato, T.; Watanabe, M.; Adschiri, T.; Arai, K. Conversion of Lignin with Supercritical Water—Phenol Mixtures. Energy Fuels 2003, 17, 922–928. [Google Scholar] [CrossRef]
  16. Jensen, M.M.; Djajadi, D.T.; Torri, C.; Rasmussen, H.B.; Madsen, R.B.; Venturini, E.; Vassura, I.; Becker, J.; Iversen, B.B.; Meyer, A.S.; et al. Hydrothermal Liquefaction of Enzymatic Hydrolysis Lignin: Biomass Pretreatment Severity Affects Lignin Valorization. ACS Sustain. Chem. Eng. 2018, 6, 5940–5949. [Google Scholar] [CrossRef]
  17. Miliotti, E.; Casini, D.; Lotti, G.; Pennazzi, S.; Rizzo, A.M.; Chiaramonti, D. Hydrothermal Carbonization of Digestate: Characterization of solid and liquid products. In TC Biomass; Gas Technology Institute: Chicago, IL, USA, 2017. [Google Scholar]
  18. Toor, S.S.; Rosendahl, L.; Rudolf, A. Hydrothermal liquefaction of biomass: A review of subcritical water technologies. Energy 2011, 36, 2328–2342. [Google Scholar] [CrossRef]
  19. Peterson, A.A.; Vogel, F.; Lachance, R.P.; Fröling, M.; Antal, M.J., Jr.; Tester, J.W. Thermochemical biofuel production in hydrothermal media: A review of sub- and supercritical water technologies. Energy Environ. Sci. 2008, 1, 32–65. [Google Scholar] [CrossRef]
  20. Ahmad, Z.; Mahmood, N.; Yuan, Z.; Paleologou, M.; Xu, C. Effects of Process Parameters on Hydrolytic Treatment of Black Liquor for the Production of Low-Molecular-Weight Depolymerized Kraft Lignin. Molecules 2018, 23, 2464. [Google Scholar] [CrossRef]
  21. Cheng, S.; Wilks, C.; Yuan, Z.; Leitch, M.; Xu, C. (Charles) Hydrothermal degradation of alkali lignin to bio-phenolic compounds in sub/supercritical ethanol and water–ethanol co-solvent. Polym. Degrad. Stab. 2012, 97, 839–848. [Google Scholar] [CrossRef]
  22. Channiwala, S.A.; Parikh, P.P. A unified correlation for estimating HHV of solid, liquid and gaseous fuels. Fuel 2002, 81, 1051–1063. [Google Scholar] [CrossRef]
  23. Sluiter, A.; Ruiz, R.; Scarlata, C.; Sluiter, J.; Templeton, D. Determination of Extractives in Biomass: Laboratory Analytical Procedure (LAP); Issue Date 7/17/2005—42619.pdf. Technical Report NREL/TP-510-42619; NREL: Golden, Colorado, 2008; pp. 1–9. [Google Scholar]
  24. Sluiter, A.; Hames, B.; Ruiz, R.; Scarlata, C.; Sluiter, J.; Templeton, D.; Nrel, D.C. Determination of Structural Carbohydrates and Lignin in Biomass Determination of Structural Carbohydrates and Lignin in Biomass; Technical Report NREL/TP-510-42618; NREL: Golden, Colorado, 2011. [Google Scholar]
  25. Sluiter, A.; Hames, B.; Ruiz, R.O.; Scarlata, C.; Sluiter, J.; Templeton, D.; Energy, D.; Dötsch, A.; Severin, J.; Alt, W.; Galinski, E.a.; Kreft, J.-U. Determination of Ash in Biomass. Technical Report NREL/TP-510-42622; NREL: Golden, Colorado, 2008. [Google Scholar]
  26. Sluiter, A.; Hames, B.; Ruiz, R.; Scarlata, C.; Sluiter, J.; Templeton, D.; Nrel, D.C. Determination of Sugars, Byproducts, and Degradation Products in Liquid Fraction Process Samples, Technical Report NREL/TP-510-42623; NREL: Golden, Colorado, 2008. [Google Scholar]
  27. Kang, S.; Li, X.; Fan, J.; Chang, J. Hydrothermal conversion of lignin: A review. Renew. Sustain. Energy Rev. 2013, 27, 546–558. [Google Scholar] [CrossRef]
  28. Otromke, M.; White, R.J.; Sauer, J. Hydrothermal Base Catalyzed Depolymerization and Conversion of Technical Lignin—An Introductory Review. Carbon Resour. Convers. 2019, 2, 59–71. [Google Scholar] [CrossRef]
  29. Toledano, A.; Serrano, L.; Labidi, J. Improving base catalyzed lignin depolymerization by avoiding lignin repolymerization. Fuel 2014, 116, 617–624. [Google Scholar] [CrossRef]
  30. Arturi, K.R.; Strandgaard, M.; Nielsen, R.P.; Søgaard, E.G.; Maschietti, M. Hydrothermal liquefaction of lignin in near-critical water in a new batch reactor: Influence of phenol and temperature. J. Supercrit. Fluids 2017, 123, 28–39. [Google Scholar] [CrossRef]
  31. Li, Q.; Liu, D.; Hou, X.; Wu, P.; Song, L.; Yan, Z. Hydro-liquefaction of microcrystalline cellulose, xylan and industrial lignin in different supercritical solvents. Bioresour. Technol. 2016, 219, 281–288. [Google Scholar] [CrossRef]
  32. Orebom, A.; Verendel, J.J.; Samec, J.S.M. High Yields of Bio Oils from Hydrothermal Processing of Thin Black Liquor without the Use of Catalysts or Capping Agents. ACS Omega 2018, 3, 6757–6763. [Google Scholar] [CrossRef]
  33. Montgomery, D.C. Design and Analysis of Experiments, 5th ed.; Wiley: New York, NY, USA, 1997; ISBN 0471316490. [Google Scholar]
  34. Akhtar, J.; Amin, N.A.S. A review on process conditions for optimum bio-oil yield in hydrothermal liquefaction of biomass. Renew. Sustain. Energy Rev. 2011, 15, 1615–1624. [Google Scholar] [CrossRef]
  35. Ramirez, J.A.; Brown, R.J.; Rainey, T.J. A review of hydrothermal liquefaction bio-crude properties and prospects for upgrading to transportation fuels. Energies 2015, 8, 6765–6794. [Google Scholar] [CrossRef]
  36. Jiang, W.; Lyu, G.; Wu, S.; Lucia, L.A. Near-critical water hydrothermal transformation of industrial lignins to high value phenolics. J. Anal. Appl. Pyrolysis 2016, 120, 297–303. [Google Scholar] [CrossRef]
  37. Nazari, L.; Yuan, Z.; Souzanchi, S.; Ray, M.B.; Xu, C. Hydrothermal liquefaction of woody biomass in hot-compressed water: Catalyst screening and comprehensive characterization of bio-crude oils. Fuel 2015, 162, 74–83. [Google Scholar] [CrossRef]
  38. Bui, N.Q.; Fongarland, P.; Rataboul, F.; Dartiguelongue, C.; Charon, N.; Vallée, C.; Essayem, N. FTIR as a simple tool to quantify unconverted lignin from chars in biomass liquefaction process: Application to SC ethanol liquefaction of pine wood. Fuel Process. Technol. 2015, 134, 378–386. [Google Scholar] [CrossRef]
  39. Watanabe, M.; Kanaguri, Y.; Smith, R.L. Hydrothermal separation of lignin from bark of Japanese cedar. J. Supercrit. Fluids 2018, 133, 696–703. [Google Scholar] [CrossRef]
  40. Zhao, J.; Xiuwen, W.; Hu, J.; Liu, Q.; Shen, D.; Xiao, R. Thermal degradation of softwood lignin and hardwood lignin by TG-FTIR and Py-GC/MS. Polym. Degrad. Stab. 2014, 108, 133–138. [Google Scholar] [CrossRef]
  41. Okuda, K.; Umetsu, M.; Takami, S.; Adschiri, T. Disassembly of lignin and chemical recovery—Rapid depolymerization of lignin without char formation in water-phenol mixtures. Fuel Process. Technol. 2004, 85, 803–813. [Google Scholar] [CrossRef]
  42. Yang, X.; Lyu, H.; Chen, K.; Zhu, X.; Zhang, S.; Chen, J. Selective Extraction of Bio-oil from Hydrothermal Liquefaction of Salix psammophila by Organic Solvents with Different Polarities through Multistep Extraction Separation. BioResources 2014, 9, 5219–5233. [Google Scholar] [CrossRef]
  43. Nguyen Lyckeskog, H.; Mattsson, C.; Åmand, L.E.; Olausson, L.; Andersson, S.I.; Vamling, L.; Theliander, H. Storage Stability of Bio-oils Derived from the Catalytic Conversion of Softwood Kraft Lignin in Subcritical Water. Energy Fuels 2016, 30, 3097–3106. [Google Scholar] [CrossRef] [Green Version]
  44. Grigoras, I.F.; Stroe, R.E.; Sintamarean, I.M.; Rosendahl, L.A. Effect of biomass pretreatment on the product distribution and composition resulting from the hydrothermal liquefaction of short rotation coppice willow. Bioresour. Technol. 2017, 231, 116–123. [Google Scholar] [CrossRef]
  45. Villadsen, S.R.; Dithmer, L.; Forsberg, R.; Becker, J.; Rudolf, A.; Iversen, S.B.; Glasius, M. Development and Application of Chemical Analysis Methods for Investigation of Bio-Oils and Aqueous Phase from Hydrothermal Liquefaction of Biomass. Energy Fuels 2012, 26, 6988–6998. [Google Scholar] [CrossRef]
  46. Cheng, S.; D’cruz, I.; Wang, M.; Leitch, M.; Xu, C. (Charles) Highly Efficient Liquefaction of Woody Biomass in Hot-Compressed Alcohol−Water Co-solvents. Energy Fuels 2010, 24, 4659–4667. [Google Scholar] [CrossRef]
  47. Duan, P.; Savage, P.E. Hydrothermal Liquefaction of a Microalga with Heterogeneous Catalysts. Ind. Eng. Chem. Res. 2011, 50, 52–61. [Google Scholar] [CrossRef]
  48. Li, C.; Yang, X.; Zhang, Z.; Zhou, D.; Zhang, L.; Zhang, S.; Chen, J. Hydrothermal Liquefaction of Desert Shrub Salix psammophila to High Value-added Chemicals and Hydrochar with Recycled Processing Water. BioResources 2013, 8, 2981–2997. [Google Scholar] [CrossRef]
  49. Wahyudiono; Sasaki, M.; Goto, M. Recovery of phenolic compounds through the decomposition of lignin in near and supercritical water. Chem. Eng. Process. Process Intensif. 2008, 47, 1609–1619. [Google Scholar] [CrossRef]
  50. WA, S.; IH, G. Caloric value of coal. In Chemistry of Coal Utilization Vol. 1; Lowry, H., Ed.; Wiley: New York, NY, USA, 1945; p. 139. [Google Scholar]
  51. Biller, P.; Riley, R.; Ross, A.B. Catalytic hydrothermal processing of microalgae: Decomposition and upgrading of lipids. Bioresour. Technol. 2011, 102, 4841–4848. [Google Scholar] [CrossRef]
  52. Feng, S.; Yuan, Z.; Leitch, M.; Xu, C.C. Hydrothermal liquefaction of barks into bio-crude—Effects of species and ash content/composition. Fuel 2014, 116, 214–220. [Google Scholar] [CrossRef]
Figure 1. Scheme of Procedure 1 (a) and 2 (b) for products collection.
Energies 12 00723 g001
Figure 2. Products collected from a typical hydrothermal liquefaction (HTL) experiment in the micro-batch reactors: (a) light biocrude or BC1; (b) heavy biocrude or BC2; (c) aqueous phase with water-soluble organics (WSO); (d) solid residue.
Energies 12 00723 g002
Figure 3. Effect of the collection procedure on biocrude 1 composition by GC-MS analysis (a) and on aqueous phase composition by HPLC analysis (b) The experiment was performed at 350 °C, 10 min, 10%.
Energies 12 00723 g003aEnergies 12 00723 g003b
Figure 4. Dry-basis mass yields under different reaction conditions.
Energies 12 00723 g004
Figure 5. A normal plot of the standardized effects for BC1 yield.
Energies 12 00723 g005
Figure 6. Normal plot of the standardized effects for BC2 yield.
Energies 12 00723 g006
Figure 7. Normal plot of the standardized effects for total biocrude yield.
Energies 12 00723 g007
Figure 8. Effect of increased temperature and reaction time on products yield; error bars represent absolute standard deviation.
Energies 12 00723 g008
Figure 9. Van Krevelen diagram of lignin-rich stream (feedstock), BC1, BC2 and solid residue (char).
Energies 12 00723 g009
Figure 10. Higher heating value of light, heavy and total biocrude from the experiments carried out at 10% biomass-to-water mass ratio.
Energies 12 00723 g010
Figure 11. Carbon distribution among HTL products.
Energies 12 00723 g011
Figure 12. Infrared spectra of the LRS and light and heavy fraction of biocrude from the experiment carried out at 370 °C, 5 min, 20%: (a) entire spectra; (b) particular.
Energies 12 00723 g012
Figure 13. Weight-average molecular weight at different reaction conditions: (a) biocrude 1, (b) biocrude 2, (c) total biocrude. Error bars represent the absolute standard deviation.
Energies 12 00723 g013
Figure 14. Stacked molecular weight distribution of BC1 (left) and BC2 (right) from experiments carried out at 10% w/w (a,b) and 20% w/w (c,d).
Energies 12 00723 g014
Table 1. Operating parameters of the design of the experiments (DOE).
FactorLow LevelHigh Level
Temperature (°C)300350
Time (min)510
B/W (-)% w/w d.b. 11020
1 d.b.: dry basis.
Table 2. Characterization of the lignin-rich stream (w.b.: wet basis; d.b.: dry basis).
ParameterValue
Moisture (% w/w) w.b69.7
Ash (% w/w) d.b2.6
Volatile matter (% w/w) d.b.71.0
Fixed Carbon (% w/w) d.b26.4
Higher Heating Value (MJ kg−1)22.9
C (% w/w) d.b54.2
H (% w/w) d.b5.9
N (% w/w) d.b1.0
S (% w/w) d.b0.2
O (% w/w) d.b36.1
Lignin content (% w/w) d.b53.9
pH (-)4.4
Table 3. Results from the lignin content evaluation.
ParameterValue (% w/w) (d.b.)
Water extractives 113.62
Ethanol extractives 124.95
Total extractives38.57
Acid insoluble lignin52.51
Acid soluble lignin1.40
Lignin ashesb.q.l.
Total lignin53.91
Structural sugars2.14
Total94.62
1 Ash contribution included; b.q.l.: below the quantification limit.
Table 4. Effect of the collection procedure on measured yields of products—experiment performed at 350 °C, 10 min, 10%. Absolute standard deviation is given in brackets.
ProductYield (% w/w) d.b.
Procedure 1Procedure 2
Biocrude 129.31 (0.01)23.1 (1.7)
Biocrude 222.5 (6.4)17.1 (0.7)
Solid residue11.8 (0.2)12.7 (0.9)
WSO12.2 (n.d.)20.5 (n.d.)
Gas5.5 (0.9)5.5 (1.4)
n.d.: not determined.

