Evaluating the Impacts of ACP Management on the Energy Performance of Hydrothermal Liquefaction via Nutrient Recovery


1
Department of Civil and Environmental Engineering, Rowan University, 201 Mullica Hill Road, Glassboro, NJ 08028, USA
2
Department of Engineering Systems and Environment, University of Virginia, 351 McCormick Road, Charlottesville, VA 22904, USA
*
Author to whom correspondence should be addressed.
†
These authors contributed equally to this paper.
Energies 2019, 12(4), 729; https://doi.org/10.3390/en12040729
Submission received: 15 January 2019
/
Revised: 15 February 2019
/
Accepted: 19 February 2019
/
Published: 22 February 2019
(This article belongs to the Special Issue Hydrothermal Technology in Biomass Utilization & Conversion)
Abstract
:Hydrothermal liquefaction (HTL) is of interest in producing liquid fuels from organic waste, but the process also creates appreciable quantities of aqueous co-product (ACP) containing high concentrations of regulated wastewater pollutants (e.g., organic carbon, nitrogen (N), and phosphorus (P)). Previous literature has not emphasized characterization, management, or possible valorization of ACP wastewaters. This study aims to evaluate one possible approach to ACP management via recovery of valuable scarce materials. Equilibrium modeling was performed to estimate theoretical yields of struvite (MgNH4PO4·6H2O) from ACP samples arising from HTL processing of selected waste feedstocks. Experimental analyses were conducted to evaluate the accuracy of theoretical yield estimates. Adjusted yields were then incorporated into a life-cycle energy modeling framework to compute energy return on investment (EROI) for the struvite precipitation process as part of the overall HTL life-cycle. Observed struvite yields and residual P concentrations were consistent with theoretical modeling results; however, residual N concentrations were lower than model estimates because of the volatilization of ammonia gas. EROI calculations reveal that struvite recovery is a net-energy producing process, but that this benefit offers little to no improvement in EROI performance for the overall HTL life-cycle. In contrast, corresponding economic analysis suggests that struvite precipitation may be economically appealing.
1. Introduction
Hydrothermal liquefaction (HTL) is an appealing platform for the production of drop-in fuels from abundant wet, organic “waste” feedstocks [1,2,3]. However, HTL-derived biofuels are known to have a significantly high water footprint, arising from the large volumes of aqueous co-product (ACP) that are produced as secondary waste during the conversion process [4,5,6]. Until recent years, existing studies have placed relatively little emphasis on ACP quality and management. HTL studies that do address ACP quality primarily pertain to the liquefaction of various microalgae [7,8,9,10,11]. These studies have evaluated the feasibility of reusing ACP as a nutrient-rich growth medium for algae cultivation [7,8]. Few studies have characterized ACP quality arising from non-algae feedstocks [4]. All such studies, however, reveal that ACP contains very high concentrations of regulated constituents, including dissolved organic carbon (DOC), total nitrogen (TN), and total phosphorus (TP) [2,4,5,12]. Accordingly, widespread commercialization of HTL could create very large quantities of ACP requiring significant treatment and/or dilution prior to discharge into a receiving water body. The need for ACP treatment could undermine the energetic favorability of the HTL platform, because wastewater treatment plant (WWTP) processes, most notably nutrient removal, are highly energy consuming [13]. Previous life-cycle modeling has demonstrated that energy consumption for ACP management could be on the same order of magnitude as energy consumption for liquefaction itself [4]. Thus, there is a need to harmonize water and energy sustainability objectives during HTL processing.
Separately, there is a strong need to increase agricultural production of food and fuel crops over the next few decades, which will likely exacerbate existing nutrient scarcity [14]. Thus, there is an increasing interest in recovering nitrogen (N) and phosphorus (P) from various wastewaters to offset dwindling availability of nutrients from virgin sources [15,16,17]. Many studies have demonstrated the feasibility of chemical precipitation as a means to recover nutrients from high-strength agricultural or industrial wastewaters. Several of these studies have focused on the recovery of struvite (MgNH4PO4·6H2O), a slow-release fertilizer, from concentrated wastewaters, including: landfill leachate, slaughterhouse wastewater, anaerobic digester effluent, swine and dairy manure wastewater, source-separated urine, and others [14,16,18,19,20,21]. These studies have illustrated the feasibility of struvite recovery from potent wastewaters and have laid the groundwork for understanding how reaction conditions (e.g., molar ratios, pH, competing reactions, etc.) impact process yield of struvite.
It was hypothesized that ACP arising from the HTL processing of various organic waste feedstocks may be suitable for nutrient recovery via struvite precipitation. This approach would be desirable for reducing the energy intensiveness of ACP management, while simultaneously producing valuable scarce materials in the form of slow-release fertilizer. Creation of a useful fertilizer by-product could also improve the economic favorability of the HTL platform. Accordingly, this study had three aims: (1) evaluate the technical feasibility of struvite precipitation from ACP samples arising from the HTL processing of select organic waste feedstocks, (2) evaluate whether struvite recovery compensates for the energy penalty of ACP management as part of the overall HTL life-cycle, and (3) assess the economic feasibility of struvite recovery from post-HTL ACP samples.
2. Materials and Methods
2.1. HTL Conversion and Characterization of ACP
Seven non-food, organic waste feedstocks were evaluated in this study: (1) pre-digested WWTP sludge; (2) digested WWTP sludge; (3) dairy manure; (4) brewery yeast and (5) spent grains from craft beer production; and (6) red lees and (7) white lees (i.e., yeast particles) from wine production. All samples were collected, thoroughly homogenized via blending, characterized, and stored at 4 °C prior to HTL processing. Raw waste feedstocks were characterized for total suspended solids (TSS), volatile solids (VS), and water and ash contents according to APHA Standard Methods (see Supplementary Materials, Table S10) [22]. Waste feedstocks were then hydrothermally liquefied in a 300-mL Parr Instrument Company (Moline, IL, USA) stirred reactor with a quartz liner and external heater, as previously described in Bauer et al. (2018) [4]. In short, 100 g of wet feedstock paste, adjusted to an optimal water content of 90% (m/m) to be consistent with previous literature [5], was pressurized to 100 psi with nitrogen (N2) gas, continuously stirred at 300 rpm, and heated to 300 ± 5 °C at ~8–10 °C/min. Once heated, the reactor was maintained at 300 ± 5 °C for a residence time of 30 min [4,7,8]. All characterization analyses and HTL reactions were conducted in triplicate.
HTL product phases (i.e., biofuel, biochar, and ACP) were separated using techniques adapted from Xu and Savage (2014) [23], as previously described in Bauer et al. (2018) [4]. In short, solid-phase biochar was separated from the liquid phase via filtration. Biofuel and ACP were separated from each other via extraction into dichloromethane (DCM) at a ratio of 1–2x vol HTL liquid/vol DCM. Reactor contents were then decanted and centrifuged to facilitate phase separation, and the ACP was manually drawn off. Liquid biocrude was operationally defined based on solubility in DCM. The solvent was then evaporated using a gentle stream of N2 gas over a 24-h period. Resulting ACP was filtered using a 0.22-µm pore-size filter. Post-HTL ACP was characterized using APHA Standard Methods or commercial HACH kits based on traditional wastewater parameters, including pH, TN, TP, ammonium (NH4+), and orthophosphate (PO43−) methods (see Supplementary Materials, Section 5.0) [22]. ACP quality was further characterized using a Thermo Fisher Scientific Dionex ICS 5000 DP-5 Ion Chromatograph (IC) (Waltham, MA, USA), using U.S. EPA Method 300.1 [24], with a detection limit of 0.5 mg/L for: Mg2+, Ca2+, K+, Na+, Cl−, NO3−, NO2−, and SO42−. Additionally, titration experiments with 1 N sodium hydroxide (NaOH) solution were performed to measure the quantity of NaOH required to increase the pH of each post-HTL ACP to a required value.
2.2. Theoretical Recovery of Nutrients from ACP
A chemical equilibrium modeling software package, U.S. EPA Visual MINTEQ Version 3.1 (Stockholm, Sweden) [25], was used to estimate the theoretical recoverability of N and P from the various ACP samples arising from the HTL processing of selected organic waste feedstocks. Measured pH and constituent concentrations (e.g., NH4+, PO43−, and various anions and cations referenced in Section 2.1) were entered into the software individually for each post-HTL ACP in order to assess possible competing reactions to struvite precipitation. Equilibrium modeling was then applied in two ways. First, pH was artificially increased from its initial measured value, in intervals of 0.5 pH units, up to a maximum value of 14. Second, magnesium (Mg2+) concentration was artificially increased from its initial measured value, in intervals of 5 mg/L, for 500 intervals. For each interval step of both virtual titrations, the model computed what masses of struvite and other relevant solids would precipitate and then estimated the residual dissolved-phase concentrations of the various constituents, including relevant complexes. Optimal Mg2+ doses for each ACP sample were selected based on consumption of Mg2+ to produce the desired product. That is, Mg2+ was added stepwise up to the point where ≥50% of the last dose remained in solution or was diverted to a competing side reaction that did not produce struvite. Corresponding pH values were selected as optimal for each ACP.
2.3. Experimental Recovery of Nutrients from ACP
Modeling estimates for struvite yield and residual TN and TP concentrations were evaluated experimentally using protocols from Ishii and Boyer (2015), Yetilmezsoy and Sapci-Zengin (2009) [16,20]. Reactors comprised duplicate 50-mL beakers containing 20 mL of ACP. pH was adjusted via dropwise addition of 1 N NaOH up to optimal pH values identified via modeling results. Magnesium chloride (MgCl2·6H2O) was used as a Mg2+ source at a Mg2+:PO43− molar ratio of 1.5:1 to facilitate the precipitation of struvite [26]. Reactors were stirred at 200 rpm for 30 minutes at 20 °C, settled quiescently for 30 minutes, and then filtered using a 0.22-μm pore-size filter. Resulting solids were dried at 20 °C and weighed daily until the mass of the solids remained unchanged (~3 days). Residual ACP concentrations of NH4+, PO43−, and Mg2+ were measured using commercial HACH kits. Solid precipitates were analyzed by two methods. All precipitates were dissolved individually in concentrated hydrochloric acid (HCl), and the concentrations of NH4+, PO43−, and Mg2+ were analyzed using commercial HACH Company (Loveland, CO, USA) water quality analysis kits. A portion of precipitates were further analyzed by X-ray diffraction (XRD) using a Panalytical Empyrean Diffractometer equipped with a Bragg‒Bretano HD Prefix module and a GaliPix3D Area Detector operating in scanning line mode. This analysis was used to confirm the presence of struvite in the solid precipitates from post-HTL ACPs. Crystalline solid precipitates were scanned for 2-theta = 5 to 70° at a rate of 4 rps and repeated four times in order to improve the signal to noise ratio.
2.4. Energy Analysis of ACP Management via Struvite Precipitation
Life-cycle analysis (LCA) was used to assess the energy return on investment (EROI), which expresses the relationship between energy produced (EOUT) and energy consumed (EIN) (i.e., EROI = EOUT/EIN) for ACP management via nutrient recovery in the form of struvite precipitation. These calculations accounted for the inputs and outputs of the precipitation process, including: materials consumption for chemical precipitation, production of the fertilizer product, and reduced need for energy-intensive WWTP removal to remediate ACP. Energy consumption for post-precipitation solids handing (e.g., pumping, drying, and/or purification) was not evaluated. Embedded energy contents for precipitation materials were collected from the ecoinvent database, as accessed using SimaPro v.3 (Amersfoort, Netherlands), and/or adapted from Clarens et al. (2010) [13]. Energy input (i.e., EIN) estimates accounted for the energy costs of NaOH (46.6 kJ/g) and MgCl2 (4.7 kJ/g) based on titration to achieve model-designed optimal pH and an assumed Mg2+:PO43− molar ratio of 1.5:1 (see Supplementary Materials, Table S8).
Energy output (i.e., EOUT) estimates accounted for two kinds of benefits: (1) the energy value of struvite precipitates, based on a presumption that it would displace some other commercial fertilizer with known embedded energy footprint; and (2) the energy offset arising from reduced need to apply energy-intensive WWTP treatments for the removal of TN and TP down to acceptable levels. Both calculations make use of a systems-expansion approach, whereby the value of a product in one system is computed by assuming that there is some offset burden in a separate, related system. The validity of LCA estimates computed using this approach are necessarily dependent on the validity of the assumed interactions between the systems. For this reason, a range of EOUT values were computed for three different scenarios, as described below:
- Scenario 1: Energy output corresponds to only the amount of commercial fertilizer (i.e., monoammonium phosphate (MAP)) supplanted by struvite precipitation.
- Scenario 2: Energy output corresponds to MAP avoidance energy plus avoided energy costs for WWTP removal of TN and TP in ACP, assuming ammonia (NH3) is not allowed to volatilize during struvite recovery (i.e., “closed system”).
- Scenario 3: Energy output corresponds to MAP avoidance energy plus avoided energy costs for WWTP removal of TN and TP, assuming NH3 is allowed to volatilize during struvite recovery (i.e., “open system”).
For each scenario, it was assumed that recovered struvite could be used to replace the commercial fertilizer MAP on a 1:1 molar basis for both N and P, because both fertilizers have the same 1:1 N:P molar ratio. The values of 38 MJ/kg P2O5 and 58.7 MJ/kg N were used as the energy values of MAP, based on the ecoinvent database. The overall value following adjustment of units was 13.5 kJ/g MAP. The energy value of the struvite product was determined by multiplying the molar value of struvite yield by the molar mass of MAP (115.03 g/mol) and the energy value of MAP.
It was assumed that residual TN and TP in the post-HTL ACP would be removed via conventional WWTP methods. It was assumed that TN removal occurs via biological nitrification and separate-stage denitrification using methanol as a co-substrate (3.4 g methanol/g N removed) [27]. The energy intensity of methanol (38 kJ/g methanol) was obtained from Clarens et al. (2010) [13]. Using these values, the energy offset for avoided TN removal was 129.2 kJ/g N. It was assumed that TP removal occurs via chemical precipitation using ferrous sulfate (FeSO4) [27]. The energy demand and energy consumption for FeSO4 were obtained from Clarens et al. (2010) [13]: 1.8 g FeSO4/g P removed and 1.95 kJ/g P removed, respectively. Using these values, the energy offset for avoided TP removal was 3.51 kJ/g.
Energy ratio metrics for the overall HTL life-cycle were collected from relevant literature [28,29,30]. None of the original studies accounted for ACP management and/or recovery of useful materials. Accordingly, the model frameworks for each of the original studies were modified to include experimental data from the present study, taking a similar approach as Bauer et al. (2018) [4]. The energy ratio metrics were then recomputed, as a means to assess to what extent ACP management via struvite recovery could affect the overall energy performance of the HTL platform.
2.5. Economic Analysis of ACP Management via Struvite Precipitation
A preliminary economic analysis was conducted in order to evaluate the economic favorability of struvite precipitation from post-HTL ACP samples. Calculations were scaled to the treatment of 1 million liters of post-HTL ACP. It had been previously demonstrated that chemical costs are the major driver for overall cost of the struvite recovery process [31]. As such, only the costs of raw chemical were considered in this study. Unit prices of MgCl2, NaOH, methanol, and FeSO4 were assumed to be $240/ton, $425/ton, $500/ton, and $120/ton, respectively. Struvite yields and residual TN and TP concentrations were based on experimental measurements from this study. Net income from the struvite precipitation process was evaluated for the same three scenarios outlined previously: (1) supplanted MAP only, (2) supplanted MAP + WWTP offsets (assuming a closed system), and (3) supplanted MAP + WWTP (assuming an open system).
3. Results and Discussion
3.1. Characterization of Post-HTL ACP
The goal of this study was to evaluate the recoverability of valuable nutrients (i.e., N and P) from ACP as a means of managing secondary waste created during HTL processing and potentially increasing the overall EROI of the HTL platform. Table 1 presents post-HTL ACP characterization data for the seven organic waste feedstocks included in this study. Several noteworthy observations from this data pertain to the initial pH values and concentrations of relevant constituents. Regarding pH, it is fortuitous that most feedstocks produce ACPs that are slightly basic: ≥8 for pre-digested sludge, digested sludge, brewing yeast, and red lees ACPs. Dairy manure and spent grains ACPs are moderately acidic. Relatively high starting pH values are favorable for the proposed nutrient recovery application, because less base (e.g., NaOH) is required to adjust the pH to the high range required for struvite precipitation. Regarding select constituents, all ACP samples contain appreciable to very high concentrations of TN and TP.
Table 1 also reveals that there is significant variability in the fractions of the TN and TP pools available for struvite precipitation. The fraction of TN present as NH4+, which is the form required for struvite precipitation, varies from 30–96%. Digested sludge and brewing yeast ACP samples exhibited the highest fractions of recoverable TN. Correspondingly, the fraction of TP present as PO43−, which is the form required for struvite precipitation, varies from 8–100%. White lees ACP exhibited the highest measured fraction of TP as PO43− (100%), whereas brewing yeast and spent grains ACPs exhibited the next highest fractions (33–34%). All other ACP samples exhibited very low fractions of TP as phosphate. These results are somewhat consistent with previous research. For example, Valdez et al. (2012) [9] investigated the hydrothermal processing of Nannochloropsis sp. under various reaction conditions. The average observed NH4+/TN ratio was 48%, which is the same as the average value from Table 1. On the other hand, this study observed that P was mostly present as OP, which was not the case for this study. An interesting conclusion of the Valdez et al. (2012) study was that biomass characteristics may be more important than HTL reaction conditions for NH4+/TN and OP/TP ratios [9]. This observation is important for understanding the generalizability of the results from the current study.
Finally, it is of interest to examine the ratios of recoverable N and P, to assess which reactant will limit struvite yield. All seven of the ACP samples evaluated are phosphate-limited. The white lees ACP exhibited a ratio of 1.3:1 NH4-N:PO4-P, but all other ACPs contained dramatic quantities of excess ammonium. This is not surprising considering the large ratio of N to P in most plant and microbial biomasses.
Struvite is produced when Mg2+, NH4+, and PO43− combine together at a molar ratio of 1Mg:1N:1P under high pH. However, these constituents can also interact with other ions (e.g., Ca2+, K+, Na+, Cl−, SO42−, etc.) in competing side reactions. The relative favorability of struvite precipitation compared to other possible reactions is a function of pH and various constituent concentrations [32]. Table 1 summarizes concentrations of relevant ions present in the post-HTL ACP samples. Among all of the evaluated ACPs, nitrate (NO3−) and nitrite (NO2−) (not shown in Table 1) are present in negligible amounts. In contrast, most ACP samples contain relatively high concentrations of K+, Na+, Cl−, and SO42−. Only dairy manure and spent grains exhibit appreciable Mg2+ concentrations, which means that most samples will require full dosing with Mg2+ to completely remove either NH4+ or PO43− (whichever is limiting). Finally, Ca2+ is known to form several precipitates with PO43− and/or other constituents at high pH (e.g., Ca(H2PO4)2, CaHPO4, etc.). Formation of these solids reduces phosphate availability, which decreases the theoretically achievable struvite yield given that phosphate is the limiting reactant for most feedstock ACPs evaluated in this study. Although the various calcium phosphate salts are useful as agricultural fertilizers, these are less desirable than struvite within the specific context of ACP management, because it is of interest to remove as much TN as possible while also removing TP, especially since TP is the limiting reactant. Removing TP without also removing TN leaves greater residual TN concentrations, such that more additional post-treatment will be required for the ACP. Given all of the various competing reactions that can occur, it is of interest to see if/how the various combinations of constituents in ACP samples can affect precipitation and residual concentrations of TN and TP.
3.2. Theoretical Recovery of Nitrogen and Phosphorus from ACP
Equilibrium pH modeling was used to determine the theoretical recovery of dissolved nutrients from the various post-HTL ACP samples, with a goal of maximizing struvite precipitation. The model was parameterized separately for each ACP sample, based on data from Table 1. Modeling results are summarized in Table 2.
Based on modeling results for each ACP sample, Table 2 presents the optimum pH values for struvite recovery and the corresponding quantity of NaOH required to achieve that value; the theoretical maximum amount of struvite precipitate that can be produced; and the theoretical estimates of residual NH4+/NH3 and orthophosphate (OP) concentrations after struvite has been recovered. The data in Table 2 reveal several important findings. First, pertaining to nutrient recovery, the model predicts that struvite recovery is theoretically possible for all but one feedstock ACP. The only exception is the dairy manure ACP, for which the high concentration of Ca2+ in the ACP results instead in considerable precipitation of HAP (i.e., hydroxyapatite (Ca5(PO4)3(OH))) at high pH. The creation of HAP as a competing solid depletes the available phosphate and prevents the formation of struvite. Accordingly, TN removal is 0% even though orthophosphate removal is approximately 100%. Second, phosphate is almost completely consumed for all ACP samples, leaving very low residual concentrations. This outcome is consistent with previous efforts to recover struvite from various potent wastewaters [14,21]. This result is also consistent with the observation that all ACP samples are phosphate-limited, as evident in Table 1. The only ACP for which phosphate removal is not essentially 100% is the white lees ACP. As shown in Table 2, the model predicts significant residual concentrations for both NH4+/NH3 and OP for the white lees ACP. This outcome is a pH effect related to the speciation of NH4+/NH3 versus PO43−/HPO42−/H2PO4−/H3PO4 (i.e., the various forms of orthophosphates). As noted above, struvite formation requires a combination of NH4+ and PO43−, but there is a very small pH window over which these two species exist together. The pKA for NH4+/NH3 is 9.25, and the pKA for HPO42/PO43− is 12.35 [33]. Thus, increasing the pH above 9.25, which is useful for increasing struvite yields in all other ACP samples because they are so strongly OP-limited, reduces NH4+ availability by converting it to NH3 (see Supplementary Materials, Figure S1; Tables S1–S7). Therefore, the specific N:P ratio exhibited by the white lees ACP, which is much lower than the ratios exhibited by all other ACP samples, make it such that neither NH4+/NH3 nor OP can be completely removed via struvite precipitation.
3.3. Experimental Recovery of Nitrogen and Phosphorus from ACP
Precipitation experiments were performed to validate theoretical modeling results. Figure 1 summarizes a comparison between experimental results and theoretical predictions, including struvite mass yields and removal efficiencies for OP and NH4+. As expected, experimental analysis confirmed that struvite is not produced from the dairy manure ACP; therefore, the dairy manure ACP is excluded from Figure 1 and subsequent results. For all other feedstock ACPs, experimentally measured struvite mass yields were highly consistent with theoretical predictions from the model, as seen in Figure 1a. XRD analysis confirmed the chemical identity of crystalline struvite for the spent grains, brewing yeast, and red lees ACPs. The crystalline form of struvite agrees with previously published literature [21,34]. All precipitates were also dissolved in strong acid and analyzed for NH4+, PO43−, and Mg2+ using commercial HACH kits. The ratio of these measured constituents further confirmed that these solids were predominantly struvite, with relatively low concentrations of impurities (see Supplementary Materials, Figure S3; Table S9). Across all the ACP samples, the average molar ratio for Mg2+:NH4+:PO43− was 1.1:1:1.2. This ratio is consistent with previously published studies of nutrient recovery via struvite precipitation with reasonably low impurity content [34]. Overall, the good correspondence between modeling results and experimental struvite yields confirms the usefulness of the modeling approach for estimating how much struvite can be produced from various ACP samples with known constituent concentrations.
Experimental results also confirmed the accuracy of theoretical estimation of OP removal via struvite precipitation. This is not surprising given the good accuracy of the predicted struvite mass yields, since all of the ACP samples were phosphate-limited (Figure 1b). However, the theoretical predictions of NH4+ removal and residual concentration were much less accurate than for OP. As seen in Figure 1c, the modeling predictions dramatically underestimated NH4+ removal for all evaluated ACP samples. This unexpected removal is attributed to NH3 volatilization during the period of time when struvite particles were quiescently settling in an open reactor at room temperature. From literature, it has been previously demonstrated that up to 40% of residual NH4+/NH3 may be volatilized following pH adjustment to promote struvite precipitation from various potent wastewaters. For example, Çelen et al. (2007) reported average NH4+ losses of 35–40% during experimental precipitation of struvite at a pH of 8.5 [21]. Rahman et al. (2011) documented a range of NH4+ losses of 26.5–29.4% via NH3 volatilization [19]. In this study, the magnitude of NH4+ removal occurring via volatilization was as large as or much larger than the magnitude of removal occurring via struvite precipitation.
Table 3 summarizes pre- and post-precipitation of N and P concentrations in dissolved phase and as struvite precipitates. These data are useful for assessing the mass balances for PO43−, NH4+, and Mg2+ during precipitation reactions. As seen in Table 3, the mass balances for PO43− close to within 5% on average across all ACP samples tested. The mass balances close similarly well for Mg2+, with greater than 90% of the original dosing accounted for among the solid and dissolved phase products. However, the NH4+ mass balances for the ACP samples do not close well, with nearly 30% NH4+ on average unaccounted for in the solid and dissolved phase products. As mentioned above, the missing NH4+ is thought to have volatilized as gaseous NH3 during quiescent settling.
3.4. Energy Recovery Impacts of HTL Processing
It is also of interest to quantify the energetic favorability of the struvite precipitation process. This was done by computing EROI (i.e., EOUT/EIN) metrics, assuming that the ACP arising from HTL processing of each waste feedstock is managed via struvite precipitation followed by conventional treatment in a municipal WWTP. Figure 2 summarizes the results of this analysis for three scenarios (as defined in Section 2.4). For Scenario 1, which is the most conservative scenario, EROI values were found to be ranging from 0.4 to 1.0. This indicates that struvite precipitation from ACP is not energetically favorable when the energy value of the fertilizer (i.e., struvite) product is considered to be the only energy product. This result occurs because the combined energy costs for the Mg salt (i.e., MgCl2) and NaOH (46.6 kJ/g and 4.7 kJ/g, respectively) required to induce struvite precipitation are comparable to the energy value of the fertilizer product itself (13.5 kJ/g assuming direct replacement for struvite). For Scenario 2, EROI values increase to 0.9–2.1. These estimates account for both the energy value of the struvite as fertilizer replacement and also the avoided WWTP burden arising from not having to remediate N and P that is transformed into struvite solids. For both Scenarios 1 and 2, there is strong correlation between the amount of struvite recovered and the EROI value, with increases in struvite mass yield corresponding to increases in EROI. Finally, for Scenario 3, EROI values increase dramatically to 2.1–14.1. This increase accounts for the high energy intensity associated with nutrient removal during conventional wastewater treatment. In this scenario, the energy consumption for avoided TN removal becomes the determining factor for EROI. Since residual TN removal is energy- and cost-intensive, and the volatilization of NH3 reduces the need for the removal of TN post-struvite precipitation in a WWTP, EROI values for this scenario are much higher than in Scenarios 1 and 2.
Previously published EROI values for HTL processing were revised to account for ACP management based on the experimental results of this study. Original HTL values were taken from Connelly et al. (2015), Sawayama et al. (1999), and Vardon et al. (2012) [28,29,30]. These original EROI estimates were previously revised by Bauer et al. (2018) to account for ACP management via conventional wastewater treatment for removal of TN, TP, and COD [4]. In the Bauer et al. (2018) study, the original EROI values were revised to account for the energy consumption required to remove TN, TP, and BOD from the post-HTL ACPs through conventional wastewater treatment processes. In the current study, revised EROI estimates from Bauer et al. (2018) were re-revised to account for nutrient recovery from the ACPs via struvite precipitation, assuming that residual (i.e., post-precipitation) TN, TP, and BOD in the ACPs are removed via conventional treatment in a municipal WWTP [4].
Table 4 summarizes the original EROI values from the three studies, the revised EROI values presented in Bauer et al. (2018) [4], and re-revised EROI values that have been updated to account for N and P removal via struvite precipitation. Figure S2 in the Supplementary Materials illustrates the life-cycle systems boundaries for the three sets of EROI calculations. Neither Bauer et al. (2018) [4] nor this study attempted to change or harmonize the systems boundaries of the original studies beyond adding in ACP management with or without nutrient recovery. The original analyses were changed as little as possible. Therefore, the EROI values in Table 4 should be compared only within a single row (e.g., comparing one original EROI with its corresponding revised or re-revised EROI), rather than comparing EROIs from multiple rows. The latter is not appropriate given that the original calculations made use of different systems boundaries.
The calculations from this study reveal that the re-revised EROI values are not appreciably greater than the revised EROI values from Bauer et al. (2018) [4]. That is, accounting for struvite precipitation does not dramatically change the energy balance for the HTL system when accounting for ACP management, even when the best case scenario is applied. This indicates that the precipitation of struvite is not a highly promising way of improving the life-cycle energy performance of a waste-to-energy HTL platform. Several reasons for the poorer than expected performance of struvite precipitation include: the small fractions of ACP N and P that exist in the forms needed to produce struvite (i.e., NH4+ and PO43−, respectively); and the low energy value of the MAP fertilizer which is supplanted by the struvite product, relative to the energy cost of the MgCl2 that is used to produce it.
3.5. Economic Benefit of Struvite Precipitation from ACP
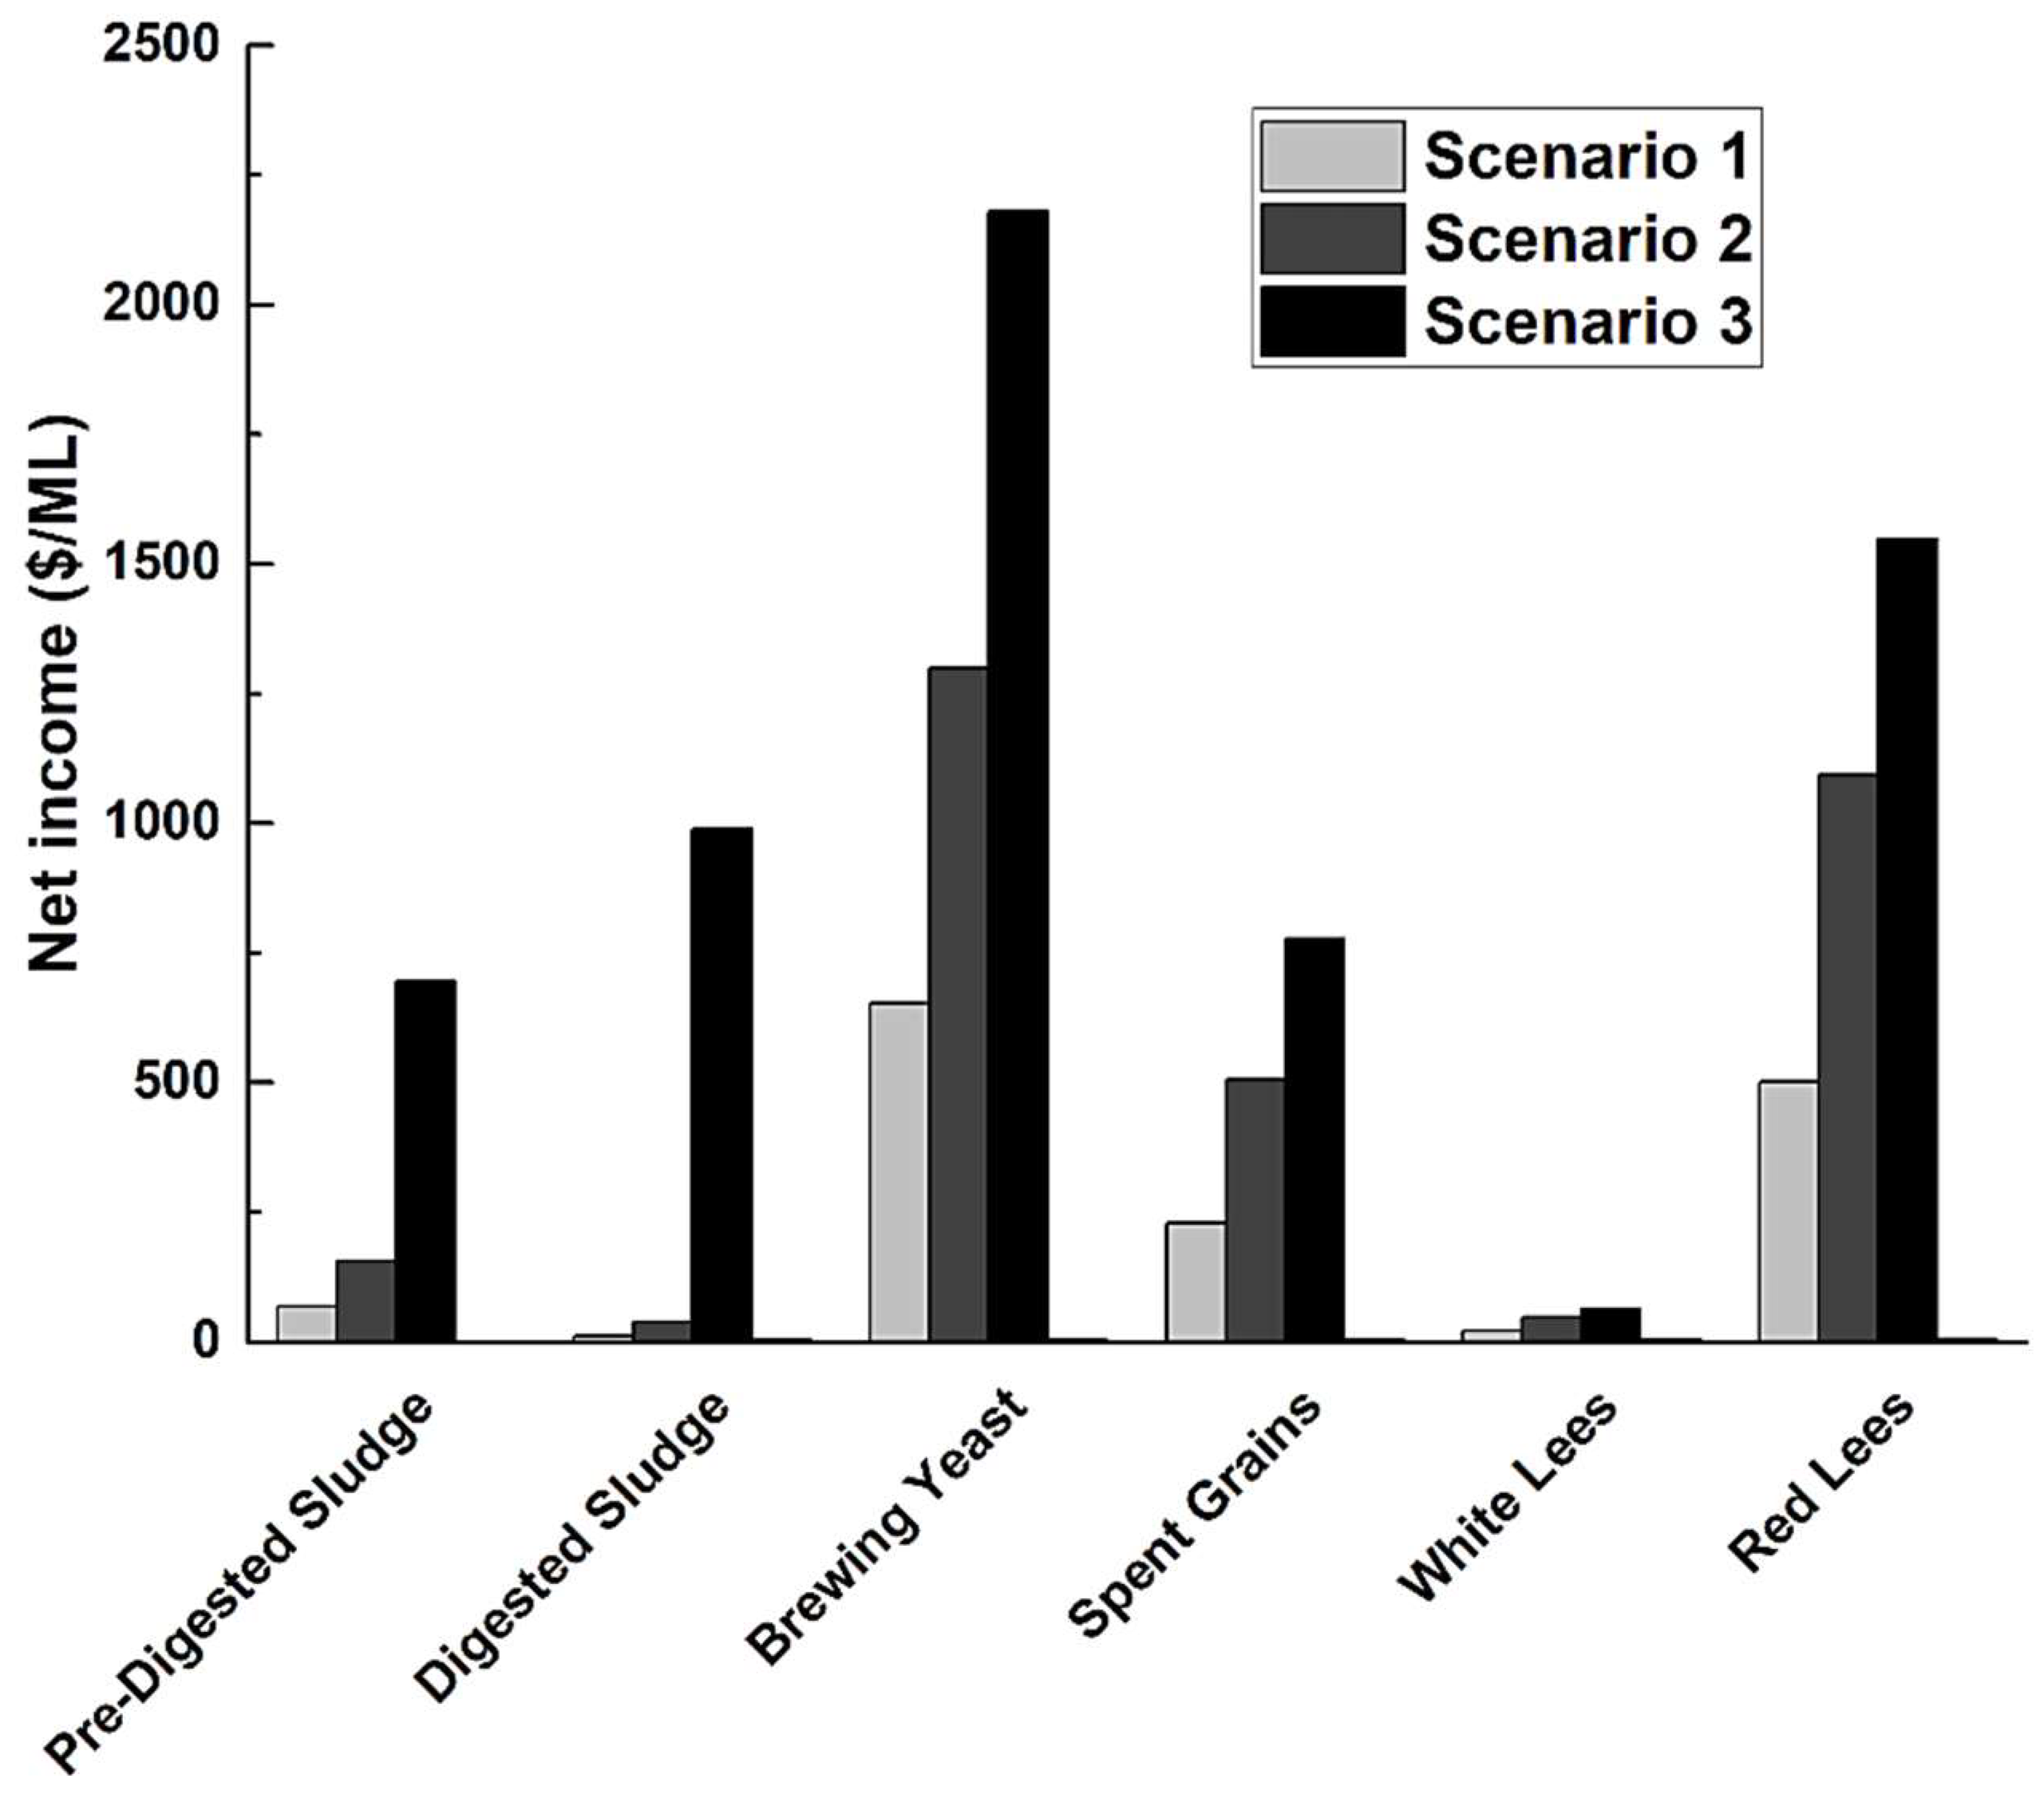
Based on the experimental results from this study, an economic analysis was conducted to measure the economic benefit of struvite precipitation from post-HTL ACP as a means of ACP management based on the three scenarios described in Section 2.4. Again, calculations were scaled to treatment of 1 million liters of post-HTL ACP. Based on measured ratios of biocrude:ACP, this volume of ACP would correspond to the production of approximately 110 thousand L liters of biocrude (see Supplementary Materials, Table S11). The market value of struvite has been previously reported by several researchers to be within the range of $198/ton to $800/ton [35]. For this analysis, the lowest reported market value for struvite ($198/ton) was used. The results from the economic benefit analysis of the precipitation of struvite from post-HTL ACP samples are summarized in Figure 3.
Based on the results reported in Figure 3, the economic benefit of struvite precipitation from post-HTL ACP is promising. All feedstock ACPs showed a positive net income from the recovery of N and P via the precipitation of struvite, ranging from $9/million liters (ML) ACP to $652/ML (Scenario 1), from $38/ML to $1298/ML (Scenario 2), and from $64/ML to $2179/ML (Scenario 3), even though the lowest reported market value of struvite was used for this analysis. The net income of struvite production is positively correlated to the concentration of PO43− in the post-HTL ACP that can be recovered via nutrient-based precipitation. Compared to the concentration of recoverable (i.e., organic) N and P in benchmark domestic and industrial wastewaters, the concentrations of recoverable N and P in post-HTL ACP are much higher [4], indicating that the recovery of nutrients from post-HTL ACPs via struvite precipitation would be more economical than conventional wastewater treatment methods.
4. Conclusions
HTL processing of organic waste feedstocks produces potent wastewater in the form of ACP that is likely to require management before discharge into receiving water bodies. Theoretical modeling results indicate that inorganic N and P can be recovered from post-HTL ACP in the form of the slow-release fertilizer struvite. Most ACPs exhibited theoretical precipitation of struvite at an optimal pH of 10.5. Struvite precipitation accounted for more than 97% OP recovery for several of the studied ACP samples. Experimental analyses confirmed predicted struvite mass yields and estimated residual phosphate concentrations; however, NH4+ was even greater than expected, due to NH3 volatilization. Although the struvite precipitation step is itself net-energy producing, adjustment of published EROI values for the HTL platform reveals that struvite precipitation does not appreciably change the overall energy balance of HTL. Economic analysis suggests that the precipitation of struvite from post-HTL ACP is economically feasible. This research provides essential insight into the sustainability of waste-to-energy systems as a means of both producing renewable energy and recovering valuable materials.
Supplementary Materials
The following are available online at https://www.mdpi.com/1996-1073/12/4/729/s1, Table S1: Theoretical recovery of nutrients via the precipitation of struvite from post-HTL dairy manure ACP at pH range of 4.4 to 14, Table S2: Theoretical recovery of nutrients via the precipitation of struvite from post-HTL pre-digested sludge ACP at pH range of 8.4 to 14. Optimal pH for nutrient recovery from pre-digested sludge ACP is 10.5, Table S3: Theoretical recovery of nutrients via the precipitation of struvite from post-HTL digested sludge ACP at pH range of 8.6 to 14. Optimal pH for nutrient recovery from digested sludge ACP is 10.5, Table S4: Theoretical recovery of nutrients via the precipitation of struvite from post-HTL brewing yeast ACP at pH range of 8.3 to 14. Optimal pH for nutrient recovery from brewing yeast ACP is 10.5, Table S5: Theoretical recovery of nutrients via the precipitation of solids from post-HTL spent grains ACP at pH range of 5.3 to 14. Optimal pH for nutrient recovery from spent grains ACP is 10.5, Table S6: Theoretical recovery of nutrients via the precipitation of solids from post-HTL white lees ACP at pH range of 6.4 to 14. Optimal pH for nutrient recovery from white lees ACP is 9.0, Table S7: Theoretical recovery of nutrients via the precipitation of solids from post-HTL red lees ACP at pH range of 8.8 to 14. Optimal pH for nutrient recovery from red lees ACP is 10.5, Table S8: Summary of the life-cycle energy values of the various materials consumed and produced via the precipitation of nutrients from the post-HTL ACP of select organic waste feedstocks. Parameter values were taken from the ecoinvent database, as accessed using SimaPro v.3 and/or Clarens et al. (2010), Table S9: Molar ratio of P-PO43−, N-NH4+, and Mg2+ within the solids precipitated from the post-HTL ACP of select waste feedstocks, Table S10: Characterization of as-received raw waste feedstocks for processing into liquid biocrude through HTL conversion, as adapted by Bauer et al. (2018), Table S11: Biocrude and ACP yield from HTL process for select waste feedstocks, as adapted by Bauer et al. (2018), Figure S1: pH dependence of (a) OP and (b) ammonia, magnesium, and calcium speciation at 25 °C. The speciation of ammonia between ionized NH4+ and free NH3, as well as the OP species (i.e., H3PO4, H2PO4−, HPO42−, and PO43−) is pH dependent, Figure S2: Life cycle boundaries for three estimates of HTL EROI are denoted A, B and C. “A” (dashed black lines) depicts initial systems boundaries from original HTL studies (i.e., Connelly et al. (2015), Vardon et al. (2012) and Sawayama et al. (1999)). “B” (dashed green lines) depicts revised system boundaries used by Bauer et al. (2018) to account for ACP treatment in a municipal WWTP. “C” (dashed maroon lines) depicts extended system boundaries used in this study to account for struvite recovery followed by conventional treatment to remove residual TN, TP and BOD, Figure S3: XRD diffractogram of standard struvite and solids precipitated from the post-HTL red lees, brewing yeast and spent grains ACP samples.
Author Contributions
The individual contributions of the authors are as follows: conceptualization, S.K.B., F.C. and L.M.C.; methodology, S.K.B., F.C. and L.M.C.; software, S.K.B. and F.C.; validation, S.K.B. and L.M.C.; formal analysis, S.K.B. and F.C.; investigation, S.K.B. and F.C.; resources, L.M.C.; data curation, S.K.B. and F.C.; writing—original draft preparation, S.K.B. and F.C.; writing—review and editing, L.M.C.; visualization, S.K.B. and F.C.; supervision, L.M.C.; project administration, L.M.C.; funding acquisition, L.M.C.
Funding
The authors gratefully acknowledge funding for this work from the G. Unger Vetlesen Foundation.
Acknowledgments
The authors thank Robert Davis and Jiahan Xie for equipment access and technical guidance. The authors also thank Drew Boland, Julia Davatzes, Curtis Davis, Cameron McCarty, Gabrielle Schleppenbach, and Ellie Wood for assistance with laboratory experiments.
Conflicts of Interest
The authors declare no conflict of interest. The funder had no role in the design of the study; in the collection, analyses, or interpretation of data; in the writing of the manuscript; or in the decision to publish the results.
References
- Bhutto, A.W.; Qureshi, K.; Abro, R.; Harijan, K.; Zhao, Z.; Bazmi, A.A.; Abbas, T.; Yu, G. Progress in the production of biomass-to-liquid biofuels to decarbonize the transport sector-prospects and challenges. R. Soc. Chem. Adv. 2016, 6, 32140–32170. [Google Scholar] [CrossRef]
- Elliott, D.C.; Biller, P.; Ross, A.B.; Schmidt, A.J.; Jones, S.B. Hydrothermal liquefaction of biomass: Developments from batch to continuous process. Bioresour. Technol. 2014, 178, 147–156. [Google Scholar] [CrossRef] [PubMed]
- Toor, S.S.; Rosendahl, L.; Rudolf, A. Hydrothermal liquefaction of biomass: A review of subcritical water technologies. Energy 2011, 36, 2328–2342. [Google Scholar] [CrossRef]
- Bauer, S.; Reynolds, C.; Peng, S.; Colosi, L. Evaluating the water quality impacts of hydrothermal liquefaction: Assessment of carbon, nitrogen, and energy recovery impacts. Bioresour. Technol. Rep. 2018, 2, 115–120. [Google Scholar] [CrossRef]
- Jena, U.; Vaidyanathan, N.; Chinnasamy, S.; Das, K.C. Evaluation of microalgae cultivation using recovered aqueous co-product from thermochemical liquefaction of algal biomass. Bioresour. Technol. 2011, 102, 3380–3387. [Google Scholar] [CrossRef] [PubMed]
- Dominguez-Faus, R.; Powers, S.E.; Burken, J.G.; Alvarez, P.J. The water footprint of biofuels: A drink or drive issue? Environ. Sci. Technol. 2009, 43, 3005–3010. [Google Scholar] [CrossRef] [PubMed]
- Pham, M.; Schideman, L.; Scott, J.; Rajagopalan, N.; Plewa, M.J. Chemical and biological characterization of wastewater generated from hydrothermal liquefaction of Spirulina. Environ. Sci. Technol. 2013, 47, 2131–2138. [Google Scholar] [CrossRef]
- Garcia Alba, L.; Torri, C.; Samorì, C.; Van der Spek, J.; Fabbri, D.; Kersten, S.R.A.; Brilman, D.W.F. Hydrothermal treatment (HTT) of microalgae: Evaluation of the process as conversion method in an algae biorefinery concept. Energy Fuels 2012, 26, 642–657. [Google Scholar] [CrossRef]
- Valdez, P.J.; Nelson, M.C.; Wang, H.Y.; Lin, X.N.; Savage, P.E. Hydrothermal liquefaction of Nannochloropsis sp.: Systematic study of process variables and analysis of the product. Biomass Bioenergy 2012, 46, 317–331. [Google Scholar] [CrossRef]
- Orfield, N.D.; Fang, A.J.; Valdez, P.J.; Nelson, M.C.; Savage, P.E.; Lin, X.N.; Keoleian, G.A. Life cycle design of an algal biorefinery featuring hydrothermal liquefaction: Effect of reaction conditions and an alternative pathway including microbial regrowth. ACS Sustain. Chem. Eng. 2014, 2, 867–874. [Google Scholar] [CrossRef]
- Gai, C.; Zhang, Y.; Chen, W.T.; Zhou, Y.; Schideman, L.; Zhang, P.; Tommaso, G.; Kuo, C.T.; Dong, Y. Characterization of aqueous phase from the hydrothermal liquefaction of Chlorella pyrenoidosa. Bioresour. Technol. 2015, 184, 328–335. [Google Scholar] [CrossRef] [PubMed]
- Tommaso, G.; Chen, W.; Li, P.; Schideman, L.; Zhang, Y. Chemical characterization and anaerobic biodegradability of hydrothermal liquefaction aqueous products from mixed-culture wastewater algae. Bioresour. Technol. 2015, 178, 139–146. [Google Scholar] [CrossRef] [PubMed]
- Clarens, A.F.; Resurreccion, E.P.; White, M.A.; Colosi, L.M. Environmental life cycle comparison of algae to other bioenergy feedstocks. Environ. Sci. Technol. 2010, 44, 1813–1819. [Google Scholar] [CrossRef] [PubMed]
- Kataki, S.; West, H.; Clarke, M.; Baruah, D.C. Phosphorus recovery as struvite from farm, municipal and industrial waste: Feedstock suitability, methods and pre-treatment. Waste Manag. 2016, 49, 437–454. [Google Scholar] [CrossRef] [PubMed]
- Yetilmezsoy, K.; Fatih, I.; Emel, K.; Havva Melda, A. Feasibility of struvite recovery process for fertilizer industry: A study of financial and economic analysis. J. Clean. Prod. 2017, 152, 88–102. [Google Scholar] [CrossRef]
- Ishii, S.K.L.; Boyer, T.H. Life cycle comparison of centralized wastewater treatment and urine source separation with struvite precipitation: Focus on urine nutrient management. Water Res. 2015, 79, 88–103. [Google Scholar] [CrossRef] [PubMed]
- Capdevielle, A.; Sýkorová, E.; Biscans, B.; Béline, F.; Daumer, M. Optimization of struvite precipitation in synthetic biologically treated swine wastewater—Determination of the optimal process parameters. J. Hazard. Mater. 2013, 244–245, 357–369. [Google Scholar] [CrossRef]
- Lahr, R.; Goetsch, H.; Haig, S.; Noe-Hays, A.; Love, N.; Aga, D.; Bott, C.; Foxman, B.; Jimenez, J.; Luo, T.; et al. Urine bacterial community convergence through fertilizer production: Storage, pasteurization, and struvite precipitation. Environ. Sci. Technol. 2016, 50, 11619–11626. [Google Scholar] [CrossRef]
- Rahman, M.M.; Liu, Y.; Kwag, J.H.; Ra, C. Recovery of struvite from animal wastewater and its nutrient leaching loss in soil. J. Hazard. Mater. 2011, 186, 2026–2030. [Google Scholar] [CrossRef]
- Yetilmezsoy, K.; Sapci-Zengin, Z. Recovery of ammonium nitrogen from the effluent of UASB treating poultry manure wastewater by MAP precipitation as a slow release fertilizer. J. Hazard. Mater. 2009, 166, 260–269. [Google Scholar] [CrossRef]
- Çelen, I.; Buchanan, J.R.; Burns, R.T.; Robinson, R.B.; Raman, D.R. Using chemical equilibrium model to predict amendments required to precipitate phosphorus as struvite in liquid swine manure. Water Res. 2007, 41, 1689–1696. [Google Scholar] [CrossRef] [PubMed]
- APHA. Standard Methods for the Examination of Water and Waste Water, 22nd ed.; American Public Health Association: Washington, DC, USA, 2013; Available online: http://www.standardmethods.org/PDF/22nd_Ed_Errata_12_16_13.pdf (accessed on 10 February 2016).
- Xu, D.; Savage, P.E. Characterization of biocrudes recovered with and without solvent after hydrothermal liquefaction of algae. Algal Res. Part A 2014, 6, 1–7. [Google Scholar] [CrossRef]
- Environmental Protection Agency (EPA). Method 300.1: Determination of Inorganic Anions in Drinking Water by Ion Chromatography; USEPA, Office of Water: Washington, DC, USA, 1997. [Google Scholar]
- Gustafsson, J.P. Visual MINTEQ Ver. 3.1. KTH, Sweden. 2013. Available online: https://vminteq.lwr.kth.se/ (accessed on 20 March 2017).
- Uysal, A.; Yilzmazel, Y.D.; Demirer, G.N. The determination of fertilizer quality of the formed struvite from effluent of a sewage sludge anaerobic digester. J. Hazard. Mater. 2012, 181, 248–254. [Google Scholar] [CrossRef] [PubMed]
- Tchobanoglous, G.; Burton, F.; Stensel, H.D. Wastewater Engineering: Treatment and Reuse, 4th ed.; McGraw-Hill Higher Education: New York, NY, USA, 2003. [Google Scholar]
- Connelly, E.B.; Colosi, L.M.; Clarens, A.F.; Lambert, J.H. Life cycle assessment of biofuels from algae hydrothermal liquefaction: The upstream and downstream factors affecting regulatory compliance. Energy Fuels 2015, 29, 1653–1661. [Google Scholar] [CrossRef]
- Vardon, D.; Sharma, B.; Blazina, G.; Rajagopalan, K.; Strathmann, T. Thermochemical conversion of raw and defatted algal biomass via hydrothermal liquefaction and slow pyrolysis. Bioresour. Technol. 2012, 109, 178–187. [Google Scholar] [CrossRef]
- Sawayama, S.; Minowa, T.; Yokoyama, S.-Y. Possibility of energy production and CO2 mitigation by thermochemical liquefaction of microalgae. Biomass Bioenergy 1999, 17, 33–39. [Google Scholar] [CrossRef]
- Jaffer, Y.; Clark, T.A.; Pearce, P.; Parsons, S.A. Potential phosphorus recovery by struvite formation. Water Res. 2002, 36, 1834–1842. [Google Scholar] [CrossRef]
- Tao, W.; Fattah, K.P.; Huchzermeier, M.P. Struvite recovery from anaerobically digested dairy manure: A review of application potential and hindrances. J. Environ. Manag. 2016, 169, 46–57. [Google Scholar] [CrossRef]
- Ali, M.I.; Schneider, P.A.; Hudson, N. Thermodynamics and solution chemistry of struvite. J. Indian Inst. Sci. 2005, 85, 141–149. [Google Scholar]
- Jia, G.; Zhang, H.; Krampe, J.; Muster, T.; Gao, B.; Zhu, N.; Jin, B. Applying a chemical equilibrium model for optimizing struvite precipitation for ammonium recovery from anaerobic digester effluent. J. Clean. Prod. 2017, 147, 297–305. [Google Scholar] [CrossRef]
- Molinos-Senante, M.; Hernández-Sancho, F.; Sala-Garrido, R.; Garrido-Baserba, M. Economic feasibility study for phosphorus recovery processes. Ambio 2010, 40, 408–416. [Google Scholar] [CrossRef]
Figure 1.
Theoretical and experimental mass yield of struvite (a) and removal efficiency of (b) orthophosphate (PO43−) and (c) ammonium (NH4+) from post-HTL ACP of select waste feedstocks via precipitation of struvite.
Figure 1.
Theoretical and experimental mass yield of struvite (a) and removal efficiency of (b) orthophosphate (PO43−) and (c) ammonium (NH4+) from post-HTL ACP of select waste feedstocks via precipitation of struvite.

Figure 2.
Calculated energy return on investment (EROI) values of nutrient removal and recovery of post-HTL ACPs of select waste feedstocks via struvite recovery.
Figure 2.
Calculated energy return on investment (EROI) values of nutrient removal and recovery of post-HTL ACPs of select waste feedstocks via struvite recovery.

Figure 3.
Economic analysis of the benefit of the precipitation of struvite from post-HTL ACP of select waste feedstocks as a means of management of ACP through the removal of NH4+ and PO43−.
Figure 3.
Economic analysis of the benefit of the precipitation of struvite from post-HTL ACP of select waste feedstocks as a means of management of ACP through the removal of NH4+ and PO43−.

Table 1.
Characterization of post-hydrothermal liquefaction (HTL) aqueous co-product (ACP) of select waste feedstocks for pH and various wastewater constituents. Average values are reported and used as inputs for modeling and experimental analysis. ND denotes measurements below the detection limit of 0.5 mg/L. All samples exhibited ND nitrite (NO2−).
| Waste Feedstock | PH | TN (mM as N) | NH4+ (mM as N) | NH4−N/TN-N Ratio | TP (mM as P) | OP (mM as P) | OP-P/TP-P Ratio | NH4−N/OP-P Ratio | MG2+ (mM) | CA2+ (mM) | K+ (mM) | NA+ (mM) | CL− (mM) | NO3− (mM) | SO42− (mM) |
|---|---|---|---|---|---|---|---|---|---|---|---|---|---|---|---|
| Dairy Manure | 4.4 | 75 | 23 | 0.30 | 15.4 | 1.3 | 0.08 | 17.9 | 2.2 | 7.5 | 7.7 | 6.1 | 8.8 | ND | 0.3 |
| Pre-Digested Sludge | 8.4 | 232 | 70 | 0.30 | 25.8 | 3.6 | 0.14 | 19.3 | 0.1 | 0.5 | 6.9 | 3.0 | 2.1 | ND | 2.4 |
| Digested Sludge | 8.6 | 156 | 150 | 0.96 | 7.1 | 1.0 | 0.14 | 150.0 | 0.2 | 0.8 | 7.6 | 4.3 | 2.8 | ND | 3.6 |
| Brewing Yeast | 8.3 | 175 | 98 | 0.56 | 70.8 | 24.3 | 0.34 | 4.0 | 0.2 | 0.5 | 33.9 | 1.7 | 2.7 | ND | 3.1 |
| Spent Grains | 5.3 | 146 | 50 | 0.34 | 33.5 | 11.4 | 0.34 | 4.4 | 1.2 | 0.4 | 0.3 | 1.3 | 0.1 | 0.04 | 0.6 |
| White Lees | 6.4 | 7 | 2 | 0.32 | 1.5 | 1.7 | 1.18 | 1.3 | 0.2 | 0.2 | 81.2 | 0.4 | 0.2 | 0.02 | 0.4 |
| Red Lees | 8.8 | 135 | 80 | 0.59 | 117.2 | 22.2 | 0.19 | 3.6 | 0.1 | 0.5 | 182.0 | 0.7 | 0.3 | ND | ND |
Table 2.
Theoretical estimates of struvite recovery and residual total nitrogen (TN) and total phosphorus (TP) concentrations from post-HTL ACPs of select waste feedstocks based on equilibrium chemistry modeling using Visual MINTEQ.
Table 2.
Theoretical estimates of struvite recovery and residual total nitrogen (TN) and total phosphorus (TP) concentrations from post-HTL ACPs of select waste feedstocks based on equilibrium chemistry modeling using Visual MINTEQ.
| Waste Feedstock | Optimal pH | NaOH Consumed (mM) | MgCl2 Consumed (mM) | Struvite Recovered (mM) | OP Removed (mM) | NH4+/NH3 Removed (mM) | Residual NH4+/NH3 (%) | Residual TN (%) | Residual OP (%) | Residual TP (%) |
|---|---|---|---|---|---|---|---|---|---|---|
| Dairy Manure | 8.0 | 1.40 | 0 | 0 | 1.27 | 0 | 100 | 100 | 0 | 75 |
| Pre-Digested Sludge | 10.5 | 1.00 | 3.29 | 3.28 | 3.59 | 3.28 | 95 | 98 | >1 | 57 |
| Digested Sludge | 10.5 | 1.50 | 0.41 | 0.48 | 0.97 | 0.48 | 100 | 100 | 2 | 58 |
| Brewing Yeast | 10.5 | 1.14 | 23.9 | 23.9 | 24.2 | 23.9 | 76 | 82 | >1 | 5 |
| Spent Grains | 10.5 | 1.35 | 9.88 | 11.1 | 11.3 | 11.1 | 78 | 90 | 1 | 3 |
| White Lees | 9.0 | 0.09 | 3.70 | 0.56 | 0.69 | 0.56 | 75 | 90 | 34 | 36 |
| Red Lees | 10.5 | 1.12 | 21.8 | 21.8 | 22.1 | 21.8 | 73 | 79 | >1 | 42 |
Table 3.
Experimental results for pre- and post-precipitation concentrations of nitrogen (N) and phosphorus (P), with additional mass balance information for PO43−, NH4+, and magnesium (Mg2+).
Table 3.
Experimental results for pre- and post-precipitation concentrations of nitrogen (N) and phosphorus (P), with additional mass balance information for PO43−, NH4+, and magnesium (Mg2+).
| Waste Feedstock | Initial Concentration (mg/L) | Recovered as Precipitates (mg/L) | Remaining in ACP (mg/L) | Mass Difference (%) | ||||||||
|---|---|---|---|---|---|---|---|---|---|---|---|---|
| PO43−-P | NH4+-N | Mg2+ | PO43−-P | NH4+-N | Mg2+ | PO43−-P | NH4+-N | Mg2+ | PO43−-P | NH4+-N | Mg2+ | |
| Pre-Digested Sludge | 112 | 975 | 121 | 106 | 38 | 73 | 5.6 | 620 | 40 | 0.8 | 32.5 | 6.4 |
| Digested Sludge | 31 | 2100 | 36 | 29 | 13 | 25 | 0.0 | 1528 | 11 | 5.2 | 26.6 | 1.0 |
| Brewing Yeast | 753 | 1370 | 875 | 751 | 285 | 503 | 1.6 | 568 | 285 | 0.0 | 37.8 | 9.9 |
| Spent Grains | 352 | 700 | 409 | 324 | 122 | 218 | 0.0 | 422 | 190 | 8.1 | 22.3 | 0.2 |
| White Lees | 53 | 31 | 62 | 30 | 13 | 13 | 18.0 | 10 | 31 | 10.3 | 27.4 | 11.5 |
| Red Lees | 687 | 1115 | 798 | 646 | 266 | 521 | 0.0 | 587 | 204 | 6.0 | 23.6 | 9.1 |
| Average | 331 | 1048 | 385 | 314 | 123 | 227 | 4.2 | 622 | 127 | 5.1 | 28.4 | 8.0 |
Table 4.
Three sets of EROI values for HTL processing of various organic feedstocks: as reported in original HTL studies; as revised by Bauer et al. (2018) [4] to include ACP management in a conventional wastewater treatment plant (WWTP); and as re-revised in this study to account for nutrient recovery via struvite precipitation with subsequent conventional treatment to remove residual TN, TP, and biological oxygen demand (BOD).
| Author/Year | Feedstock/Scenario | Original EROI | Revised EROI with ACP Management a | Revised EROI with Struvite Precipitation b |
|---|---|---|---|---|
| Connelly et al., 2015 [28] | Algae, “CO2 from ethanol” | 1.3 | 1.1 | 1.2 |
| Algae, “CO2 from natural wells” | 1.2 | 1.0 | N/A c | |
| Sawayama et al., 1999 [30] | B. braunii (algae) | 6.7 | 3.7 | 3.9 |
| D. tertiolecta (algae) | 2.9 | 2.0 | 2.1 | |
| Japanese oak | 1.8 | 1.3 | 1.3 | |
| Japanese larch bark | 0.9 | 0.8 | 0.8 | |
| Sewage sludge | 2.9 | 2.0 | 2.0 | |
| Barley silage | 2.3 | 1.7 | 1.7 | |
| Kitchen garbage | 0.7 | 0.6 | 0.6 | |
| Vardon et al., 2012 [29] | Scenedesmus (algae), 80% moisture | 2.3 | 1.3 | 1.4 |
| Defatted Scenedesmus, 80% moisture | 1.8 | 1.1 | 1.1 | |
| Spirulina (algae), 80% moisture | 1.6 | 0.9 | 1.0 |
a Bauer et al. (2018) [4]; b This Study; c N/A due to non-dimensional scaling.
© 2019 by the authors. Licensee MDPI, Basel, Switzerland. This article is an open access article distributed under the terms and conditions of the Creative Commons Attribution (CC BY) license (http://creativecommons.org/licenses/by/4.0/).
Share and Cite
MDPI and ACS Style
Bauer, S.K.; Cheng, F.; Colosi, L.M. Evaluating the Impacts of ACP Management on the Energy Performance of Hydrothermal Liquefaction via Nutrient Recovery. Energies 2019, 12, 729. https://doi.org/10.3390/en12040729
AMA Style
Bauer SK, Cheng F, Colosi LM. Evaluating the Impacts of ACP Management on the Energy Performance of Hydrothermal Liquefaction via Nutrient Recovery. Energies. 2019; 12(4):729. https://doi.org/10.3390/en12040729
Chicago/Turabian StyleBauer, Sarah K., Fangwei Cheng, and Lisa M. Colosi. 2019. "Evaluating the Impacts of ACP Management on the Energy Performance of Hydrothermal Liquefaction via Nutrient Recovery" Energies 12, no. 4: 729. https://doi.org/10.3390/en12040729
Note that from the first issue of 2016, this journal uses article numbers instead of page numbers. See further details here.