Flight Time Estimation for Continuous Surveillance Missions Using a Multirotor UAV


1
Department of Electric Vehicle Engineering, Dongshin University, Jeollanam-do 58245, Korea
2
Department of Energy Mechanical Facility, Dongshin University, Jeollanam-do 58245, Korea
3
Department of Electronic Engineering, Gachon University, Gyeonggi-do 13120, Korea
*
Author to whom correspondence should be addressed.
Energies 2019, 12(5), 867; https://doi.org/10.3390/en12050867
Submission received: 17 February 2019
/
Revised: 28 February 2019
/
Accepted: 1 March 2019
/
Published: 5 March 2019
(This article belongs to the Section F: Electrical Engineering)
Abstract
:To achieve the continuous surveillance capable multirotor type solar-powered unmanned aerial vehicle (UAV), we develop the photovoltaic power management system (PPMS) which manages power from photovoltaic (PV) modules and a battery pack to support the power of the UAV. To estimate the possible flight time of the UAV, we use the concept of state of charge (SOC) estimation based on the extended Kalman filter (EKF) and complementary filter (CF) and then calculate the possible flight time by using the slope of the SOC graph during hovering flight mode. According to the results, estimated flight time increases up to 54.14 min at 11:00 a.m. and decreases down to 6.70 min at 18:00 p.m.
1. Introduction
As unmanned aerial vehicles (UAV) become popular, various methods for extending the flight time have been studied. Among them, in particular, a method of supplying power from a photovoltaic (PV) module is widely used [1]. Various research is being performed all around the world to enhance the performance of the long endurance capability of the solar-powered UAV, including aerodynamics [2,3], path planning [4], and system component design [5]. Alongside the previously listed efforts to improve the sustainability of the solar-powered UAV, the main contribution of this paper is the development of a photovoltaic power management system (PPMS), which allows a small UAV to receive power from solar panels installed on the ground and so be able to hover for a long time.
For the maximum energy capture using PV modules and enhancement of the PV module’s lifetime, various maximum power point tracking (MPPT) techniques have been developed which are mainly divided into three categories: offline (model-based), online (non-model-based), and hybrid methods (combination of both) [6].
In particular, the online method utilizes a small premeditated perturbation (among voltage/current/duty-cycle) to shake one of voltage/current/duty-cycle signals of the PV modules, analyzes the amount of perturbed output power, and determine the decrease/increase direction of change to reach the maximum power point (MPP). The online method is advantageous in the sense that it does not require any solar cell behavior model, but a disadvantage of this method is that oscillations occur in the maximum output power due to the input perturbation signal.
For the usage in the multirotor UAV, the extremum seeking control (ESC), which is categorized as the online method, is preferable due to its medium level algorithm complexity, digital and analog implementation capability, fast convergence speed, no required prior training, and high efficiency [6,7]. Although the usage of the MPPT technique is important to further improve the efficiency of PPMS, we exclude this part and focus more on the PPMS hardware design and the technique to analyze the possible flight time of the UAV based on the SOC calculation.
It is worth in the sense that the small multirotor UAV capable of being held for several hours in the air can continuously operate in a form similar to closed-circuit television (CCTV) by continuously photographing the area of interest and stitching images to the existing ground map, although the operation range is limited due to the wired power transmission.
Research in the area of long endurance UAV is mostly performed for the fixed-wing type UAV. Lee et al. managed a three power source combination including solar cells, a fuel cell, and batteries to power the small long-endurance UAV using an active power management method to ultimately maintain a target state of charge (SOC) of batteries of 45% [8]. Harmon et al. developed the parallel hybrid-electric propulsion system using a rule-based controller and showed the overall energy consumption could be tremendously reduced [9]. Malaver et al. used the maximum power point (MPPT), battery charger, and power path manager using a BQ24030 electronic chip from Texas Instruments Inc. to supply regulated power to the UAV [10,11,12,13]. Meyer et al. developed the power management system for low altitude long endurance (LALE) solar-powered UAV, meeting the nominal system voltage of 22.2 V using PV cells, isolation switches, Li–Po batteries, and a power management computer [14].
There is also a sparse number of attempts to develop the long endurance multirotor UAV but most of them are vulnerable to the wind as the weight of the UAV is too light and most of the test flights are performed indoors or at low altitudes outside.
The flow of this paper is as follows. In Section 2, the overall concept of the surveillance UAV operation is described. In Section 3, SOC and flight time estimation methods are described. In Section 4, the concept and specification of the PPMS are explained. In Section 5, current and voltage patterns achieved from the outdoor experiment are presented. In Section 6, we present the indoor charge–discharge experiment setup, results, and analysis. Finally, Section 7 contains the conclusion of this paper and future works.
2. Aerial Surveillance
Our purpose here is to continuously observe the area of interest using a UAV. To achieve this purpose, we monitor the SOC information of the battery pack underneath the UAV and send commands to let the UAV take off if the SOC is over a certain threshold and vice versa.
The overall conceptual diagram of the aerial surveillance operation is shown in Figure 1. The UAV was powered by the PPMS which controlled power from two sources, including PV modules and a battery pack. Once the battery pack SOC became low (Figure 1a,b), the UAV landed on the ground and was charged during the daytime (Figure 1c,d). During the night, the UAV stayed on the ground since there was no sunlight. When the sun rose at dawn, the UAV was charged and started the surveillance mission again.
3. SOC and Flight Time Estimation
We used two ladder battery equivalent circuit model (ECM) for the cell state estimation, the table-based linear interpolation (TBLI) method for the cell parameter extraction, and complementary filter (CF) for the SOC estimation which combines the extended Kalman filter (EKF) and current integration methods.
The two ladder ECM, also called a physical model, is widely used to mimic various types of battery packs due to its compactness (having only five parameters) compared to Rint ECM [15,16], Thevenin ECM [17], PNGV ECM [15,16], combined ECM [18,19,20], and the electrochemical model [21,22,23].
The SOC was used as the indication of the remaining energy of the battery pack and it was important to safely operate the autonomous takeoff and landing flight operations. The detailed information regarding the EKF based SOC estimation can be found in reference [24].
3.1. OCV–SOC Curve
To calculate the accurate SOC value, we utilized the difference of electrical potential between the anode and cathode of the battery pack which can be represented with the open circuit voltage (OCV). An OCV–SOC curve of the battery pack is shown in Figure 2.
3.2. Parameter Extraction
Representation of the Li–Po battery pack as an ECM is beneficial in the sense of simplifying mathematical form and fast computation. The chosen two ladder ECM could mimic both short-term and long-term variance of the electrical potential difference between the two terminals of the battery pack. The two ladder ECM has a total of five parameters, , , , , and and these were extracted as shown in Figure 3 for the ECM. The detailed information regarding the parameter extraction method can be found in reference [24].
3.3. Flight Time Estimation
Using the calculated SOC profile, we could estimate flight time as
where is the flight time of the UAV () and is the SOC decreasing rate (). Here we neglected the slight SOC decreases that occurred during takeoff and landing operations.
4. PPMS
At around sunrise and sunset, power from the sun is weak and so the battery pack mostly supplies the required drone power. During daytime, PV modules rather supply most of the power required from the drone. During nighttime, since none of the sunlight is available, only the battery pack powers the drone. An overall conceptual diagram is shown in Figure 4.
Overall PPMS specifications and configuration are shown in Table 1 and Figure 5. There were three main power connectors connected to the PV modules, battery pack, and UAV. Current and voltage of all three main power connectors were monitored. Here, the arrow represents the direction of the energy flow. We show voltage and current data of the PV modules, battery pack, and UAV, progress time, and battery pack temperature from the top line in the LCD module. Please refer to Appendix A for the overall schematic.
5. Current and Voltage Profiles of PV Modules and UAV
Current and voltage profiles of PV modules and UAV were obtained as shown in Figure 6 by performing outdoor experiments at the Dongshin University schoolyard on 5 September 2018 (GPS coordinates: 35.053889, 126.719334, temperature high/low: 27 °C/17 °C, elevation: 28 m, daylight hours: 12.5 h, global horizontal irradiation (GHI): 1440 per year, direct normal irradiation (DNI): 1108 per year, and diffuse horizontal irradiation (DIF): 752 per year) [25]. Data was obtained by measuring the current and voltage at every hour on the hour and so we assumed the voltage and current were constant for an hour.
In particular, the current profile shown in Figure 7 is divided into three regions (takeoff, hovering, and landing) and the mean value of each region was calculated as shown in Table 2 which was used for the experiments in the next section. We assumed the current was constant during each flight mode: takeoff flight operated for 5 s, hovering flight operated for 80 s, and landing flight operated for 5 s. Although the hovering flight data in Figure 7 was for about 500 s, we set the hovering flight mode only for 70 s to ease the experiment.
6. Results and Discussion
6.1. Experiment Setup
A conceptual diagram of the indoor charge–discharge experiment setup and overall experiment setup and procedure are shown in Figure 8 and Figure 9. The DC power supply provides power by simulating the current profile of the PV modules (Figure 6a) and the UAV discharges energy by simulating the current profile of the UAV (Figure 7). The PPMS logs voltage, current, and temperature data into a built-in SD card coming from the DC power supply ( and ), battery pack (, , and ), and UAV ( and ) and the data can be viewed through the serial monitor installed in a PC. Figure 10 is the diagram of the experimental procedure.
6.2. Experimental Results
After completing the experiment procedure, we obtained the hourly results as shown in Figure 11. Here, the current and voltage transition occurred due to the manual turning on/off procedure of the power supply between cycles.
6.3. Analysis
Using the current and voltage patterns shown above, we calculated SOC profiles and leftover SOCs as shown in Figure 12 and Table 3. Here, the short SOC increase in each profile occurred due to the manual turning on/off procedure of the power supply to set the next current and voltage patterns following Figure 6a. As we expected, the slope decreased gently when there was high solar power generation and vice versa. In particular, decreasing slope reached the maximum at 18:00 p.m. since there was no solar power generation and so only the battery pack gave power to the UAV.
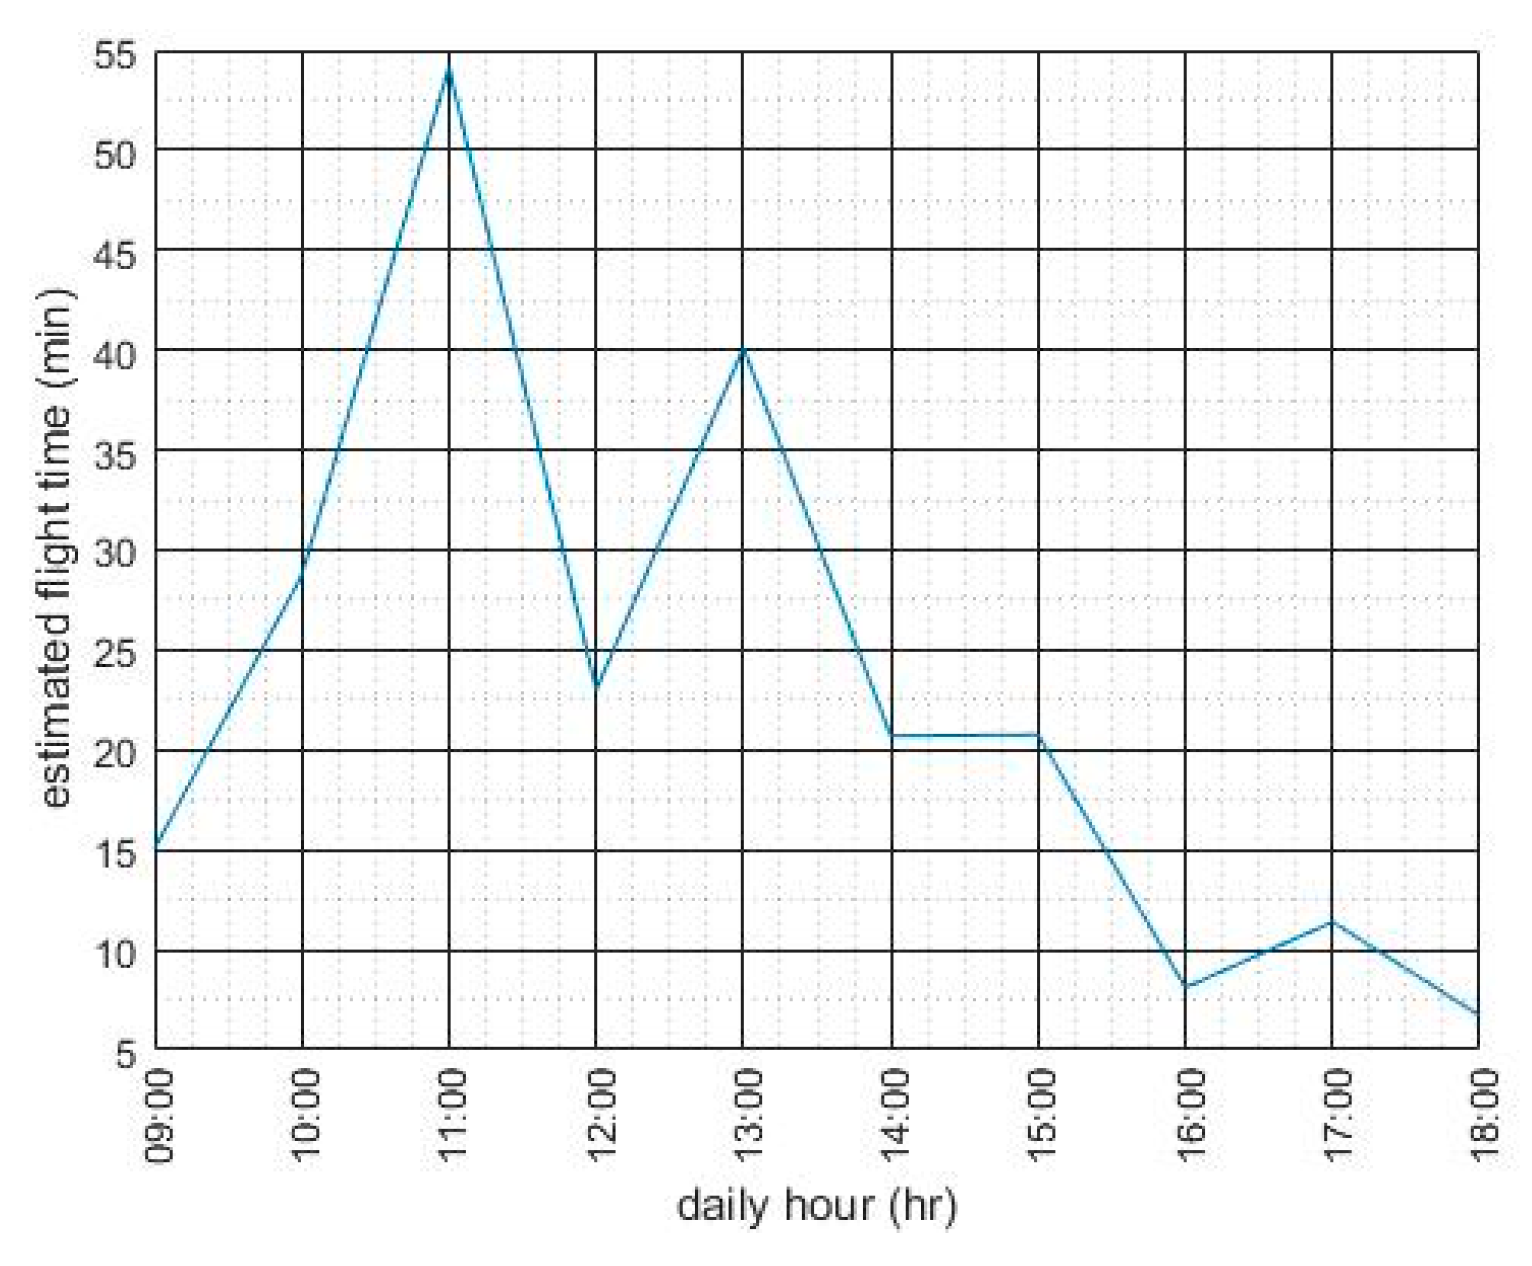
Using the amount of decreasing slope, we could estimate the flight time as shown in Figure 13 and Table 4. At around noon, from 11:00 a.m. to 13:00 p.m., much longer flight time was obtained than at the other time periods. The sudden discharging time decrease at 12:00 p.m. occurred as the clouds covered the sun.
7. Conclusions
Using the PPMS, the development of the multirotor LALE UAV was studied by investigating the current and voltage patterns when the UAV performed takeoff, hovering, and landing flight modes. Using the SOC estimation method based on both EKF and CF algorithms, we firstly calculated SOC and then calculated the slope of the SOC graph which was eventually used to estimate the possible flight time of the UAV.
According to the results, estimated flight time increased up to 54.14 at 11:00 a.m. and decreased down to 6.70 at 18:00 p.m. From the experiment results we could estimate that a longer flight time could be obtained when the sun was at high altitude and vice versa. If there were no clouds covering the sun, the UAV could fly for about an hour at around noon which was much higher than the flight time of the traditional multirotor UAV.
In the future, we will improve the current version of the PPMS by fusing the MPPT algorithm (online ESC), miniaturizing the printed circuit board (PCB) light enough to mount on the small UAV, and developing the swarm of vertical takeoff and landing (VTOL) fixed-wing hybrid LALE UAVs for continuous surveillance missions.
Author Contributions
S.J. created models, developed methodology, designed computer programs, conducted research and investigation process, wrote the initial draft, edited the initial draft, supervised and leaded responsibility for the research activity planning; Y.J. designed computer programs; Y.-J.K. reviewed the manuscript and synthesized study data. All authors read and approved the manuscript.
Funding
This research was funded by the National Research Foundation of Korea (2017R1C1B5018040) and by the Gachon University Research Fund of 2018 (GCU-2018-0294).
Conflicts of Interest
The authors declare no conflict of interest.
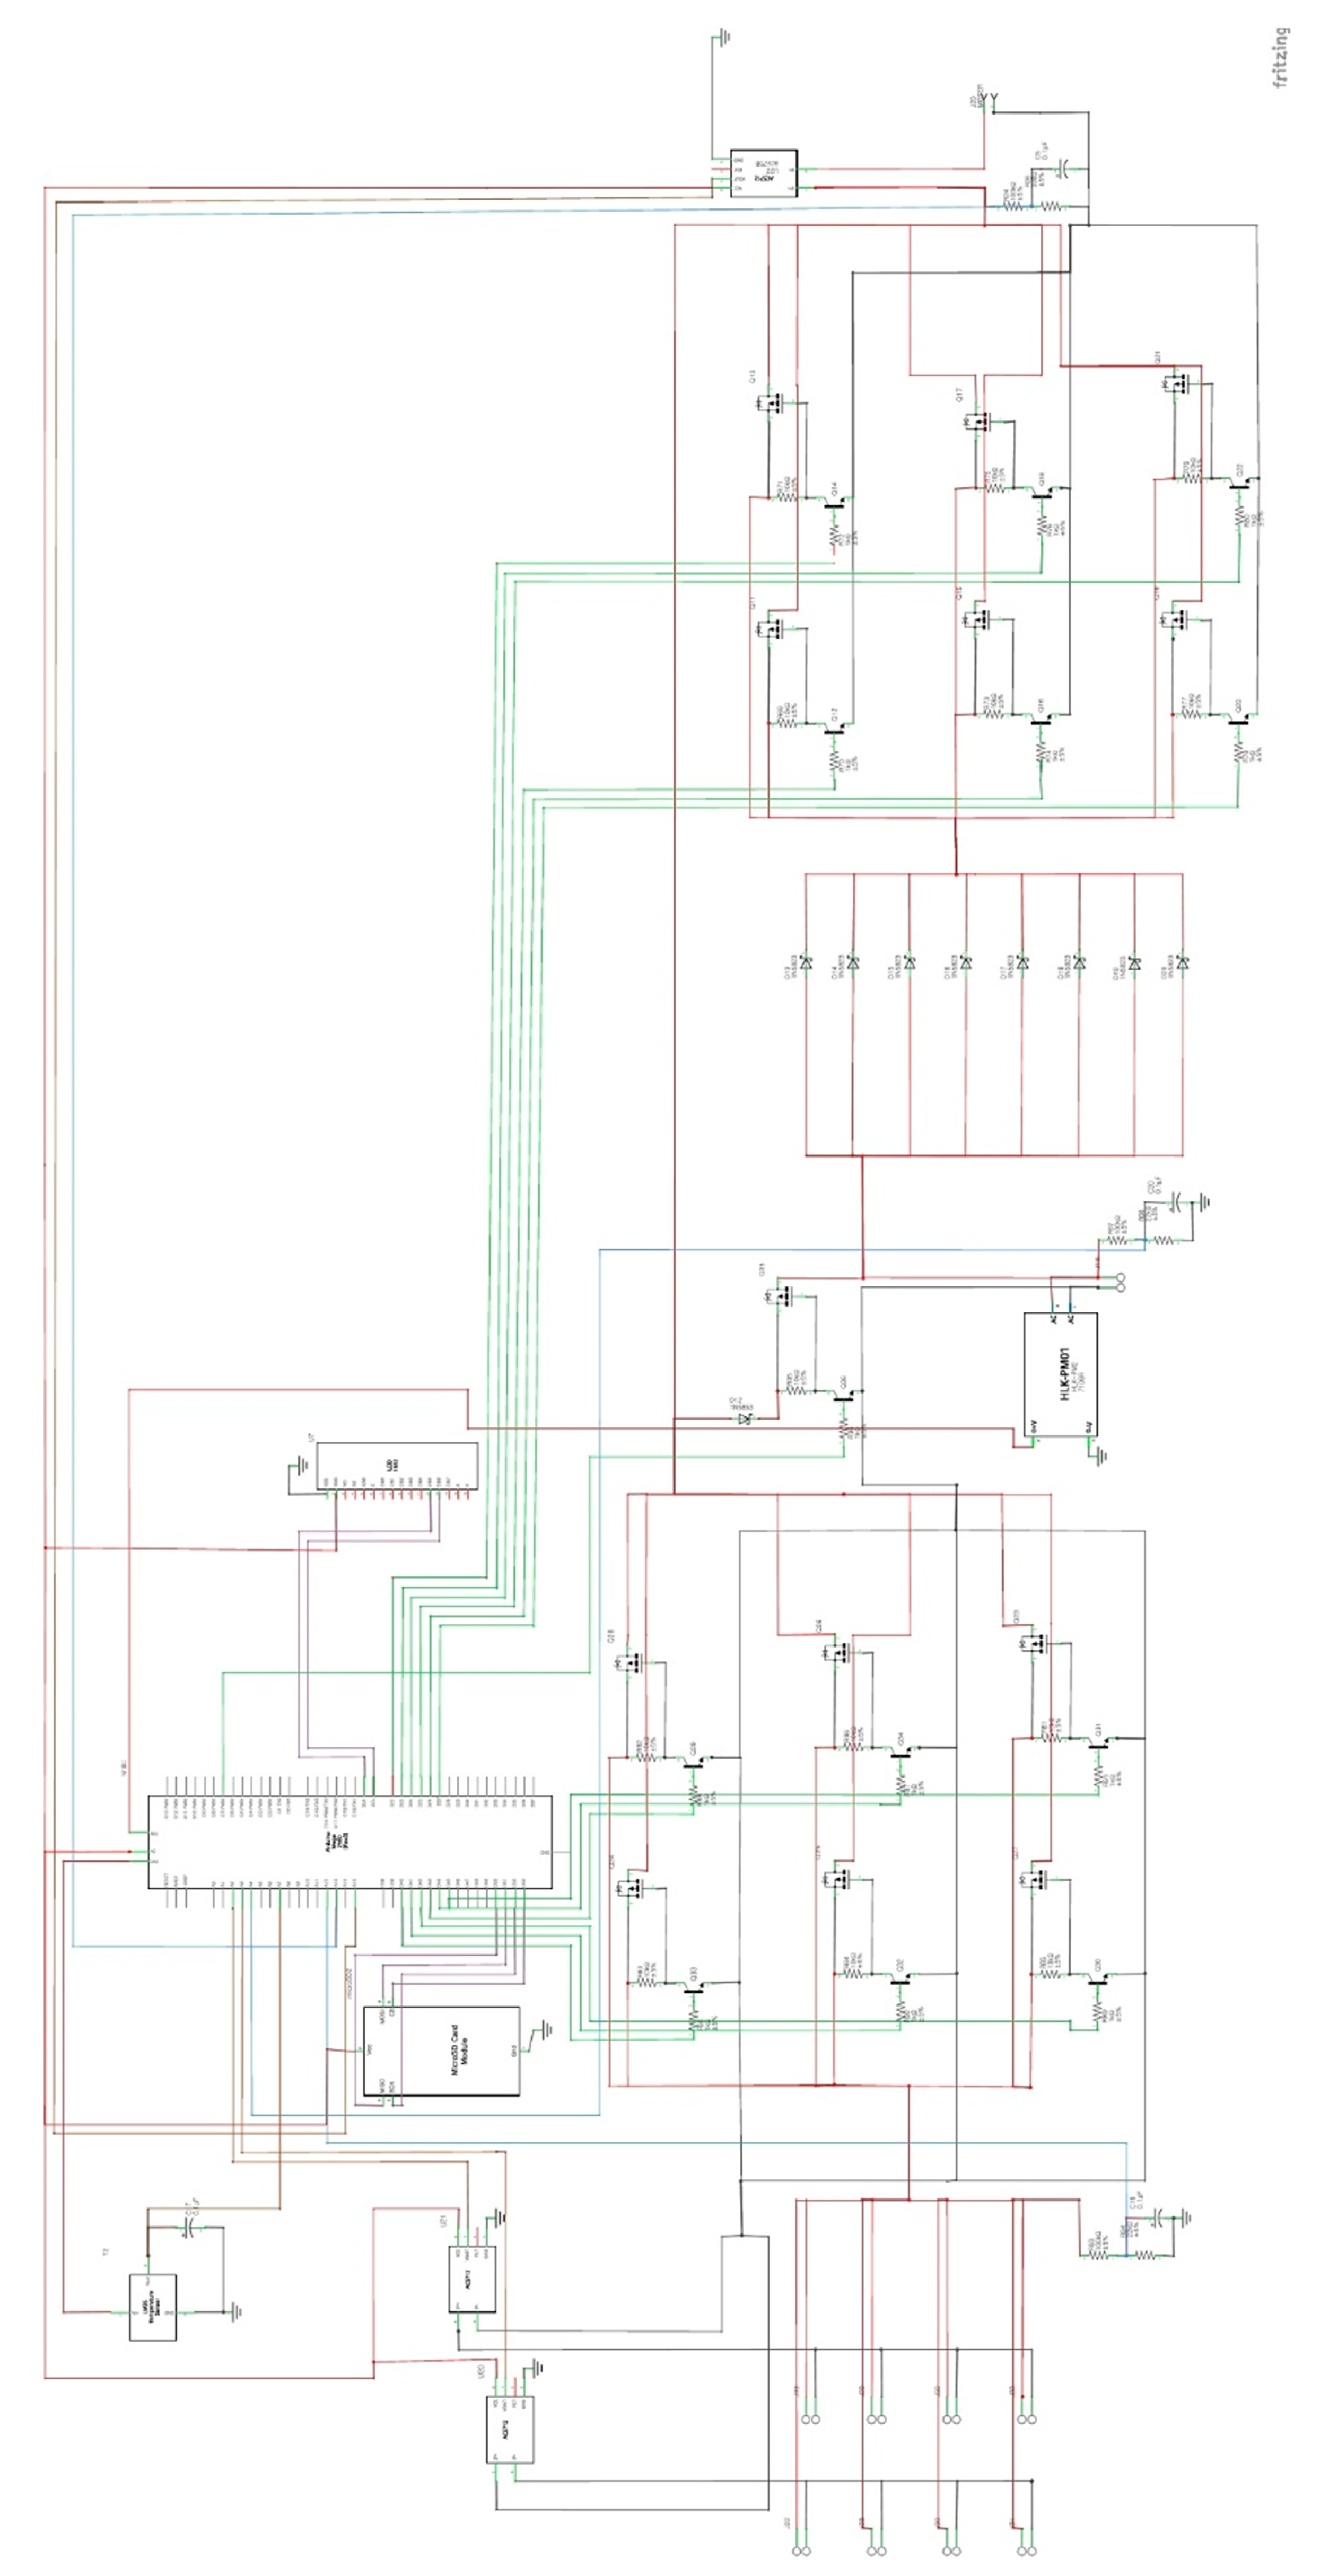
Appendix A. Schematic of PPMS
Figure A1.
Schematic of PPMS.
References
- Small Unmanned Systems (Fly All Day: Endurance is Everything). Available online: https://goo.gl/s9fnY2 (accessed on 26 February 2019).
- Baldock, N.; Mokhtarzadeh-Dehghan, M.R. A Study of Solar-Powered, High-Altitude Unmanned Aerial Vehicles. Aircr. Eng. Aerosp. Technol. 2006, 78, 187–193. [Google Scholar] [CrossRef]
- Cestino, E. Design of Solar High Altitude Long Endurance Aircraft for Multi Payload & Operations. Aerosp. Sci. Technol. 2006, 10, 541–550. [Google Scholar]
- Klesh, A.T.; Kabamba, P.T. Solar-Powered Aircraft: Energy-Optimal Path Planning and Perpetual Endurance. J. Guid. Control. Dyn. 2009, 32, 1320–1329. [Google Scholar] [CrossRef]
- Morton, S.; Scharber, L.; Papanikolopoulos, N. Solar Powered Unmanned Aerial Vehicle for Continuous Flight: Conceptual Overview and Optimization. In Proceedings of the IEEE International Conference on Robotics and Automation, Karlsruhe, Germany, 6–10 May 2013. [Google Scholar]
- Reisi, A.R.; Moradi, M.H.; Jamasb, S. Classification and Comparison of Maximum Power Point Tracking Techniques for Photovoltaic System: A Review. Renew. Sustain. Energy Rev. 2013, 19, 433–443. [Google Scholar] [CrossRef]
- Olalla, C.; Arteaga, M.I.; Leyva, R.; Aroudi, A.E. Analysis and Comparison of Extremum Seeking Control Techniques. In Proceedings of the IEEE International Symposium on Industrial Electronics, Vigo, Spain, 4–7 June 2007. [Google Scholar]
- Lee, B.; Kwon, S.; Park, P.; Kim, K. Active Power Management System for an Unmanned Aerial Vehicle Powered by Solar Cells, a Fuel Cell, and Batteries. IEEE Trans. Aerosp. Electron. Syst. 2014, 50, 3167–3177. [Google Scholar] [CrossRef]
- Harmon, F.G.; Frank, A.A.; Chattot, J. Conceptual Design and Simulation of a Small Hybrid-Electric Unmanned Aerial Vehicle. J. Aircr. 2006, 43, 1490–1498. [Google Scholar] [CrossRef]
- Malaver, A.; Motta, N.; Corke, P.; Gonzalez, F. Development and Integration of a Solar Powered Unmanned Aerial Vehicle and a Wireless Sensor Network to Monitor Greenhouse Gases. Sensors 2015, 15, 4072–4096. [Google Scholar] [CrossRef] [PubMed] [Green Version]
- Bq2403x Single-Chip Charge and System Power-path Management IC (bqTINYTM). Available online: https://goo.gl/Tr6A74 (accessed on 25 December 2018).
- Smith, N. Dynamic Power Path Management Simplifies Battery Charging from Solar Panels; Texas Instruments: Dallas, TX, USA, 2006; pp. 1–5. [Google Scholar]
- Malaver, A.; Matteocci, F.; Carlo, A.D.; Corke, P.; Motta, N. Remote Monitoring of Outdoor Performance of Low Scale Dye Sensitized Solar Cells for Nanosensors Nodes. In Proceedings of the Chemical, Biological & Environmental Engineering, Harbour Plaza Resort City, Hong Kong, China, 12 July 2011. [Google Scholar]
- Meyer, J.; Plessis, J.; Ellis, P.; Clark, W. Design Considerations for a Low Altitude Long Endurance Solar Powered Unmanned Aerial Vehicle. In Proceedings of the IEEE AFRICON, Windhoek, South Africa, 26–28 September 2007. [Google Scholar]
- He, H.; Xiong, R.; Fan, J. Evaluation of Lithium-Ion Battery Equivalent Circuit Models for State of Charge Estimation by an Experimental Approach. Energies 2011, 4, 582–598. [Google Scholar] [CrossRef] [Green Version]
- Johnson, V.H. Battery Performance Models in ADVISOR. J. Power Sources 2002, 110, 321–329. [Google Scholar] [CrossRef]
- He, H.; Xiong, R.; Zhang, X.; Sun, F.; Fan, J. State-of-Charge Estimation of the Lithium-Ion Battery using an Adaptive Extended Kalman Filter Based on an Improved Thevenin Model. IEEE Trans. Veh. Technol. 2011, 60, 1461–1469. [Google Scholar]
- Plett, G.L. Extended Kalman Filtering for Battery Management Systems of LiPB-Based HEV Battery Packs: Part 2. Modeling and Identification. J. Power Sources 2004, 134, 262–276. [Google Scholar] [CrossRef]
- Gao, M.; Liu, Y.; He, Z. Battery State of Charge Online Estimation based on Particle Filter. In Proceedings of the 4th International Congress on Image and Signal Processing, Shanghai, China, 15–17 October 2011; Volume 4. [Google Scholar]
- He, Z.; Gao, M.; Wang, C.; Wang, L.; Liu, Y. Adaptive State of Charge Estimation for Li-Ion Batteries Based on an Unscented Kalman Filter with an Enhanced Battery Model. Energies 2013, 6, 4134–4151. [Google Scholar] [CrossRef] [Green Version]
- Sung, W.; Shin, C. Electrochemical Model of a Lithium-Ion Battery Implemented into an Automotive Battery Management System. Comput. Chem. Eng. 2015, 76, 87–97. [Google Scholar] [CrossRef]
- Song, L.; Evans, J.W. Electrochemical-Thermal Model of Lithium Polymer Batteries. J. Electrochem. Soc. 2000, 147, 2086–2095. [Google Scholar] [CrossRef]
- Bartlett, A.; Marcicki, J.; Onori, S.; Rizzoni, G.; Yang, X.G.; Miller, T. Electrochemical Model-Based State of Charge and Capacity Estimation for a Composite Electrode Lithium-Ion Battery. IEEE Trans. Control Syst. Technol. 2016, 24, 384–399. [Google Scholar] [CrossRef]
- Jung, S.; Jeong, H. Extended Kalman Filter-Based State of Charge and State of Power Estimation Algorithm for Unmanned Aerial Vehicle Li-Po Battery Pack. Energies 2017, 10, 1237. [Google Scholar] [CrossRef]
- GLOBAL SOLAR ATLAS. Available online: https://goo.gl/pwbKFc (accessed on 26 February 2019).
Figure 1.
Step by step scenario of the aerial surveillance operation: (a) step 1, (b) step 2, (c) step 3, and (d) step 4.
Figure 1.
Step by step scenario of the aerial surveillance operation: (a) step 1, (b) step 2, (c) step 3, and (d) step 4.


Figure 2.
Open circuit voltage–state of charge (OCV–SOC) curve.
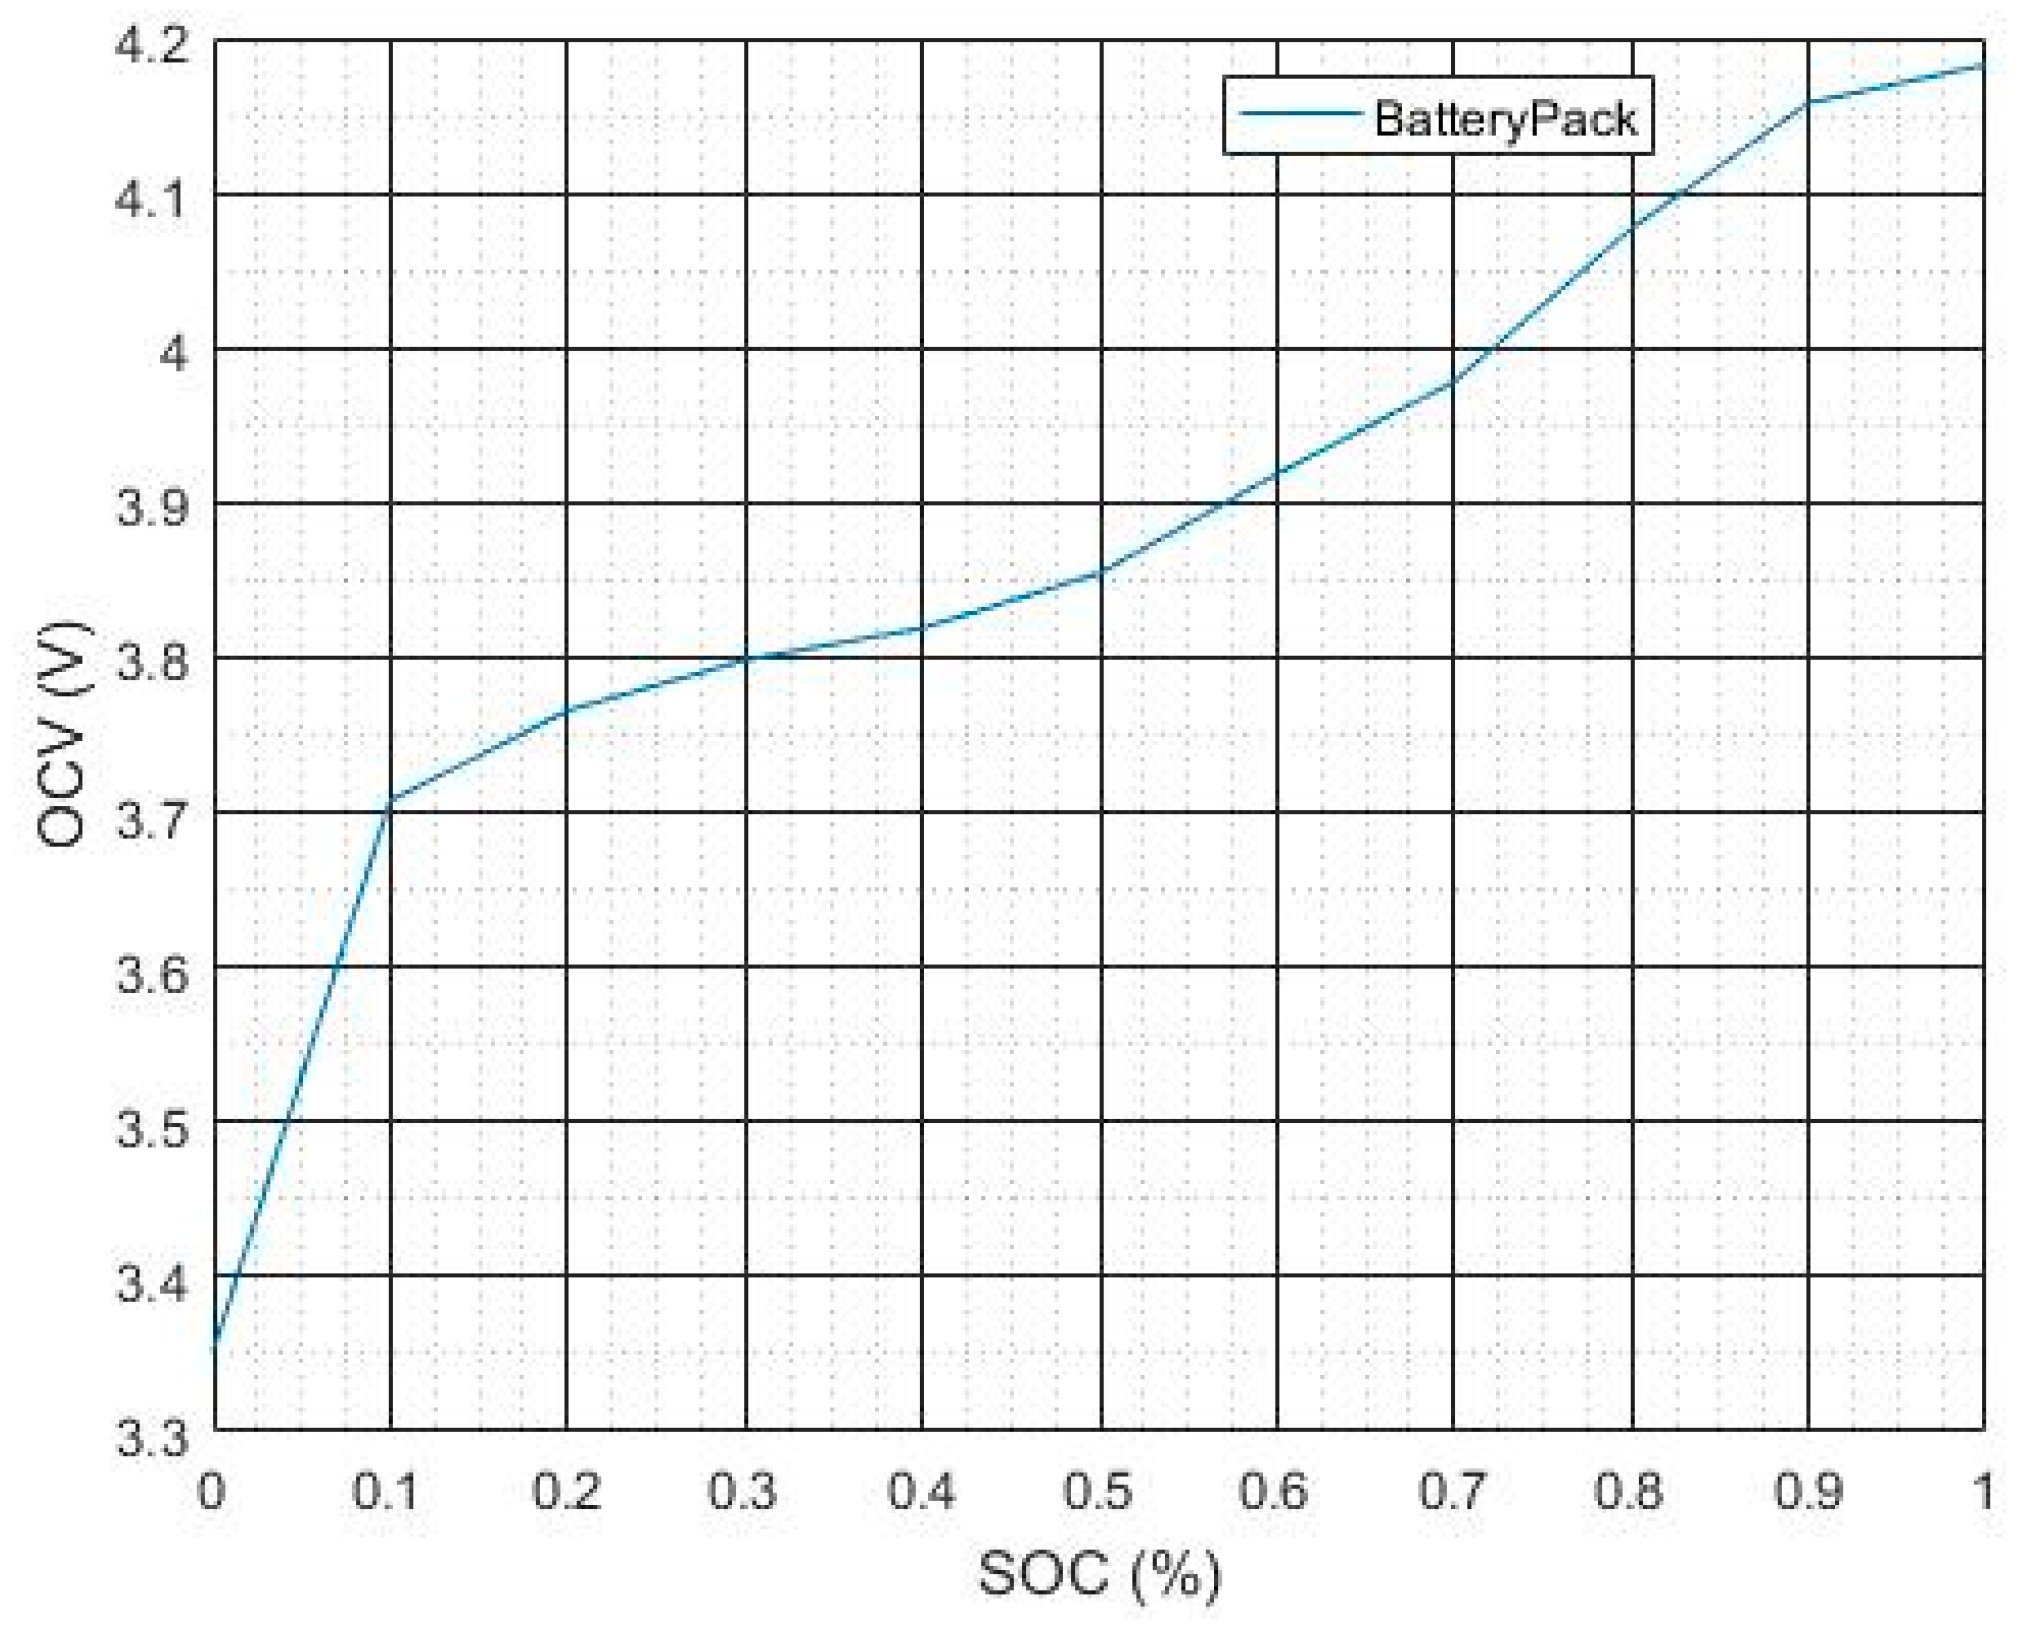
Figure 3.
Extracted parameters of the Li–Po battery pack: (a) , (b) , (c) , (d) , and (e) .
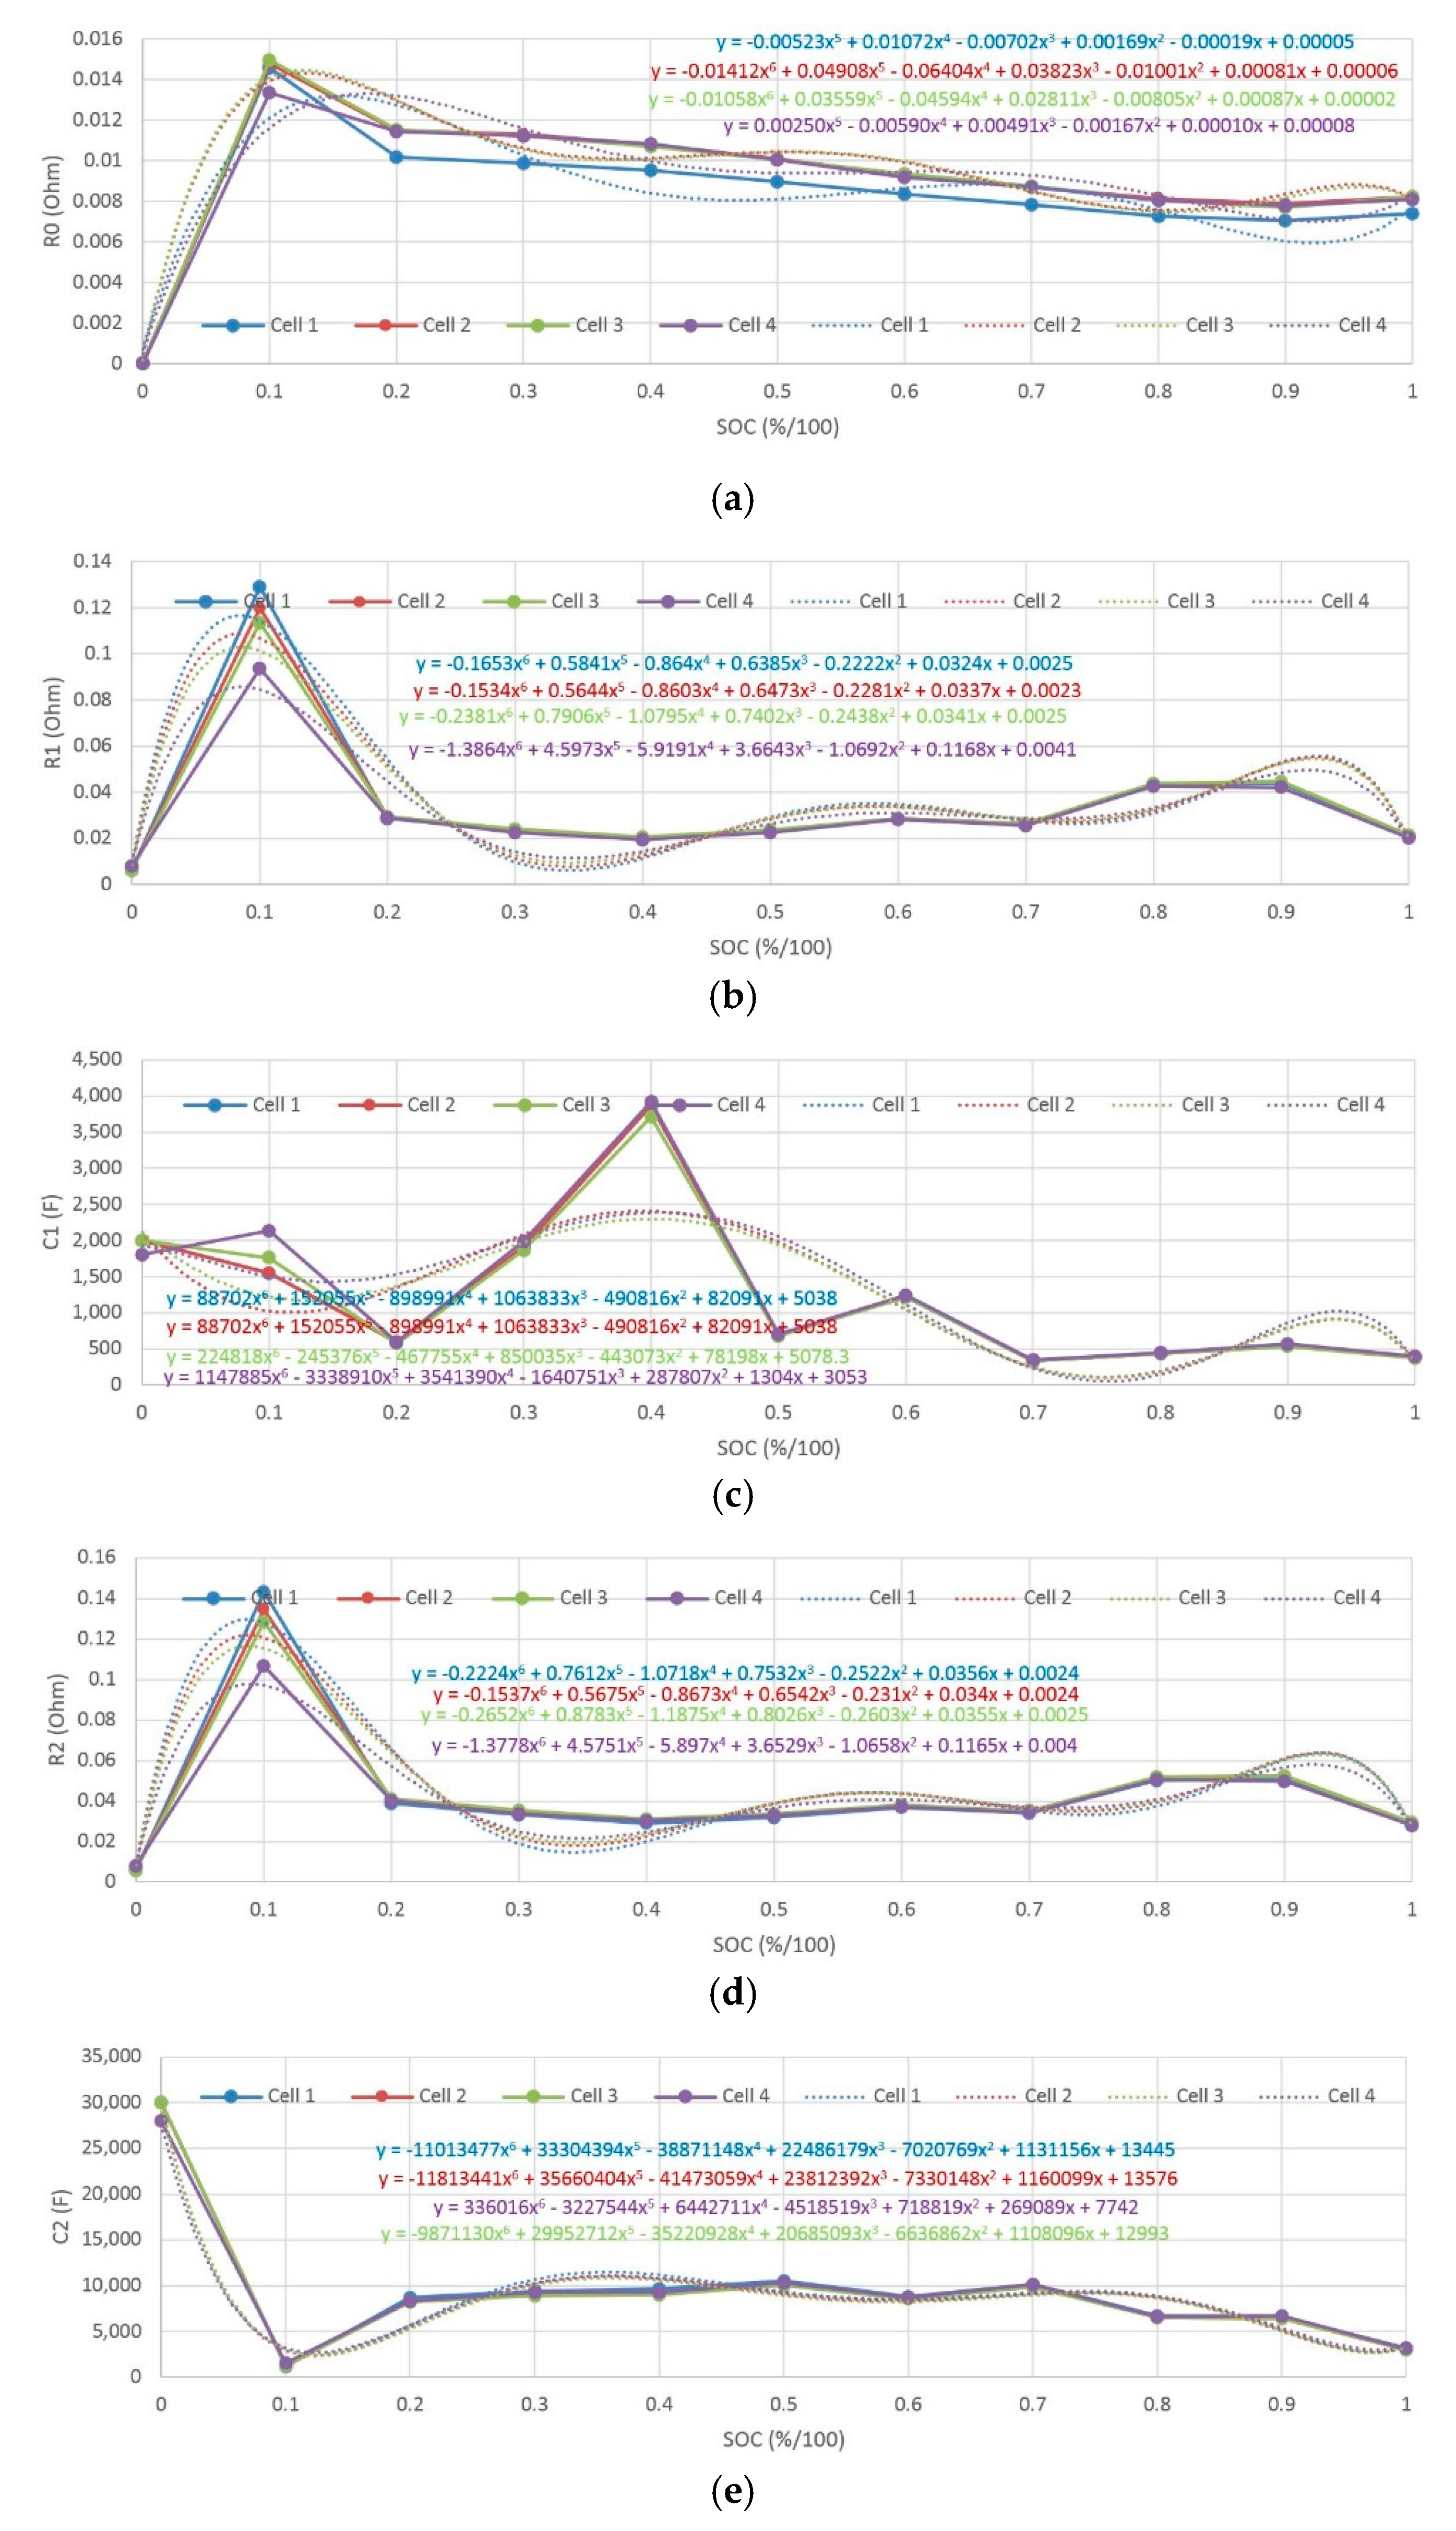
Figure 4.
Operation concept of power transmission during the day.

Figure 5.
Hardware of the PPMS: (a) top view, (b) side view, (c) isometric view, and (d) schematic.
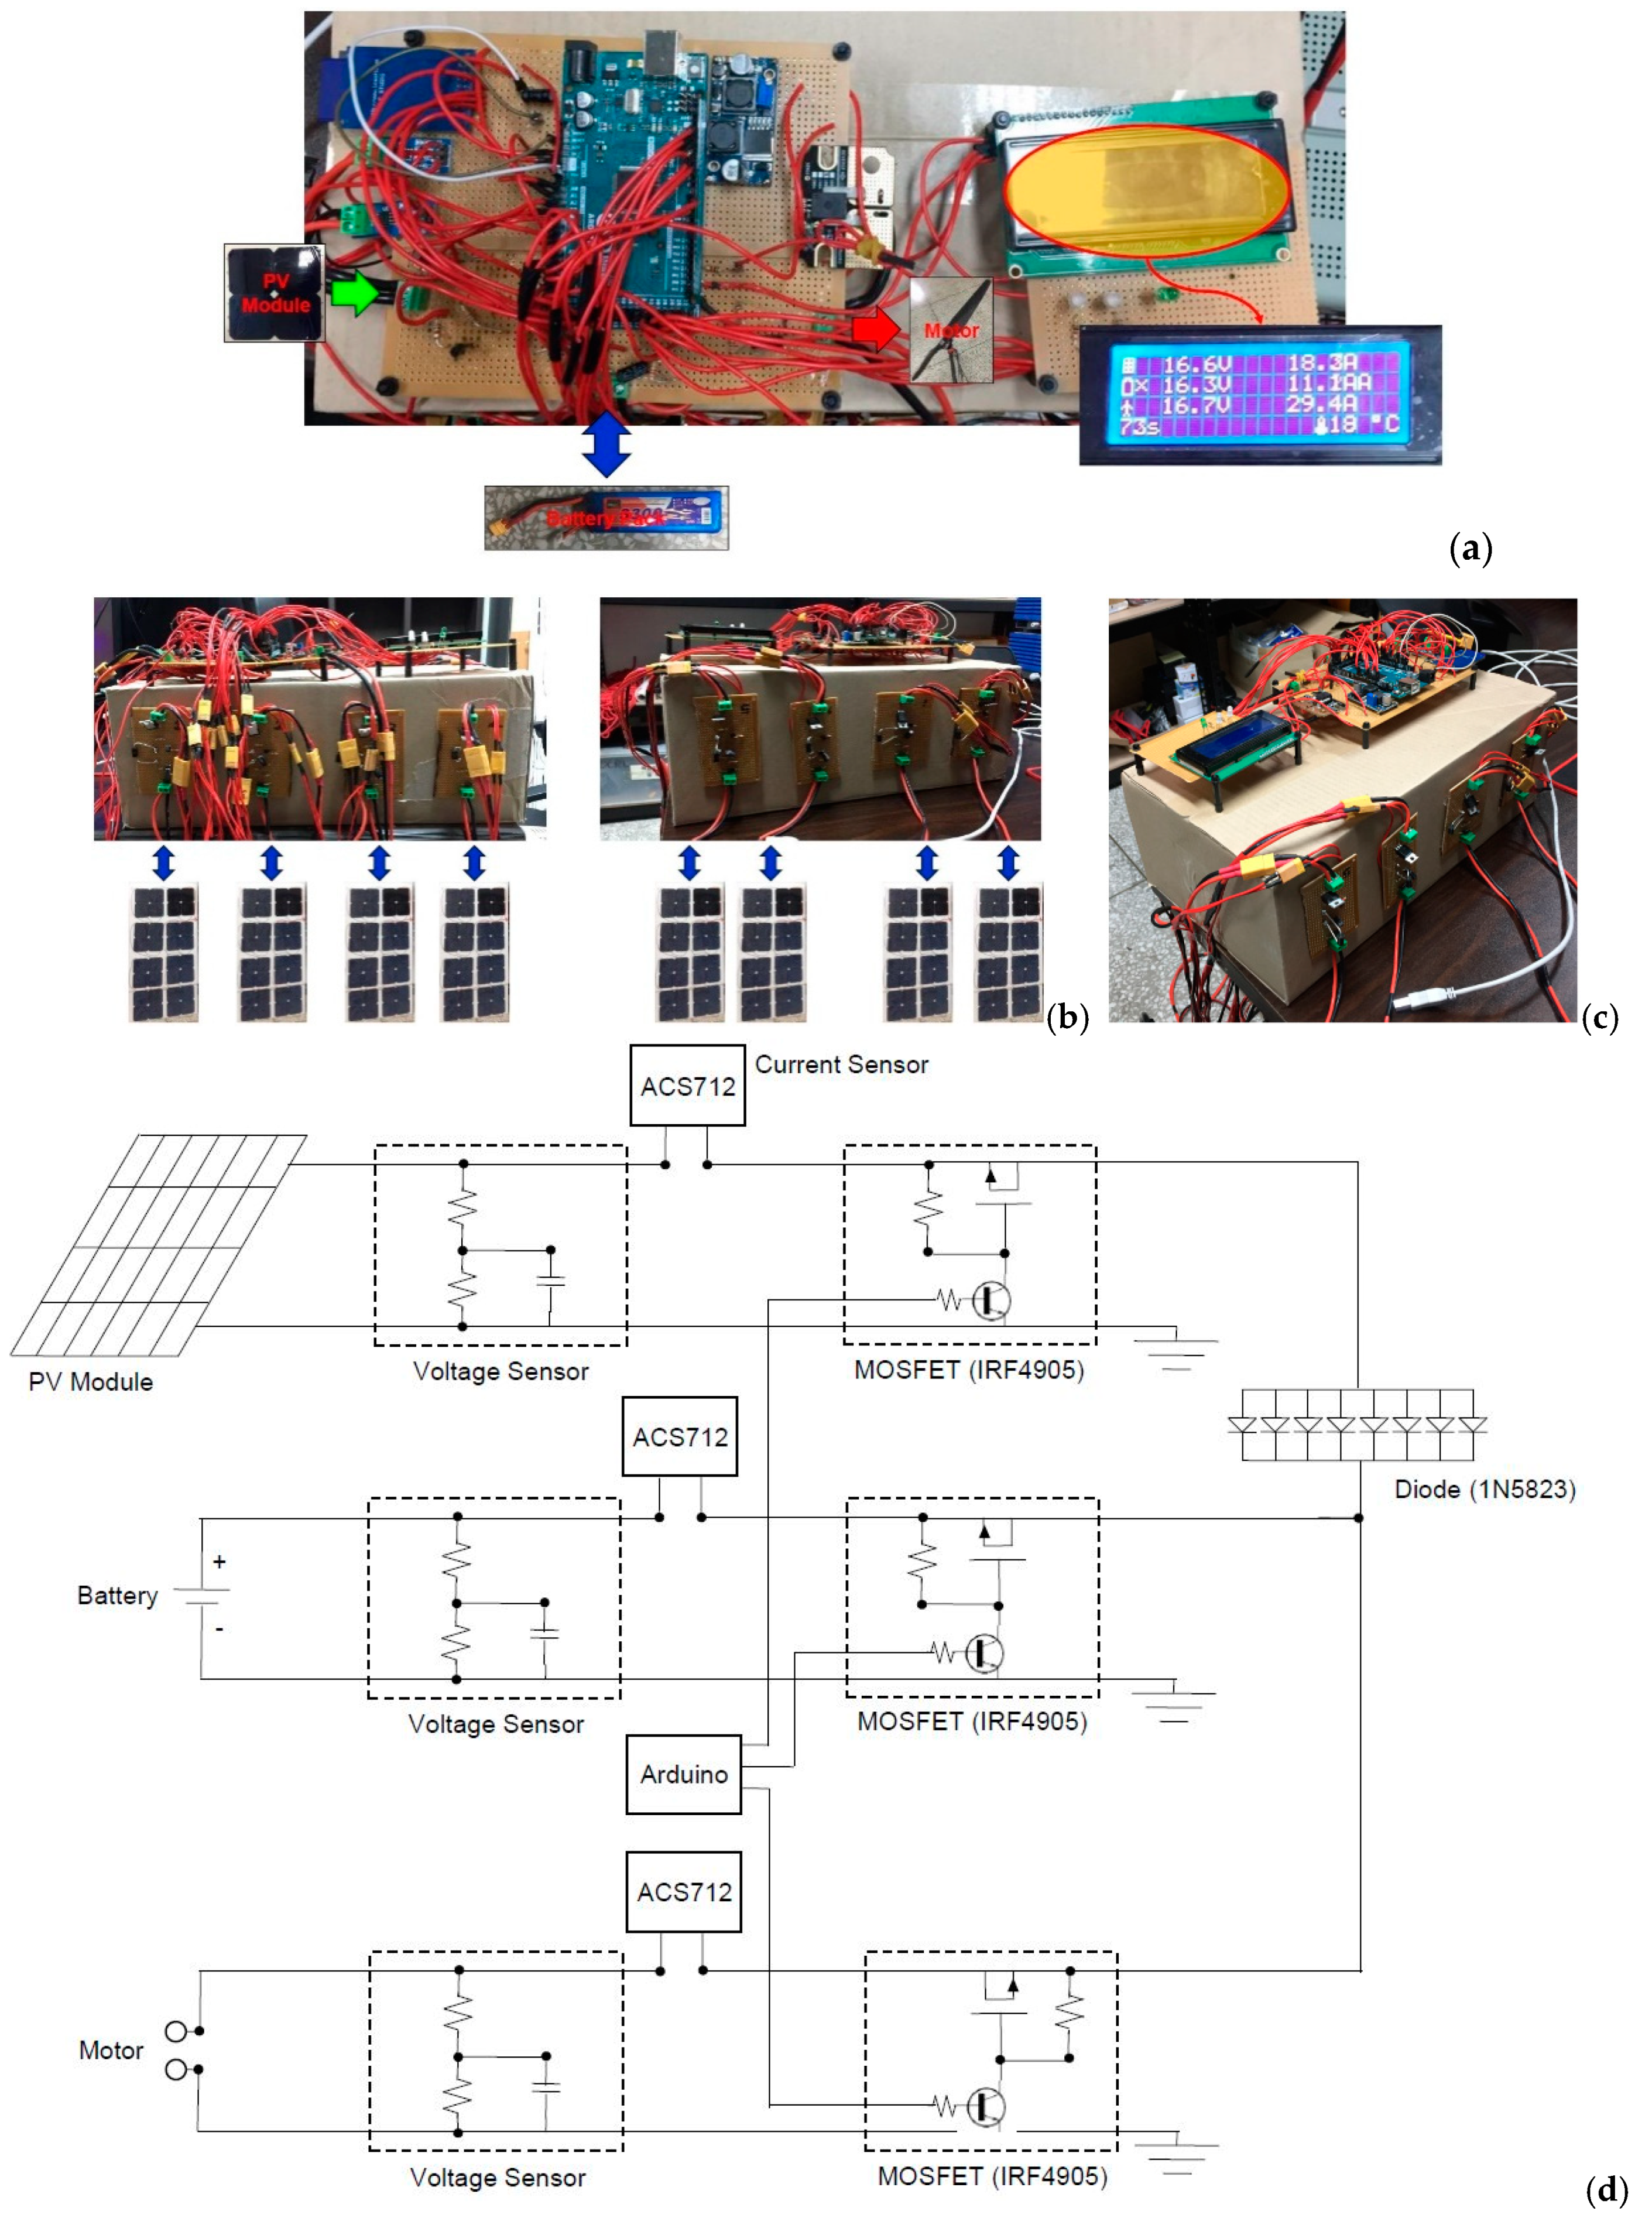
Figure 6.
Current and voltage profile of PV modules: (a) current and voltage per hour and (b) current versus voltage.
Figure 6.
Current and voltage profile of PV modules: (a) current and voltage per hour and (b) current versus voltage.
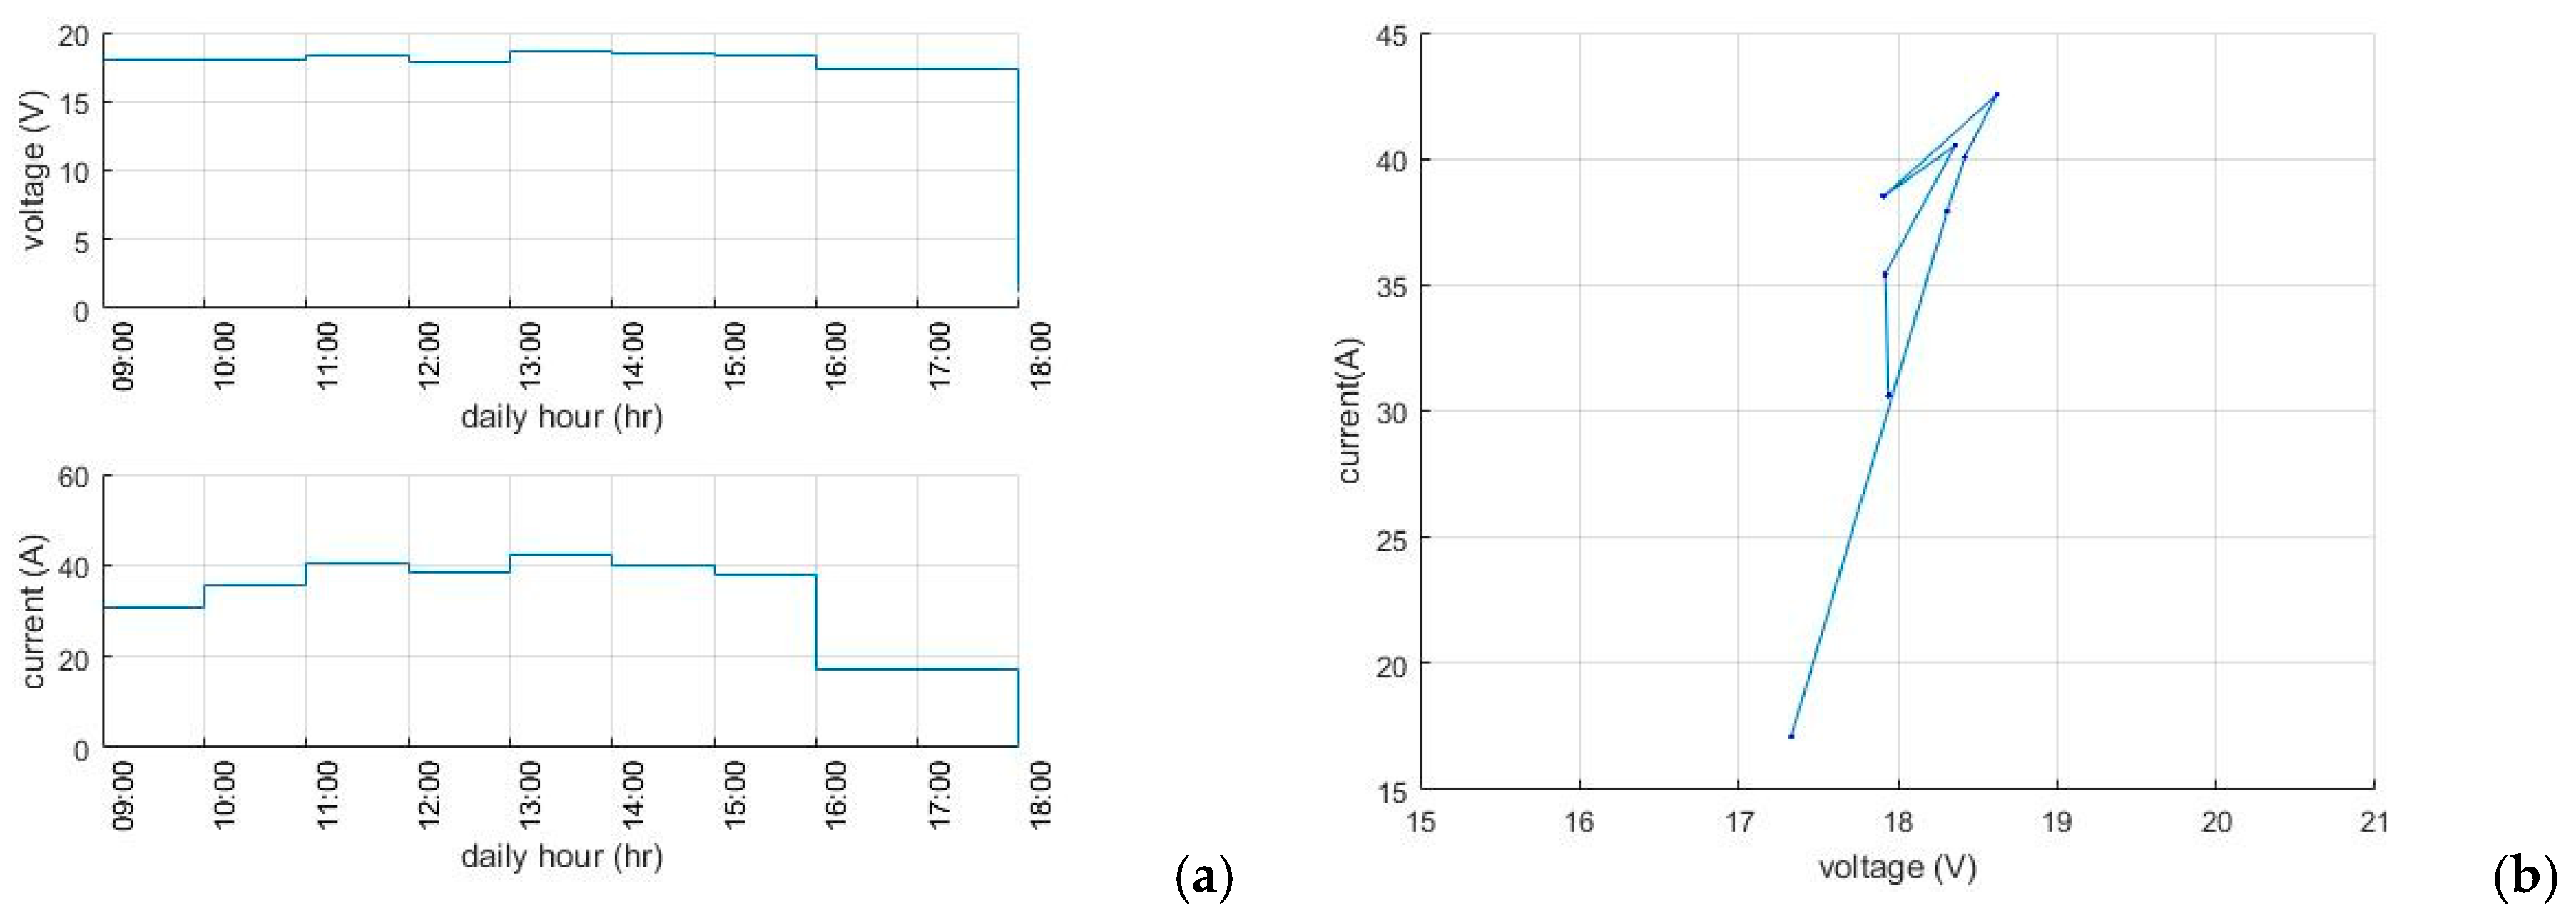
Figure 7.
Current and voltage profile of unmanned aerial vehicles (UAV).
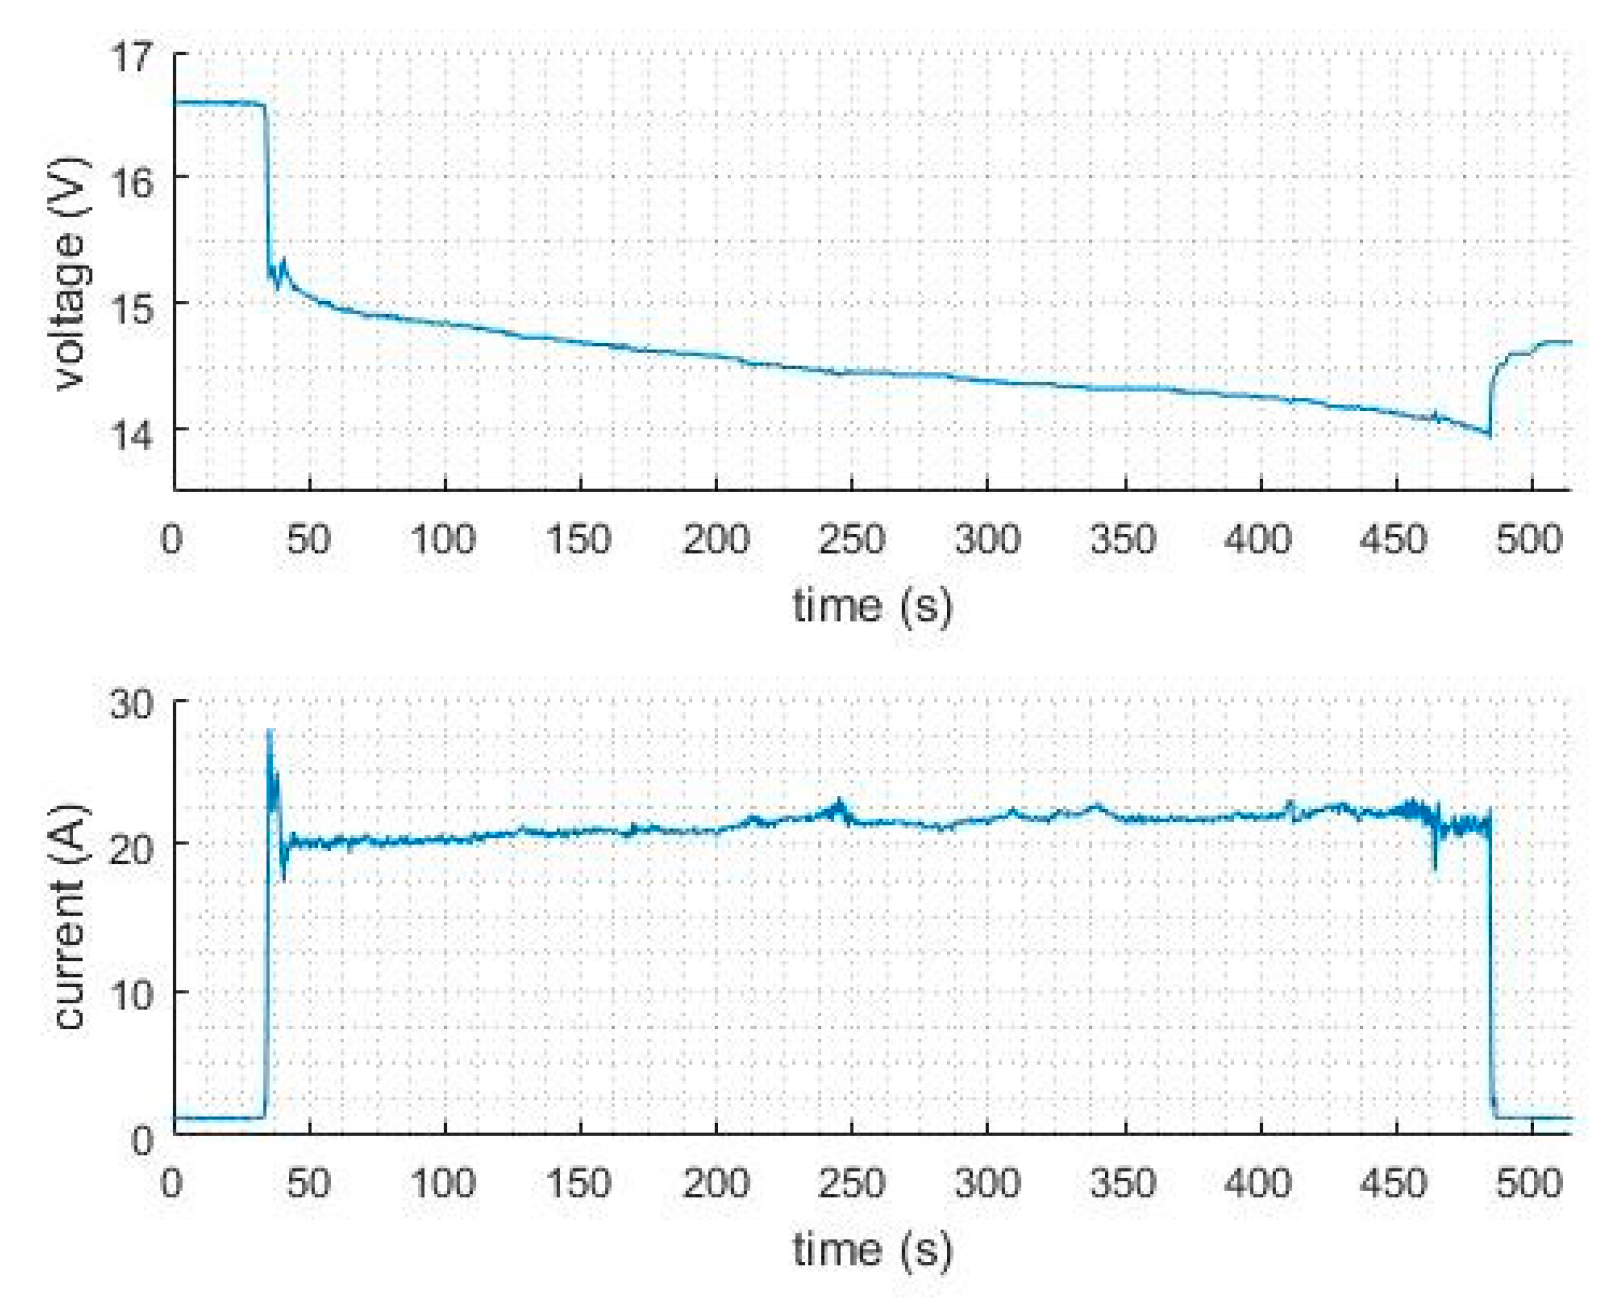
Figure 8.
Conceptual diagram of the experiment.
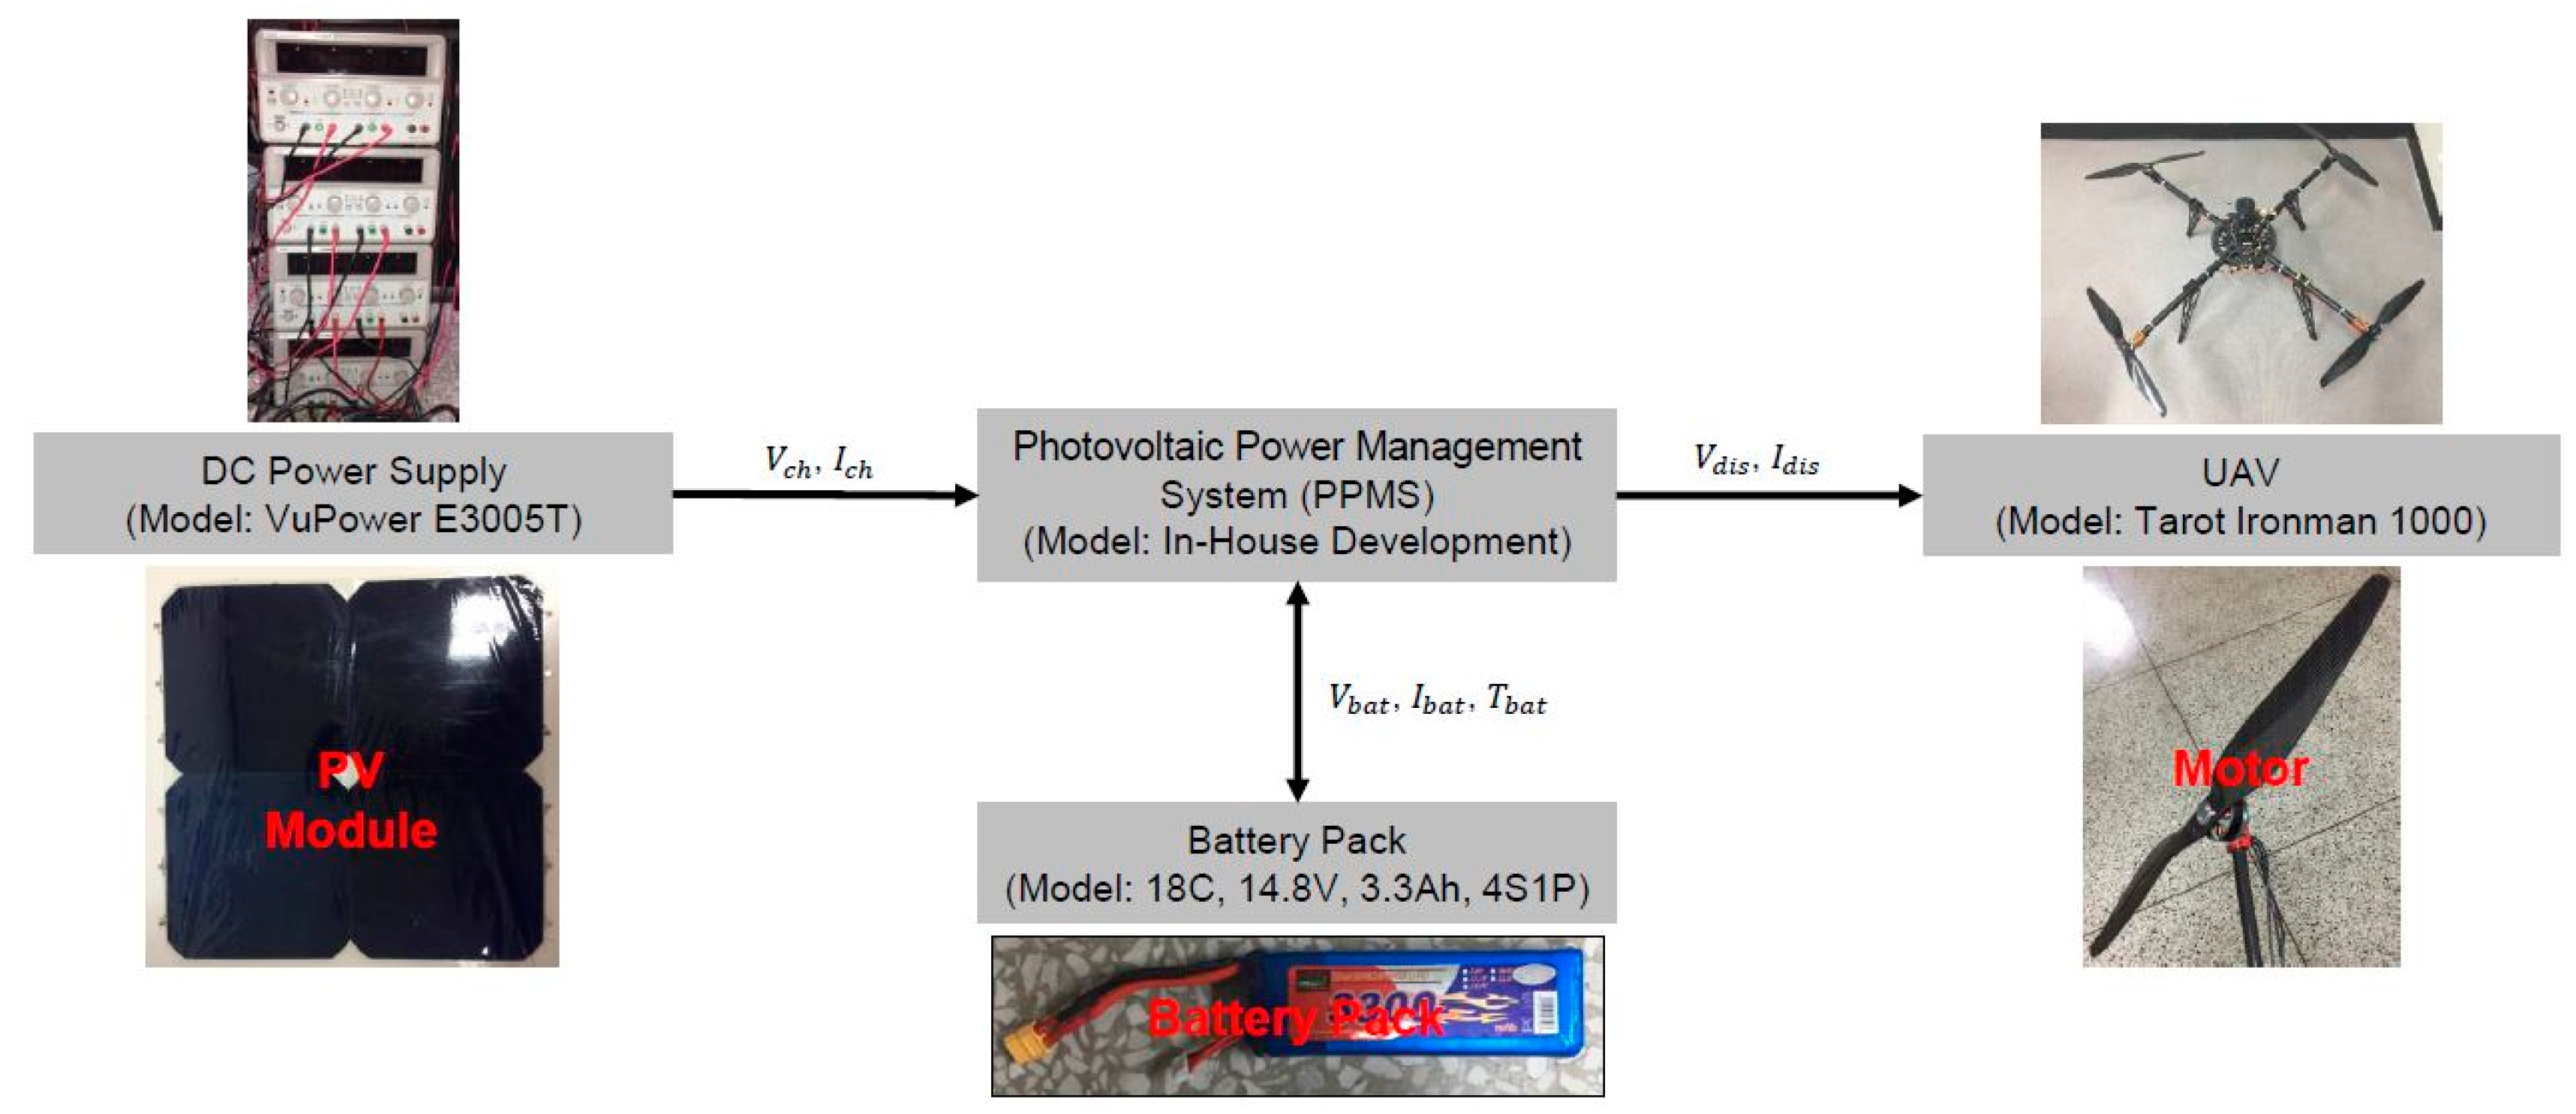
Figure 9.
Experiment setup.

Figure 10.
Experimental procedure.
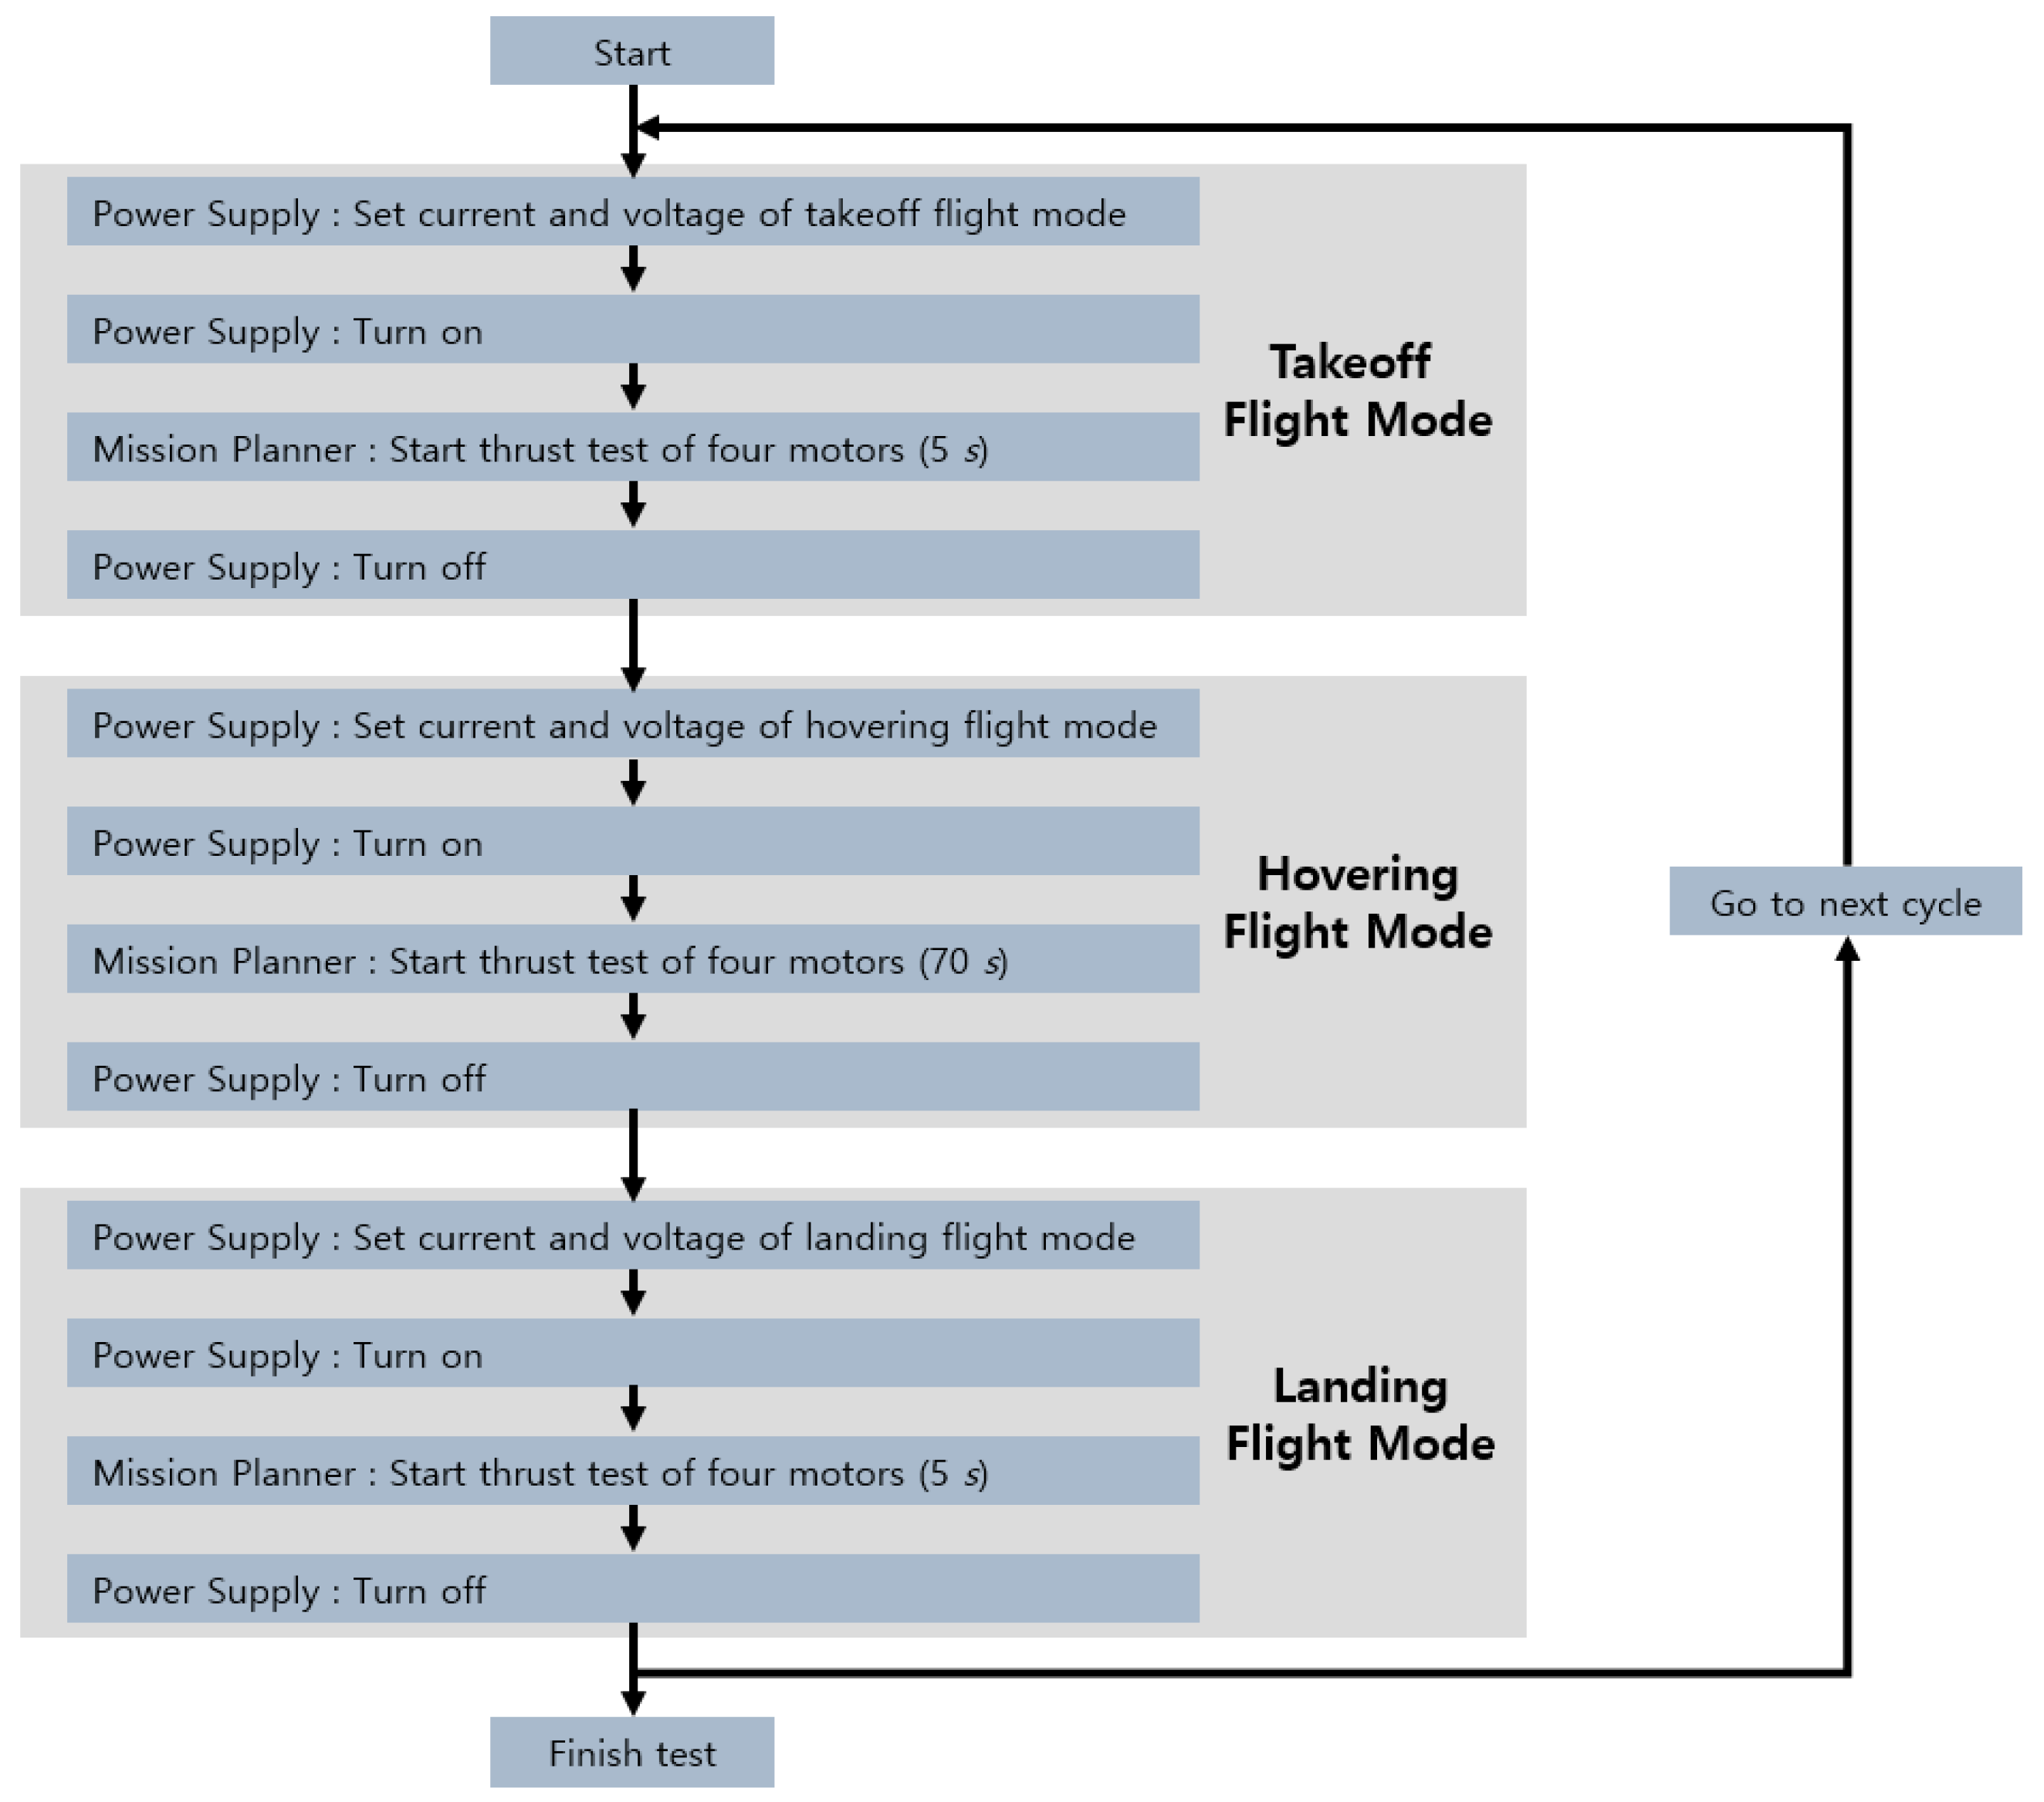
Figure 11.
Current and voltage profiles for each time: (a) 09:00 a.m., (b) 10:00 a.m., (c) 11:00 a.m., (d) 12:00 p.m., (e) 13:00 p.m., (f) 14:00 p.m., (g) 15:00 p.m., (h) 16:00 p.m., (i) 17:00 p.m., and (j) 18:00 p.m.
Figure 11.
Current and voltage profiles for each time: (a) 09:00 a.m., (b) 10:00 a.m., (c) 11:00 a.m., (d) 12:00 p.m., (e) 13:00 p.m., (f) 14:00 p.m., (g) 15:00 p.m., (h) 16:00 p.m., (i) 17:00 p.m., and (j) 18:00 p.m.


Figure 12.
Calculated SOC of the battery pack: (a) SOC profiles and (b) leftover SOC.
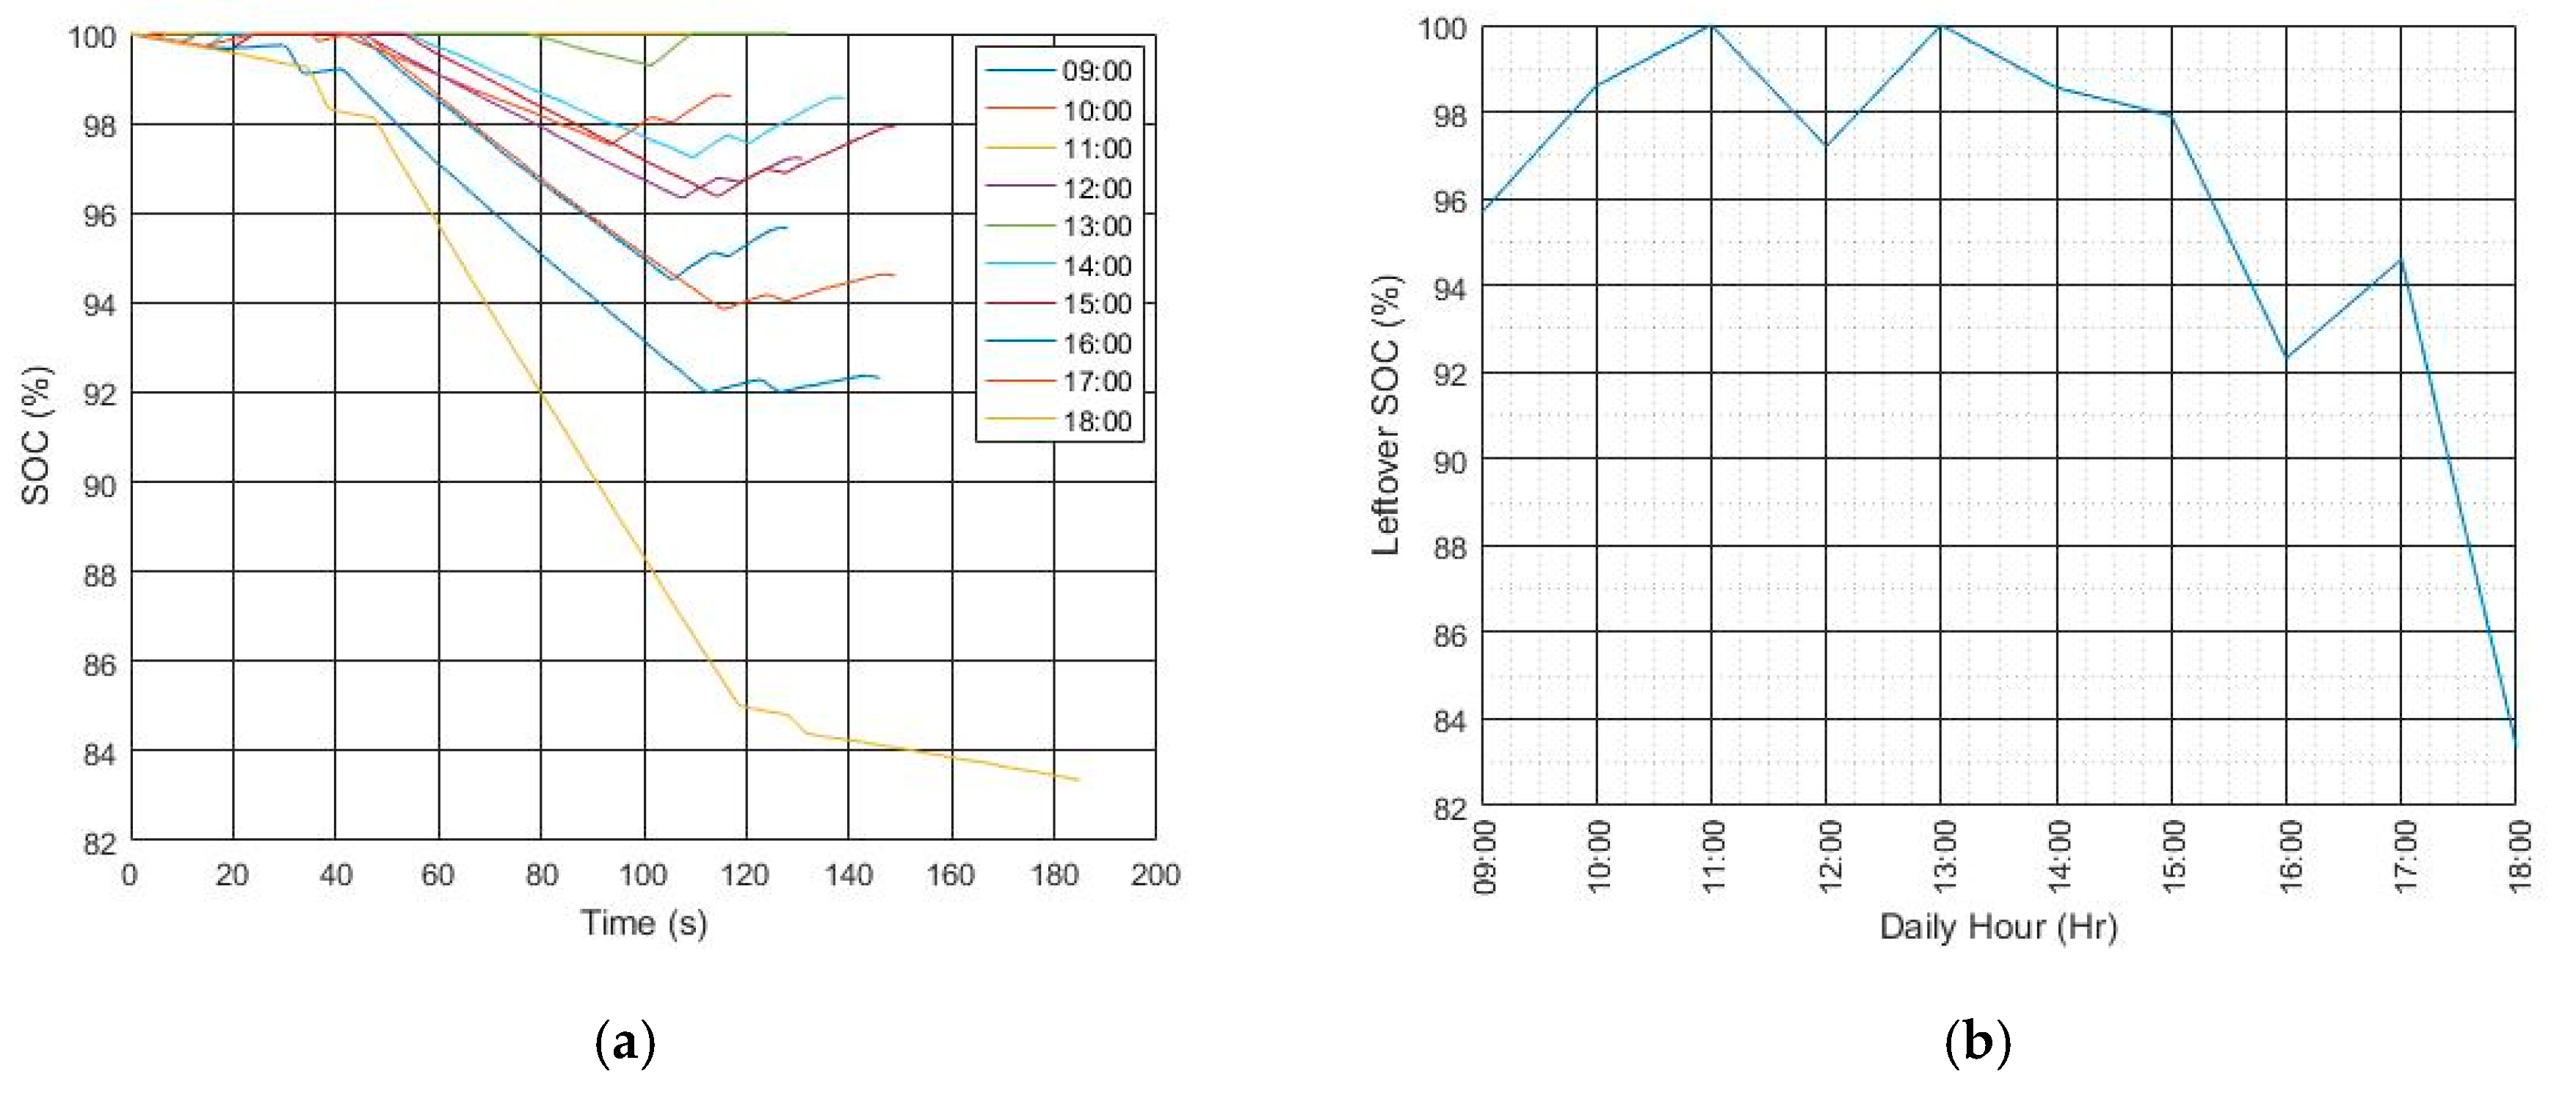
Figure 13.
Estimated flight time for each time.

Table 1.
Specifications of the photovoltaic power management system (PPMS).
| Component | Specification |
|---|---|
| MCU | Arduino Mega 2560 |
| Storage | Transcend 2 GB SD card |
| Current Sensor | Blkbox 100A Bi AC/DC Current Sensor ACS712 30A Current Sensor |
| Voltage Sensor | In-House Development |
Table 2.
Current consumption during UAV flight.
| Flight Mode | Current (A) | Time (s) | Throttle (%) |
|---|---|---|---|
| Takeoff | 28 | 5 | 88 |
| Hovering | 22 | 70 | 76 |
| Landing | 15 | 5 | 59 |
Table 3.
Leftover SOC.
| Order | Daily Hour (h) | Leftover SOC (%) | Rank |
|---|---|---|---|
| 1 | 09:00 | 95.66 | 7 |
| 2 | 10:00 | 98.60 | 3 |
| 3 | 11:00 | 100.00 | 1 and 2 |
| 4 | 12:00 | 97.20 | 6 |
| 5 | 13:00 | 100.00 | 1 and 2 |
| 6 | 14:00 | 98.56 | 4 |
| 7 | 15:00 | 97.91 | 5 |
| 8 | 16:00 | 92.32 | 9 |
| 9 | 17:00 | 94.60 | 8 |
| 10 | 18:00 | 83.35 | 10 |
Table 4.
Discharging time.
| Order | Daily Hour (h) | Discharging Time (min) | Rank |
|---|---|---|---|
| 1 | 09:00 | 15.04 | 7 |
| 2 | 10:00 | 28.71 | 3 |
| 3 | 11:00 | 54.14 | 1 |
| 4 | 12:00 | 22.99 | 4 |
| 5 | 13:00 | 40.10 | 2 |
| 6 | 14:00 | 20.70 | 6 |
| 7 | 15:00 | 20.76 | 5 |
| 8 | 16:00 | 8.11 | 9 |
| 9 | 17:00 | 11.40 | 8 |
| 10 | 18:00 | 6.70 | 10 |
© 2019 by the authors. Licensee MDPI, Basel, Switzerland. This article is an open access article distributed under the terms and conditions of the Creative Commons Attribution (CC BY) license (http://creativecommons.org/licenses/by/4.0/).
Share and Cite
MDPI and ACS Style
Jung, S.; Jo, Y.; Kim, Y.-J. Flight Time Estimation for Continuous Surveillance Missions Using a Multirotor UAV. Energies 2019, 12, 867. https://doi.org/10.3390/en12050867
AMA Style
Jung S, Jo Y, Kim Y-J. Flight Time Estimation for Continuous Surveillance Missions Using a Multirotor UAV. Energies. 2019; 12(5):867. https://doi.org/10.3390/en12050867
Chicago/Turabian StyleJung, Sunghun, Yonghyeon Jo, and Young-Joon Kim. 2019. "Flight Time Estimation for Continuous Surveillance Missions Using a Multirotor UAV" Energies 12, no. 5: 867. https://doi.org/10.3390/en12050867
Note that from the first issue of 2016, this journal uses article numbers instead of page numbers. See further details here.