Article

Flicker of Modern Lighting Technologies Due to Rapid Voltage Changes

1
CIRCE, Universidad de Zaragoza, C/ Mariano Esquillor 15, 50018 Zaragoza, Spain
2
Communications Engineering Department, University of the Basque Country, UPV/EHU, Alameda Urquijo S/N, 48013 Bilbao, Spain
*
Author to whom correspondence should be addressed.
Energies 2019, 12(5), 865; https://doi.org/10.3390/en12050865
Submission received: 9 January 2019 / Revised: 25 February 2019 / Accepted: 26 February 2019 / Published: 5 March 2019
(This article belongs to the Special Issue Power Quality: Monitoring, Mitigation, and New Types of Disturbances)

Abstract

:
The purpose of the present paper is to evaluate the sensitivity of modern lighting technologies to different types of RVCs. In order to do that, 27 modern lamps—mainly LED—have been subjected to real RVCs and their response has been assessed. The detection of RVCs on the grid has been performed according to the IEC 61000-4-30 detection method, while the response of the lamps has been measured with a light flickermeter and characterized using the instantaneous flicker perception, as defined in IEC 61000-4-15. The obtained results show a high dispersion in the response of the modern lighting technologies and high values of flicker perception, although with a lower sensitivity than the incandescent lamp. The results led the authors to propose the definition of a new immunity test to be added to the lamp immunity protocol IEC TR-61547-1, to ensure that newly produced lamps cause limited irritation to grid users.

IEC RMS

1. Introduction

One of the power quality disturbances most easily perceived by grid customers is flicker. Flicker is defined as the impression of unsteadiness of visual sensation induced by a light stimulus whose luminance fluctuates with time [1]. The IEC 61000-4-15 standard [2] defines the flicker measurement instrument, known as IEC flickermeter, which employs a model of a 60 W incandescent lamp as the reference to quantify the irritation produced by voltage fluctuations. The incandescent lamp is also the reference of the so-called P st = 1 curve, which defines the limits of voltage flicker that humans perceive to be irritating [3].
In the last few decades, many countries have been implementing regulations to ban incandescent lamps, encouraging the use of more efficient lighting technologies such as CFL and, mainly, Light Emitting Diode (LEDs) [4,5]. This change has a direct effect on the power quality. On the one hand, new lighting technologies lead to an increase of the current and voltage distortion in the grid [6,7,8,9]. On the other hand, the replacement of incandescent lamps with more efficient lighting technologies gave rise to poor correlation between measured flicker levels and customers complaints [10,11]. To address this latter problem, many researchers worked to develop new instruments, with the objective of assessing flicker due to modern lighting technologies [12,13,14,15,16]. In addition, a lot of effort was put into studying the sensitivity of the new lamps to voltage fluctuations. The very first results indicated that the new lamps were less sensitive to voltage fluctuations than the incandescent lamps [17,18]. However, as technology evolved, more recent works proved that this assumption was not always true [19,20,21]. As a consequence, modern lighting technologies are no longer considered a priori immune from flicker [22]. The working group MT1 IEC-TC34, with the support of IEC-SC77A-WG2, developed an immunity protocol to test the sensitivity of lighting equipment during their design stage [23]. Compliance with the protocol guarantees a lower sensitivity to voltage fluctuations for newly produced lamps with respect to the incandescent lamp.
The immunity protocol, as well as most of the studies that led to its publication, were developed considering only periodic voltage fluctuations. However, there is not enough evidence about the response of modern lighting technologies to voltage changes with an occasional character. Rapid Voltage Changes (RVCs) are one of these sudden variations, typically associated with single events, or repetitive events with a very long period e.g., the motor start/stop or the switching of a capacitor bank. RVCs represent a concern for power quality, since they can produce flicker and be disturbing for power system networks [3]. The interest of scientific community is reflected in recent papers that studied the characteristics of RVCs [24,25,26] and their correlation with flicker indices [17,27,28], claiming the necessity of more research and standardization. These efforts led to the publication, in 2015, of the last edition of IEC 61000-4-30 [29], which provides a definition and a precise measurement method for the detection and characterization of RVCs.
The present study tackles the aforementioned issues by evaluating the sensitivity of modern lighting technologies to different types of RVCs, continuing the work started by the authors in [30]. The study is based on real RVCs measured in the grid and a large set of commercially available modern lamps. The work is focused on the experimental assessment of the behavior of lighting technologies in real scenarios, without using a market-based approach to study the differences between lighting brands. The paper is structured as follows: Section 2 characterizes RVCs and their relationship with flicker using simulated voltage waveforms, while Section 3 describes the experimental setup needed to study the luminous output of the lamps subjected to the RVC events. Section 4, then, presents the results of the measurement campaign. In Section 5, the results are discussed and, lastly, in Section 6, the conclusions are presented.

2. Characterization of RVCs and Their Effect on Flicker

In this section, the flicker measurement procedure is briefly described according to the IEC 61000-4-15 standard. Additionally, the standardized RVC measurement method according to the IEC 61000-4-30 standard is presented. Finally, the parameters that have influence on flicker are discussed through the simulation of the most common RVC types.

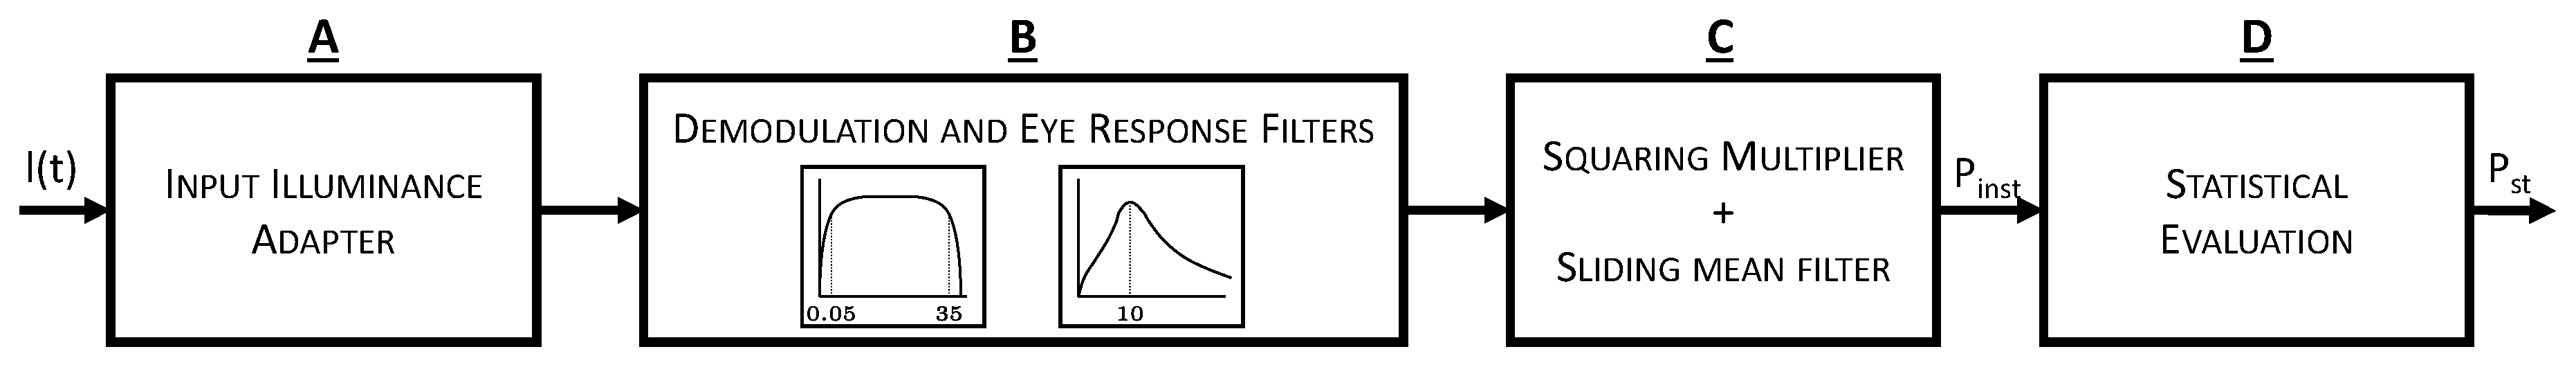
2.1. Flicker Measurement Method

The IEC 61000-4-15 standard establishes the functional and design specifications to measure and control the flicker produced by the voltage fluctuations present in the grid. Using the voltage signal as the input, the measurement procedure reproduces the response of the human vision system, precisely characterizing the real flicker perception. Based on several physiological experiments [31,32,33], the IEC flickermeter defines a lamp-eye–brain model, taking the incandescent lamp as the reference, and provides the instantaneous flicker perception, P inst , at the model’s output. P inst is given in perceptibility units, where a unit value defines the reference human flicker perceptibility threshold, which means that such level of flicker would be perceived by 50% of the population [34]. However, this perception does not mean irritation and, therefore, cannot be directly related to customers complaints. In order to represent the irritation, the IEC flickermeter integrates the flicker perception P inst over two different observation intervals— 10 min and 2 h —providing the short-term flicker severity P st and the long-term flicker severity P lt , respectively. Fluctuations producing values lying on the curve P st = 1 are considered the borderline of irritation.

2.2. RVC Measurement Method

A precise standard measurement method for RVCs has been introduced in the last edition of IEC 61000-4-30, describing the detection and the evaluation of RVCs. The procedure is based on the calculation of U rms ( 1 / 2 ) , the value of the RMS voltage measured over one cycle, commencing at a fundamental zero crossing, and refreshed each half-cycle. This value is used to establish whether the RMS voltage is in a steady-state condition or not, comparing its current value with its arithmetic mean over the last 100 cycles. If the difference is larger than a certain threshold, the steady-state condition is not met (the threshold is typically 1–6%, set by the user). Every time the U rms ( 1 / 2 ) signal leaves the steady-state condition, an RVC event is detected. The evaluation of the RVC characteristics is done calculating its start time, duration and amplitude, according to the standard. If a voltage dip/swell, with amplitudes above the 10% limit, is detected during an RVC event, the RVC event is discarded.
Different international standards, among which is the EN 50160 standard and its 2015 amendment [35,36], establish that, under normal operating conditions, an RVC in Low Voltage (LV) distribution networks does not exceed 5% of the nominal voltage. In the EN 50160 standard, limits are defined for their occurrence, allowing a maximum number of 24 RVCs per day, exceeding the 5% amplitude.

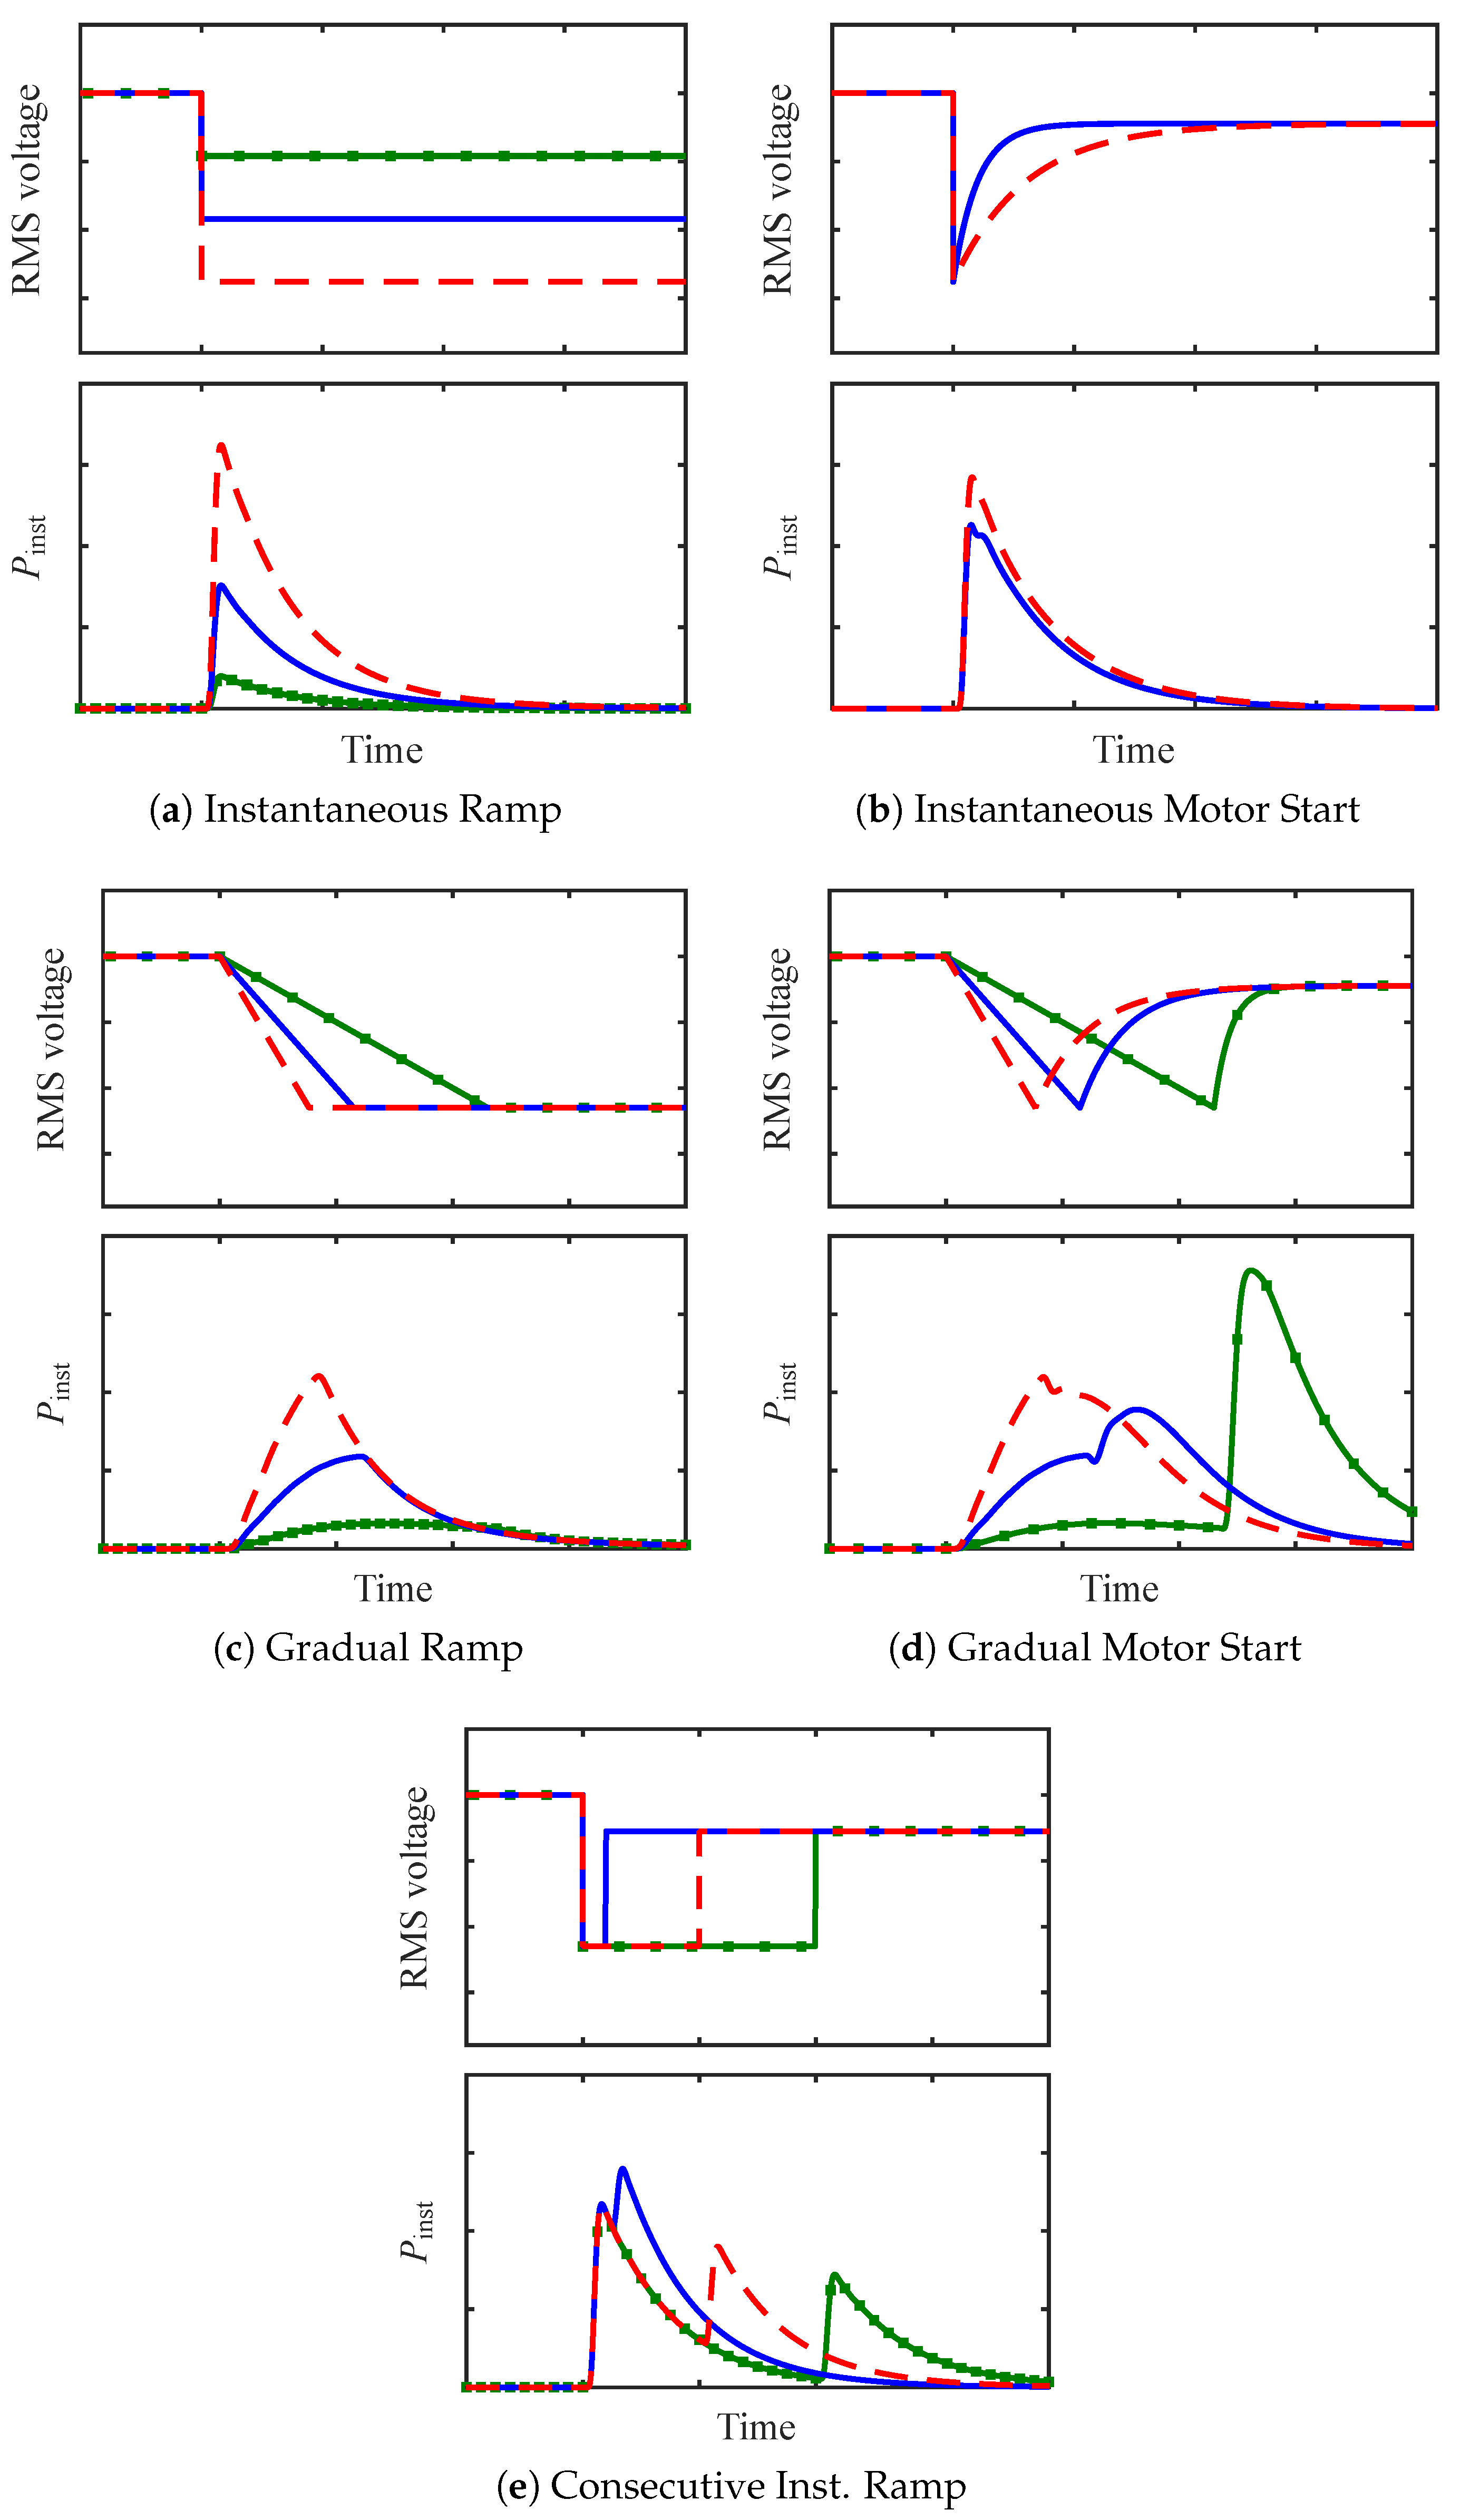
2.3. Flicker Due to RVCs

Several types of RVCs can appear in the grid, with different shapes and associated with different events. In [28], a classification of the most common types is suggested, considering two main characteristics: the RVC shape (ramp or motor type) and the rate of change of the RMS voltage, which can be instantaneous or gradual. This leads to four categories, depicted in the top graphs of Figure 1a–d, which have then been used in the present study to classify the detected RVCs. Moreover, Figure 1e shows a special case of two consecutive instantaneous ramp RVCs, which is worth discussing.
The flicker severity index P st is not suitable for the assessment of the RVC effect on flicker [17,27,28]. The calculation of P st involves the integration over 10 min of the P inst values, and was conceived to focus on periodic and constant behaviors, while discarding sudden events. However, the effect of RVCs on the flicker perception has, as a matter of fact, a sudden nature with a very short duration which cannot be reflected in the P st index. The most effective approach for the evaluation of the visual sensation caused by RVCs is through the maximum value of the instantaneous flicker perception P inst max [24].
Figure 1 shows simulated RMS voltage signals for the aforementioned RVC categories, along with the corresponding P inst curves, obtained with the standard IEC flickermeter. These curves represent the response of the incandescent lamp and can be used to extract its qualitative behavior. Figure 1a illustrates the effect of the RVC amplitude on flicker perception. It can be seen that RVCs with larger amplitude give rise to P inst whose maximum ( P inst max ) is higher i.e., more visible flicker. It must be noted that, while the rise of the P inst curve depends on the change in the RMS voltage, its fall is determined by the memory effect of the eye–brain model function. The P inst curves have therefore always the same fall profile. Moreover, from Figure 1b, it can be observed how, for the same amplitude, the faster the steady-state level is recovered, the less the flicker is visible. This is due to the integration time needed by the human eye–brain system to perceive the change in illuminance: if the transition is not long enough for the eye to fully integrate the illuminance variation effect, a less visible flicker will be perceived. Figure 1c, on the other hand, shows the effect of the rate of change of the RMS voltage. For the same amplitude, a smaller rate of change causes a smaller value of P inst max , which also needs more time to be reached. Figure 1d shows summation effects: the P inst curve has a peak for each change experienced by the RMS voltage. Lastly, Figure 1e illustrates the effect of two consecutive instantaneous ramp RVCs, one downwards and one upwards. If there is enough separation between the two voltage changes, the effects on P inst are separated, while if the two transitions are close enough, the effects sum up, resulting in a higher value of P inst max for the same RVC amplitude values. From the analysis of these simulated waveforms, it can be concluded that P inst is a suitable index to study the effect of RVCs on flicker perception and that the RVC amplitude, although being the most important, is not the only parameter affecting the visibility of flicker.

3. Materials and Methods
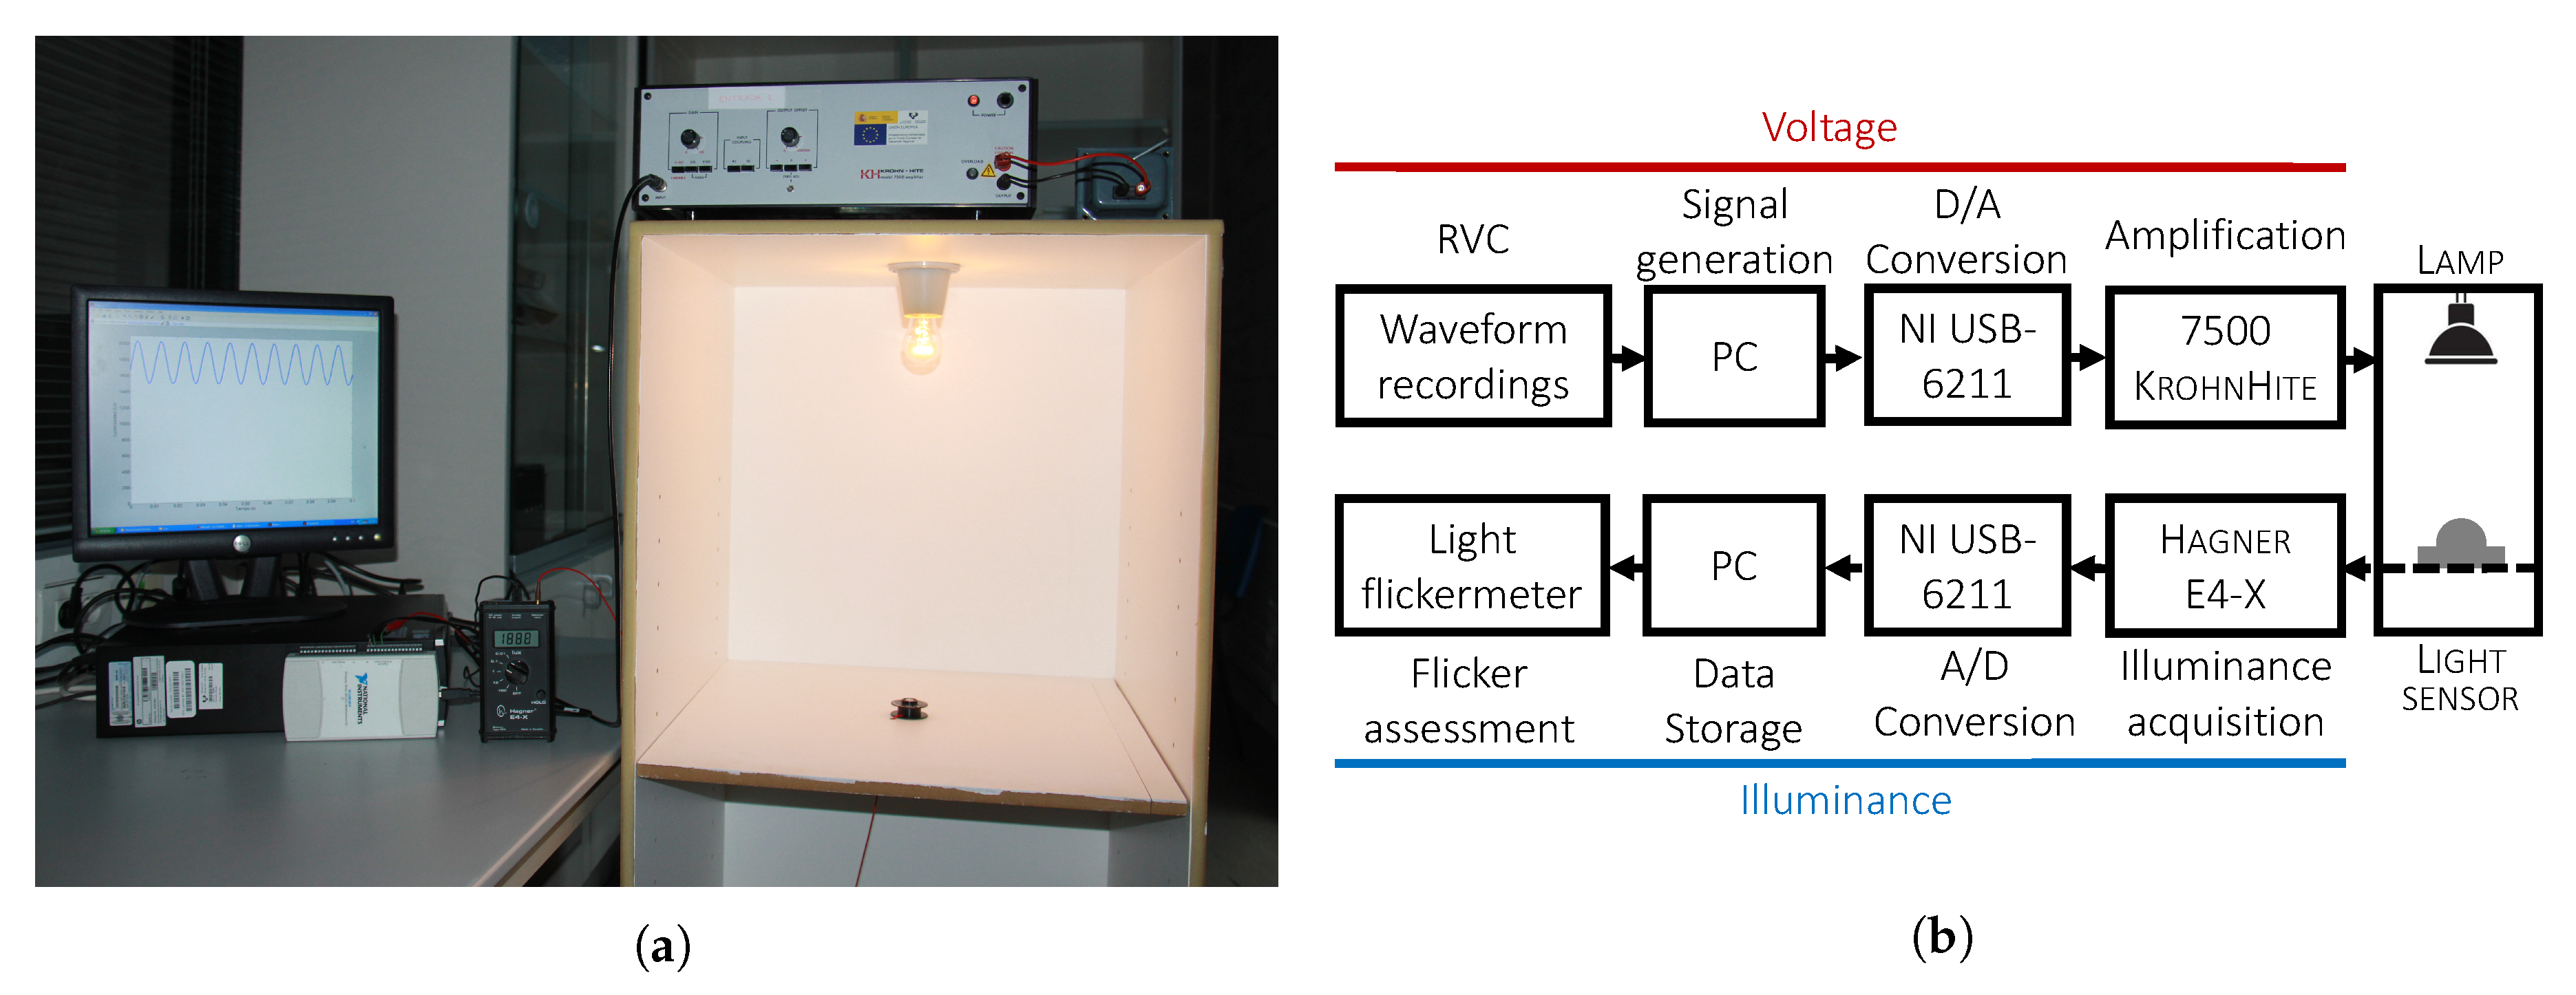
This section describes the materials used in the experimental campaign and the systems employed to collect the data needed to analyze the response of new lighting technologies to RVCs. This includes the set of lamps under test, the measurement system used to supply voltage signals to the lamp and to record their luminous output, and the light flickermeter, the key instrument used to assess the flicker response of the lamps. A total of 27 lamps, Compact Fluorescent Lamp (CFL) and LED, have been assayed, as well as a 60 W incandescent lamp, as reference. The choice of the lamps reproduces the current trend of the market and considers several manufacturers. Moreover, they have been selected to cover a wide range of power, 1–23 W, and of luminous flux, 250–2452 lm. They are all made for 230 V/50 Hz systems and their characteristics are shown in Table 1.

Experimental Setup

Figure 2 illustrates the laboratory system used to obtain the illuminance produced by the tested lamps. The upper part of the block diagram (Figure 2b) shows the generation of the voltage supply signal, containing the RVC to be studied, while the bottom part shows the illuminance acquisition system.
A PC with a Matlab based software (Matlab version 7.8.0 (R2009a), The MathWorks Inc., Natick, MA, USA.) reproduces the digital signal with the RVC recorded at real scenarios. Then, a NI USB-6211 card performs the digital-to-analog conversion at a rate of 6400 Hz . The amplification needed to reach the lamp’s voltage of 230 V is provided by a 7500 Krohn–Hite amplifier (Krohn–Hite Corporation, Brockton, MA, USA.) ( 75 W , from DC to 1 M Hz ), coupled with a 120 V /230 V transformer. The lamp under testing is placed inside a sealed white box, whose dimensions are product-units = brackets 65 × 65 × 122 c m . The light output, with no external interference, can therefore be captured by a light sensor placed inside the box and connected to a Hagner E4-X digital luxmeter (B. Hagner AB, Solna, Sweden). The box construction allows the adjustment of the source-detector distance to 18 different values, in order to always use the full scale of the light sensor and acquire the signal with the optimal resolution. The luxmeter is characterized by a spectral sensitivity that follows the human eye sensitivity function and is fully cosine corrected, in accordance with the International Commission on Illumination (CIE) standards. The analog-to-digital conversion from the luxmeter to the PC is performed by a NI USB-6211 card at 6400 Hz and 16 bit. Finally, the digital illuminance signal is stored.
Since the IEC flickermeter is based on the incandescent lamp, it cannot be used to assess the response of non-incandescent lamps. In order to correctly measure the flicker severity produced by any kind of lamp, a light flickermeter is used. The design of the light flickermeter is based on the IEC flickermeter, with two main modifications: the input is the light output of the lamp instead of the voltage signal and—consequently—the response of the incandescent lamp is removed from the lamp-eye–brain model. Figure 3 shows the block diagram of the light flickermeter according to [23].
Block A performs a normalization of the illuminance signal in order to make it independent from the average illuminance level. In Block B, the demodulation process is completed—the same way as in the IEC flickermeter—and the response of the eye is modeled. Block C implements the model of eye–brain system obtaining at its output the instantaneous flicker perception P inst . Finally, in Block D, the P inst values are integrated over a 10 min or 2 h time period, providing as outputs the P st and P lt values, respectively.
The light flickermeter used in the present work is a highly accurate flickermeter, which meets all the requirements established for the light flickermeter in the IEC TR-61547-1 [23]. Its implementation is further described in [37].

4. Results

This section presents the results of the experimental study on the response of the analyzed lighting technologies to RVCs. A selection of voltage signals containing RVCs recorded at real locations on the grid have been supplied to the tested lamps and their responses have been calculated in terms of the instantaneous flicker perception. The effect on flicker has then been evaluated.

4.1. Set of Recorded Signals

The present study has been performed using real voltage signals measured in the grid in the north of Spain. In order to obtain suitable signals, two different approaches have been followed, looking for the cause and for the effect of RVCs. The first set of measurements has been therefore performed in the LV network, selecting two different locations with known flicker characteristics i.e., high levels of flicker severity. The second set of measurements, instead, has been performed where typical RVC generating loads are connected: several water pumping stations have been selected as suitable sites, since the pump startings were observed to be generating RVCs. The measurement sites are described below:
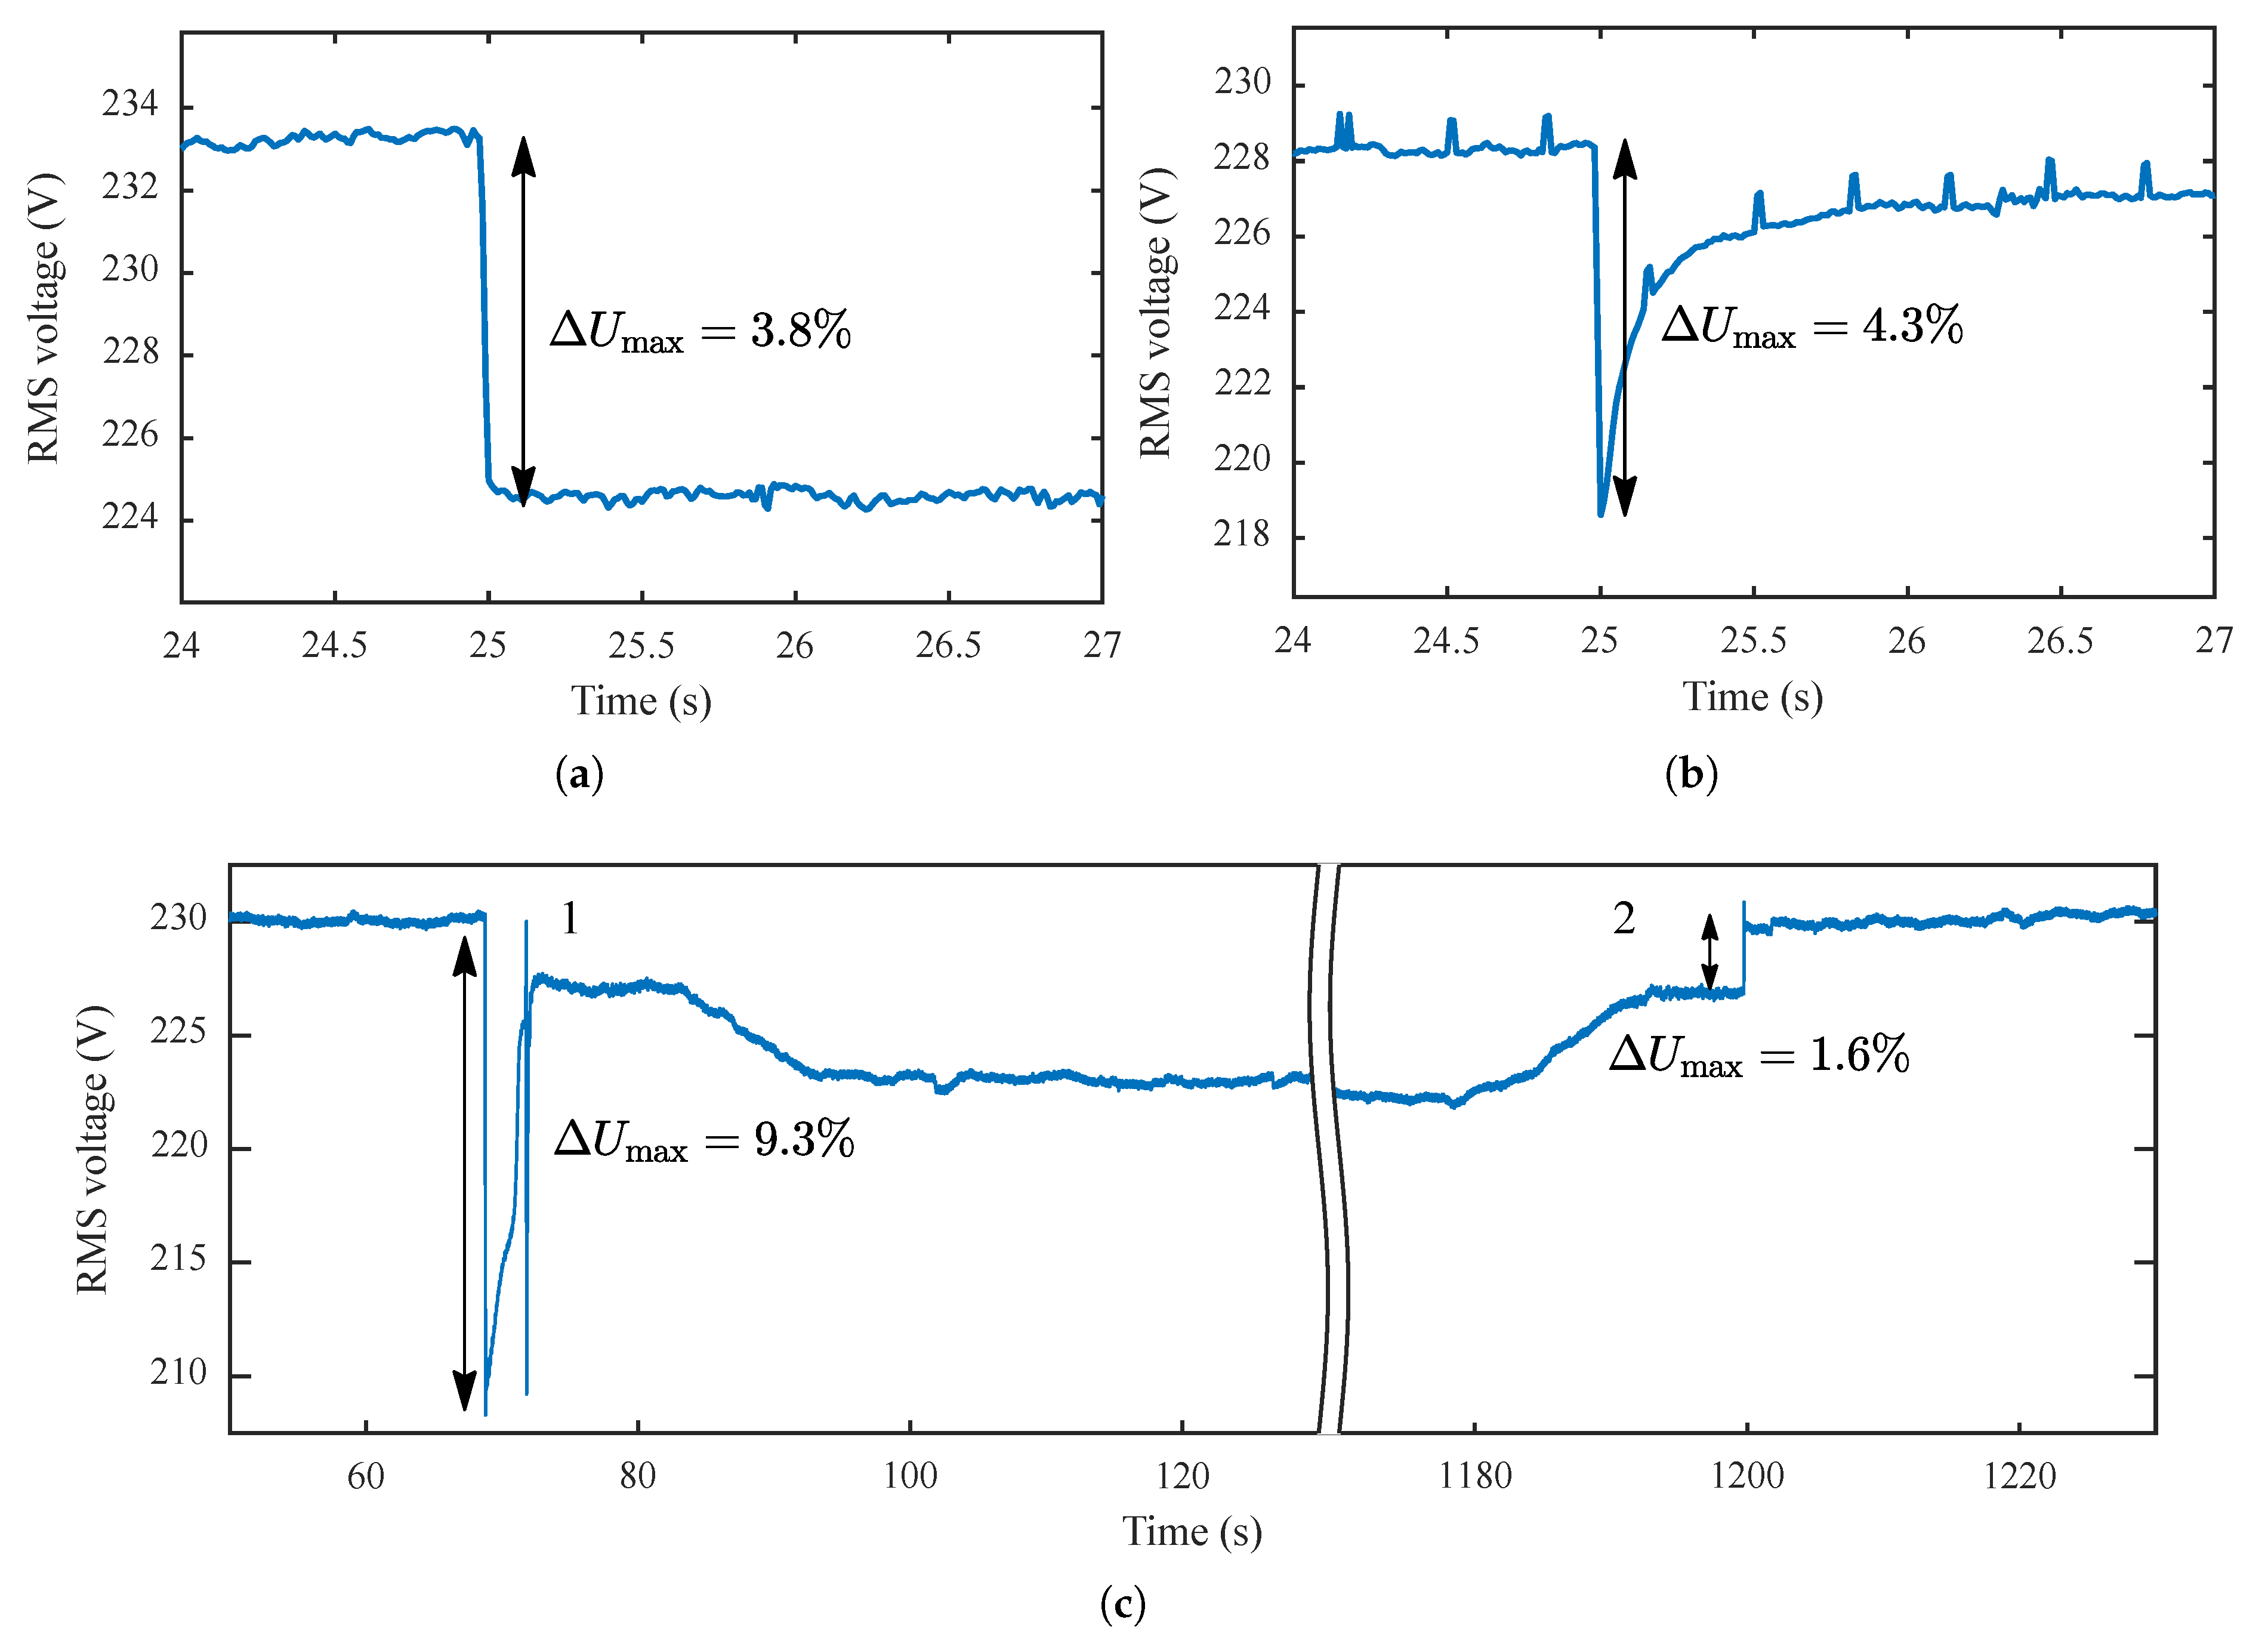
  • Site 1: A small urban area, far from big industrial loads, that can reach 100,000 inhabitants during tourist season among residents and visitors. The whole set of measurements, which lasted nine days, showed flicker severity values above the irritability threshold, with P st ; 99 = 1.74 . Flicker severity has been found above the limit 67% of the time. Figure 4a shows an example of an RVC measured in Site 1.
  • Site 2: A rural area with low population density but close to several arc furnaces, which cause flicker severity values sensibly above the irritability threshold, with P st ; 99 = 2.29 . The measurement campaign lasted five days and the P st value has been found above the irritability threshold 77% of the time. Figure 4b shows an example of an RVC measured in Site 2.
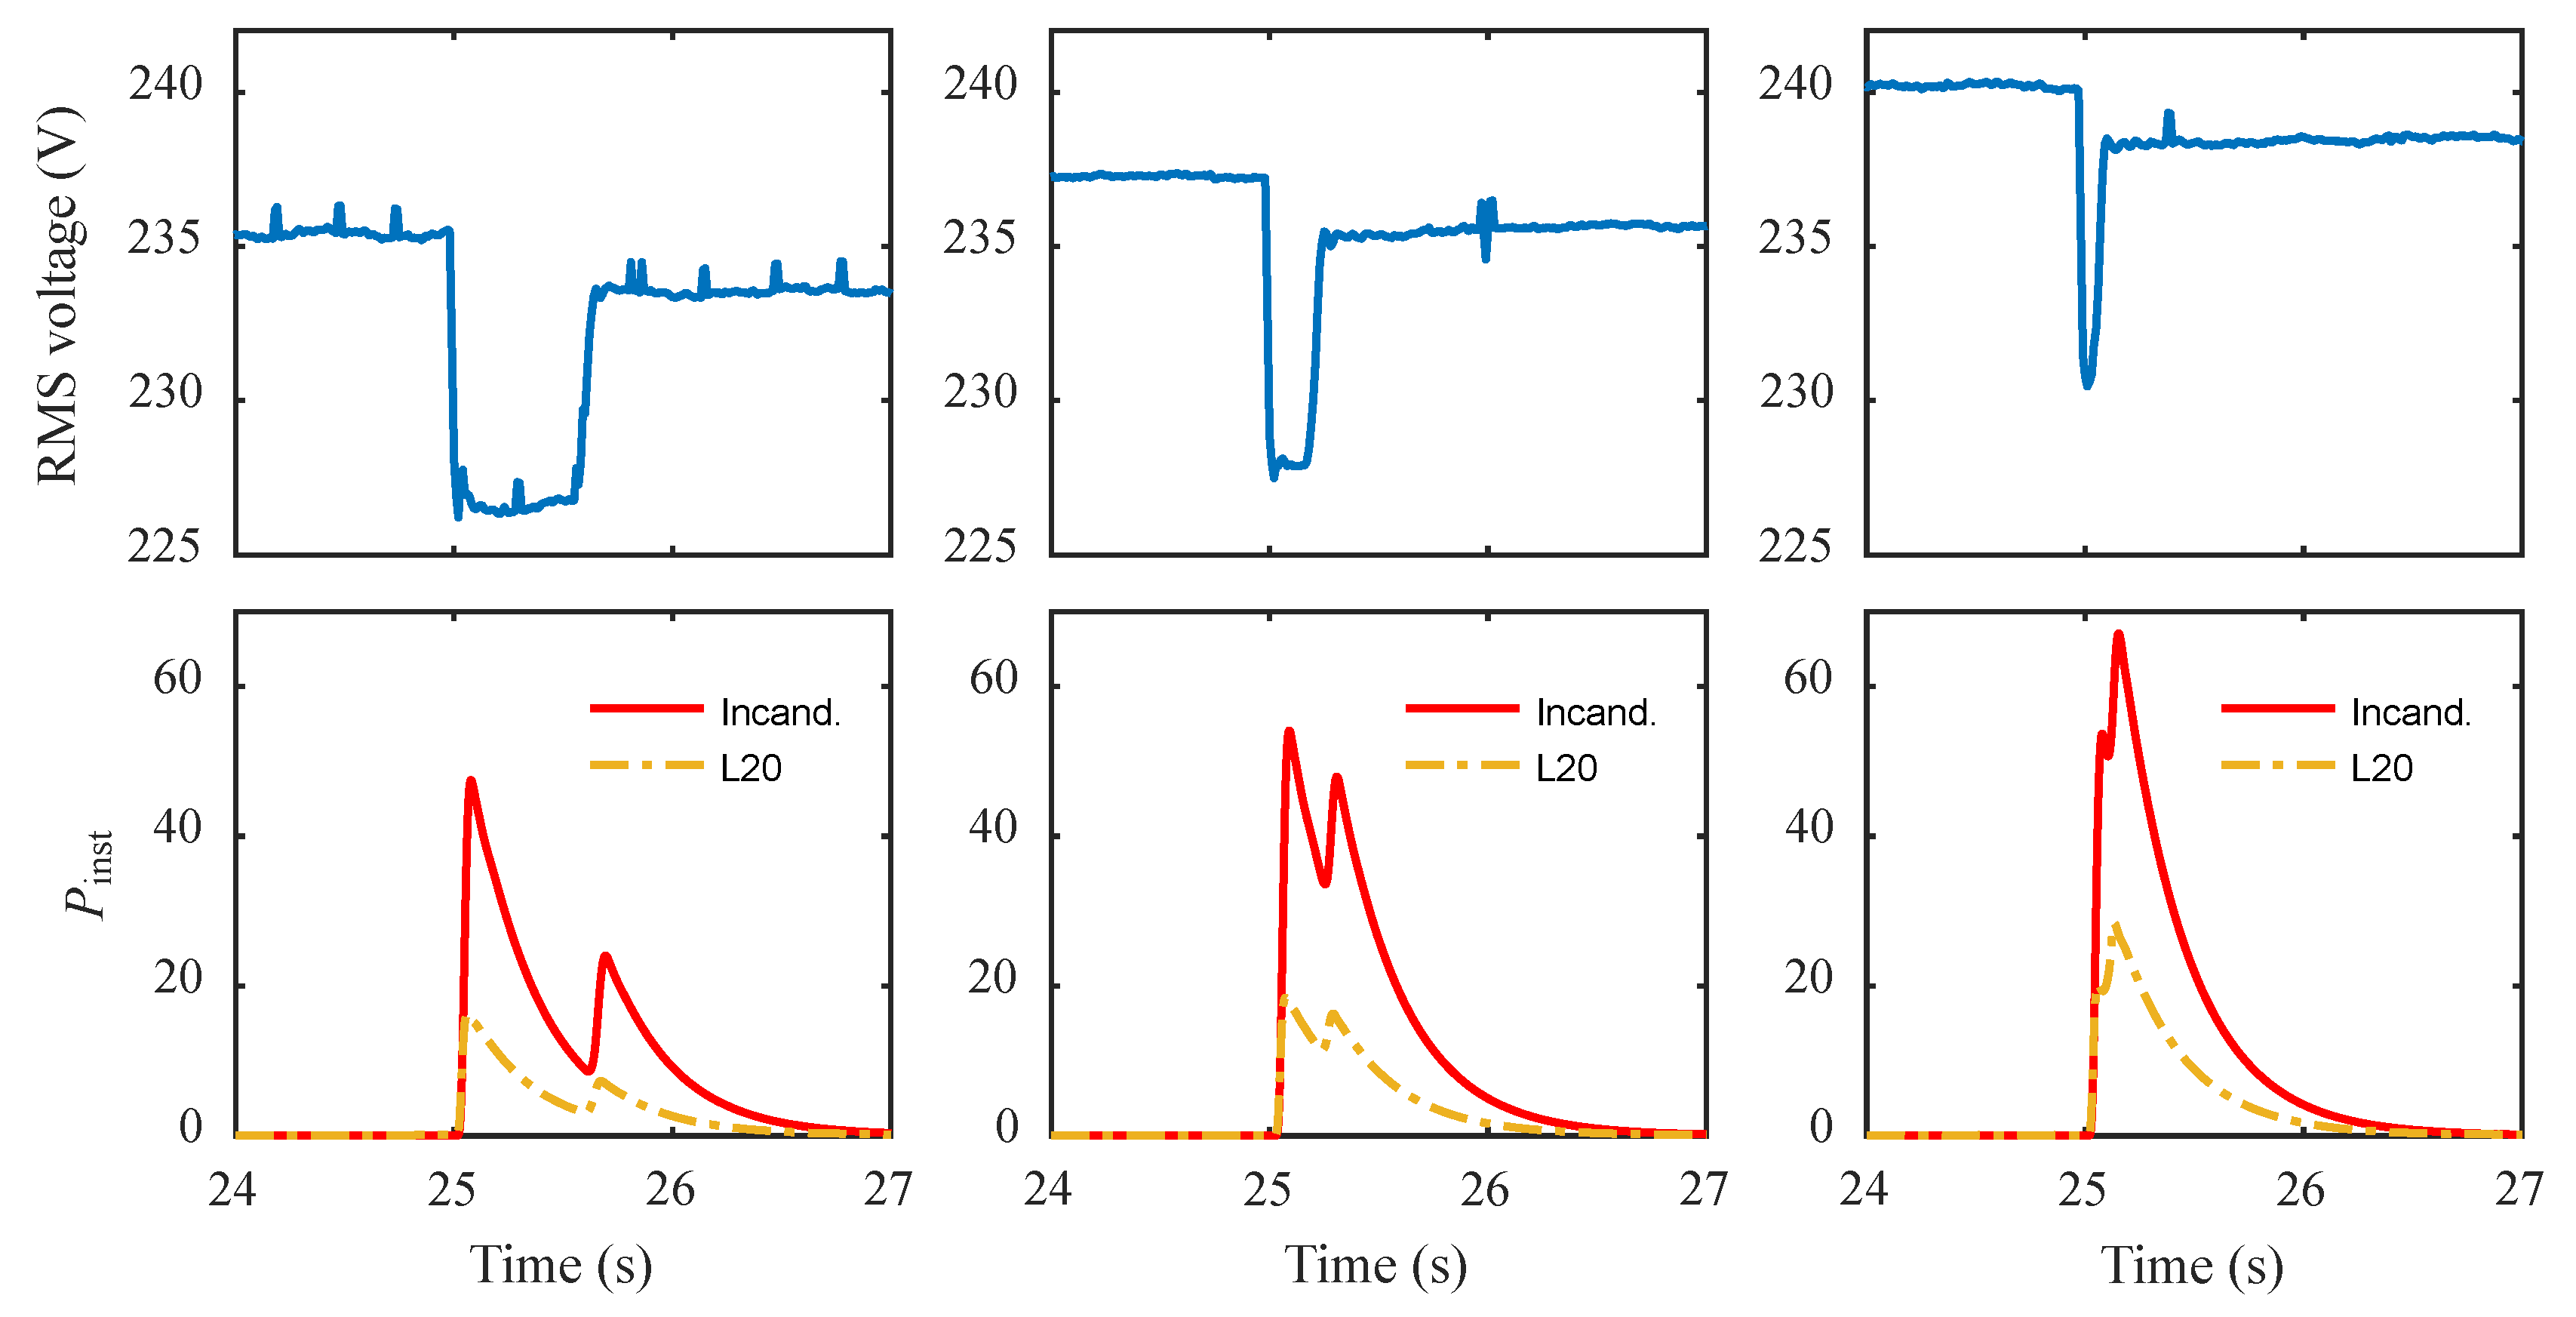
  • Site 3: Several pumping stations for public water supply constitute the third group of measurements. These sites allowed for measuring close to loads that are known to cause RVCs. Three pumping stations have been selected for the measurements, with different types of pumps connected: with soft starter, with star delta starter and without starter. Pumps with a variable-frequency drive were also measured, but no RVCs were detected for this configuration. Measurements have been performed at LV level. The pumps’ start up was produced upon the request for measurement purposes. Figure 4c shows the RMS voltage of a pump equipped with a star delta starter. Points 1 and 2 in Figure 4c indicate, respectively, the controlled start and stop of the pump.

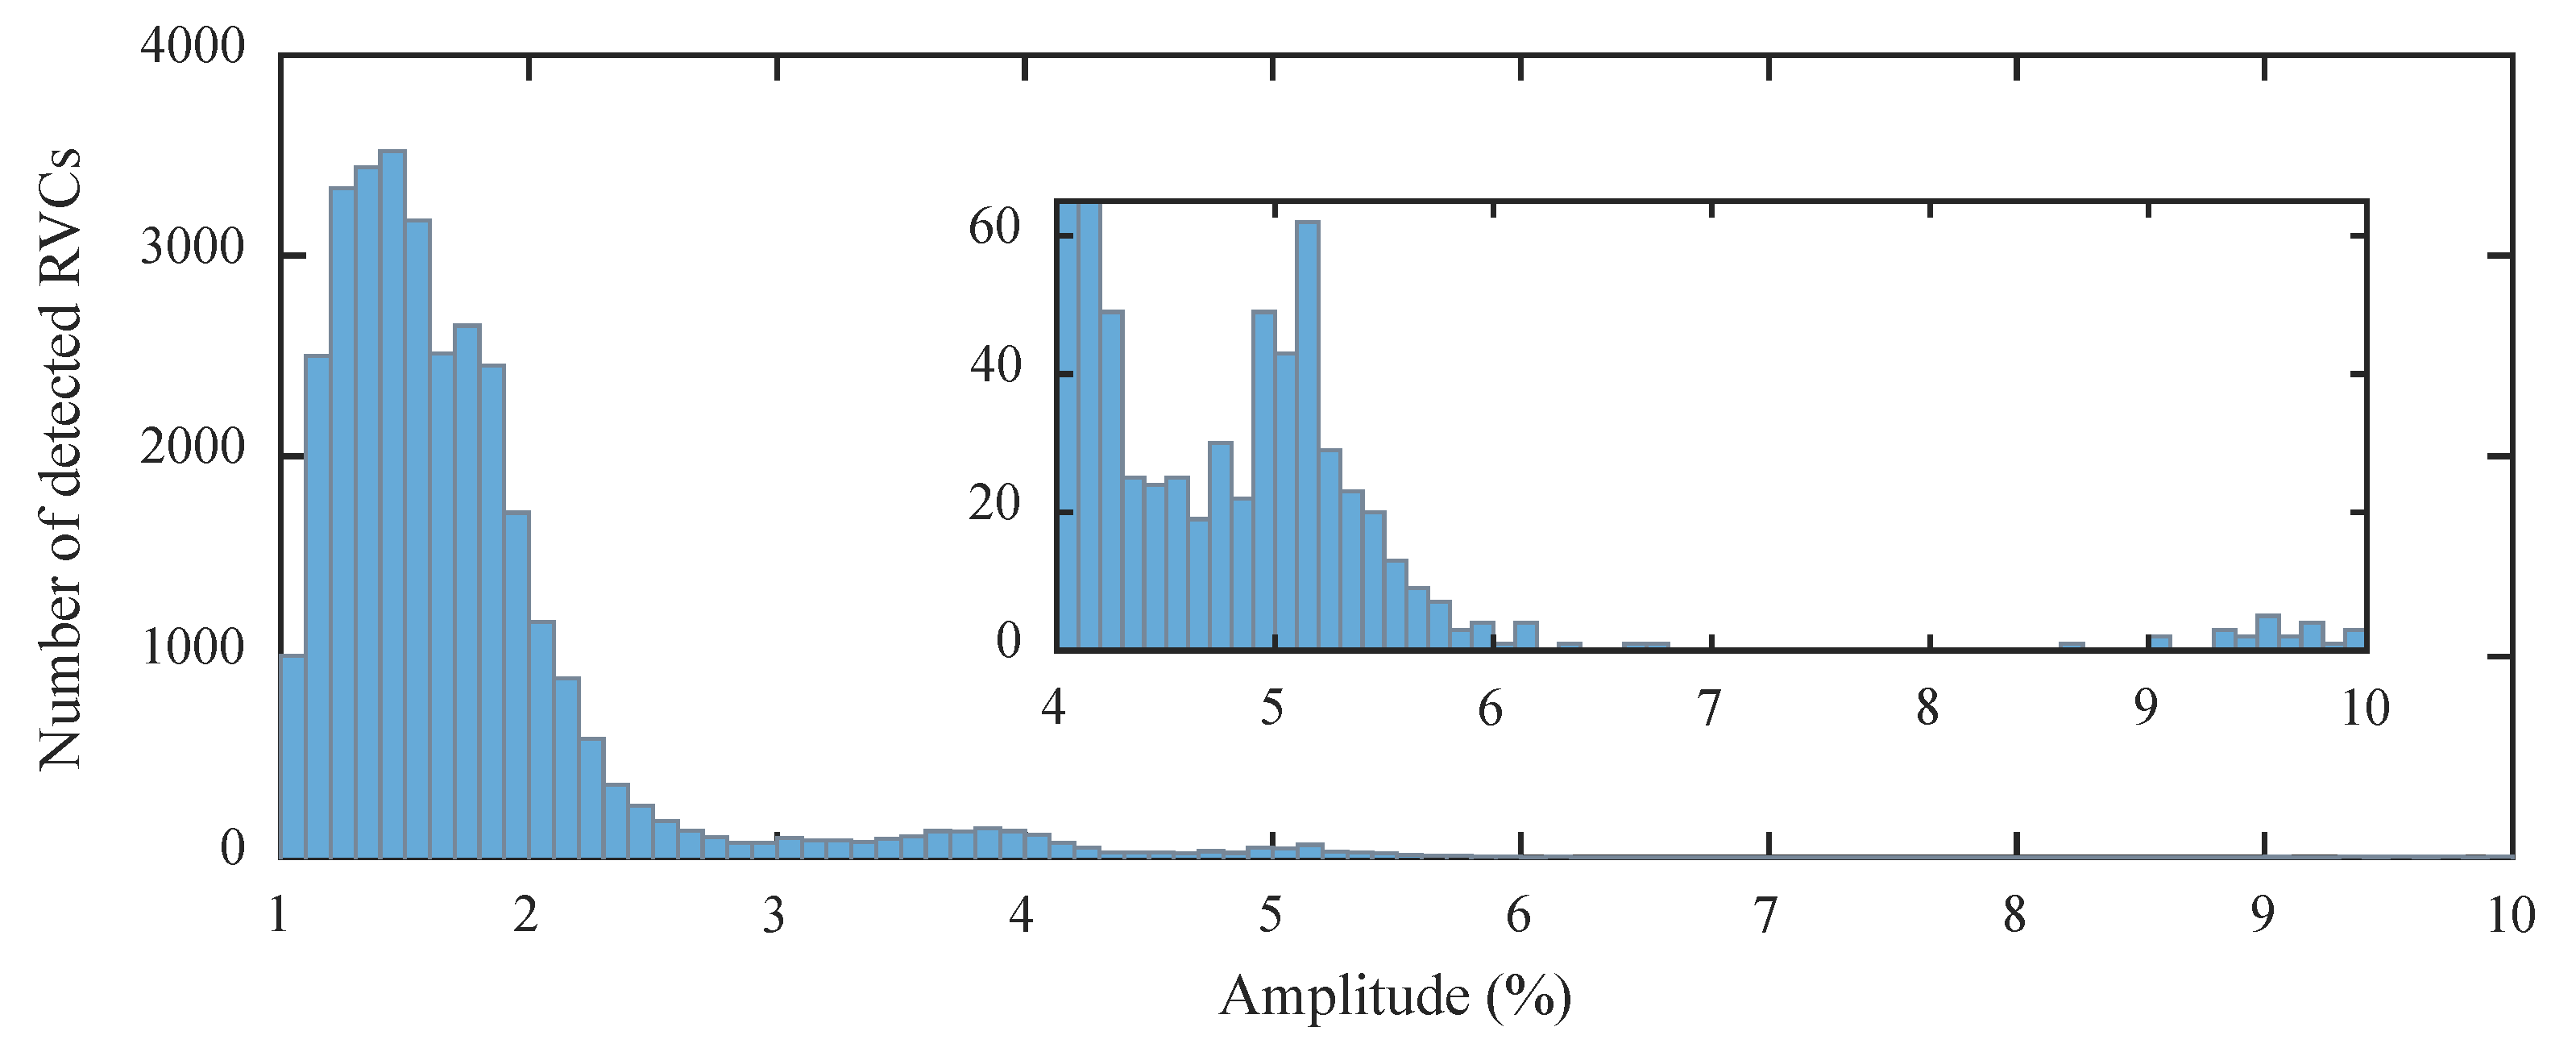
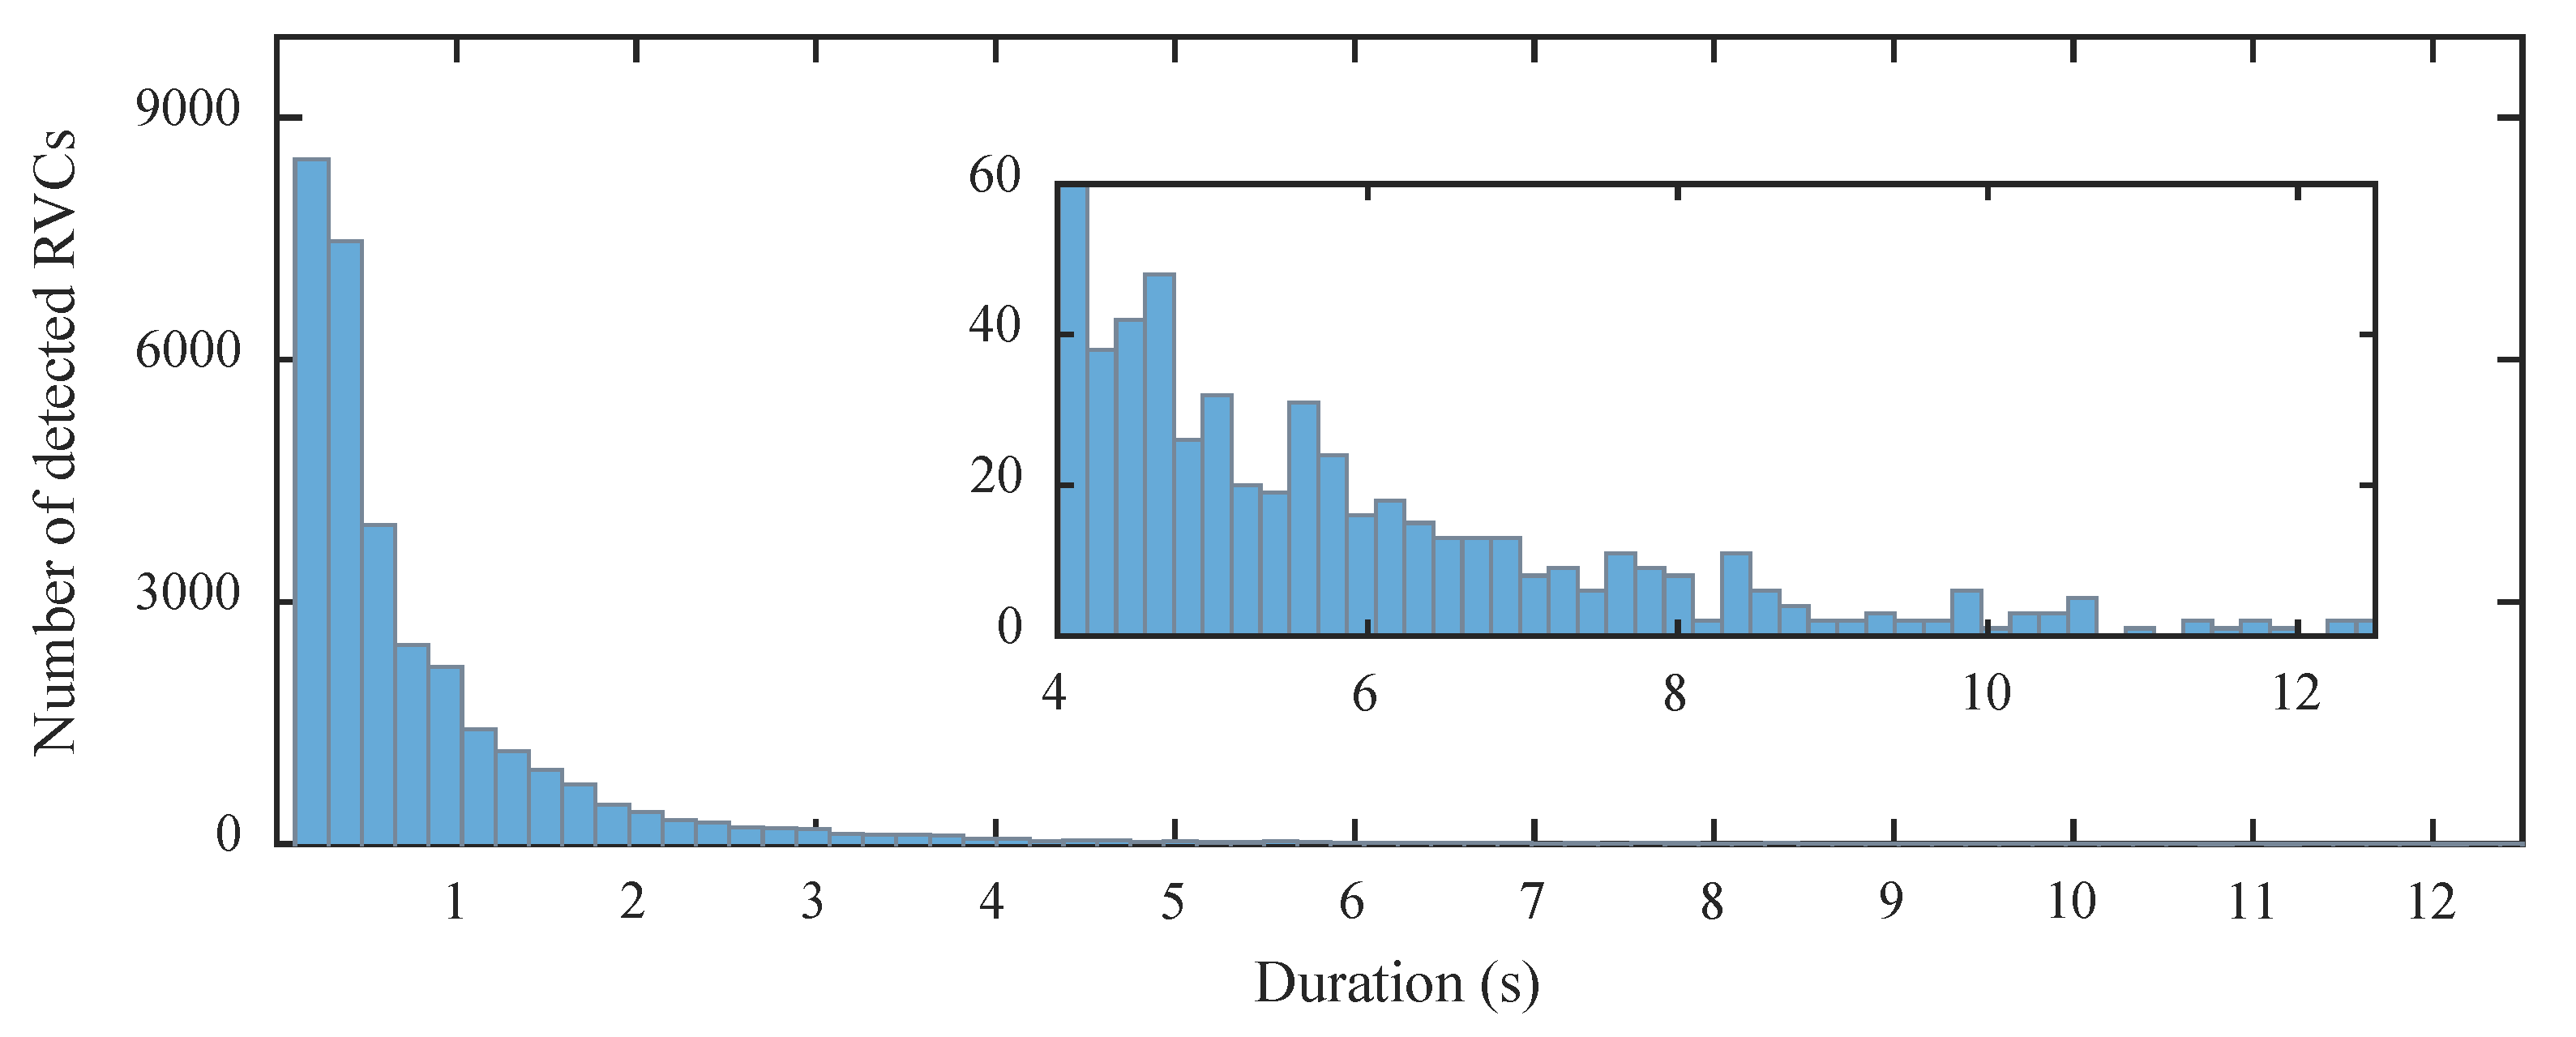
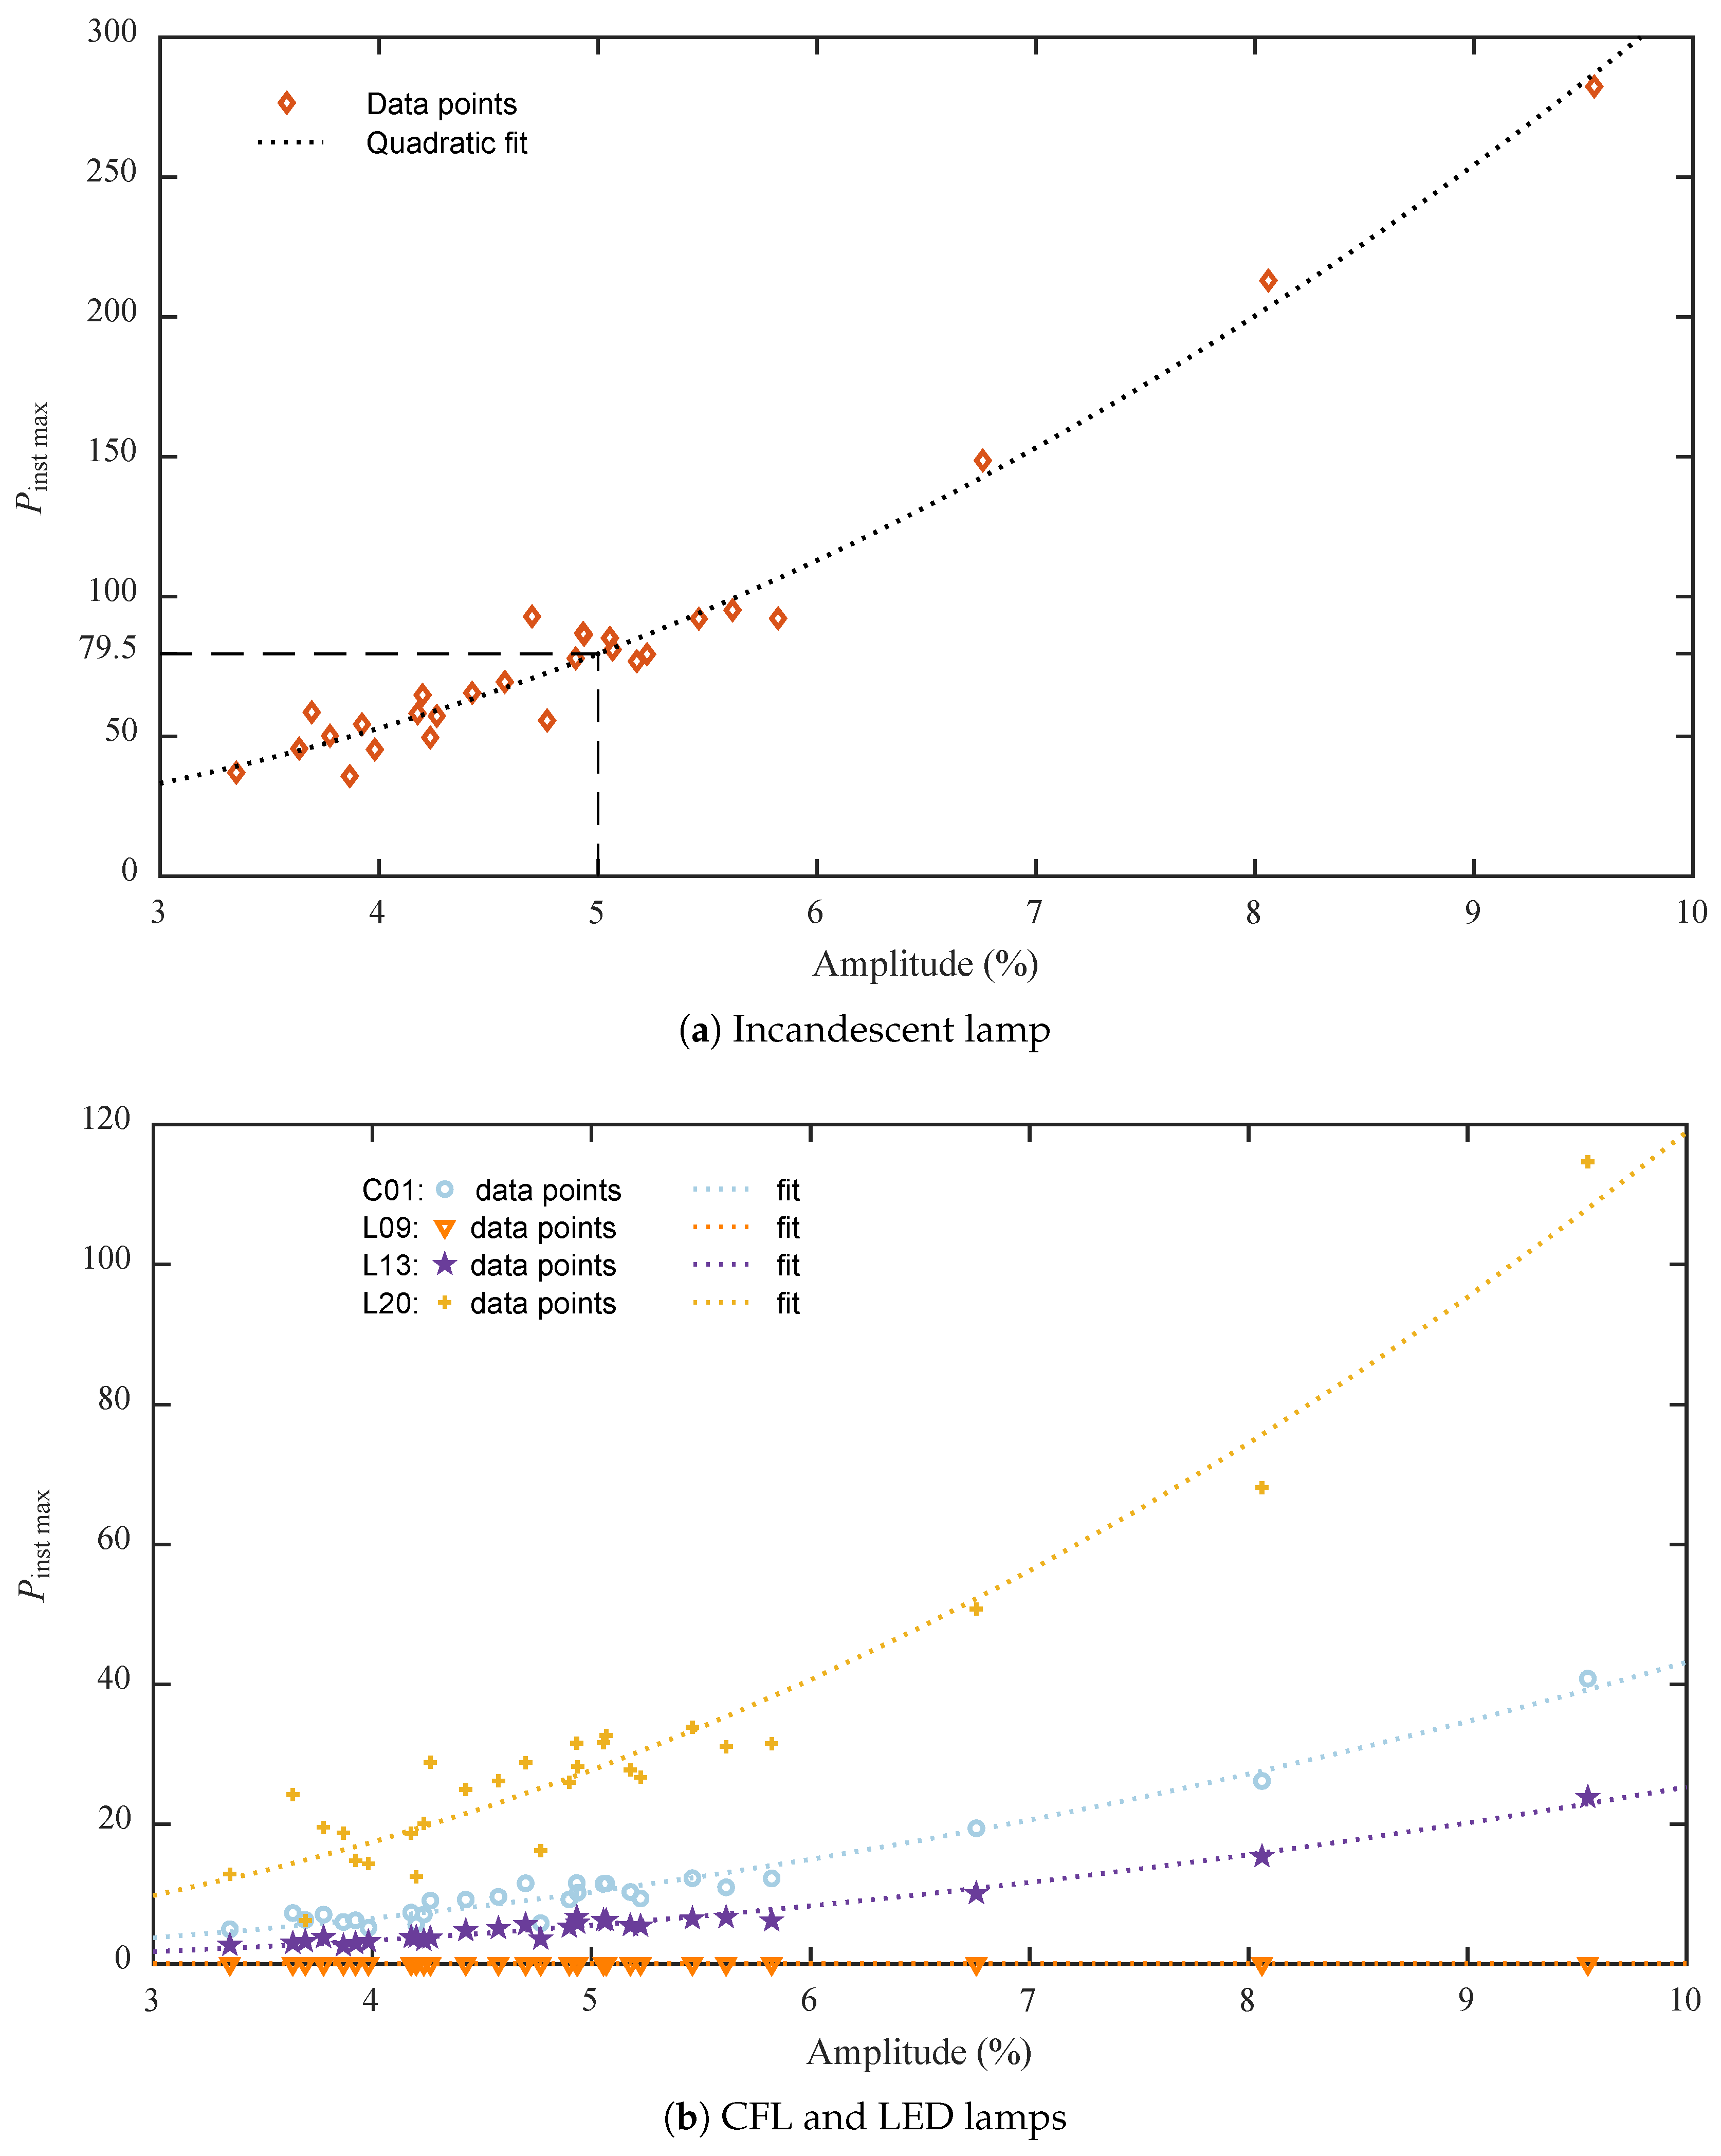
4.2. Characteristic of the Detected RVCs

The detection of RVCs in the grid has been performed according to the IEC 61000-4-30 measurement method, with a detection threshold set to 1%. The detection time resolution is given by the RMS refresh rate i.e., 0.01 s . Therefore, RVCs with a duration less than or equal to 0.01 s (i.e., only one sample above the threshold) have been discarded in order to avoid a large amount of spurious RVCs. The application of these criteria resulted in the detection of 31890 RVCs with amplitude between 1–10%, duration between 0.02–12.5 s , and different shapes. Figure 5 and Figure 6 show the distribution of amplitude and duration values of the measured RVCs. As it can be seen, most of the RVCs presented small amplitudes and short durations. Specifically, 94.5 % of them had amplitudes below 3%, and 4.7 % of them had amplitudes comprising between 3% and 5%, and only 0.8 % of them had amplitudes larger than 5%. Considering a total measurement time of 14 days, it results that RVCs with amplitudes above 5% had an average occurrence of 17 per day. Only 24% of the detected RVCs had duration greater than 1 s , and 1.7 % greater than 4 s . The vast majority of the detected RVCs were voltage reductions, as only 18% of the total were identified as upward transitions.
This large set of RVCs included the categories introduced in Section 2.3 and other types of RVCs that, because of their shape, did not fall into any of those categories. For the case of consecutive RVCs (Figure 1e), the measurement method detected both RVCs as a single RVC.
At the moment, there is no method to automatically identify the RVC categories. To be able to make a classification, a data reduction is therefore necessary. The first choice was to study only downwards RVCs since, being largely more abundant, they offer more variety. Then, the RVCs were grouped in amplitude ranges and, within each range, one RVC for every category was selected, when possible. This process led to a total amount of 120 RVCs which were supplied to the lamps, measuring their response. Among these RVCs, 40 were instantaneous RVCs (Figure 1a,b) and the rest were gradual ramp RVCs (Figure 1c), and consecutive instantaneous ramp RVCs (Figure 1e).
Although it was not always possible to find a specific type of RVC for every amplitude range, the instantaneous RVCs were abundant enough to cover a broad range of amplitudes. Moreover, their influence on the response of the lamps is governed by few parameters, allowing for directly studying their correlation with the flicker perception. Finally, the response to instantaneous RVCs is always higher than the response to gradual RVCs for the same amplitude. For all these reasons, the analysis presented in the next section is based on the results of instantaneous RVCs of both ramp and motor start type.

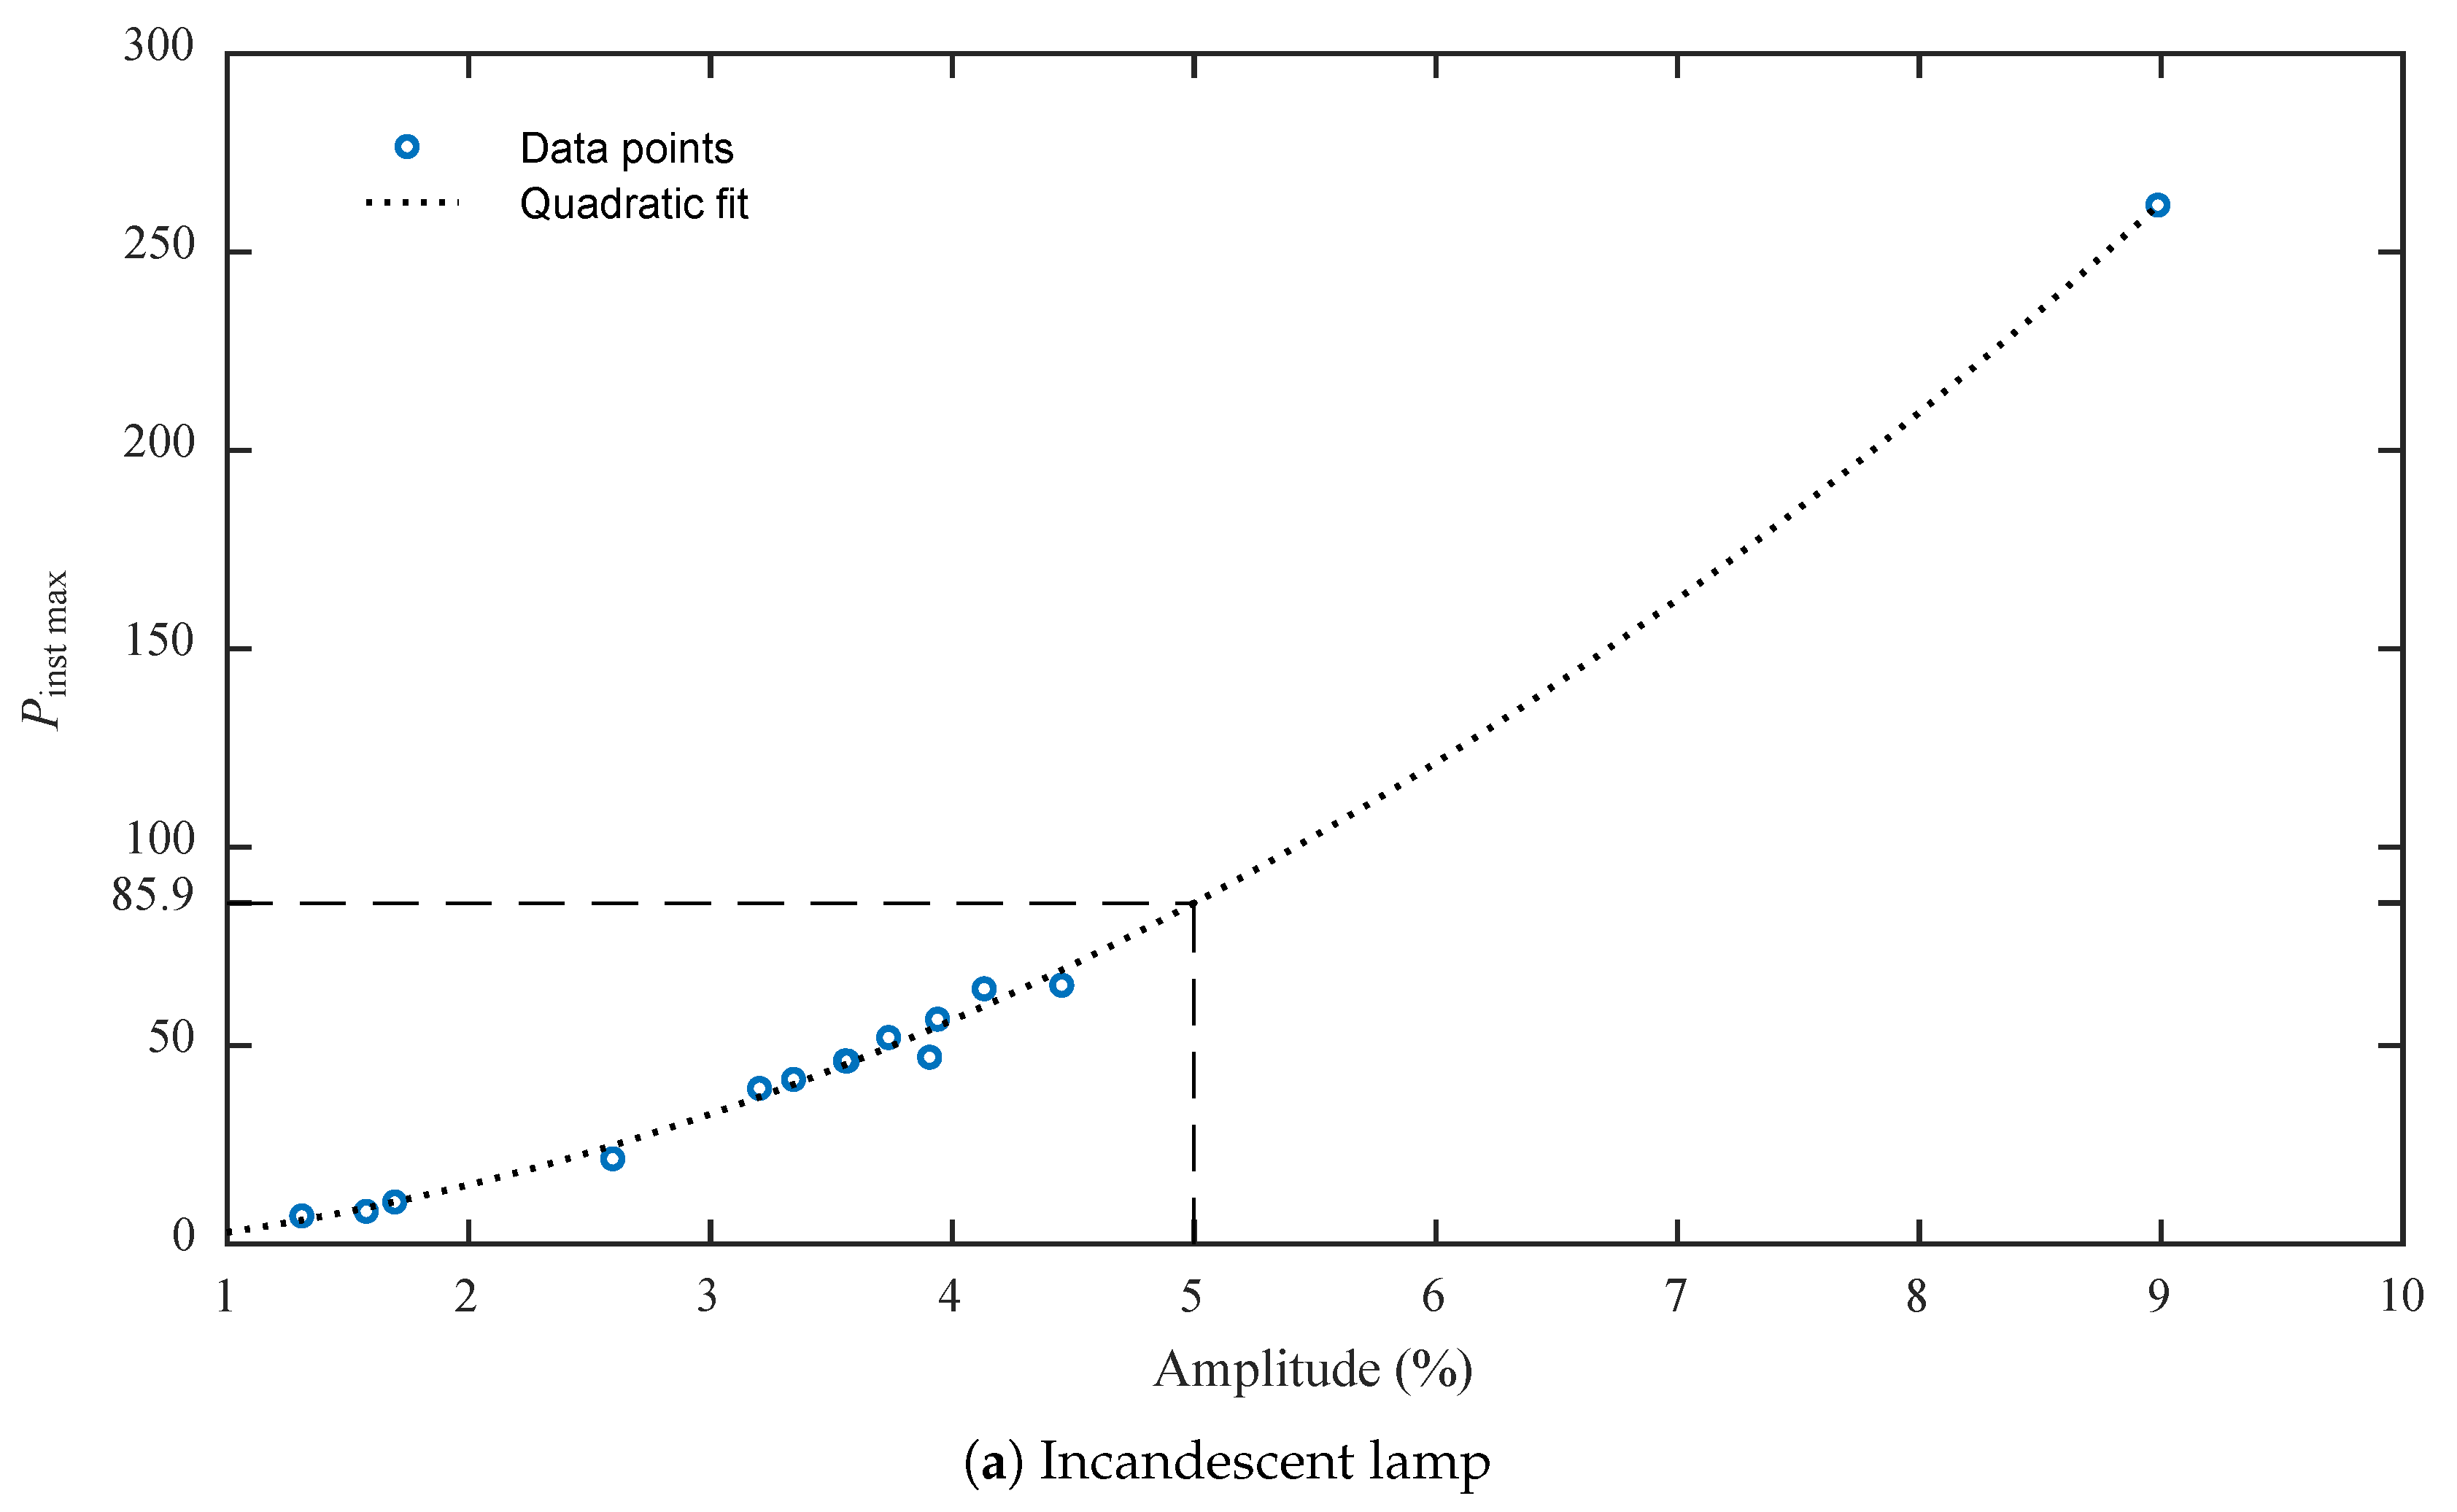
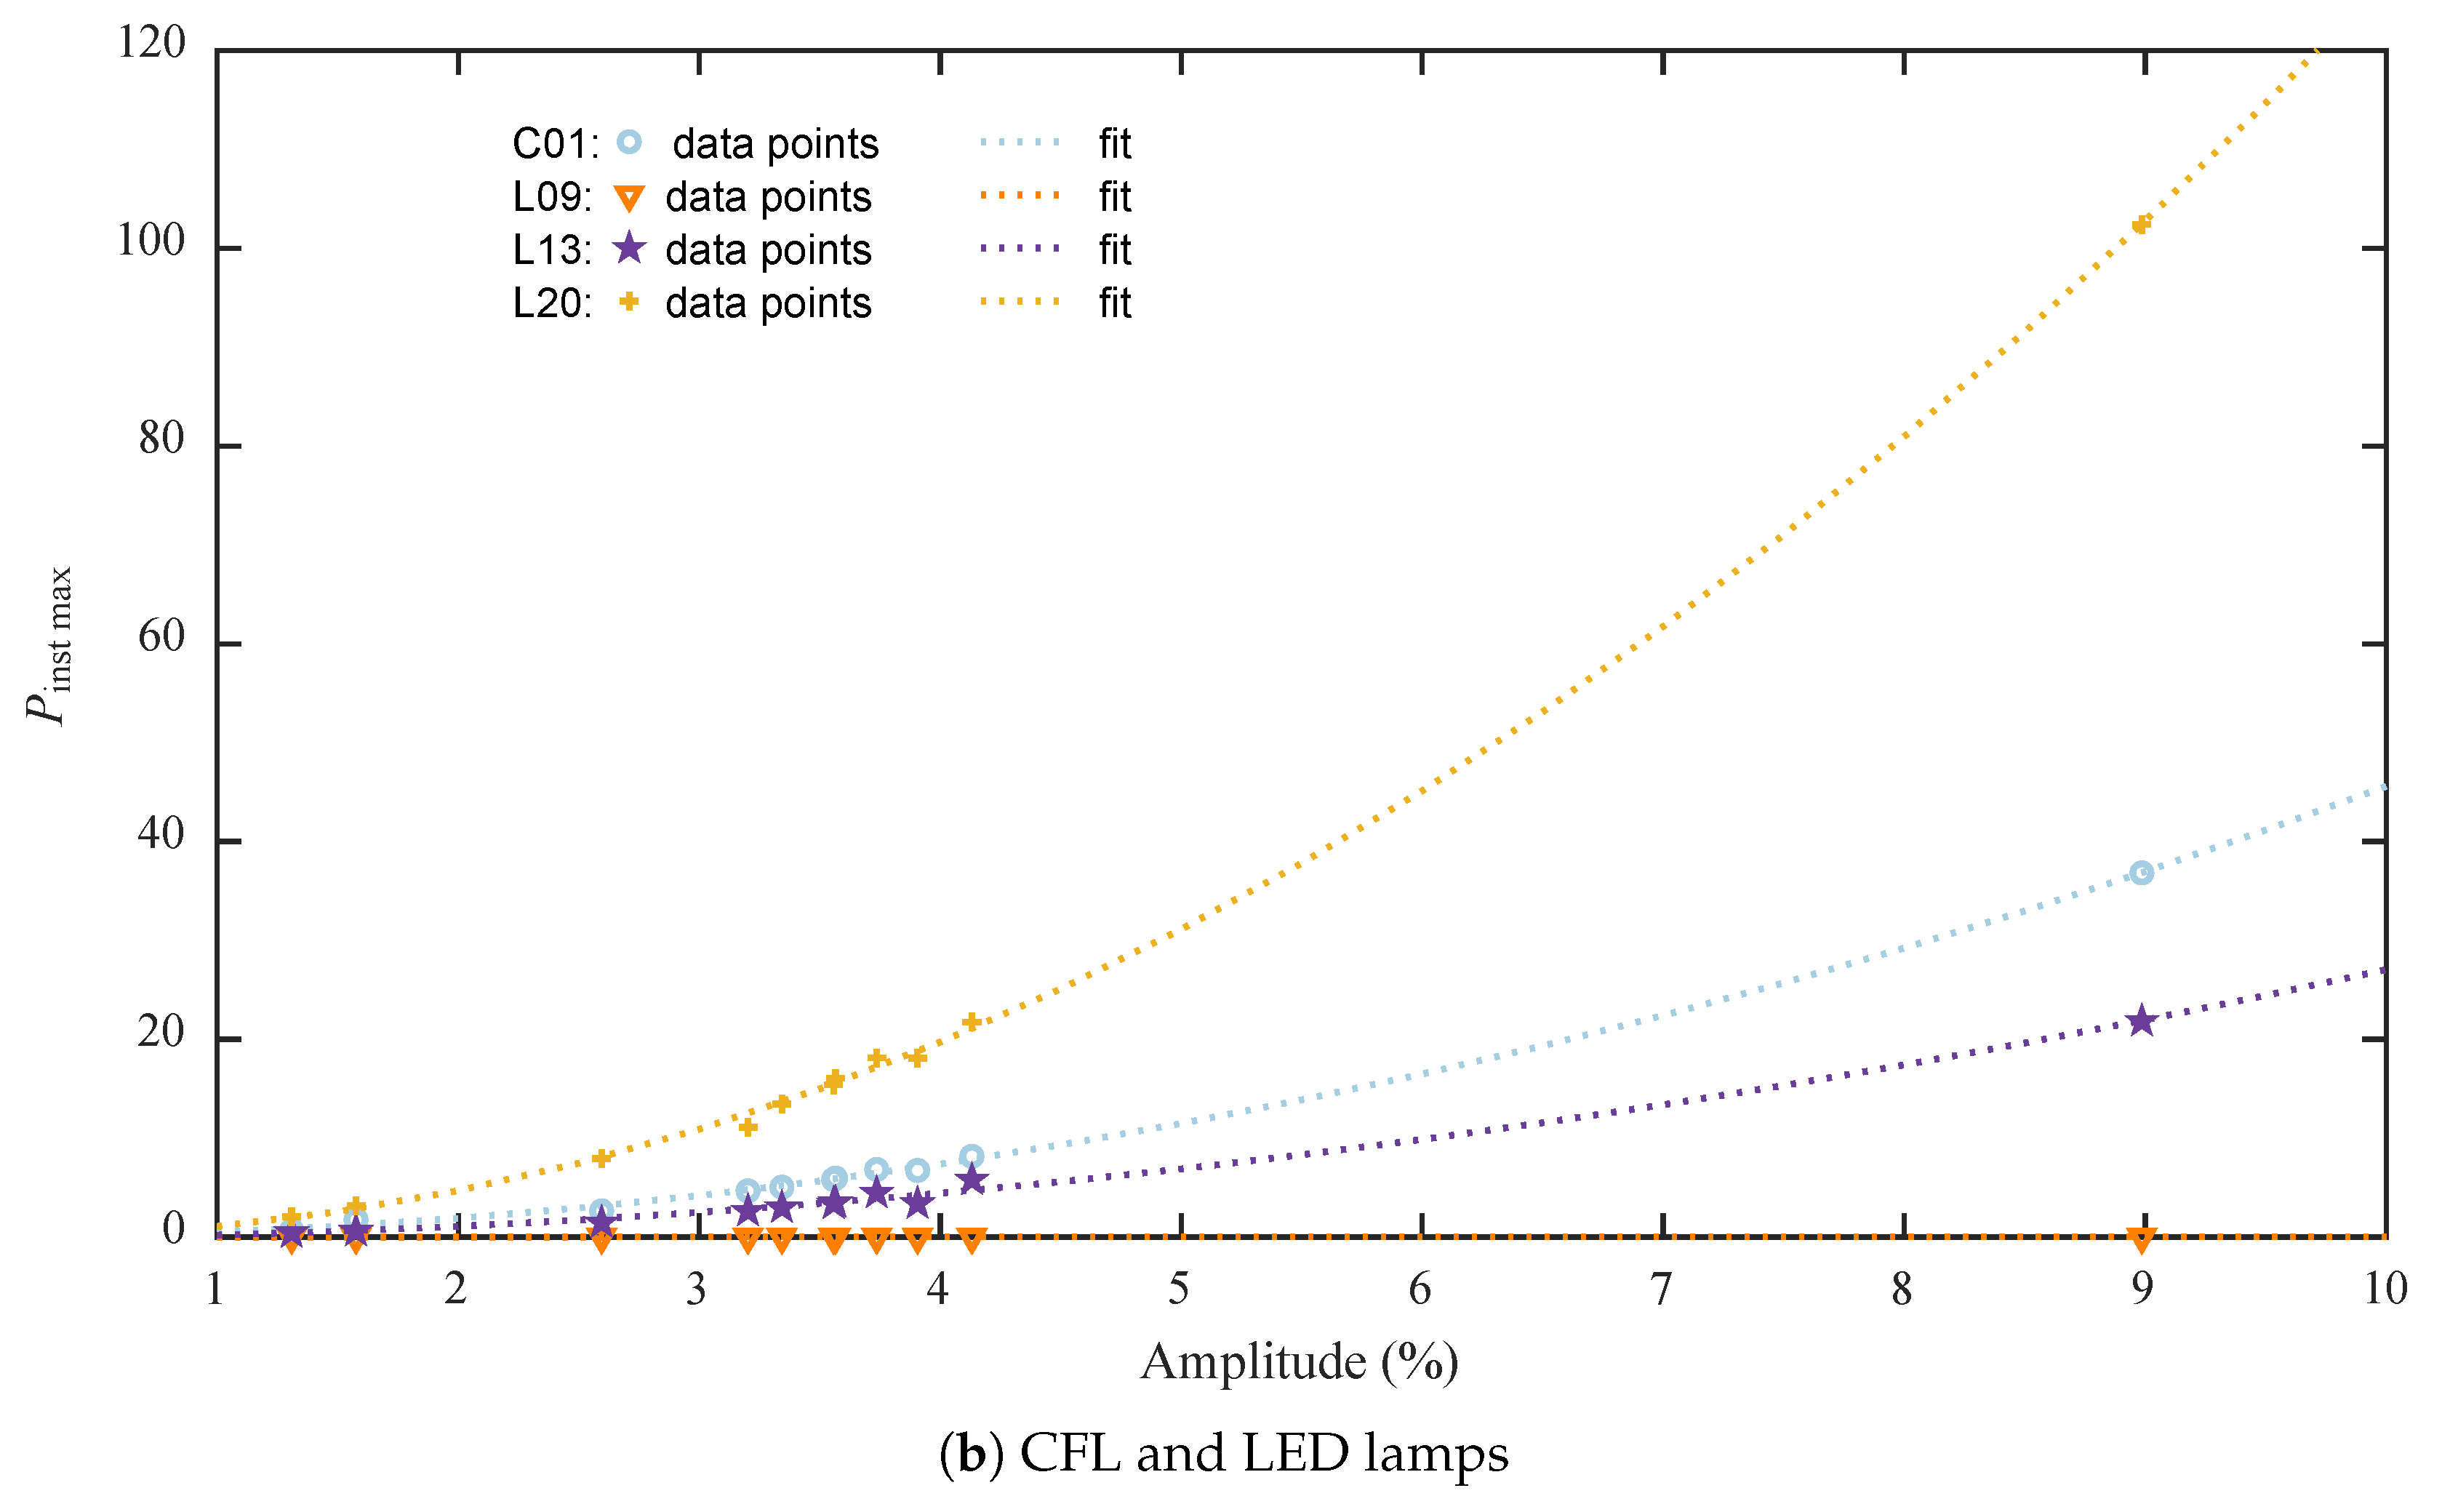
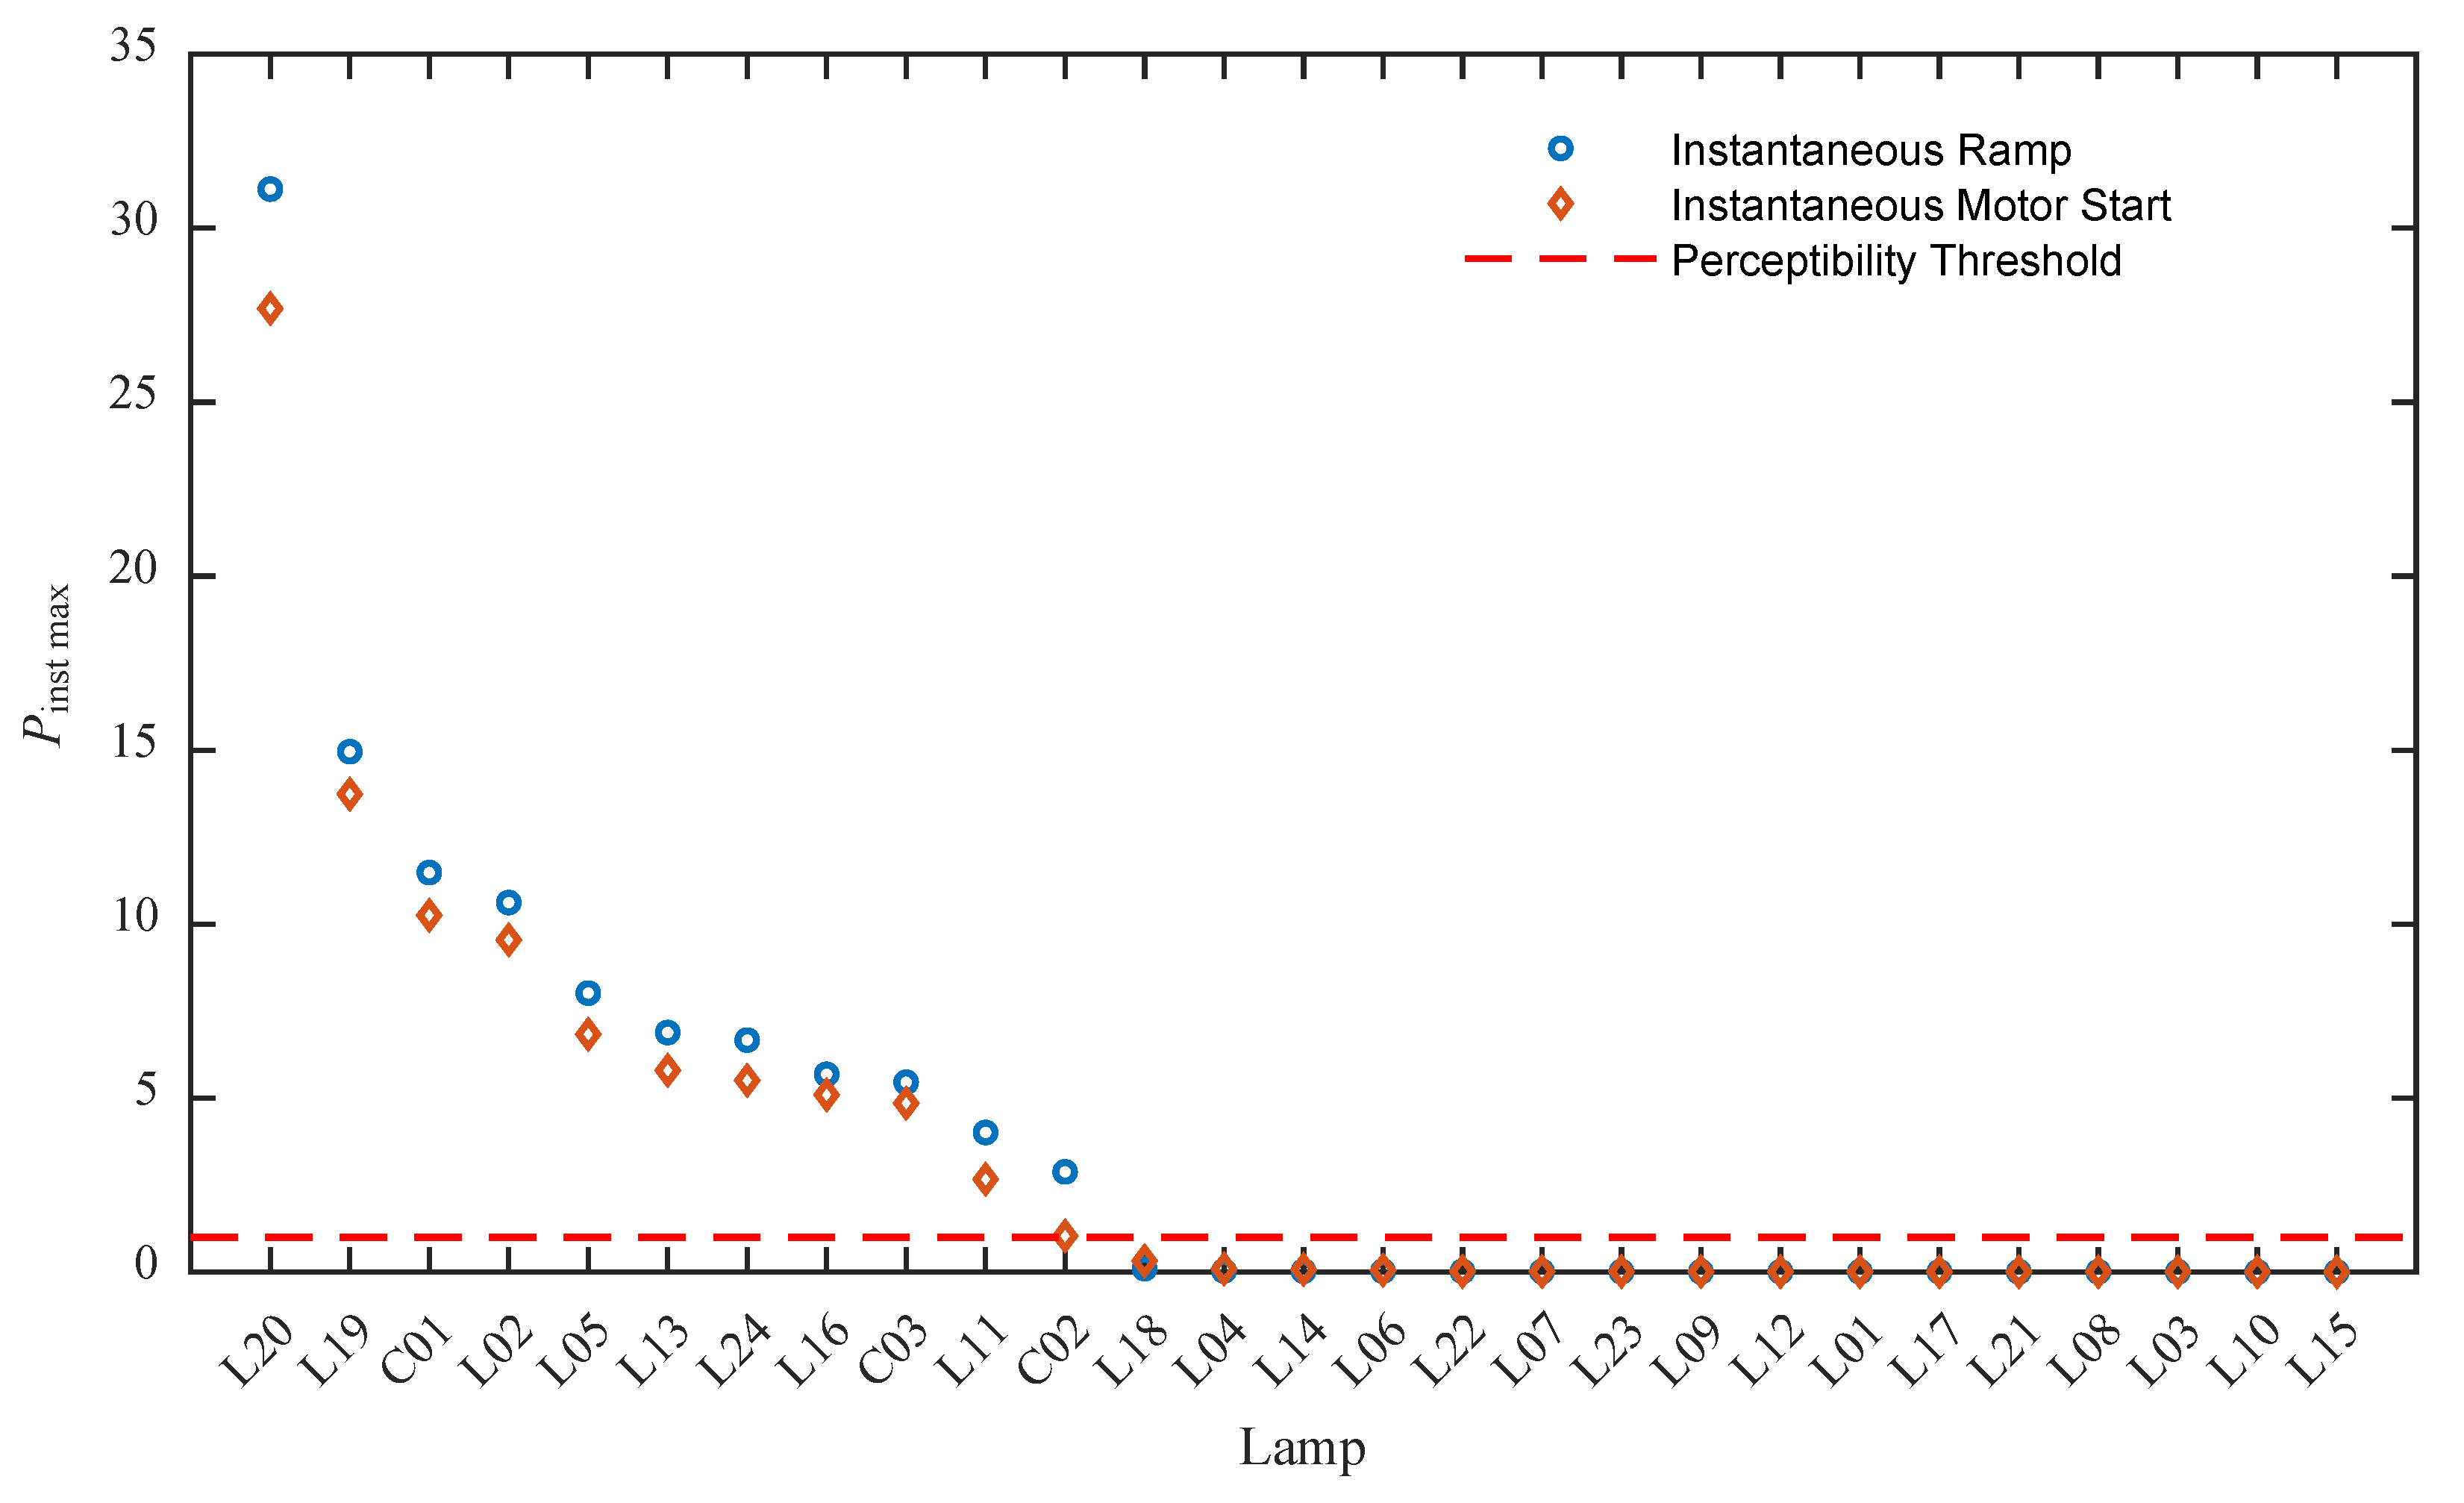
4.3. Response of Lighting Technologies to RVCs

The results corresponding to instantaneous ramp and instantaneous motor start type RVCs are shown in Figure 7 and Figure 8, respectively. The response of the lamps is analyzed in terms of the maximum value of the instantaneous flicker perception, P inst max . The results are depicted in detail for a selection of lamps, as their responses are representative of the whole set of tested lamps. In this way, the responses of the incandescent lamp (graphs a) and four modern lamps (graphs b) are shown. Lamps L20, C01 and L13 exhibited, respectively, high sensitivity, mid sensitivity, and low sensitivity to RVCs. Lamp L09, instead, represents the lamps that showed extremely low sensitivity for any RVC, well below the perceptibility threshold.
It can be observed that, for every analyzed RVC, the response of modern lighting technologies was lower than the response of the incandescent lamp. The quadratic relationship between RVC amplitude and P inst max obtained for the incandescent lamp was observed for all the other modern lamps as well. The goodness of the fit with a second order polynomial was proved by the R 2 coefficients, which range from 0.99–1 in the case of instantaneous ramp RVCs and from 0.94–1 in the case of instantaneous motor start RVCs. This obviously did not hold for lamps with an almost null response, as it is not possible to fit the data to a function. Moreover, it has been observed that the results obtained in [30] with simulated waveforms were exactly reproduced with real voltage signals. It is worth noting that the data points showed a slightly higher dispersion in the case of motor start RVCs. This is due to the dependence of the response on how quickly the steady-state voltage is recovered, as shown in [30], which in this case is different for every RVC. This additional parameter causes a slightly higher dispersion, which is not observed in the case of ramp type RVCs, where only the amplitude affects the P inst max .
A large variability in the behavior of the lamps has been measured, ranging from lamps with extremely low or null sensitivity to lamps with a high sensitivity. The differences observed even within the same lighting technology can be attributed to the different driver topologies of the lamps [20]. Although always below the response of the incandescent lamp, some lamps showed high levels of flicker perception, well above the perceptibility threshold, even for low amplitudes. For example, with a 5% amplitude RVC, the L20 lamp produced a P inst max = 31 . This is lower than the corresponding value obtained with the incandescent lamp, but higher than the perceptibility threshold P inst = 1 . Figure 9 shows the P inst max produced by every lamp when subjected to an instantaneous ramp type RVC of 5% amplitude. This figure provides an overview of the responses of all the 27 tested lamps in a summarized form, where the high variability can be fully appreciated.
The P inst max value at exactly 5% was obtained by interpolation of the fitting curve. It can be seen that many lamps were barely sensitive, while others had a high sensitivity, although always below the corresponding values for the incandescent lamps, which were P inst max = 85.9 for the instantaneous ramp type and P inst max = 79.5 for the instantaneous motor start type.
It is known that modern lamps could react faster to voltage changes, due to the lower thermal inertia of the modern technology with respect to the resistance of the incandescent lamp. For this reason, it has been analyzed if the modern lamps exhibit a better behavior than the incandescent lamp, even for short separation of RVCs (type of Figure 1e). This has been indeed proved and Figure 10 shows three cases of closely spaced RVCs with different separations. It can be seen that a lamp less sensitive than the incandescent for instantaneous RVCs (like L20) remained less sensitive even with closely spaced RVCs. The same behavior was observed for all of the other lamps.

5. Discussion

The IEC flicker measurement procedure is defined using periodic voltage fluctuation patterns. However, the flicker perception is also affected by voltage changes with a sudden nature, like RVCs. The flicker produced by RVCs depends directly on the amplitude, the rate of change, the voltage recovery time, and the duration of the RVCs. Based on these parameters, four different types of RVCs have been defined in the literature: instantaneous ramp, instantaneous motor start, gradual ramp, and gradual motor start.
In this work, RVCs in the LV network have been characterized, employing the IEC 61000-4-30 standard measurement method to analyze real voltage signals recorded at three different locations on the grid, close to disturbing loads. A great number of RVCs were identified, the majority of them being undervoltages, with short durations and small amplitudes. Most of them were classified as instantaneous RVCs, both ramp and motor start type, while only a small fraction of them presented a small rate of change (gradual RVCs). In some cases, when two consecutive instantaneous RVCs exhibited a short separation between each other, they were identified by the IEC method as a single RVC. Finally, the IEC 61000-4-30 procedure also detected RVCs with complex shapes, not belonging to any of the previously discussed types, and more related with typical fluctuations that cause flicker than with RVCs.
The occasional character and the short-time variation of RVCs cannot be reflected in the P st index, which is integrated over a much longer interval. Considering the sporadic nature of RVCs, their effect on flicker should be more accurately characterized through the maximum value of the instantaneous flicker perception, P inst max . Regarding the effect of RVCs on flicker, the most important parameter is the RVC amplitude, to which the flicker perception shows a quadratic dependence. Moreover, the rate of change of the voltage determines that gradual RVCs produces less flicker perception than instantaneous RVCs, for the same amplitude. Lastly, it has been observed that the separation between two consecutive RVCs is an additional parameter that determines whether their effect on flicker will be summed or not.
To analyze the influence of RVCs on the flicker immunity of the lamps, the responses of some commercially available lamps to different types of RVCs have been studied. The study is not focused on the technological characteristics of each lamp, but uses the lamps as a tool to analyze the influence of voltage disturbances on flicker. The analysis of modern lamp responses to RVCs focused on instantaneous RVCs, as they generate the highest P inst for the same amplitude among all the identified RVC types. This allowed for studying the variability of the response of the lamps to different RVC amplitude values. Although in the case of periodic voltage fluctuations the literature reports cases of modern lamps with a higher sensitivity than the incandescent lamp [19,20,21], in this work, none of the tested lamps resulted more sensitive to RVCs than the incandescent lamp. However, it was observed that the response of different lamps to RVCs was not uniform, even within the same lighting technology. Some LED lamps, in fact, were practically insensitive to RVCs, while others exhibited a response close to the incandescent lamp. Moreover, a significant number of lamps showed P inst max values well above the flicker perceptibility threshold. This proves that some modern lamps could actually produce irritation for users.
The challenge is therefore how to make sure that lamps subjected to RVCs do not produce irritation for grid customers, which, in turn, may cause complaints. In the case of periodic voltage fluctuations, this issue is effectively addressed by the lamp immunity protocol [23], which requires supplying several periodic voltage fluctuations to the lamp under testing and to measure the P st obtained using the light flickermeter. The P st values produced by the tested lamps must be lower than those obtained with the incandescent lamp for the same fluctuations, ensuring a lower irritation. However, this approach is not effective in the case of sudden voltage fluctuations since P st is not a suitable indicator for such disturbances. In the case of an instantaneous voltage change, like an RVC, the most reasonable approach is to employ the instantaneous flicker perception P inst to evaluate the lamp responses. According to the results presented in this work, the authors propose completing the immunity protocol by including an additional test, based on the measurement of P inst max by means of the light flickermeter. This test should be designed to assess the sensitivity of the lamps to RVCs and ensure that the irritation remains within the limits of the reference incandescent lamp. Instantaneous ramp RVCs are those producing the highest flicker perception among all types. As for the voltage test signal to be supplied to the lamps, the authors suggest the use of an instantaneous ramp RVC. As for the amplitude, a 5% value is the most appropriate choice for a test signal. This amplitude value is the common feature of the international standards regarding RVCs limits, and limiting RVCs to this value has worked well in dealing with incandescent lamps. Therefore, guaranteeing that new lamps have a lower sensitivity than the incandescent lamp for 5% amplitude RVCs will effectively limit the irritation to the users.
Lastly, this work highlighted the importance of the separation of two consecutive RVCs when it comes to flicker assessment. The influence of this parameter on the produced irritation is still to be studied, requiring further research and measurements, which will contribute to completing the analysis of the effect of RVCs on flicker.

6. Conclusions

In this paper, the flicker produced by RVCs in modern lighting technologies has been measured and studied, using the maximum instantaneous flicker perception as metrics. Modern lighting technologies showed lower sensitivity than the incandescent lamp. However, large dispersion and high values of flicker perception have been observed. The results led the authors to propose the definition of a new RVC immunity test to be added to the lamp immunity protocol IEC TR-61547-1, ensuring that newly produced lamps cause limited irritation to grid users.

Author Contributions

S.L. and I.A. have performed the experimental activity and the data processing; I.A. and J.J.G. have contributed in the conceptualization and the definition of the methodology of the experiments; S.L., L.A.L., K.R., P.S. have carried out the data acquisition in the grid; S.L., I.A. and J.J.G. have prepared the first draft of the manuscript; J.J.G., J.J.M. and J.B. have reviewed and edited the manuscript. All the authors have approved the submitted version of this manuscript.

Funding

This project has received funding from the European Union’s Horizon 2020 research and innovation programme under the Marie Sklodowska-Curie grant agreement No 676042. This work also received financial support from the Spanish MINECO through the project DPI2014-53317-R (cofinanced with the European Regional Development Fund) and from the Basque Government (Basque Country, Spain) through the project IT1087-16.

Conflicts of Interest

The authors declare no conflict of interest.

References

  1. International Electrotechnical Vocabulary—Part 614: Generation, Transmission and Distribution of Electricity—Operation; IEC 60050-614; International Electrotechnical Commission (IEC): Geneva, Switzerland, 2016.
  2. Electromagnetic Compatibility (EMC)—Part 4-15: Testing and Measurement Techniques—Flickermeter—Functional and Design Specifications; IEC 61000-4-15 Ed.2; International Electrotechnical Commission (IEC): Geneva, Switzerland, 2010.
  3. Electromagnetic Compatibility (EMC)—Part 3-7: Limits—Assessment of Emission Limits for the Connection of Fluctuating Installations to MV, HV and EHV Power Systems; IEC 61000-3-7; International Electrotechnical Commission (IEC): Geneva, Switzerland, 2008.
  4. U.S. Department of Energy. Energy Savings Forecast of Solid-State Lighting in General Illumination Applications; Technical Report; U.S. Department of Energy: Washington, DC, USA, 2016.
  5. McKinsey & Company Inc. Lighting the Way: Perspectives on the Global Lighting Market, 2nd ed.; Technical Report; McKinsey & Company Inc.: New York, NY, USA, 2012. [Google Scholar]
  6. Phannil, N.; Jettanasen, C.; Ngaopitakkul, A. Harmonics and Reduction of Energy Consumption in Lighting Systems by Using LED Lamps. Energies 2018, 11, 3169. [Google Scholar] [CrossRef]
  7. Wlas, M.; Galla, S. The influence of LED lighting sources on the nature of power factor. Energies 2018, 11, 1479. [Google Scholar] [CrossRef]
  8. Hermoso-Orzáez, M.J.; Gago-Calderón, A.; Rojas-Sola, J.I. Power quality and energy efficiency in the pre-evaluation of an outdoor lighting renewal with light-emitting diode technology: Experimental study and amortization analysis. Energies 2017, 10, 836. [Google Scholar] [CrossRef]
  9. Bollen, M.H.; Rönnberg, S.K.; Larsson, E.O.A.; Wahlberg, M.; Lundmark, C.M. Harmonic emission from installations with energy-efficient lighting. In Proceedings of the International Conference on Electrical Power Quality and Utilisation, EPQU, Lisbon, Portugal, 17–19 October 2011; pp. 797–802. [Google Scholar] [CrossRef]
  10. Halpin, M.; Cai, R.; De Jaeger, E.; Papic, I.; Perera, S.; Yang, X. A review of flicker objectives related to complaints, measurements, and analysis techniques. In Proceedings of the 20th International Conference on Electricity Distribution (CIRED), Prague, Czech Republic, 8–11 June 2009; Number 0755. pp. 1–4. [Google Scholar] [CrossRef]
  11. Arlt, D.; Stark, M.; Eberlein, C. Examples of International flicker requirements in high voltage networks and real world measurements. In Proceedings of the International Conference on Electrical Power Quality and Utilisation, EPQU, Barcelona, Spain, 9–11 October 2007. [Google Scholar] [CrossRef]
  12. Gallo, D.; Landi, C.; Pasquino, N. Design and Calibration of an Objective Flickermeter. IEEE Trans. Instrum. Meas. 2006, 55, 2118–2125. [Google Scholar] [CrossRef]
  13. Cai, R.; Cobben, J.; Myrzik, J.M.; Kling, W. Improving Weighting Filter of UIE/IEC Flickermeter-Building the Lamp Model. In Proceedings of the 19th International Conference on Electricity Distribution (CIRED), Vienna, Austria, 21–24 May 2007. [Google Scholar]
  14. Azcarate, I.; Gutierrez, J.J.; Lazkano, A.; Leturiondo, L.A.; Saiz, P.; Redondo, K.; Barros, J. Type Testing of a Highly Accurate Illuminance Flickermeter. In Proceedings of the International Conference on Harmonics and Quality of Power, ICHQP, Hong Kong, China, 17–20 June 2012; pp. 897–903. [Google Scholar] [CrossRef]
  15. Hooshyar, A.; El-Saadany, E.F. Development of a flickermeter to measure non-incandescent lamps flicker. IEEE Trans. Power Deliv. 2013, 28, 2103–2115. [Google Scholar] [CrossRef]
  16. Drapela, J.; Langella, R.; Slezingr, J.; Testa, A. A Tunable Flickermeter to Account for Different Lamp Technologies. IEEE Trans. Power Deliv. 2016, PP, 1. [Google Scholar] [CrossRef]
  17. CIGRE/CIRED. Review of Flicker Objectives for HV, MV and LV Systems; Final Report CIGRE/CIRED WG C4.108; CIGRE: Paris, France, 2009. [Google Scholar]
  18. Cai, R.; Cobben, J.; Myrzik, J.M.; Blom, J.; Kling, W. Flicker responses of different lamp types. IET Gener. Transm. Distrib. 2009, 3, 816. [Google Scholar] [CrossRef]
  19. Chmielowiec, K. Flicker effect of different type of light sources. In Proceedings of the International Conference on Electrical Power Quality and Utilisation, EPQU, Lisbon, Portugal, 17–19 October 2011; pp. 3–8. [Google Scholar]
  20. Drapela, J.; Langella, R.; Testa, A.; Collin, A.J.; Xu, X.; Djokic, S.Z. Experimental evaluation and classification of LED lamps for light flicker sensitivity. In Proceedings of the International Conference on Harmonics and Quality of Power, ICHQP, Ljubljana, Slovenia, 13–16 May 2018. [Google Scholar] [CrossRef]
  21. Azcarate, I.; Gutierrez, J.J.; Lazkano, A.; Saiz, P.; Redondo, K.; Leturiondo, L.A. Experimental Study of the Response of Efficient Lighting Technologies to Complex Voltage Fluctuations. Int. J. Electr. Power Energy Syst. 2014, 63, 499–506. [Google Scholar] [CrossRef]
  22. Azcarate, I. Tecnologías de Iluminación ante Fluctuaciones de Tensión: Análisis de Sensibilidad y Control de Inmunidad. Ph.D. Thesis, Universidad del País Vasco (UPV/EHU), Bilbao, Spain, 2016. [Google Scholar]
  23. Equipment for General Lighting Purposes—EMC Immunity Requirements—Part 1: An Objective Light Flickermeter and Voltage Fluctuation Immunity Test Method; IEC TR 61547-1; International Electrotechnical Commission (IEC): Geneva, Switzerland, 2017.
  24. Barros, J.; Gutierrez, J.J.; De Apraiz, M.; Saiz, P.; Diego, R.I.; Lazkano, A. Rapid Voltage Changes in Power System Networks and Their Effect on Flicker. IEEE Trans. Power Deliv. 2016, 31, 262–270. [Google Scholar] [CrossRef] [Green Version]
  25. Bollen, M.H.; Hager, M.; Schwaegerl, C. Quantifying voltage variations on a time scale between 3 seconds and 10 minutes. In Proceedings of the 18th International Conference on Electricity Distribution (CIRED), Turin, Italy, 6–9 June 2005. [Google Scholar] [CrossRef]
  26. Halpin, M.; De Jaeger, E. Suggestions for overall EMC co-ordination with regard to rapid voltage changes. In Proceedings of the 20th International Conference on Electricity Distribution (CIRED), Prague, Czech Republic, 8–11 June 2009. [Google Scholar]
  27. Bollen, M.H.; Gu, I.Y. Characterization of Voltage Variations in the Very-Short Time-Scale. IEEE Trans. Power Deliv. 2005, 20, 1198–1199. [Google Scholar] [CrossRef]
  28. Brekke, K.; Seljeseth, H.; Mogstad, O. Rapid Voltage Changes—Definition and Minimum Requirements. In Proceedings of the 20th International Conference on Electricity Distribution (CIRED), Prague, Czech Republic, 8–11 June 2009. [Google Scholar] [CrossRef]
  29. Electromagnetic Compatibility (EMC)—Part 4-30: Testing and Measurement Techniques—Power Quality Measurement Methods; IEC 61000-4-30 Ed.3; International Electrotechnical Commission (IEC): Geneva, Switzerland, 2015.
  30. Lodetti, S.; Azcarate, I.; Gutierrez, J.J.; Redondo, K.; Saiz, P.; Melero, J.J.; Bruna, J. Sensitivity of Modern Lighting Technologies to Rapid Voltage Changes. In Proceedings of the International Conference on Harmonics and Quality of Power, ICHQP, Ljubljana, Slovenia, 13–16 May 2018. [Google Scholar]
  31. Rashbass, C. The visibility of transient changes of luminance. J. Physiol. 1970, 210, 165–186. [Google Scholar] [CrossRef] [PubMed] [Green Version]
  32. De Lange, H. Experiments on flicker and some calculations on an electrical analogue of the foveal systems. Physica 1952, 18, 935–950. [Google Scholar] [CrossRef]
  33. Ailleret, P. Détermination des lois expérimentales du papillotement (flicker) en vue de leur application aux réseaux basse tension sur lesquels les charges varient priodiquement ou aléatoirement (soudeuses démarrages de moteurs). Bulletin de la Société Française des Electriciens 1957, 7, 257–262. [Google Scholar]
  34. UIE. Flicker Measurement and Evaluation; Technical Report; International Union for Electroheat, Disturbances WG: Paris, France, 1992. [Google Scholar]
  35. Voltage Characteristics of Electricity Supplied by Public Distribution Networks; EN 50160:2010; CENELEC: Brussels, Belgium, 2010.
  36. Voltage Characteristics of Electricity Supplied by Public Distribution Networks; EN 50160:2010/A1:2015; CENELEC: Brussels, Belgium, 2015.
  37. Gutierrez, J.J.; Beeckman, P.; Azcarate, I. A Protocol to Test The Sensitivity Of Lighting Equipment to Voltage Fluctuations. In Proceedings of the 23rd International Conference on Electricity Distribution (CIRED), Lyon, France, 15–18 June 2015. [Google Scholar]
Figure 1. RVC types according to [28]: (a) instantaneous ramp; (b) instantaneous motor start; (c) gradual ramp; (d) gradual motor start; and (e) two consecutive instantaneous ramp RVCs. The top graphs show the RMS voltage, while the bottom graphs the P inst obtained with the IEC flickermeter. Each P inst curve in the bottom graphs is caused by the corresponding RMS curve in the top graph, identifiable by the same color and line-style (solid blue, dashed red, dotted green).
Energies 12 00865 g001
Figure 2. Photograph (a) and block diagram (b) of the experimental setup.
Energies 12 00865 g002
Figure 3. Block diagram of the light flickermeter implementation.
Energies 12 00865 g003
Figure 4. Examples of RVCs recorded at Site 1 (a); Site 2 (b); and Site 3 (c).
Energies 12 00865 g004
Figure 5. Distribution of the amplitude of the measured RVCs, according to IEC 61000-4-30. The inset shows a zoom of the high amplitude region.
Energies 12 00865 g005
Figure 6. Distribution of the duration of the measured RVCs, according to IEC 61000-4-30. The inset shows a zoom of the long duration region.
Energies 12 00865 g006
Figure 7. Response of the incandescent lamp (a) and CFL and LED lamps (b) to instantaneous ramp type RVCs.
Energies 12 00865 g007aEnergies 12 00865 g007b
Figure 8. Response of the incandescent lamp (a) and CFL and LED lamps (b) to instantaneous motor start type RVCs.
Energies 12 00865 g008
Figure 9. P inst max produced by every lamp when subjected to an RVC of 5% amplitude.
Energies 12 00865 g009
Figure 10. Comparison of the response of the L20 lamp with the incandescent lamp, when subjected to an RVC made of two consecutive instantaneous ramps with different separations. RMS voltage (top graphs) and instantaneous flicker perception (bottom graphs).
Energies 12 00865 g010
Table 1. Set of lamps under testing.
IDTechnologyLuminous Flux
[lm]
Power
[W]
Manufacturer
I01Inc71060General Electrics
C01CFL138023Lexman
C02CFL57011Megaman
C03CFL57011Philips
L01LED245223Lexman
L02LED120015CristalRecord
L03LED152113Philips
L04LED110012CristalRecord
L05LED65012Osram
L06LED152112Philips
L07LED105511Philips
L08LED105511Xanlite
L09LED80610Eglo
L10LED110010Lexman
L11LED47010Sylvania
L12LED8069.5Lexman
L13LED8069.5Philips
L14LED10208Garza
L15LED8068Osram
L16LED4708Philips
L17LED5607Awox
L18LED8066Lexman
L19LED3706Philips
L20LED3455.5Xanlite
L21LED4705aDeo
L22LED2503.3Osram
L23LED2503Lexman
L24LED1001Philips

