Modeling the Performance of a Zinc/Bromine Flow Battery
by
 ,
,
Boram Koo
1, 
Dongcheul Lee
1,
Jaeshin Yi
1,
Chee Burm Shin
1,*,
Dong Joo Kim
2,
Eun Mi Choi
2 and
Tae Hyuk Kang
2 1
Department of Chemical Engineering and Division of Energy Systems Research, Ajou University, Suwon 16499, Korea
2
Lotte Chemical, Daejeon 34110, Korea
*
Author to whom correspondence should be addressed.
Energies 2019, 12(6), 1159; https://doi.org/10.3390/en12061159
Submission received: 8 February 2019
/
Revised: 11 March 2019
/
Accepted: 21 March 2019
/
Published: 25 March 2019
(This article belongs to the Special Issue Grid-Scale Energy Storage Management)
Abstract
:The zinc/bromine (Zn/Br2) flow battery is an attractive rechargeable system for grid-scale energy storage because of its inherent chemical simplicity, high degree of electrochemical reversibility at the electrodes, good energy density, and abundant low-cost materials. It is important to develop a mathematical model to calculate the current distributions in a Zn/Br2 flow cell in order to predict such quantities as current, voltage, and energy efficiencies under various charge and discharge conditions. This information can be used to design both of bench and production scale cells and to select the operating conditions for optimum performance. This paper reports a modeling methodology to predict the performance of a Zn/Br2 flow battery. The charge and discharge behaviors of a single cell is calculated based on a simple modeling approach by considering Ohm’s law and charge conservation on the electrodes based on the simplified polarization characteristics of the electrodes. An 8-cell stack performance is predicted based on an equivalent circuit model composed of the single cells and the resistances of the inlet and outlet streams of the positive and negative electrolytes. The model is validated by comparing the modeling results with the experimental measurements.
1. Introduction
Grid-scale energy storage is used to store electrical energy on a large scale in an electrical power grid to mitigate the effects of uncertainty and variability associated with intermittent renewable energy sources such as solar and wind powers along with sudden or unexpected changes of grid loads [1]. Among a broad range of grid-scale energy storage technologies, a flow battery is considered to be a well-suited option due to the technical merits as in the following. A flow battery has a long cycle life and is both energy efficient and environmentally friendly. The energy rating of the flow battery is a separate design variable from the power rating, because the energy capacity of the flow battery is a function of the electrolyte volume and the power is a function of the number of cell stacks [2]. The zinc/bromine (Zn/Br2) flow battery is an attractive flow battery system for grid-scale energy storage because of its inherent chemical simplicity, high degree of electrochemical reversibility at the electrodes, good energy density, and abundant low-cost materials [3,4,5]. As a result of many promising features of the Zn/Br2 flow battery, it is currently at the commercial demonstration stage in USA [6,7], Australia [8], and Scotland [9]. Although very promising, a wide deployment of the Zn/Br2 flow battery has been hampered by its low power density and zinc dendrite formation and the works to overcome these deficiencies are in progress [10,11,12]. In addition to the efforts to improve the performance of the Zn/Br2 flow battery experimentally [10,11,12], it is important to develop a mathematical model to calculate the current distributions in a Zn/Br2 flow battery in order to predict such quantities as current, voltage, and energy efficiencies under various charge and discharge conditions. This information can be used to design both of bench and production scale cells and to select the operating conditions for optimum performance.
There have been many previous works on the modeling of the flow batteries and the reviews of flow battery models are given in references [13,14]. The types of flow battery model include an electrochemical model, an equivalent circuit model, and many others depending on the purpose of modeling [13,14]. The electrochemical model can be used to predict the battery performance under various conditions of charge and discharge conditions. The model considers the variations of the electrical potentials of the solid matrix of electrodes and the electrolyte, the concentrations of ionic species, and the electrochemical kinetics. A detailed treatment can be found in the book by Newman and Thomas-Alyea [15]. The equivalent circuit model is a powerful modeling tool. By using electrical equivalents, or circuit elements, the electrical response of the flow batteries are reproduced. From the parameters of the equivalent circuit model, valuable information about the characteristics of the modeled battery can be deduced [16,17,18]. As compared to the most commonly encountered vanadium redox flow battery, there have been a limited number of previous works on the modeling of the Zn/Br2 flow battery. Evans and White [19] reviewed the works up to 1987. Lee and Selman [20] calculated the current distributions at parallel-plate electrodes in a Zn/Br2 flow cell using the orthogonal collocation technique. They found that the presence of a separator and the effect of electrode resistance contribute to a marked smoothing of the current distribution. Lee and Selman [21] analyzed the electrode corrosion by a soluble species diffusing from the counter-electrode in a compartmented flow cell. They applied the analysis to a Zn/Br2 flow cell and found that the corrosion of the zinc electrode by dissolved bromine during electrolysis is mass-transfer controlled. Van Zee et al. [22] presented a simple model of Exxon’s Zn/Br2 battery to predict the energy efficiency of the battery for various electrolyte resistivities and cell geometries. Mader and White [23] developed a mathematical model of a parallel-plate electrochemical cell with a separator and a homogeneous bulk reaction to predict the effect of effective separator thickness, residence time, channel width, and potential driving force on the performance of a Zn/Br2 battery during charging process. Evans and White [24] presented a mathematical model of a Zn/Br2 flow cell including a porous layer on the bromine electrode and a porous separator to predict their effect on the cell performance during charge and discharge. Simpson and White [25] developed an algebraic model for a parallel plate, Zn/Br2 flow cell using the Butler-Volmer equation for the electrochemical reactions and the homogeneous reaction kinetics between bromine and bromide to predict various cell performance quantities. Kalu and White [26] presented a mathematical model for a Zn/Br2 cell that considers the effects of an increase or a decrease in the cathode channel width due to zinc removal on discharge and zinc deposition on charge, respectively, as well as the effect of an organic bromine complexing agent on the cell performance. Manla et al. [27] analyzed and modeled a zinc bromide energy storage for vehicular applications and showed that the open-circuit voltage and internal resistance of the battery are the functions of the battery’s state of charge (SOC) and they adopted a Kalman filtering technique to adjust the estimated SOC according to battery current. Knehr et al. [28] quantified the sources of voltage loss in the minimal architecture zinc bromine battery based on the experimental data obtained by using the galvanostatic intermittent titration technique (GITT) and electrochemical impedance spectroscopy (EIS) on a cell with a three electrode setup. Among the modeling works on the Zn/Br2 flow battery mentioned above [20,21,22,23,24,25,26,27,28], references [20,21,23,24,25,26] belong to the electrochemical models, references [28] uses an equivalent circuit model to quantify the voltage losses, and references [22,27] are based on simple algebraic equation models.
In this work, a modeling is carried out to calculate the current distributions in a Zn/Br2 flow battery stack composed of 8 cells. This work adopts a simple approach to model the charge and discharge performance of a single cell by considering Ohm’s law and charge conservation on the electrodes based on the simplified polarization characteristics of the electrodes. An 8-cell stack performance is predicted based on an equivalent circuit model composed of the single cells and the resistances of the inlet and outlet streams of the positive and negative electrolytes. The model is validated by comparing the modeling results with the experimental measurements.
2. Mathematical Model
The modeling procedure used in this work for a single cell in the Zn/Br2 flow battery is similar to that of Kim et al. [29,30,31,32] employed to model a lithium-ion battery. From the continuity of the current on the positive and negative electrodes during discharge, the Poisson equations to compute the potential distributions on the positive and negative electrodes are derived as follows:
where Vp and Vn are the potentials (V) on the positive and negative electrodes, respectively, rp and rn are the resistances (Ω) of the positive and negative electrodes, respectively, and J is the current density (current per unit area (A m−2)) flowing from the negative electrode to the positive electrode. Ωp and Ωn denote the computational domains of the positive and negative electrodes, respectively.
The relevant boundary conditions for Vp are
where denotes the gradient in the direction of the outward normal to the boundary. The first boundary condition (Equation (3)) implies that there is no current flow through the boundary (Γp1) of the electrode other than the Table. The second boundary condition (Equation (4)) means that the linear current density through the tab (Γp2) of the length L (cm) is constant to the value of I0/L. I0 is the total current (A) through the tab in the mode of constant-current discharge. The boundary conditions for Vn are
The first boundary condition (Equation (5)) implies the same as in the case of Vp. The second boundary condition (Equation (6)) means that the potential at the tab of the negative electrode is fixed to the value of zero as the reference potential. The solutions to the governing Equations (1) and (2) subject to the associated boundary conditions (Equations (3) and (6)) were obtained by using the finite element method as explained in references [29,30,31,32].
The current density, J, of Equations (1) and (2) is a function of the potentials of the positive and negative electrodes. The functional relationship between the current density and the electrode potentials depends on the polarization characteristics of the electrodes. In this study, the following polarization expression used by Tiedemann and Newman [33] and Newman and Tiedemann [34] is employed:
where Y and U are the fitting parameters. The physical meaning of U is similar to the equilibrium potential of the battery cell and Y may be regarded as a reaction rate constant of an electrochemical reaction as discussed in reference. [32]. As suggested by Gu [35], U and Y are expressed as polynomial functions of SOC as follows:
where a0–a9 and b0–b7 are the fitting parameters rendering the best fit of the calculated results from the modeling to the experimental data. The details of the procedures to obtain a0–a9 and b0–b7 are given in the following section of ‘3. Results and Discussion.’ By not computing the potential distribution of electrolyte phase and the transport phenomena of ionic species, the model in this work cuts down considerable computation time in comparison with the rigorous electrochemical models of references [20,21,23,24,25,26] mentioned above, while preserving the validity of the model.
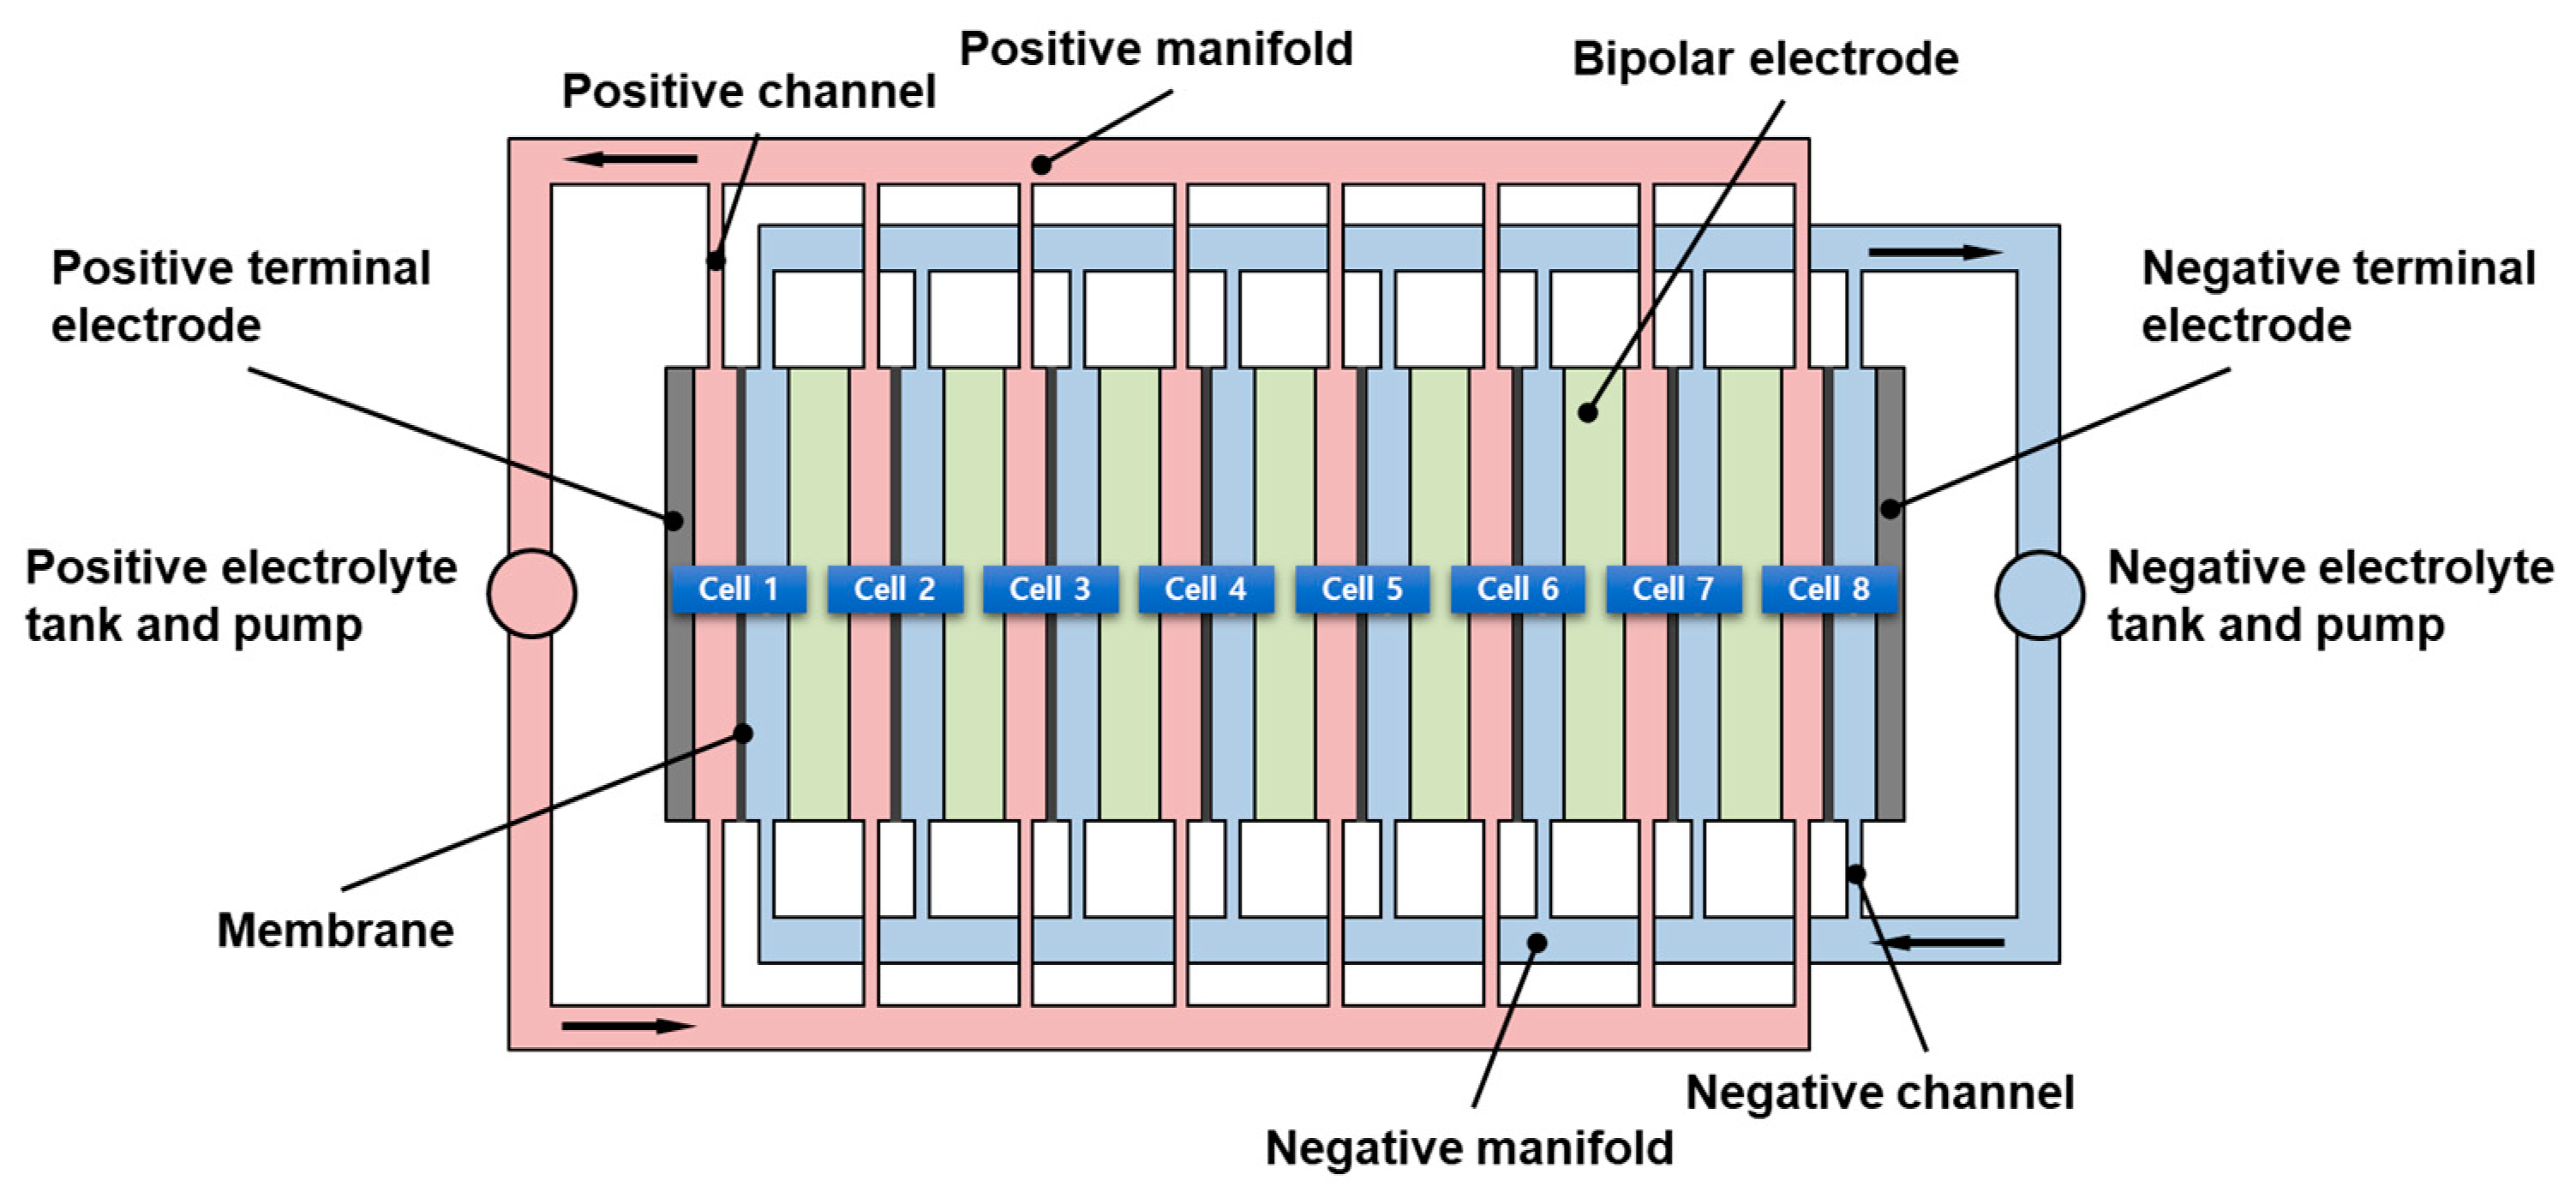
A schematic of a Zn/Br2 flow battery stack composed of 8 cells is shown in Figure 1. The flow battery stack consists of 8 bipolar single cells that are hydraulically connected in parallel and electrically connected in series. Each single cell is separated into positive and negative electrolyte compartments by membrane. Only the inlet and outlet streams of positive and negative electrolytes are connected to the positive and negative electrolyte compartments of the single cells, respectively. The positive and negative electrolytes are supplied from the tanks to the single cells through the manifolds and their channels. The internal currents pass through the electrodes of the bipolar single cells mainly due to the electrochemical reactions during charging and discharging, while the shunt currents are flowing through the secondary electrical connections among the cells furnished by the electrolyte-filled channels and manifolds [36]. An equivalent circuit model corresponding to the schematic of Figure 1 is shown in Figure 2 to predict the internal and shunt current distributions in an 8-cell stack of the Zn/Br2 flow battery. The equivalent circuit model is composed of the resistances of the inlet and outlet streams of the positive and negative electrolytes connecting the single cell models using Equations (1) and (5) described in the above. The usual assumptions [36,37] are made for the resistances of the electrolyte streams. The electrolyte paths are represented by resistor elements. All resistance paths between the cells and a manifold are identical, and each manifold segment between a pair of channels is represented by an identical resistor. In Figure 2, and are the resistances (Ω) of the positive and negative electrolytes in the manifolds, respectively, and and are the resistances (Ω) of the positive and negative electrolytes in the channels, respectively. Note that the circuit is symmetric with respect to the inlet and outlet streams for both the positive and negative electrolytes. By applying Kirchhoff’s first and second laws to the network of Figure 2, the internal and shunt current distributions in a Zn/Br2 flow battery stack composed of eight cells can be calculated at various charge and discharge conditions. The details of calculation procedures are reported in references [36,37].
3. Experimental Section
The major parts of the 420 W/833 Wh Zn/Br2 flow battery stack of Figure 1 include bipolar electrodes, separators, and terminal electrodes. The bipolar design allows the two electrochemical reactions of reduction and oxidation to occur on opposite faces of the same electrode. The separator was a commercially available membrane (SF600, Asahi, Japan). The bipolar electrodes were made of carbon composite with an active area of 33 × 30 cm2. The terminal electrodes were rigid end-blocks encapsulating the current collectors attached to the carbon composite. Aqueous solutions containing electroactive species of 2.25 M ZnBr2, supporting electrolyte of 0.55 M ZnCl2 and bromine complex agent of 0.8 M MEP (Methyl Ethyl Pyrrolidinium) were used for the negative and positive electrolytes. The electrolytes were recirculated between the Zn/Br2 flow battery stack and the electrolyte tanks using pumps (NH-20PI-Z-D, Pan World Co., Ltd., Japan). The total electrolyte volume was 8 L and the electrolyte flow rates for the positive and negative sides were controlled at 2.967 L/min and 2.438 L/min, respectively. During the cycling of the Zn/Br2 flow battery stack, the battery stack was charged with the current of 20 A and it was discharged with the three different currents of 20, 25, and 30 A. The voltage limit during discharge was 6 V. On every three cycles, complete stripping of any zinc remaining on the anode was followed.
4. Results and Discussion
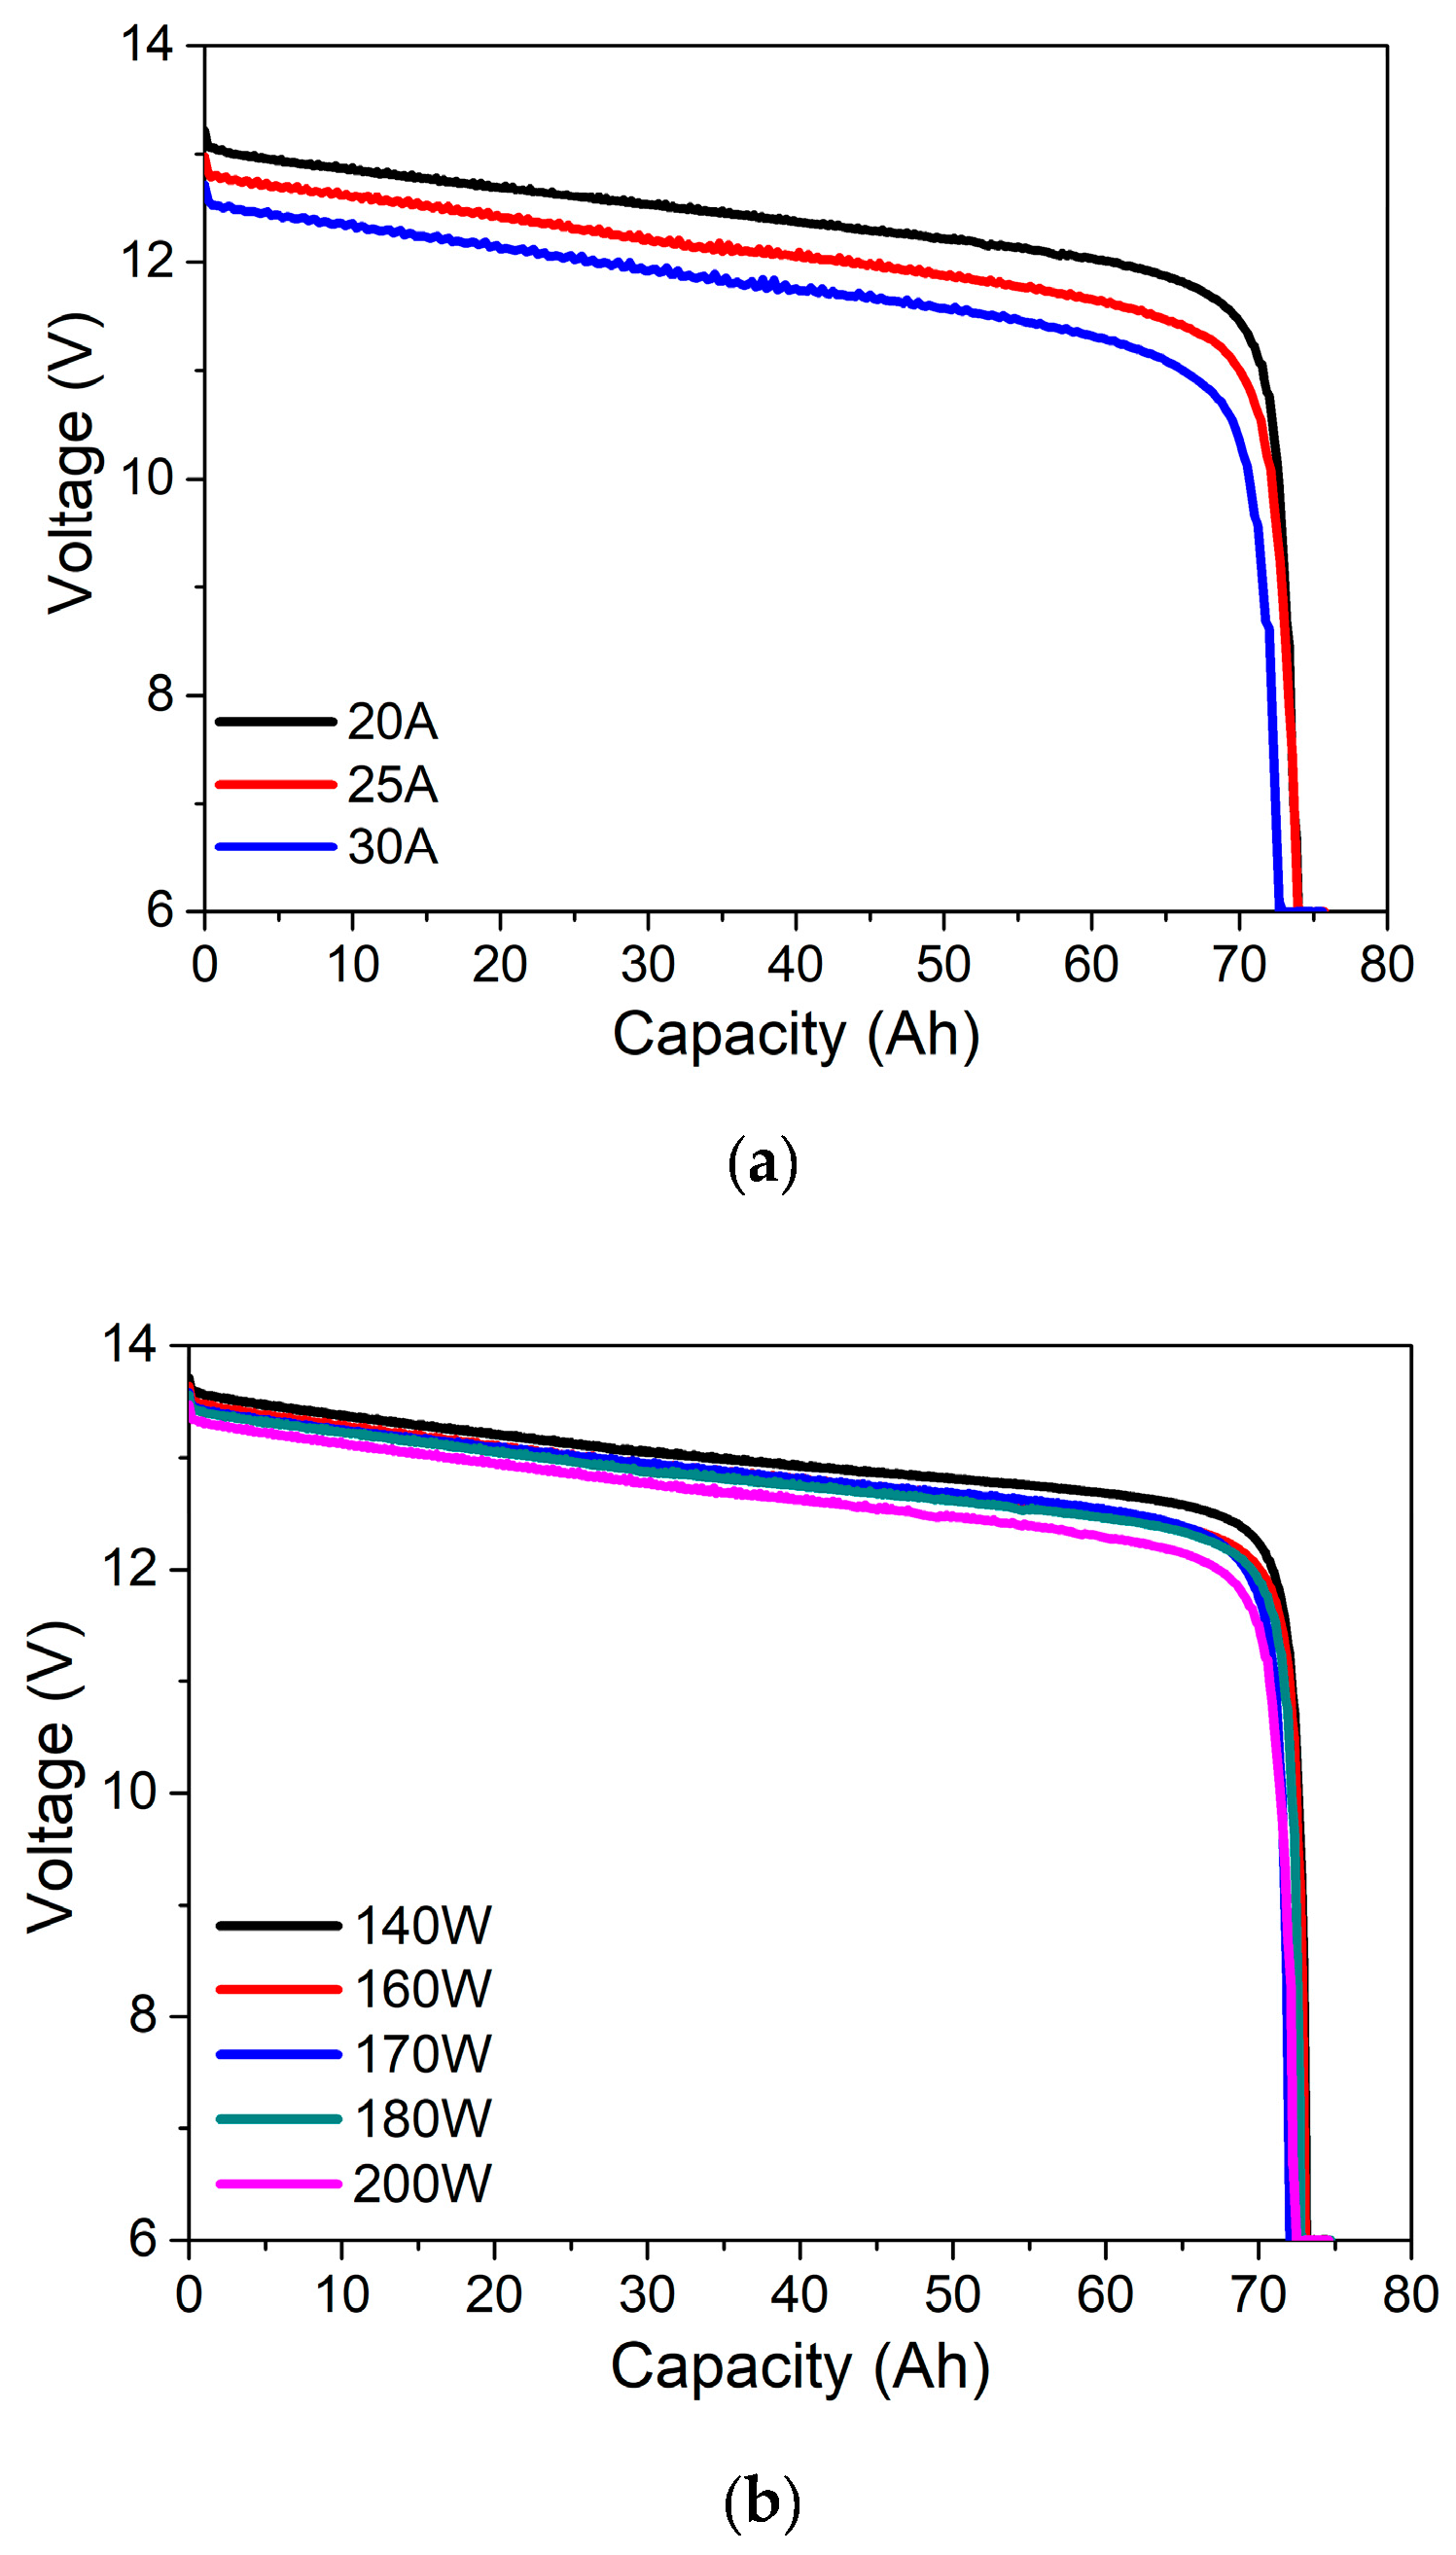
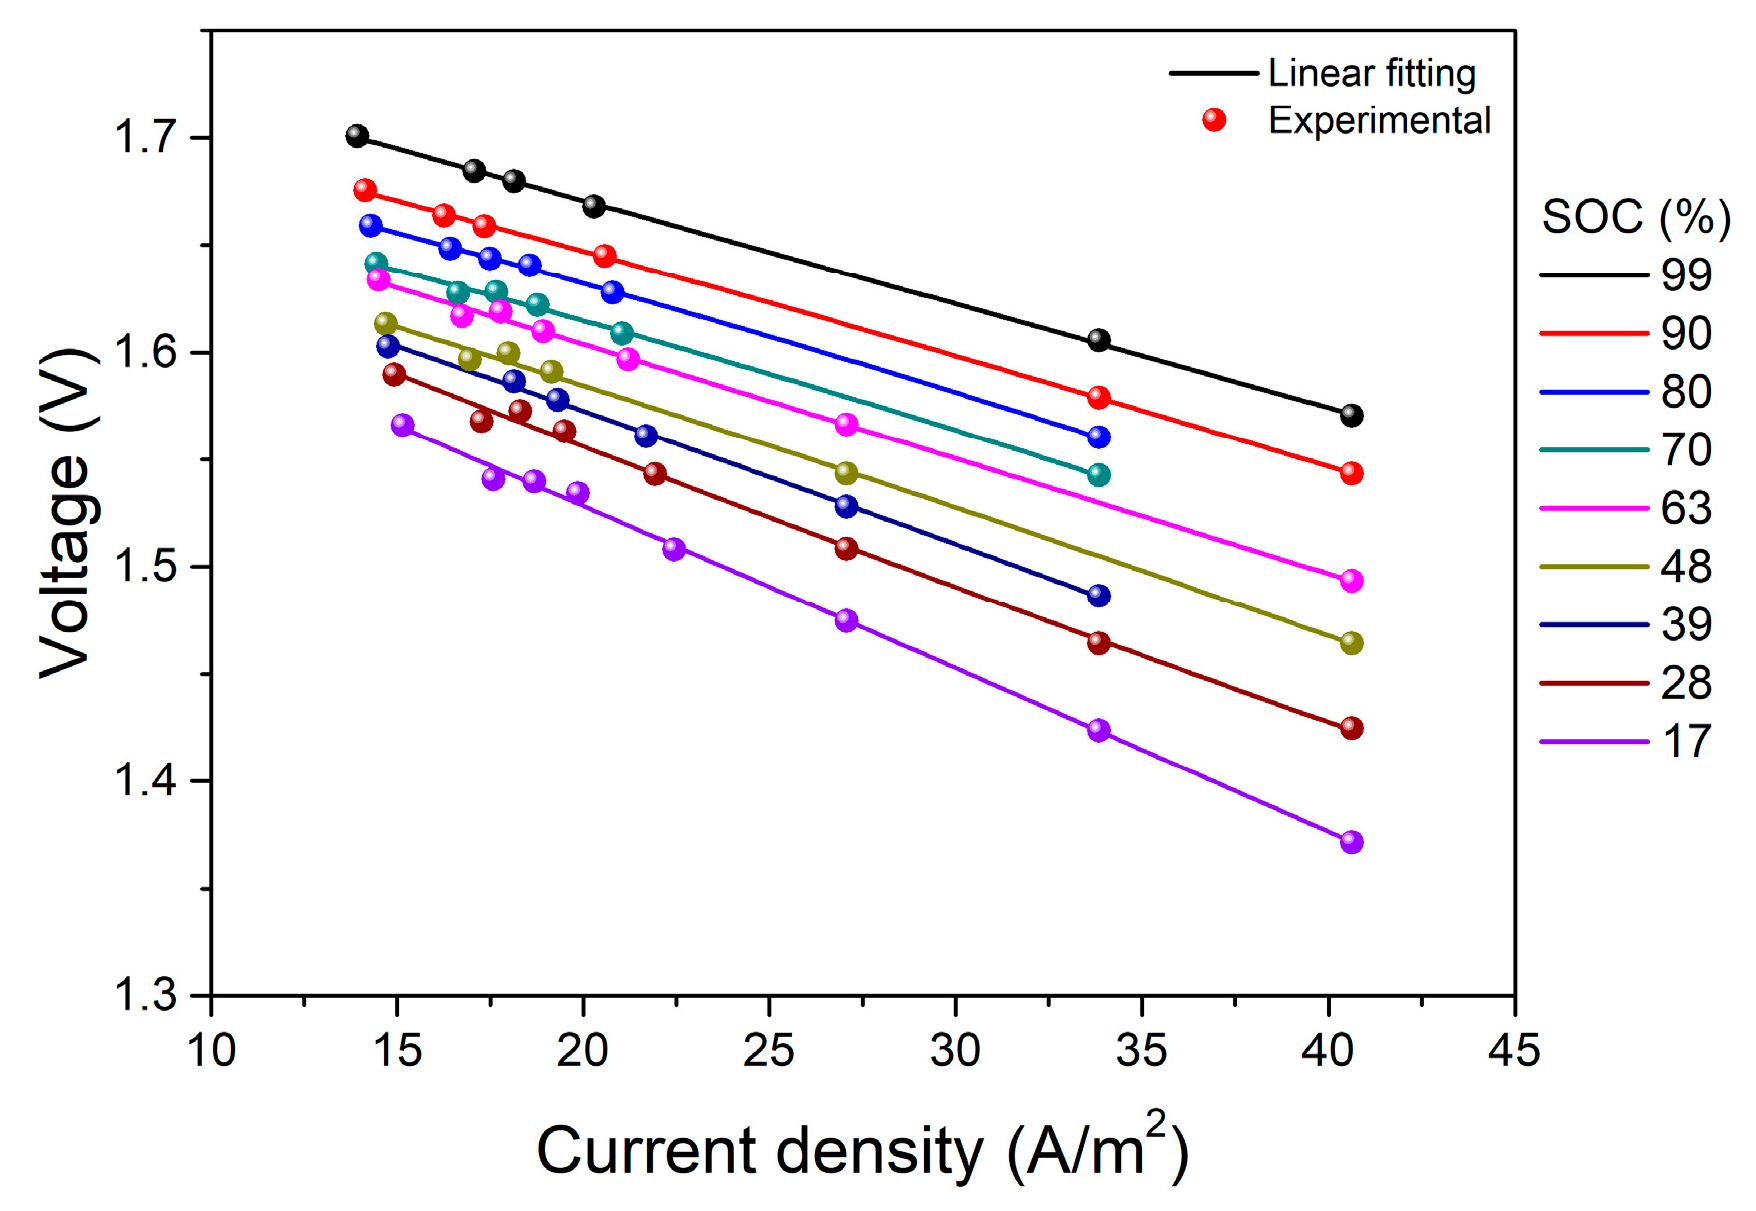
The experimental discharge curves of a Zn/Br2 flow battery stack composed of 8 cells having a capacity of 833Wh for different discharge currents and powers are shown in Figure 3a,b respectively. The experimental data of Figure 3 can be converted to the voltage of a single cell as a function of applied current density during discharge as shown in Figure 4. The cell voltage data are fitted fairly well with a linear function of applied current density, which justifies the use of the functional relationship of Equation (3) between the cell voltage and applied current density. From the slopes and intercepts with vertical axis of the linear fittings at different SOC values, the functional relationships of Y and U with SOC are obtained. The coefficients of a0–a9 and b0–b7 used in Equations (4) and (5) are the fitting parameters rendering the best fit of Y and U as polynomial functions of SOC. The fitting parameters of a0–a9 and b0–b7 used in this work are listed in Table 1.
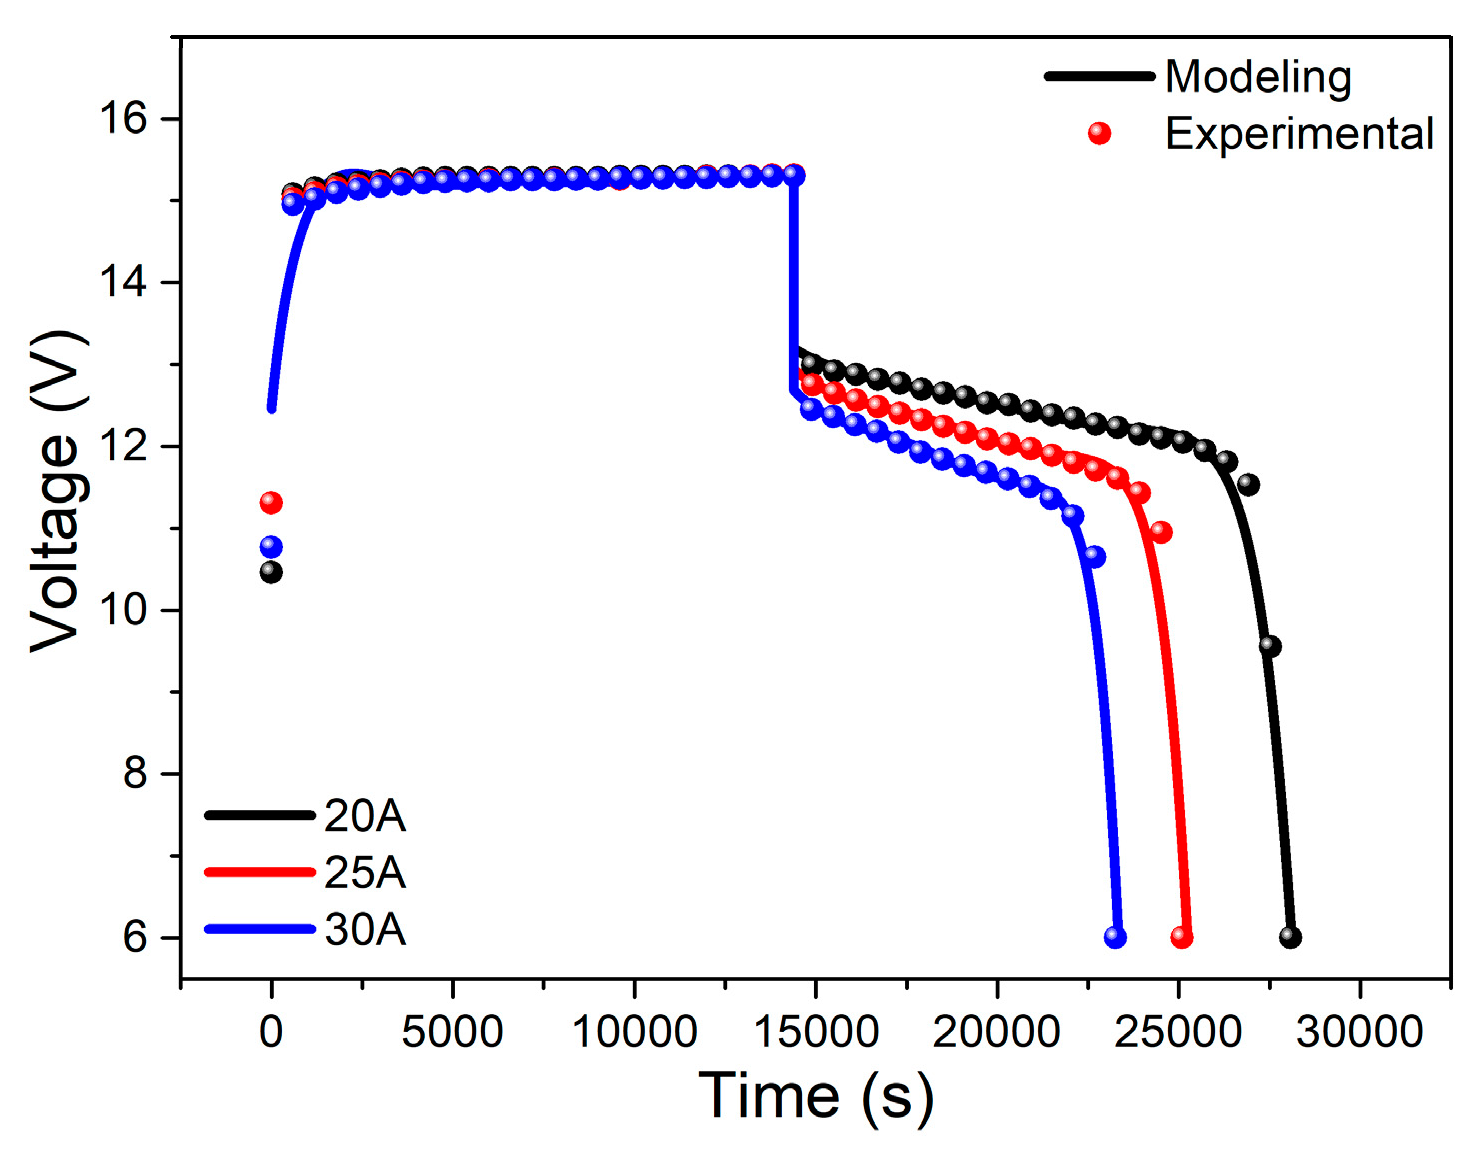
To test the validity of the modeling approach for a Zn/Br2 flow battery adopted in this work, the charge and discharge behaviors of a Zn/Br2 flow battery stack composed of 8 cells calculated from the modeling are compared with the experimental measurements in Figure 5. The experimental data are in good agreement with the modeling results.
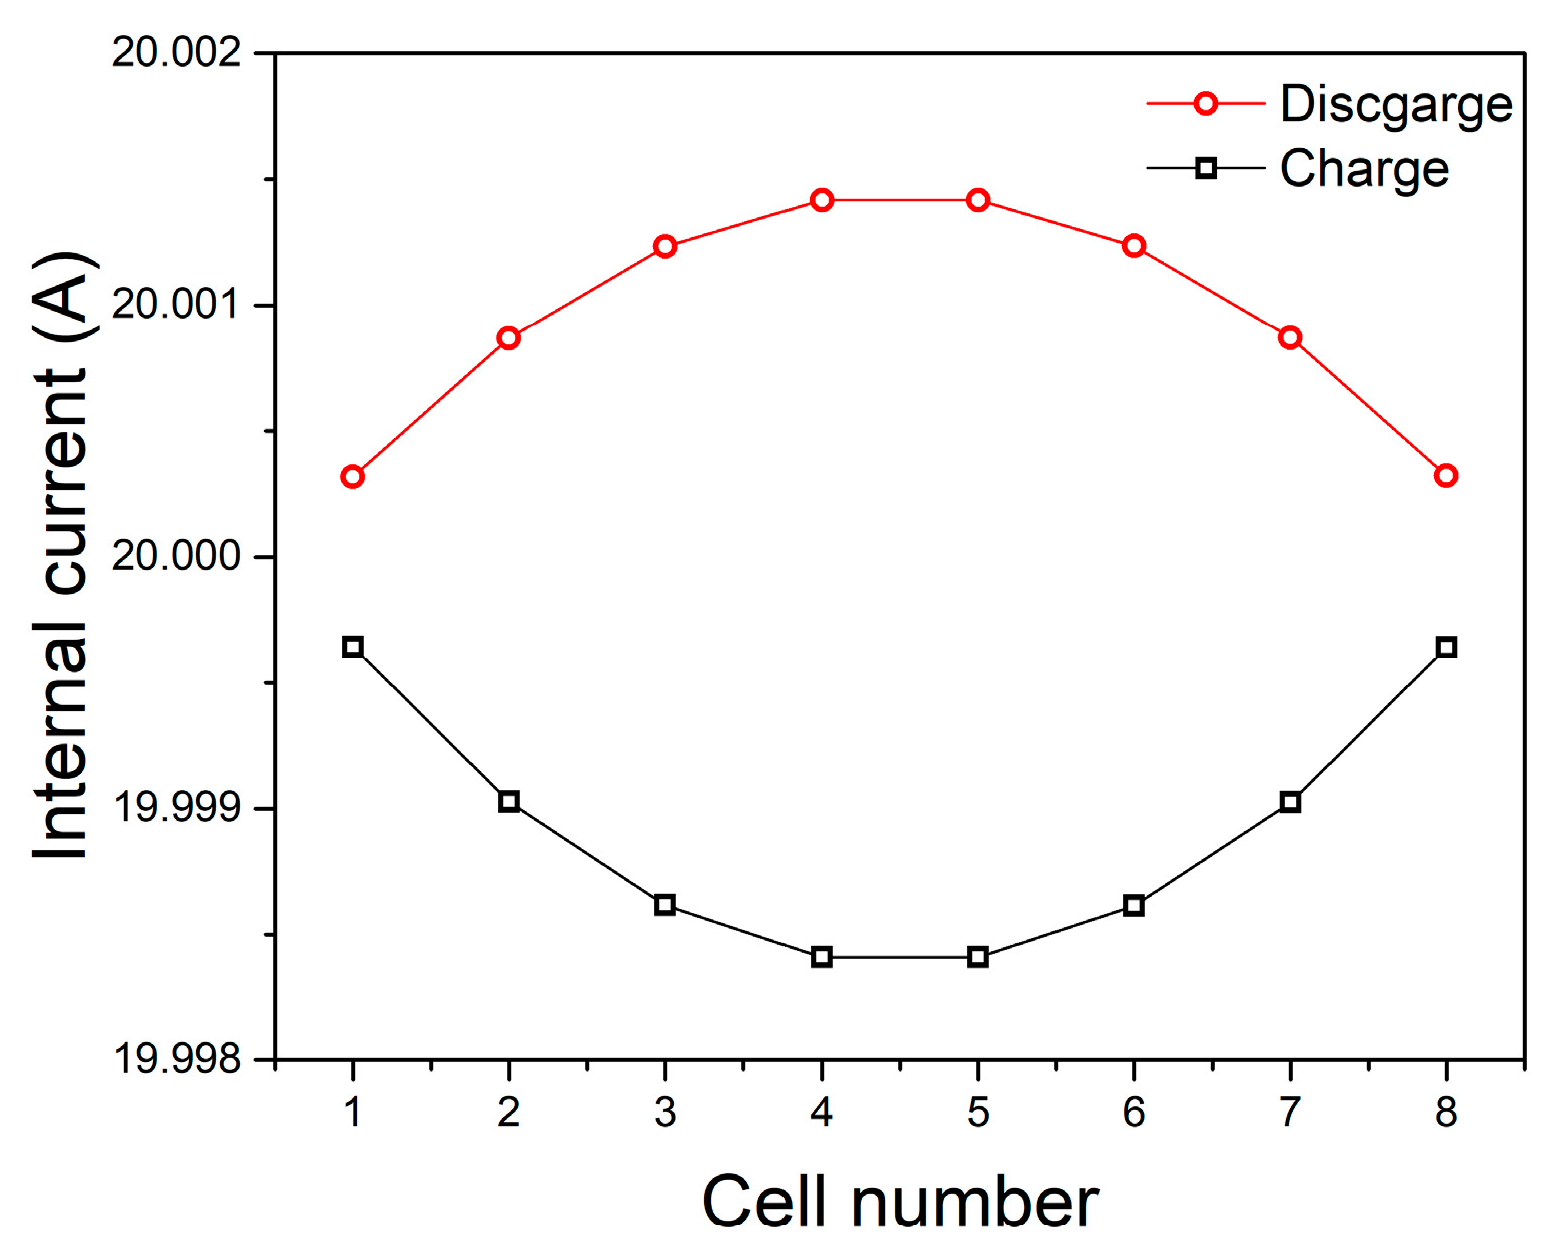
The variations of the internal currents passing through the electrodes of the single cells as a function of time during charging and discharging with the constant current of 20 A are given in Figure 6. As shown in Figure 6a, the magnitude of the internal current is minimum at the center portion of the stack and maximum at the two ends of the stack during charging. The magnitude of the internal current decreases rapidly at the beginning of charging, but its decrease rate becomes gradual as SOC increases and it becomes almost unchanging near the end of charging. The variation of the internal current with time during discharging shown in Figure 6b has a contrary tendency to that of charging in Figure 6a. The magnitude of the internal current is maximum at the center portion of the stack and minimum at the two ends of the stack during discharging. The magnitude of the internal current decreases slowly at the beginning of discharging, but its decrease rate becomes rapid near the end of discharging. The distributions of the magnitude of the internal current at 50% SOC during charging and discharging with the constant current of 20 A as a function of cell position is shown in Figure 7. The magnitude of the internal current is maximum at the center portion of the stack and minimum at the two ends of the stack during discharging, but it is minimum at the center and maximum at the two ends during charging as mentioned in the discussions of Figure 6. The results shown in Figure 6 and Figure 7 can be explained by the directions of the internal current flows during charging and discharging along with those of the shunt current flows given in Figure 8 and Figure 9. The shunt currents in the channels flow in the direction from the cell to the manifold at the first half stack (cells 1–4) and they flow in the opposite direction at the second half stack (cells 5–8) for both of the positive and negative electrolytes as shown in Figure 8. The shunt currents in the manifolds in the first half stack increase with the cell number due to the accumulation of the shunt currents in channels, but those in the second half stack decrease with the cell number due to the reduction of the shunt currents in channels as shown in Figure 9. During charging with constant-current, the charge current is supplied to the battery stack from the outside power supply and it flows along the direction from the positive terminal electrode to the negative terminal electrode. Because the charge current is the source of the current flow through the battery stack and the summation of the internal current and the shunt current around each cell should be the same as the charge current, the internal current is minimum at the center and maximum at the two ends during charging. During discharging with constant-current, the battery stack supplies the discharge current to the outside load and it flows along the direction from the negative terminal electrode to the positive terminal electrode. Because the internal current is the source of the current flow through the battery stack and the summation of the internal current and the shunt current around each cell should be the same as the discharge current, the internal current is maximum at the center and minimum at the two ends during discharging.
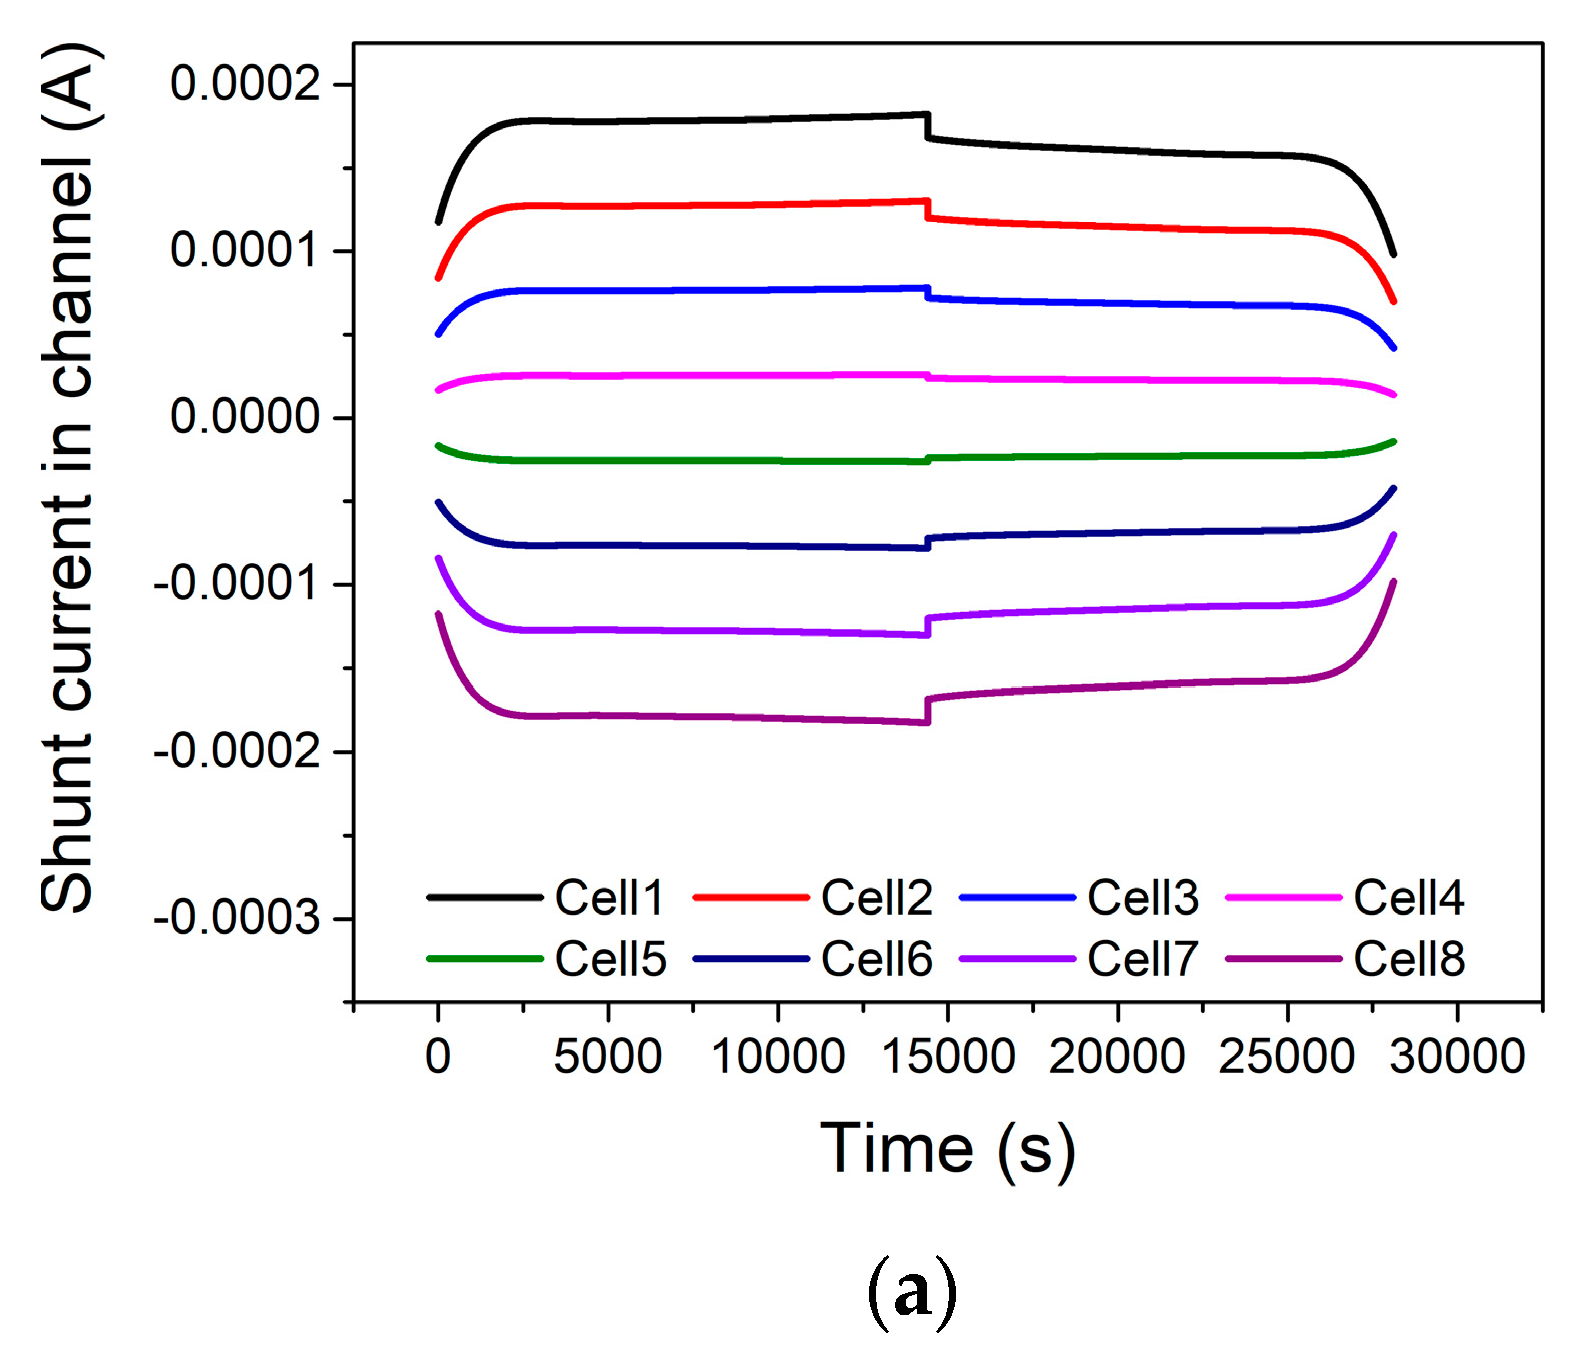
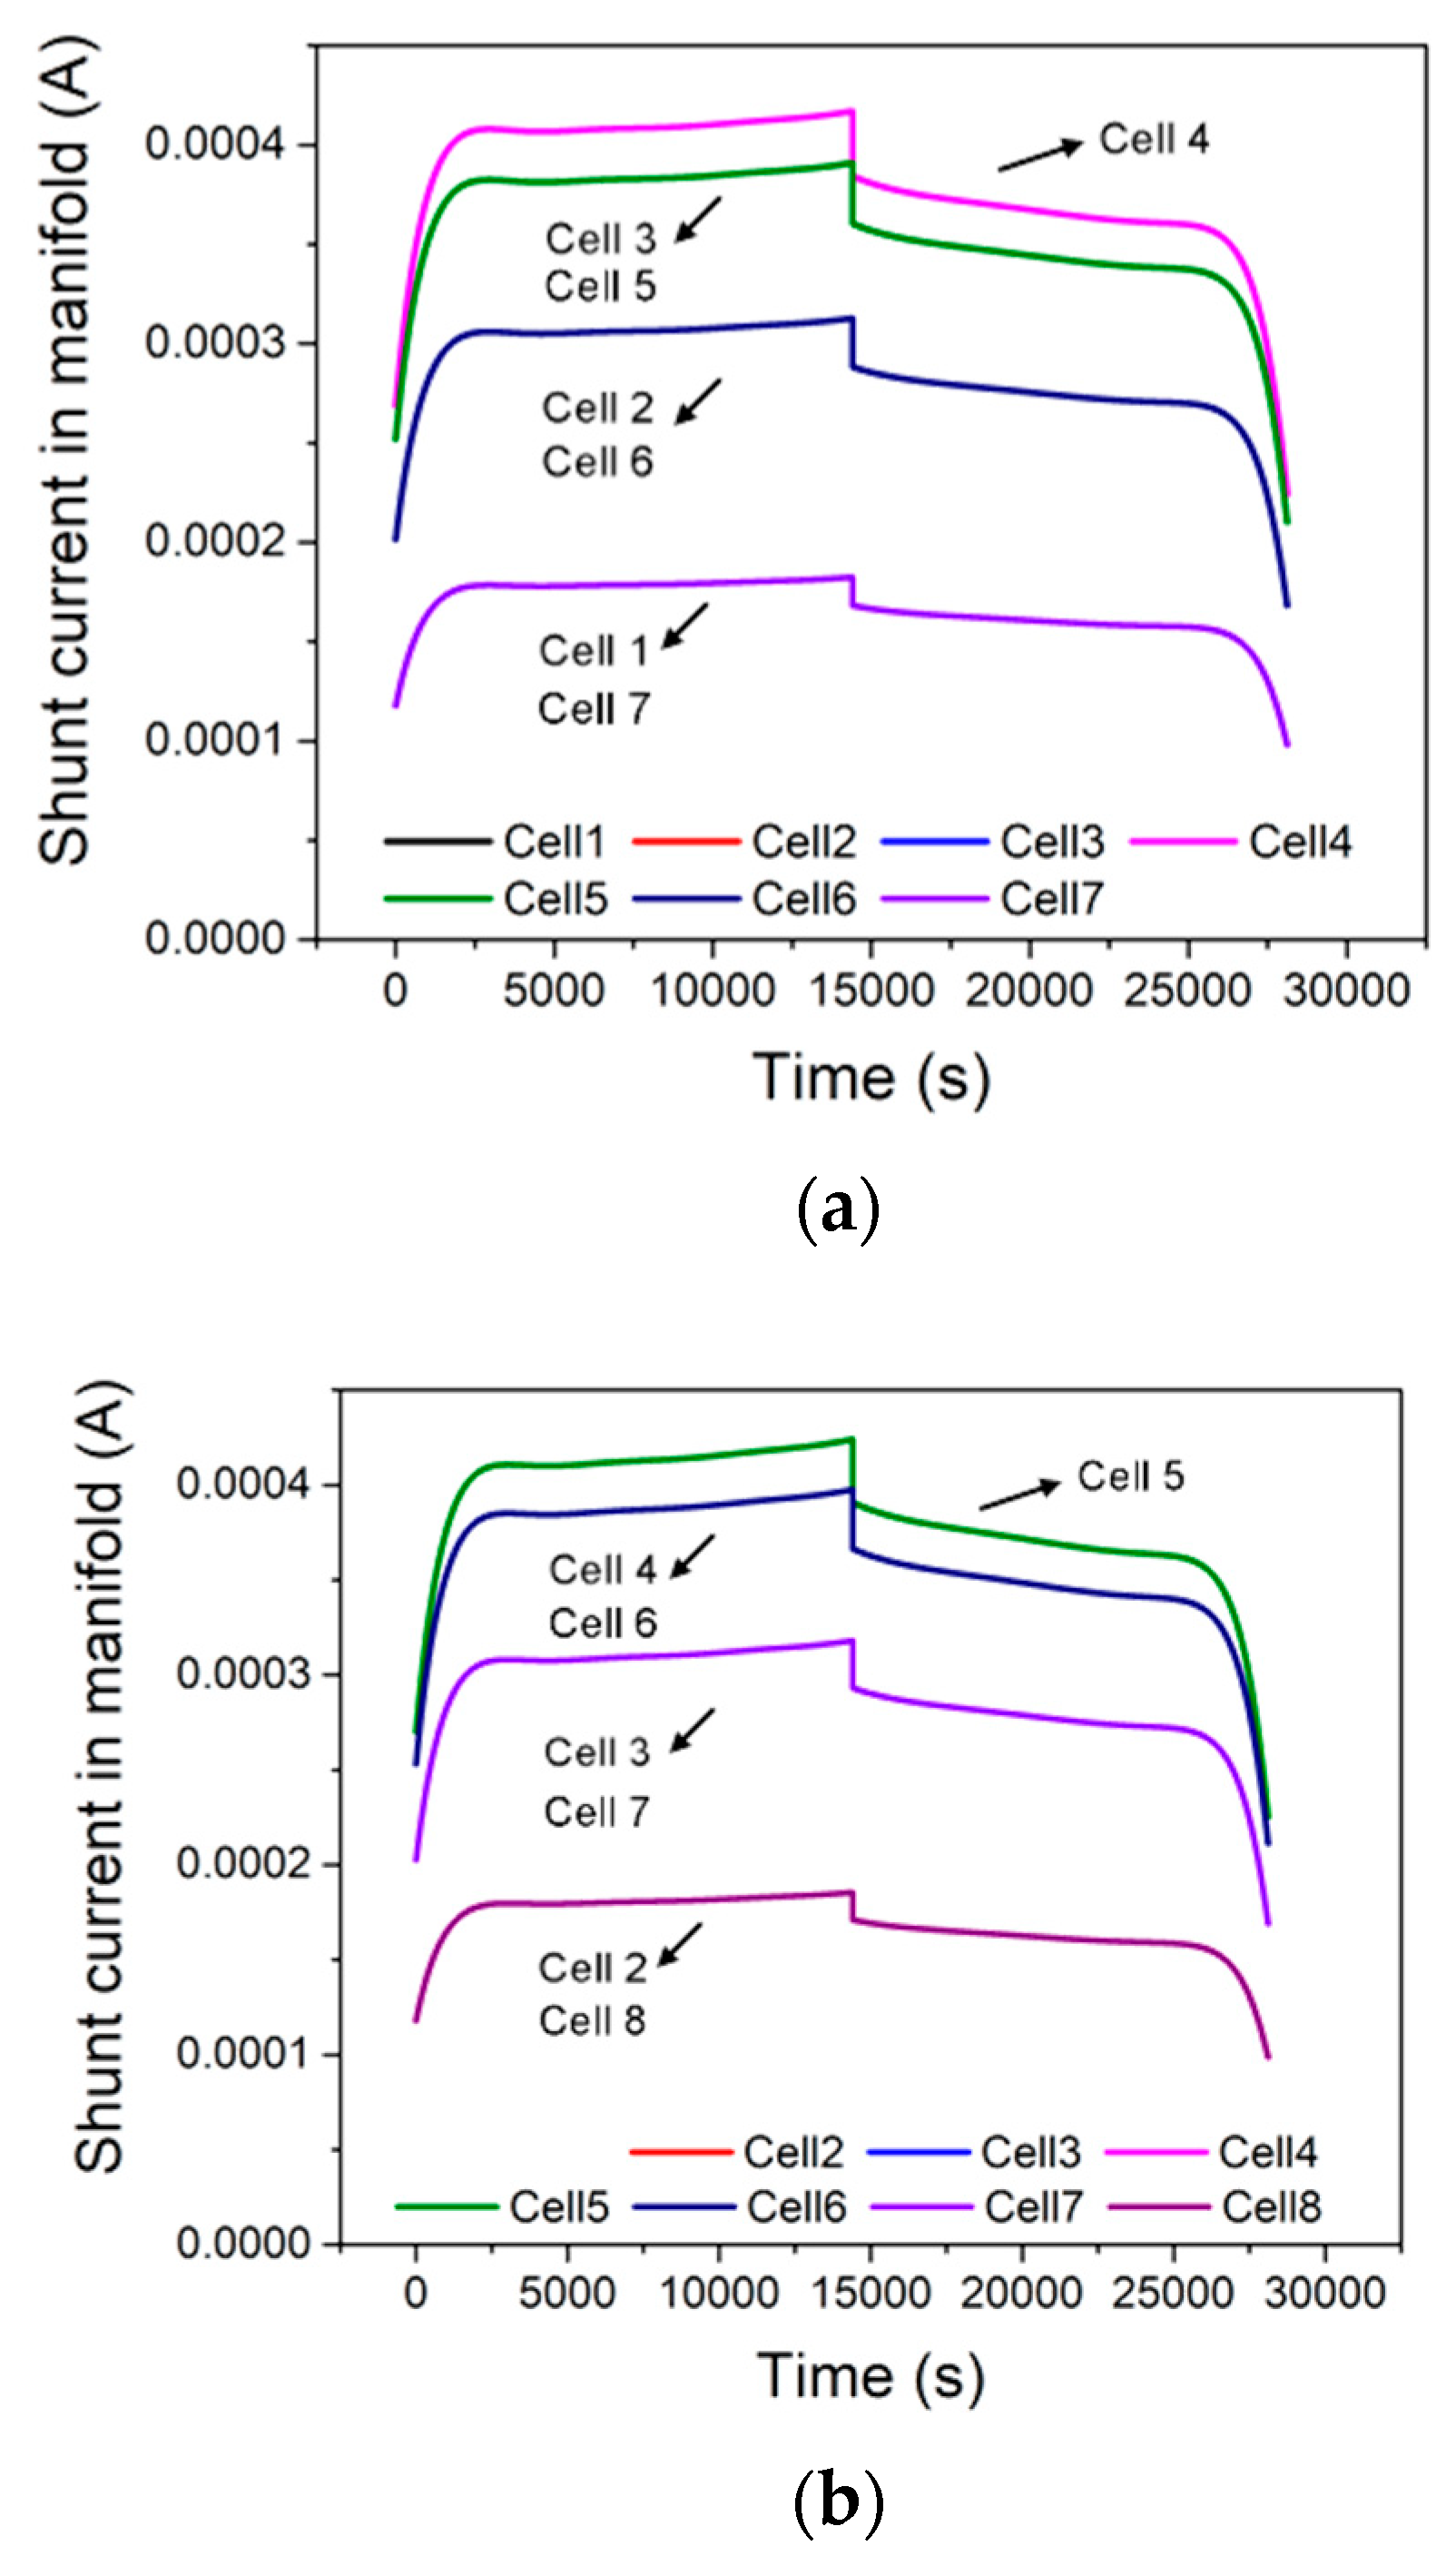
Even though distributing the electrolytes to the cell stack through inlet manifolds and collecting them through outlet manifolds may be a convenient design, the electrolyte-filled channels and manifolds furnish secondary series electrical connections among the cells. These ionic shunt currents cause power loss, current inefficiency, and corrosion [36,37]. The variations of the shunt currents in channels as a function of time during charging and discharging with the constant current of 20 A for the positive and negative electrolytes are shown in Figure 8a,b respectively. The shunt currents in channels are largest at the two ends of the stack and decrease toward the center during charging and discharging. The shunt currents in channels are opposite in direction for the two halves of the stack. Figure 9a,b show the variations of the shunt currents in manifold as a function of time during charging and discharging with the constant current of 20 A for the positive and negative electrolytes, respectively. The magnitude of the shunt current in manifold is maximum near the center portion of the stack and minimum at the two ends of the stack during charging and discharging. The magnitude of the shunt currents increases during charging and decreases during discharging in Figure 8 and Figure 9, because the electrical conductivities of both of the positive and negative electrolytes increase as the state of charge (SOC) increases.
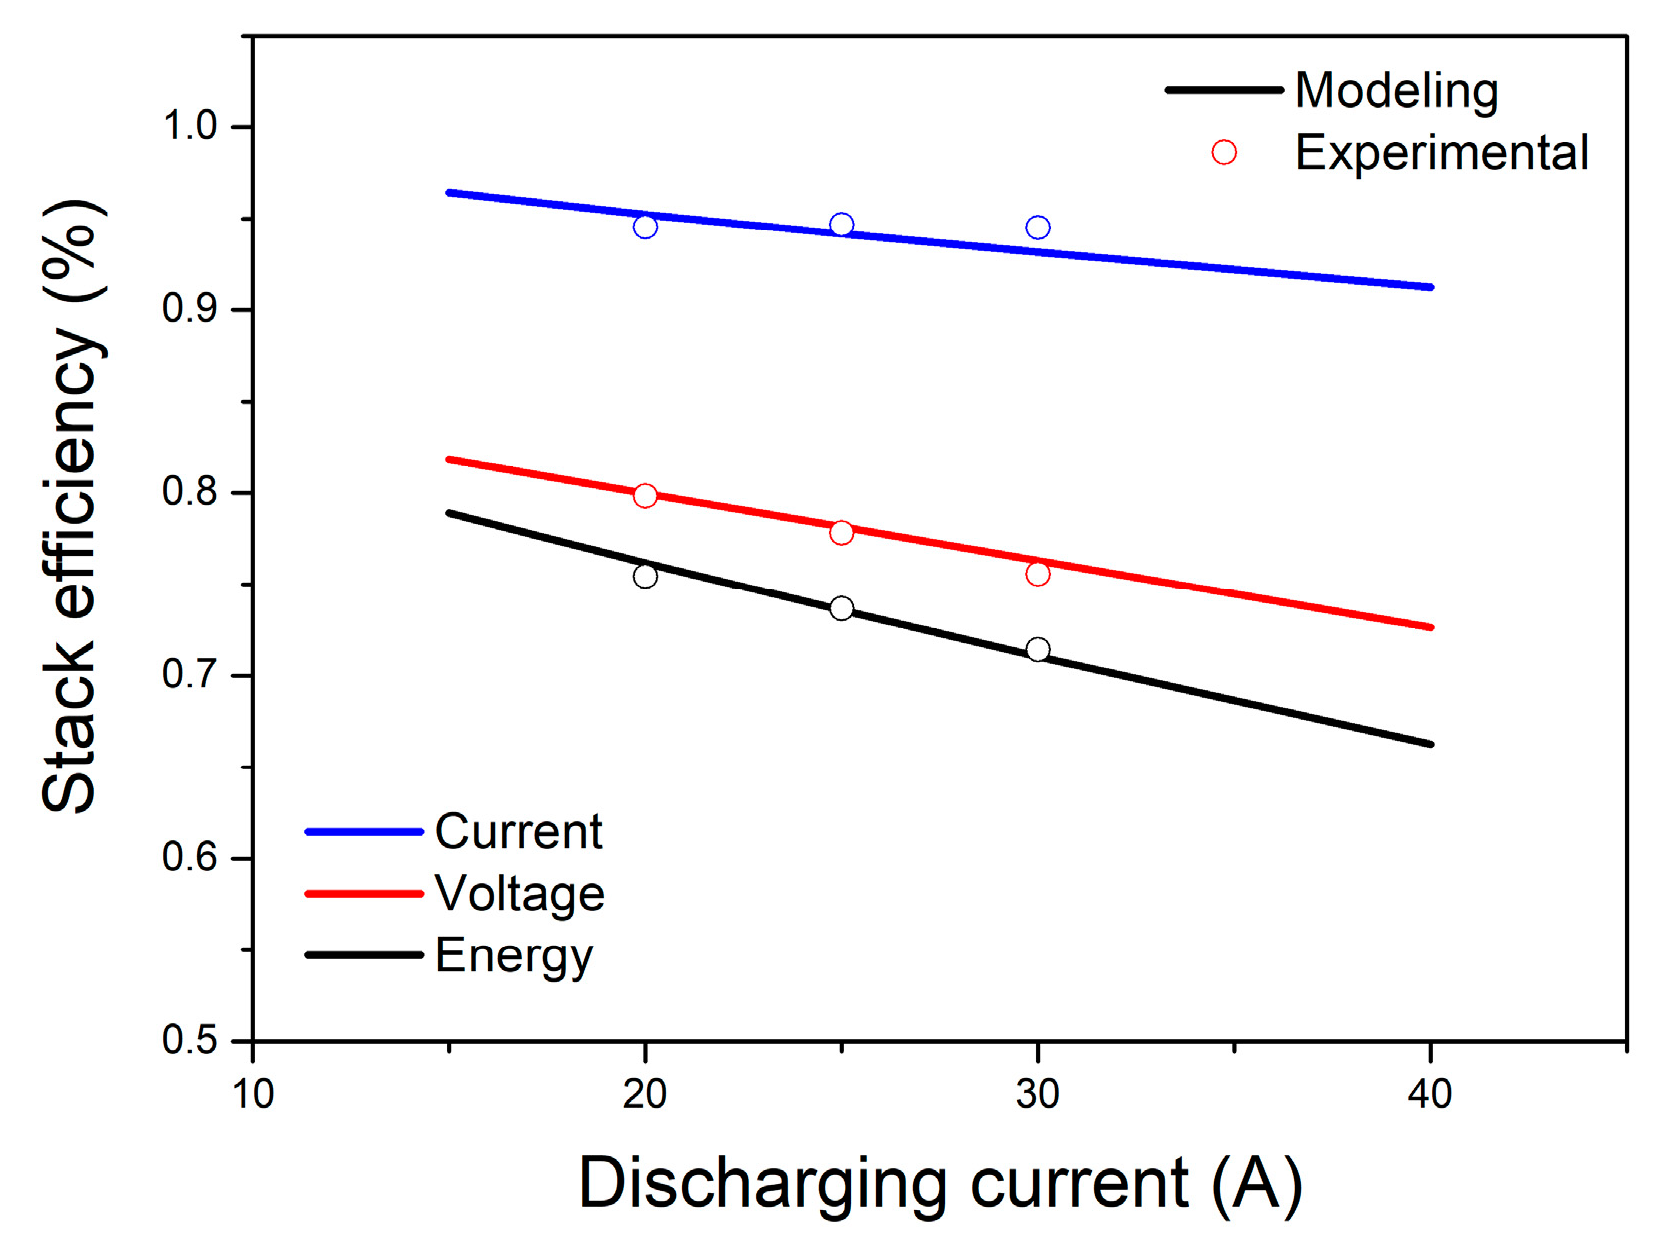
The current, voltage, and energy efficiencies are calculated based on the internal and shunt current distributions in a Zn/Br2 flow battery stack composed of 8 cells as described in White et al. [37]. The current, voltage, and energy efficiencies calculated from modeling are compared with the experimental data under various discharge conditions in Figure 10. As shown in Figure 10, the experimental measurements are in good agreement with the modeling results. Although the modeling approach is validated for one type of Zn/Br2 flow battery stack for a limited variation range of charge and discharge conditions, the modeling methodology developed in this work can be easily extended to predict the performances of the Zn/Br2 flow battery stacks with any arbitrary number of cells. The modeling results may be used to design large-scale cells and to select the operating conditions for optimum performance.
5. Conclusions
A mathematical model is developed to predict the performance of a Zn/Br2 flow battery. This work adopts a simple modeling approach which was successfully applied to analyze the performance of a lithium-ion battery for various applications [29,30,31,32]. The charge and discharge behaviors of a single cell is modeled by considering Ohm’s law and charge conservation on the electrodes based on the simplified polarization characteristics of the electrodes. The charge and discharge behaviors as well as the current, voltage, and energy efficiencies of a Zn/Br2 flow battery stack composed of 8 cells are predicted based on an equivalent circuit model composed of the single cell models and the resistances of the inlet and outlet streams of the positive and negative electrolytes. The model is validated by comparing the modeling results with the experimental measurements. Although the modeling approach is validated for one type of Zn/Br2 flow battery stack for a limited variation range of charge and discharge conditions, the modeling methodology presented in this study may have a good potential to contribute to improve the design of a large-scale cells and to select the operating conditions for the optimum performance of a Zn/Br2 flow battery.
Author Contributions
B.K., D.L., J.Y., and C.B.S. developed the methodology and performed the modeling. D.J.K., E.M.C., and T.H.K. provided the experimental data.
Funding
This work was supported by the Korea Institute of Energy Technology Evaluation and Planning (KETEP) grant funded by the Korea government (MOTIE) (Project 20152010103100). This work was partially supported by the Human Resources Program in Energy Technology (No. 20174010201410) of the Korea Institute of Energy Technology Evaluation and Planning (KETEP), which is granted financial resources from the Ministry of Trade, Industry & Energy, Korea.
Conflicts of Interest
The authors declare no conflict of interest.
References
- Castillo, A.; Gayme, D.F. Grid-scale energy storage applications in renewable energy integration: A survey. Energ. Convers. Manag. 2014, 87, 885–894. [Google Scholar] [CrossRef]
- Kuntz, M.T.; Dawe, J. Renewable. Rechargeable. Remarkable. Mech. Eng. 2005, 127, 35–39. [Google Scholar] [CrossRef]
- Lim, H.S.; Lackner, A.M.; Knechtli, R.C. Zinc-bromine secondary battery. J. Electrochem. Soc. 1977, 124, 1154–1157. [Google Scholar] [CrossRef]
- Lai, Q.; Zhang, H.; Li, X.; Zhang, L.; Cheng, Y. A novel single flow zinc-bromine battery with improved energy density. J. Power Sources 2013, 235, 1–4. [Google Scholar] [CrossRef]
- Khor, A.; Leung, P.; Mohamed, M.R.; Flox, C.; Xu, Q.; An, L.; Wills, R.G.A.; Morante, J.R.; Shah, A.A. Review of zinc-based hybrid flow batteries: From fundamentals to applications. Mater. Today Energy 2018, 8, 80–108. [Google Scholar] [CrossRef]
- Rose, D.M.; Ferreira, S.R. Initial Test Results from the RedFlow 5 kW, 10 kWh Zinc-Bromide Module, Phase 1; Report 2012-1352; Sandia National Laboratories: Albuquerque, NM, USA, 2012.
- Vionx Energy. Available online: https://www.vionxenergy.com (accessed on 8 March 2019).
- Redflow. Available online: https://redflow.com (accessed on 8 March 2019).
- Berlouis, L.; Bryans, D.; Zafar, J.; Tuohy, P.; Kang, T.H.; Kim, D.S.; Kim, D.S.; Shaw, M.; Atkinson, P.; Peacock, A. Testing of a Prototype 25 kW/50 kWh Zn-Br2 Battery at the Power Networks Demonstration Centre and Integrated to a Community Wind Turbine. In Proceedings of the International Flow Battery Forum (IFBF), Lausanne, Switzerland, July 2018. [Google Scholar]
- Wang, C.; Li, X.; Xi, X.; Zhou, W.; Lai, Q.; Zhang, H. Bimodal highly ordered mesostructure carbon with high activity for Br2/Br− redox couple in bromine based batteries. Nano Energy 2016, 21, 217–227. [Google Scholar] [CrossRef]
- Yang, H.S.; Park, J.H.; Ra, H.W.; Jin, C.S.; Yang, J.H. Critical rate of electrolyte circulation for preventing zinc dendrite formation in a zinc-bromine redox flow battery. J. Power Source 2016, 325, 446–452. [Google Scholar] [CrossRef]
- Banik, S.J.; Akolkar, R. Suppressing dendrite growth during zinc electrodeposition by PEG-200 additive. J. Electrochem. Soc. 2013, 160, D519–D523. [Google Scholar] [CrossRef]
- Xu, Q.; Zhao, T.S. Fundamental models for flow batteries. Prog. Energ. Combust. 2015, 49, 40–58. [Google Scholar] [CrossRef]
- Arenas, L.F.; Ponce de Leon, C.; Walsh, F.C. Engineering aspects of the design, construction and performance of modular redox flow batteries for energy storage. J. Energy Storage 2017, 11, 119–153. [Google Scholar] [CrossRef] [Green Version]
- Newman, J.; Thomas-Alyea, K.E. Electrochemical Systems, 3rd ed.; John Wiley & Sons: Hoboken NJ, USA, 2004. [Google Scholar]
- Wei, Z.; Tseng, K.J.; Wai, N.; Lim, T.M.; Skyllas-Kazacos, M. Adaptive estimation of state of charge and capacity with online identified battery model for vanadium redox flow battery. J. Power Source 2016, 332, 389–398. [Google Scholar] [CrossRef]
- Wei, Z.; Lim, T.M.; Skyllas-Kazacos, M.; Wai, N.; Tseng, K.J. Online state of charge and model parameter co-estimation based on a novel multi-timescale estimator for vanadium redox flow battery. Appl. Energy 2016, 172, 169–179. [Google Scholar] [CrossRef]
- Wei, Z.; Zhao, J.; Xiong, R.; Dong, G.; Pou, J.; Tseng, K.J. Online estimation of power capacity with noise effect attenuation for lithium-ion battery. IEEE Trans. Ind. Electron. 2019, 66, 5724–5735. [Google Scholar] [CrossRef]
- Evans, T.I.; White, R.E. A review of mathematical modeling of the zinc/bromine flow cell and battery. J. Electrochem. Soc. 1987, 134, 2725–2733. [Google Scholar] [CrossRef]
- Lee, J.; Selman, J.R. Effects of separator and terminal on the current distribution in parallel-plate electrochemical flow reactors. J. Electrochem. Soc. 1982, 129, 1670–1678. [Google Scholar] [CrossRef]
- Lee, J.; Selman, J.R. Electrode corrosion in a compartmented flow cell by diffusion from the counterelectrode. J. Electrochem. Soc. 1983, 130, 1237–1242. [Google Scholar] [CrossRef]
- Van Zee, J.; White, R.E.; Grimes, P.; Bellows, R. A simple model of Exxon’s Zn/Br2 battery. In Electrochemical Cell Design; White, R.E., Ed.; Springer: Boston, MA, USA, 1984; pp. 293–309. [Google Scholar]
- Mader, M.J.; White, R.E. A mathematical model of a Zn/Br2 cell on charge. J. Electrochem. Soc. 1986, 133, 1297–1307. [Google Scholar] [CrossRef]
- Evans, T.I.; White, R.E. A mathematical model of a zinc/bromine flow cell. J. Electrochem. Soc. 1987, 134, 866–874. [Google Scholar] [CrossRef]
- Simpson, G.D.; White, R.E. An algebraic model for a zinc/bromine flow cell. J. Electrochem. Soc. 1989, 136, 2137–2144. [Google Scholar] [CrossRef]
- Kalu, E.E.; White, R.E. Zn/Br2 cell: Effects of plated zinc and complexing organic phase. AIChE J. 1991, 37, 1164–1174. [Google Scholar] [CrossRef]
- Manla, E.; Nasiri, A.; Rentel, C.H.; Hughes, M. Modeling of zinc bromide energy storage for vehicular applications. IEEE Trans. Ind. Electron. 2010, 57, 624–632. [Google Scholar] [CrossRef]
- Knehr, K.W.; Biswas, S.; Steingart, D.A. Quantification of the voltage losses in the minimal architecture zinc-bromine battery using GITT and EIS. J. Electrochem. Soc. 2017, 164, A3101–A3108. [Google Scholar] [CrossRef]
- Kim, U.S.; Shin, C.B.; Kim, C.S. Effect of electrode configuration on the thermal behavior of a lithium-polymer battery. J. Power Sources 2008, 180, 909–916. [Google Scholar] [CrossRef]
- Kim, U.S.; Shin, C.B.; Kim, C.S. Modeling for the scale-up of a lithium-ion polymer battery. J. Power Sources 2009, 189, 841–846. [Google Scholar] [CrossRef]
- Kim, U.S.; Yi, J.; Shin, C.B.; Han, T.; Park, S. Modeling for the thermal behavior of a lithium-ion battery during charge. J. Power Sources 2011, 196, 5115–5121. [Google Scholar] [CrossRef]
- Kim, U.S.; Yi, J.; Shin, C.B.; Han, T.; Park, S. Modeling the dependence of the discharge behavior of a lithium-ion battery on the environmental temperature. J. Electrochem. Soc. 2011, 158, A611–A618. [Google Scholar]
- Tiedemann, W.; Newman, J. Current and potential distribution in lead-acid battery plates. In Battery Design and Optimization; Gross, S., Ed.; The Electrochemical Society, Inc.: Pennington, NJ, USA, 1979; pp. 39–49. [Google Scholar]
- Newman, J.; Tiedemann, W. Potential and current distribution in electrochemical cells—Interpretation of the half-cell voltage measurements as a function of reference-electrode location. J. Electrochem. Soc. 1993, 140, 1961–1968. [Google Scholar] [CrossRef]
- Gu, H. Mathematical analysis of a Zn/NiOOH cell. J. Electrochem. Soc. 1983, 130, 1459–1464. [Google Scholar] [CrossRef]
- Kaminski, E.A.; Savinell, R.F. A technique for calculating shunt leakage and cell currents in bipolar stacks having divided or undivided cells. J. Electrochem. Soc. 1983, 130, 1103–1107. [Google Scholar] [CrossRef]
- White, R.E.; Walton, C.W.; Burney, H.S.; Beaver, R.N. Predicting shunt currents in stacks of bipolar plate cells. J. Electrochem. Soc. 1986, 133, 485–492. [Google Scholar] [CrossRef]
Figure 1.
A schematic of a Zn/Br2 flow battery stack composed of 8 cells.

Figure 2.
An equivalent circuit model corresponding to the schematic of Figure 1.
Figure 2.
An equivalent circuit model corresponding to the schematic of Figure 1.
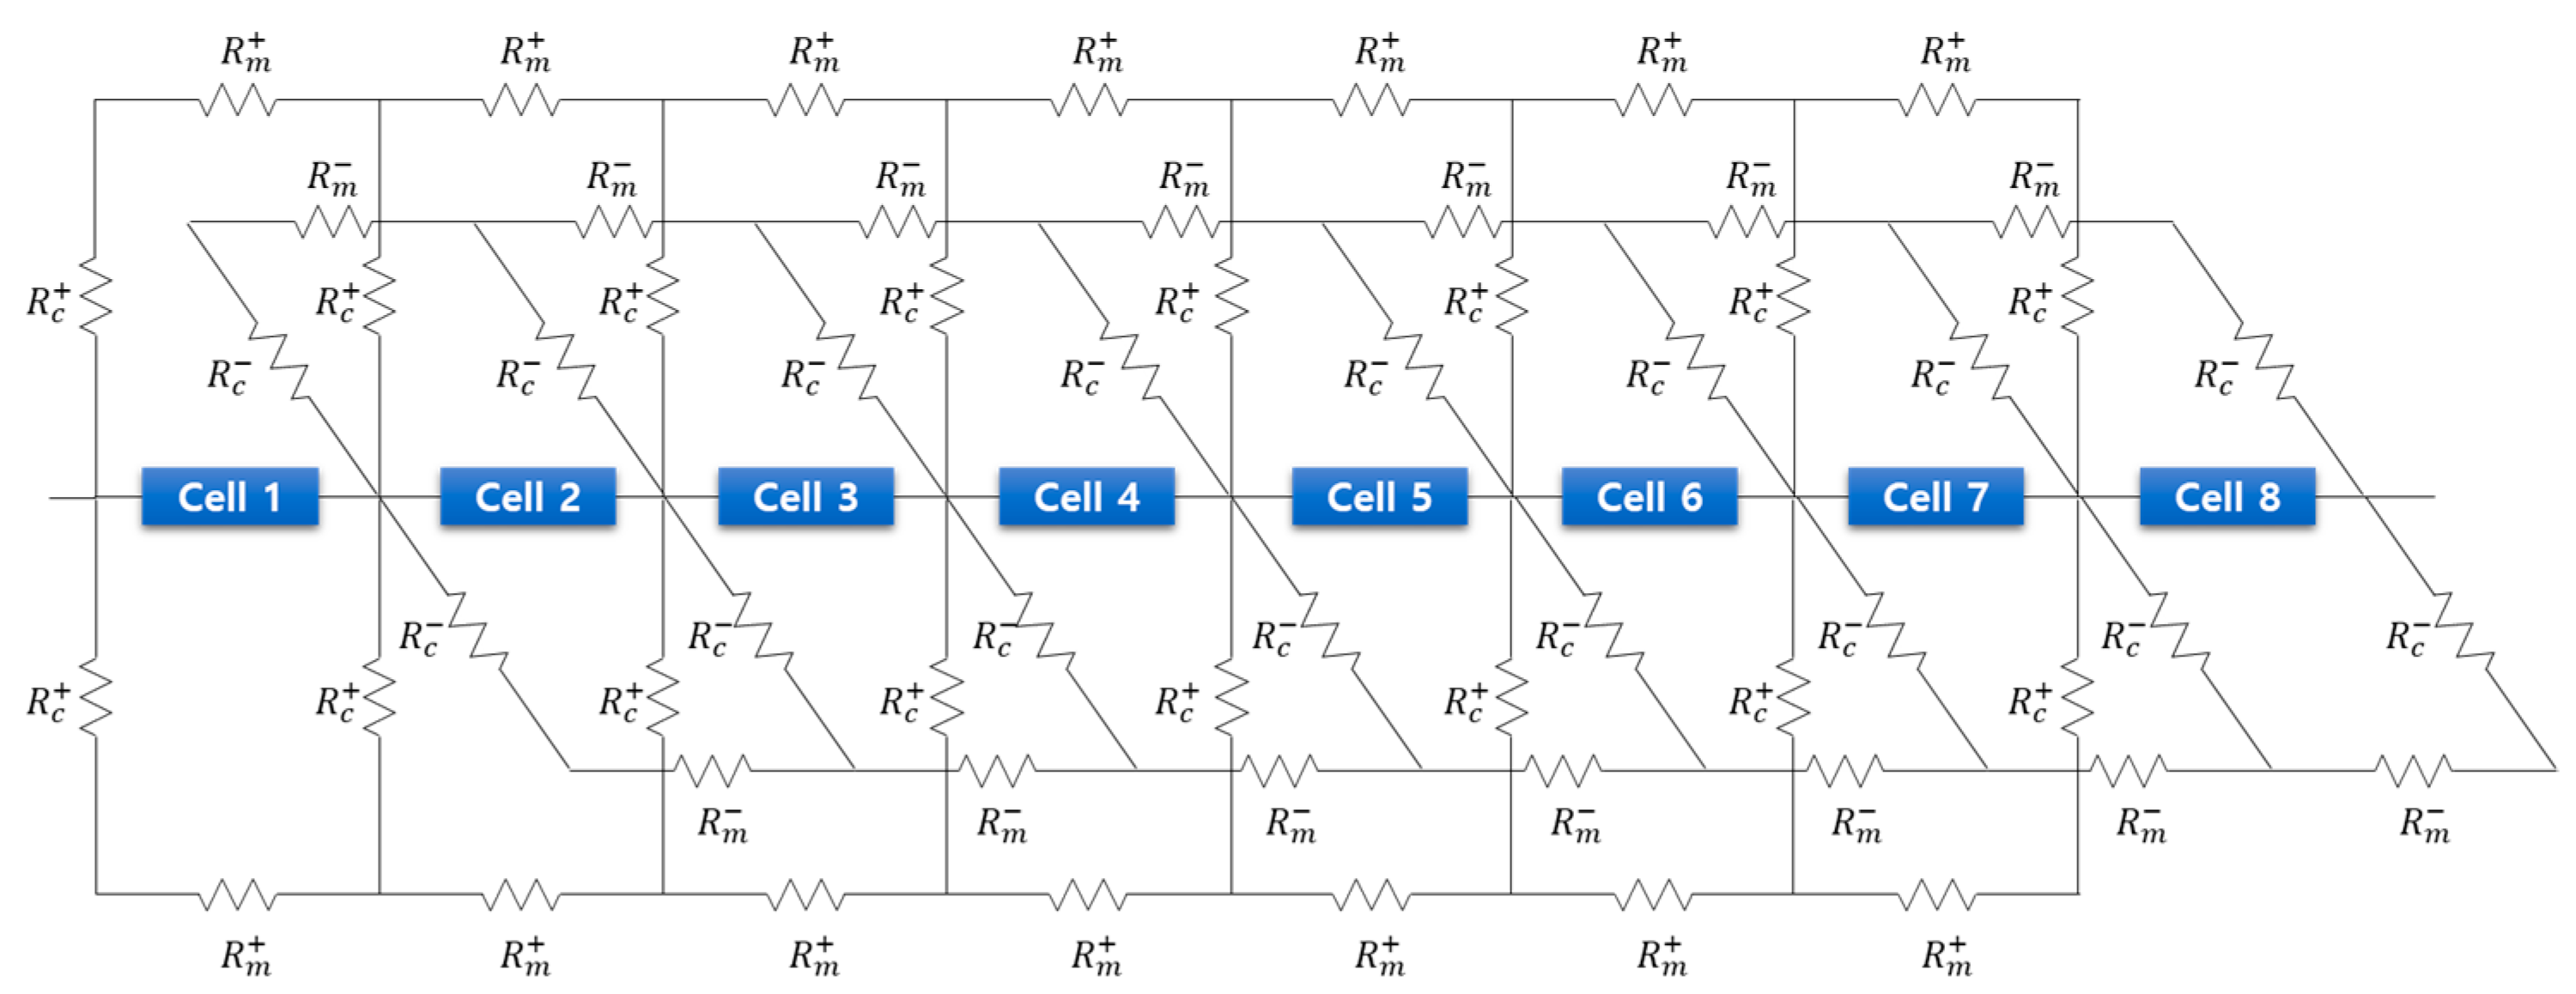
Figure 3.
Experimental discharge curves of a Zn/Br2 flow battery stack composed of 8 cells for different discharge (a) currents and (b) powers.
Figure 3.
Experimental discharge curves of a Zn/Br2 flow battery stack composed of 8 cells for different discharge (a) currents and (b) powers.

Figure 4.
Cell voltage as a function of applied current density during discharge.

Figure 5.
Comparison of the modeling charge and discharge behaviors of a Zn/Br2 flow battery stack composed of 8 cells with the experimental data.
Figure 5.
Comparison of the modeling charge and discharge behaviors of a Zn/Br2 flow battery stack composed of 8 cells with the experimental data.

Figure 6.
Variations of the internal currents as a function of time during (a) charging and (b) discharging with the constant current of 20 A.
Figure 6.
Variations of the internal currents as a function of time during (a) charging and (b) discharging with the constant current of 20 A.
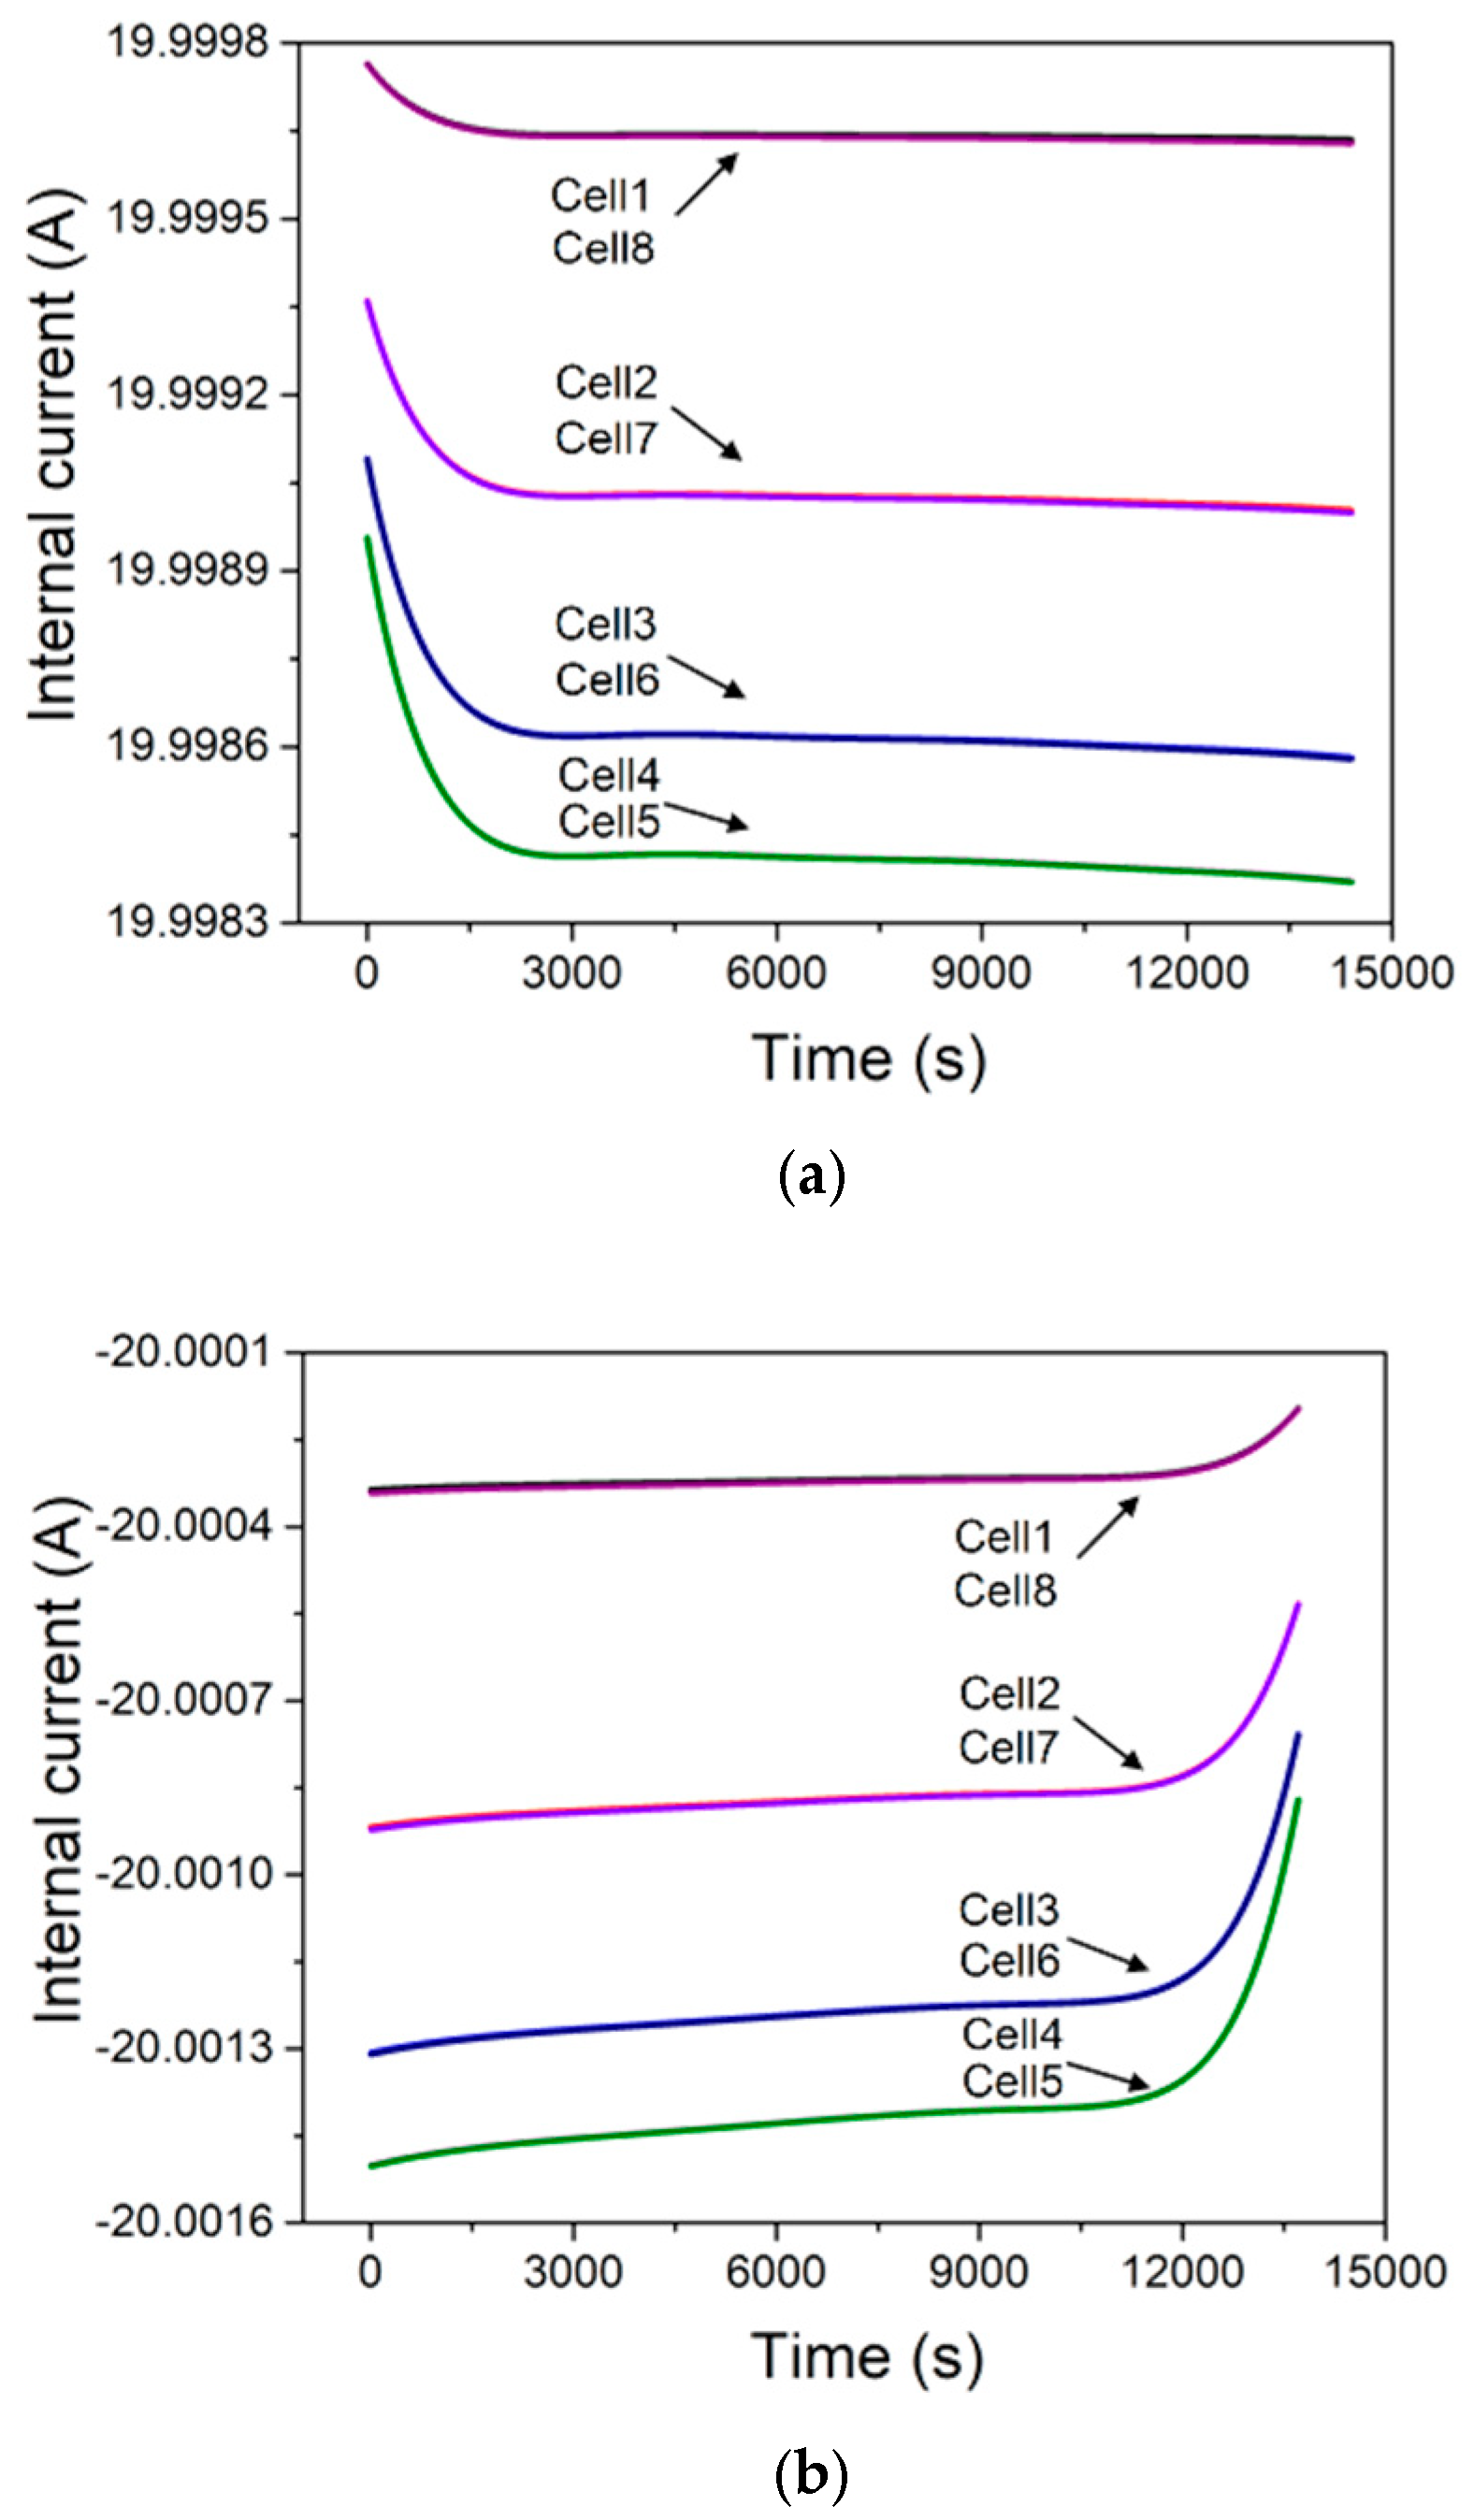
Figure 7.
Distributions of internal currents at 50% state of charge (SOC) during charging and discharging with the constant current of 20 A.
Figure 7.
Distributions of internal currents at 50% state of charge (SOC) during charging and discharging with the constant current of 20 A.

Figure 8.
Variations of the shunt currents in channels as a function of time during charging and discharging with the constant current of 20 A for the (a) positive and (b) negative electrolytes.
Figure 8.
Variations of the shunt currents in channels as a function of time during charging and discharging with the constant current of 20 A for the (a) positive and (b) negative electrolytes.

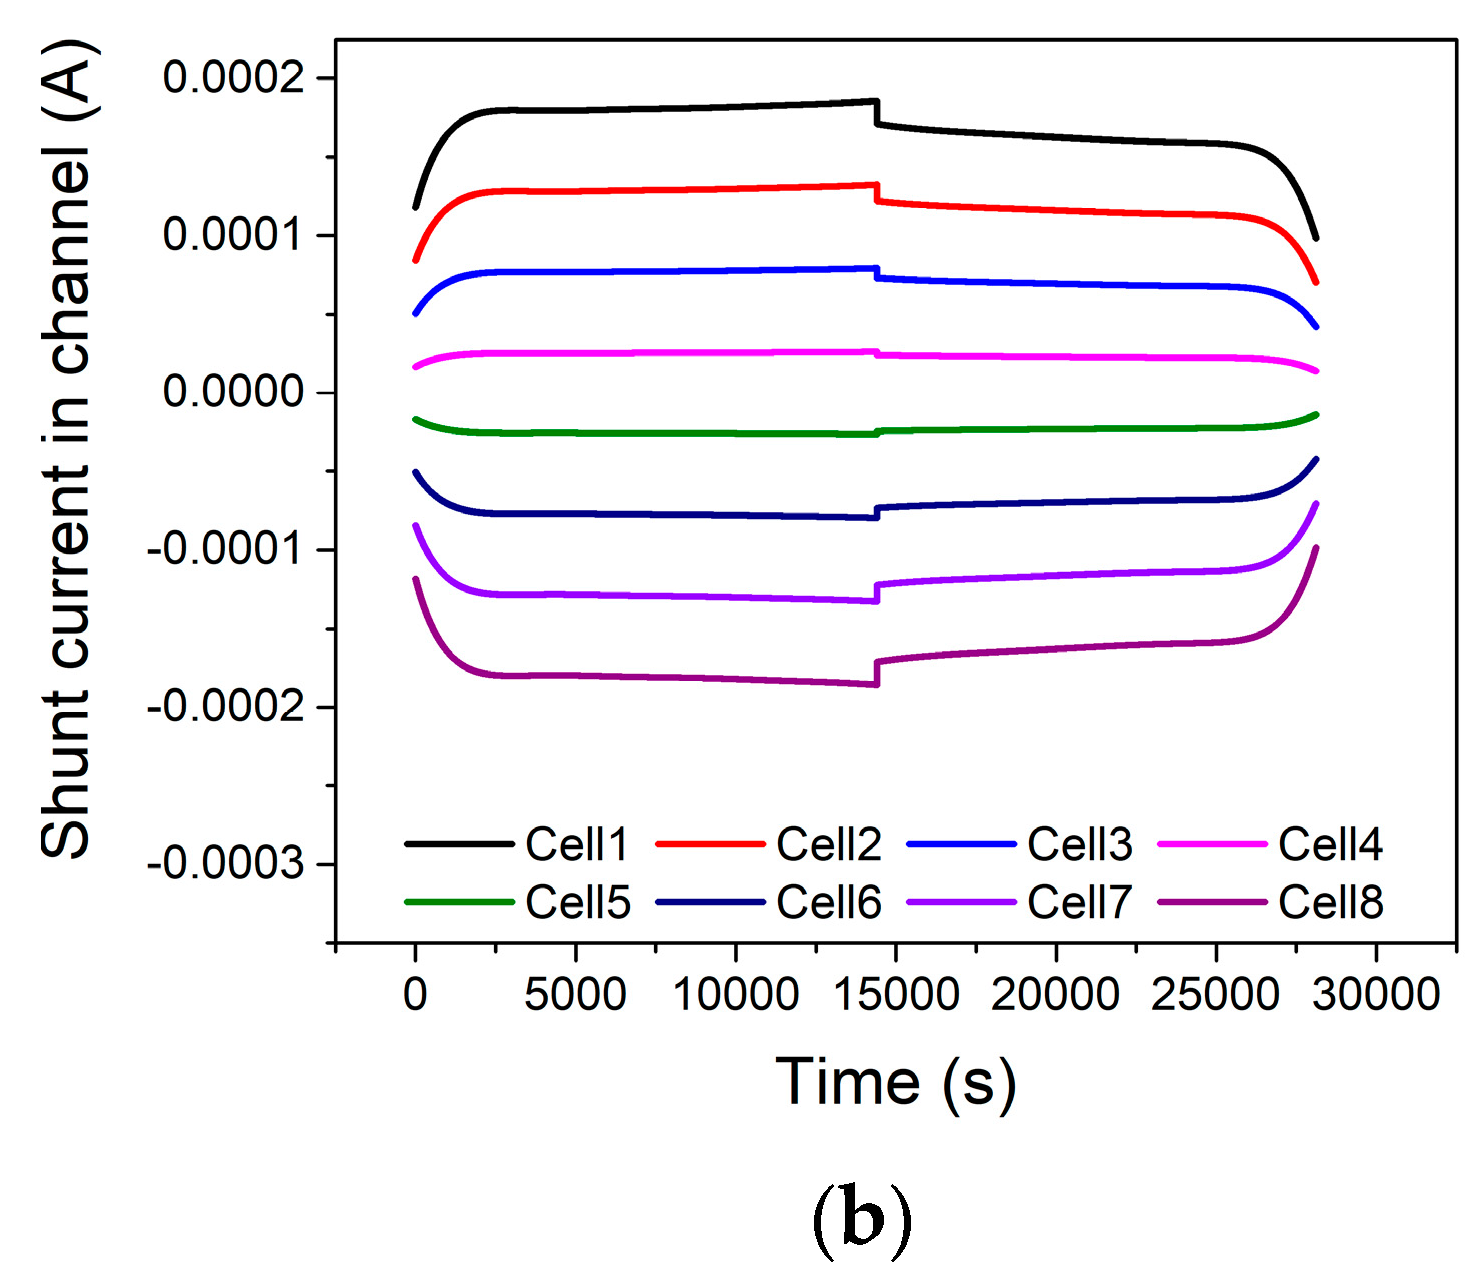
Figure 9.
Variations of the shunt currents in manifolds as a function of time during charging and discharging with the constant current of 20 A for the (a) positive and (b) negative electrolytes.
Figure 9.
Variations of the shunt currents in manifolds as a function of time during charging and discharging with the constant current of 20 A for the (a) positive and (b) negative electrolytes.

Figure 10.
Current, voltage, and energy efficiencies under various discharge conditions.


Table 1.
Fitting parameters used to calculate the potential distributions on the electrodes.
| Parameter | Value |
|---|---|
| a0 (V) | 0.75 |
| a1 (V) | 15.45 |
| a2 (V) | −107.49 |
| a3 (V) | 417.26 |
| a4 (V) | −1003.76 |
| a5 (V) | 1566.64 |
| a6 (V) | −1597.93 |
| a7 (V) | 1032.84 |
| a8 (V) | −385.50 |
| a9 (V) | 63.53 |
| b0 (Sm−2) | 47.46 |
| b1 (Sm−2) | −343.44 |
| b2 (Sm−2) | 11091.86 |
| b3 (Sm−2) | −56547.87 |
| b4 (Sm−2) | 131795.34 |
| b5 (Sm−2) | −158962.42 |
| b6 (Sm−2) | 96327.06 |
| b7 (Sm−2) | −23197.91 |
© 2019 by the authors. Licensee MDPI, Basel, Switzerland. This article is an open access article distributed under the terms and conditions of the Creative Commons Attribution (CC BY) license (http://creativecommons.org/licenses/by/4.0/).
Share and Cite
MDPI and ACS Style
Koo, B.; Lee, D.; Yi, J.; Shin, C.B.; Kim, D.J.; Choi, E.M.; Kang, T.H. Modeling the Performance of a Zinc/Bromine Flow Battery. Energies 2019, 12, 1159. https://doi.org/10.3390/en12061159
AMA Style
Koo B, Lee D, Yi J, Shin CB, Kim DJ, Choi EM, Kang TH. Modeling the Performance of a Zinc/Bromine Flow Battery. Energies. 2019; 12(6):1159. https://doi.org/10.3390/en12061159
Chicago/Turabian StyleKoo, Boram, Dongcheul Lee, Jaeshin Yi, Chee Burm Shin, Dong Joo Kim, Eun Mi Choi, and Tae Hyuk Kang. 2019. "Modeling the Performance of a Zinc/Bromine Flow Battery" Energies 12, no. 6: 1159. https://doi.org/10.3390/en12061159
Note that from the first issue of 2016, this journal uses article numbers instead of page numbers. See further details here.