A Fault Line Selection Method for DC Distribution Network Using Multiple Observers


Department of Electrical Engineering, Shanghai Jiao Tong University, Shanghai 200240, China
*
Author to whom correspondence should be addressed.
Energies 2019, 12(7), 1245; https://doi.org/10.3390/en12071245
Submission received: 22 February 2019
/
Revised: 19 March 2019
/
Accepted: 25 March 2019
/
Published: 1 April 2019
(This article belongs to the Special Issue Distribution System Optimization)
Abstract
:This paper proposes a method of fault line selection for a DC distribution network. Firstly, the 1-mode current is calculated using the measured currents of the positive and the negative line. Then, it is time reversed and further decomposed by wavelet technology. Secondly, the lossless mirror line network is established according to the parameters and the topology of the DC distribution network. Thirdly, it is presumed that several virtual current sources are employed at the locations where the corresponding observers are, and the values of these current sources are equal to the processed 1-mode currents. Fourthly, a fault is placed at every point of the lossless mirror line network the RMS value of every assumed fault current is calculated. During this process, the phase coefficient of every lossless mirror line is set to vary along with the length of the line obeying Gaussian distribution. Finally, the line with the peak value of the RMS values of the currents is selected as the fault line. The result of fault line selection is updated using the fewest observers that are set in advance according to the initial result. A DC distribution network is simulated in PSCAD/EMDTC to verify the correctness of the proposed method.
1. Introduction
Nowadays, clean and sustainable sources of energy are in great demand. However, the integration of these resources into the AC grid faces many technological challenges. For example, the expensive converters that connect the grid with distributed generations may cause many harmonics [1]. The DC distribution network solves these problems well. It also improves energy efficiency and promotes the application of clean energy. In addition, the DC distributions of ring and mesh structures show high reliability. However, these distributions need complex fault protection and recognition schemes [2,3,4].
Fault line selection is a significant and complicated problem for the traditional AC distribution network, as well as for the DC distribution network. In AC distribution network with simple topologies, the transients-calculation-based methods are implemented for fault line selection, which utilizes the relationship between the measured transients and fault location. However, the actual distribution networks are of complicated structures and the approaches for fault line selection are mainly based on automation equipment such as feeder terminal unit (FTU), power management unit (PMU) and so on. With these devices, some effective algorithms are proposed for selecting the fault line [5,6,7]. However, in practice, it is impossible to install so many devices for a distribution network that contains many branches.
For a DC distribution network, the converters and distributed generations contain many automation devices, as well as the observers that record the currents and voltages [8,9]. As is shown in Figure 1, if a line fault occurs, the DC circuit breakers at the observers will operate quickly and there may exist a long-time black out for the system. As the nine observers are implemented at the DC side of the converters and there are no measurements employed at the branch nodes of the lines, the selection of fault lines can be based on the fault location method instead of the detection and cooperation of automation equipment.
The fault line selection method is mainly to solve two problems in this paper. First, it is necessary to find a proper component of DC fault transients for further calculation. Unlike the AC fault transients, whose primary energy is provided by the fundamental component, the DC fault transients mainly focus on DC components because they are distorted step signals generated from the fault point. Second, it is very important to distinguish the fault line from its neighboring healthy lines especially when fault occurs near the branch nodes where no observer is installed [10,11,12].
The traditional two fault location methods, namely the travelling-wave-based method and the transients-calculation-based method, cannot solve these two problems well. For the travelling-wave-based method, the precision of fault line selection depends on high sampling rates because the lines are extremely short in DC distribution network, which increases the investment of the system construction [13,14,15]. The transients-calculation-based method makes good use of the physical properties of the fault point. Specifically, the voltage of the fault point is the lowest and the currents of it are in phase with voltages [16,17,18]. However, the physical properties of the fault points near branch nodes are extremely similar, thus it is hard to extract a stable and inherent component at a specific frequency from distorted step signal for the purpose of calculation.
In the research of lightning fault location, the time reversal theory is applied well [19,20]. The lightning fault location is where the maximal electromagnetic energy is in the mirror space, and the fault point is calculated through at least three observers. In essence, the transmission of fault current equals to the spread of electromagnetic fields. Therefore, the fault is located in the mirror line and calculated through two or more observers. Based on the time reversal theory, the feasibility of fault location in the field of ultrahigh frequency is proved in reference [21,22,23]. This method is applied to the fault location of AC power networks by only using a single observer. In reference [24], the fault location of multi-terminal high-voltage direct current systems (VSC-MTDC) is calculated by employing the signals of high-frequency band from two or more observers. The former method needs high sampling rates, which the DC distribution network cannot provide. The latter method lacks the essential theory and the filtering algorithm based on frequency domain is not suitable for distorted step signals.
In this paper, the fault is ‘located’ in the established lossless mirror line network using the variable phase coefficient (VPC) and the feasibility of the theory is identified by using the transmission equation of the line. By employing the technology of wavelet decomposition, the fault line in the DC distribution network is selected by using band signals with multiple observers. Besides, the blind area near the branch node is effectively cut down.
2. Basic Theory for Fault Line Selection
2.1. Time Reversal and Complex Conjugate
The definition of Fourier transform is
The complex conjugate for (1) is , which is shown in (2).
Through replacing with , formula (2) can be translated into (3):
Because is a real function, . The latter part of (3) equals to , which is the Fourier transformation of . Therefore, the time reversal for a real signal means the conjugate of signal in the frequency domain.
2.2. Locate Fault Using Two Internal Observers
In this section, the feasibility of internal fault location that uses time reversal theory is proved in a single line. As shown in Figure 2a, the total length of the line is L, and the distributed resistance, conductivity, inductance and capacitance are indicated as R/G/L/C, respectively. Suppose a fault occurs at l1. An additional voltage source (uF) is generated and the measured voltages and currents at the ends of the line are recorded as uM/iM/uN/iN. The positive directions of these measurements are displayed in Figure 2a.
The process of mathematical proof for time-revered-based method is divided into five steps.
Step 1: calculate the theoretical values of the measurements in frequency domain in Figure 2a. Based on long-line equation, the theoretical values of measured voltage and current at end M can be calculated as follows:
where:
and are the forward voltage and forward current, and are the backward voltage and backward current, and are wave impedance and propagation coefficient of line, and are the voltage and current of a specific frequency at L1.
Step 2: establish the lossless mirror line. In reference [20], researchers established three mirror spaces in order to locate the lightning point: lossless mirror space, partial-loss mirror space and entire-loss mirror space. A lossless mirror line is constructed in this section as the work in reference [20]. As is shown in Figure 2b, the distributed resistance, conductivity, inductance and capacitance are 0/0/-L/-C for the lossless mirror line, respectively.
Step 3: establish the virtual current sources at the ends of the lossless mirror line. The source is derived from measurements (UM and IM), which is shown as follows:
Then, the source is time reversed and connected in parallel at the line end. Therefore, as is shown in Figure 2b, the source at end M is .
Step 4: suppose a fault occurs at the lossless mirror line and calculate the assumed fault current. In this step, the reflected current is ignored and the current is calculated by using (7).
where, .
In fact, the fault resistance of the assumed fault is set as , which equals to the wave impedance of the mirror line, hence the reflected current would not exist.
According to (7), the current is also obtained in a similar way, as is shown in (8).
Step 5: prove that the RMSs of all assumed fault currents reach the peak value at the actual fault point. The RMS value of fault current is:
Let the parts of (9) to be as follows:
Formula (9) can be translated into (10):
Because the modulus for sum of the vectors gets its maximum as the vectors are in the same direction, equation (10) achieves its peak for (n = 0, ±1, ±2 …), and the fault location is obtained as:
Formula (11) is simplified under three conditions, which are introduced as follows:
- Because the lossless mirror line and its parameters are created subjectively, the phase coefficient () can be modified into from (7) to (11). The fault location result is simplified as .
- The initial forward current are extracted for locating faults, so , that causes in (11). Therefore, the fault location result is further simplified as .In fact, is not equal to due to the reflections of currents, so multiple local extremum may exist in formula (10). However, these local extrema are a superposition of the reflected currents, whose amplitude are smaller than the initial forward currents. Therefore, the global extremum exists where .
- The practical filtered current is a band signal whose frequency band is .Suppose achieves its peak at , for any , it can get the peak value at . Therefore, we can obtain (12):where, .
Since n is an integer, must be finite discontinuous functions in (12). However, is continuous function in fact. By reduction, there is only a fault location result, which is .
2.3. Locate Fault Using Two External Observers
When we locate the fault in a DC distribution network with multiple observers, many observers are not at the ends of the faulted line. As is shown in Figure 3, the measured currents (IM and IN) in these two situations are not appropriate for fault location at l3 according to the justification in the previous subsection. In this subsection, the fault location result is calculated using two external observers. The proof steps are the same as the last justification. The proof steps for the two situations in Figure 3 are separately introduced.
For the line fault in Figure 3a, the theoretical values of measured forward currents at end M and end N is first calculated as follows:
Then, the lossless mirror line is established in the same way as Figure 2b. Meanwhile, the sources in Figure 2b are replaced with the conjugate currents in (13).
The RMS value of the assumed fault current is further calculated in (14).
Formula (14) can also get the peak value only for according to the process of selecting the peak value of (9).
For the line fault in Figure 3b, the theoretical values of measured forward currents at end M and end N is first calculated as follows:
Then the lossless mirror line and sources at the ends of the line are also established as is shown in Figure 2b. The RMS value of assumed fault current is calculated as follows:
Formula (16) gets the only peak value for .
In conclusion, if a fault is located using two external observers, the two observers would recognize the fault as an internal fault between the external observers. The fault location result is at the branch node.
2.4. Locate Fault Using Multiple Observers
The DC distribution network contains many branch nodes. These branch nodes can be divided into two types: (1) the maximal branch node, whose number of connecting branches is the maximum of all; (2) the other branch node, whose number of connecting branches is less than that of the maximal branch node.
As is shown in Figure 4, the black lines are the single electrical lines, the red squares are the observers, and the green circle represents a line fault. According to the previous justification, the theoretical values of forward currents at all observers are calculated first and they are indicated as . Second, the conjugate currents are calculated as . Third, the lossless mirror line network based on the circuit diagram is established in Figure 4. Finally, the assumed fault current in the lossless mirror line network is calculated, which is:
where, represents the distance between Oi and the assumed fault location (), which is also shown as the dotted line in Figure 4a.
An inequality can be derived from formula (17):
The first part behind the inequality sign in (18) is and it locates the fault through O1 and On (n > 1), and its peak value appears at f1 according to the previous analysis of (9).
The second part behind the inequality sign in (18) is and it locates the fault through the other observers that is exclusive of O1, and its peak values appear at branch node as well as l1 according to the previous analysis of (13) and (15).
Given the above analysis, the first and second parts achieve their peaks at the same point (f1). Therefore, the inequality is changed into equality as , and in (12) achieves its peak value at f1.
In conclusion, only one result is required, when the fault can be located using multiple observers.
2.5. Fault Line Selection with Variable Phase Coefficient
The fault line can be selected through the peak value of RMS values for all assumed fault currents. However, as is shown in Figure 1, if a fault occurs near the branch node and the measured signals of the observers are similar, blind area exists for fault line selection. In order to conquer this problem, the variable phase coefficient is employed for lossless mirror line network.
The phase coefficient for the lossless mirror line in the previous justification is invariable. In this process, suppose the inductance and capacitance are different of every point in the lossless mirror line in Figure 2b. This causes that the phase coefficient to be variable and it changes with the length of line. The RMS value of assumed fault current is rewritten as follows:
where, . As identified in the subsection, the fault location can be obtained when
Let , formula (20) is simplified as . A function of is defined as is shown in Figure 5, and the area of shaded part S1 equals to that of S2. When the range of fault location is and , the calculated fault location appears between and ; and when the range of fault location is , the calculated fault location is also within this range. Through this operation, if a fault occurs near the ends of the line, the calculated fault location could be obtained at the middle range of the line, which enhances the reliability of fault line selection.
3. Fault Line Selection Algorithm
3.1. Basic Introduction for Wavelet Decompsition
The additional source after a DC line fault is a voltage source of step signal, hence the transients at the observers are distorted step signals. The filtering technology of a frequency domain causes the Gibbs effect when decomposing the step signals, but for wavelet composition, it can filter well due to the nature of time-frequency domain. The expansion of wavelet decomposition is as follows:
where, is the wavelet function, and is the scaling function. Their coefficients are calculated using (22):
The Fourier transform is a pure frequency-domain-based method and thus not applicable in the time domain. However, the traveling wave is a function not only of time but also of frequency. That is to say, the Fourier transform-based method cannot describe the modulus of the traveling wave and the time when the wave arrives at the measuring point. In other words, an analysis method that deals with both frequency and time is required to solve this problem [25,26]. As is shown in Figure 6a, it gives the diagram of one-dimensional wavelet decomposition; ‘cA’ is the component after an equivalent low-pass filtering for signal and ‘cD’ is the component after a high-pass filtering. fs represents the sampling frequency, and frequency band of each component is displayed in the figure. The measured 1-mode current at observer 1 is decomposed with the Haar wavelet function, the first, second and third forward current can be shown clearly in the red dotted box as shown in Figure 6b.
Therefore, the initial forward current can be detected effectively with wavelet decomposition, which can be used for the calculation in Section 2.2.
3.2. Time-Domain Fault Line Selection Algorithm
The practical method for fault line selection is introduced in this section. The steps of the algorithm are represented in detail.
Step 1: record the basic information of the DC network, including the topology of the network and the parameters of each line.
Step 2: the recorder at each observer stores the currents. The start time of the recorded transient currents can be any time in the normal operation of the system and the stop time of the recorded currents is the time when the DC breaker starts to open, which means that the proposed method should not know the precise time of fault occurrence.
Step 3: calculate the 1-mode observed currents () by using (23).
where, Oi is the ith observer. and are the recorded positive-pole and negative-pole currents at Oi.
Then the 1-mode currents are decomposed based on the ‘dmey’ wavelet function. The level for wavelet can be four, and the component at level 1 is (‘cD1’ in Figure 6) selected for further calculation. The decomposed current is indicated as .
Step 4: the decomposed 1-mode currents at all observers are time reversed and then they are used for calculating the RMS of assumed current in the mirror line. The formula in time domain is:
where, T is the recording period, represents the time delay from Oi to the assumed fault location.
There are many functions for the variable phase coefficient to choose. In this paper, we use Gaussian distribution, which is defined as follows:
where, the parameter ‘a’ is calculated through . l is the length for each line, so the parameter ‘a’ is different.
The peak value of formula (24) is obtained, thus the faulted line is selected.
Step 5: the more observed currents are being taken into computation, the more effects caused by injection currents from AC side are, so that the peak value selected in previous step is not precise. Therefore, it is necessary to reduce the number of calculated observed currents.
Step 6: the lines connected to the fault line are known based on the topology of the network, as is shown in Figure 7. The authors can choose the observers that are inter-connected with the fault line and its neighboring lines for further calculation based on (24). Finally, the result of selection of the fault line is updated with fewer observers.
4. Simulated Case Study
4.1. Simulation Model
A simulation model is established in PSCAD/EMDTC to test the capability of the proposed method and the calculation procedure is implemented in MATLAB. As is shown in Figure 1, the DC distribution network has 13 cables and 5 branch nodes. The frequency-dependent cable model is used the parameters are listed in Appendix A, and the length of each cable is 8 km. Two terminals of the network are connected to the AC system through two-level voltage source converter station. The rated voltages for the AC and DC system are 110 kV and 10 kV, respectively. Besides, the distributed sources are connected to the DC lines by their own converters. Different converters adopt different control strategies and carrier frequencies; thus the harmonic is abundant and complicated.
The fault occurrence time is set at 2.6 s in this simulation and the observers record the currents from 2.597 s to 2.603 s with the sampling frequency of 100 kHz.
Suppose a positive-line-to-ground fault (PLG) occurs at line 5 7.8 km from branch node (T2) with fault resistance of 0 Ω, Figure 8a shows the RMSs of all assumed fault currents through using all measured currents. The first RMS value of assumed fault current of line 1 corresponds to the origin of Figure 8. Both of the RMS values of the assumed fault currents of line 2 and line 3 correspond to horizontal axis of 8 km in Figure 8. By this analogy, the RMS values for all assumed fault currents of the lossless mirror line network are displayed in Figure 8. The spacing of the horizontal axis is 0.1 km and the peak value appears at line 5.
Table 1 gives the fewest observers that are needed for fault line selection. For example, the lines connected to line 5 are line 3, line 4, line 6, line 7 and line 8. In order to ensure the selectivity, the observers 2–6 are selected for selecting fault line.
Figure 8b gives the fault line selection results with 5 observers. Because line 1, line 10, line 11, line 12 and line 13 are outside the fault location area of the observers, the RMS values of these lines are invariable, which responds to the analysis in in Section 2.4.
Because fewer observers bring fewer harmonics, the jitter of wave (specifically the jitter near the peak) in Figure 8b is smaller than that in Figure 8a, and the gradient at peak value is larger than that in Figure 8a. In addition, the peak value moves towards the middle of line 5 due to the contributions of variable phase coefficient.
4.2. Different Fault Types and Resistances
In this section, different fault types and fault resistances for different fault locations are simulated for comparison. The fault types are single-line-to-ground fault (SLG), line-to-line fault (LL) and line-to-line-to-ground fault (LLG). The maximal fault resistance is considered as 100 Ω in this paper.
As is shown in Figure 9, the results of fault line selection for a fault occurrence at the middle of line 8 are given, where the variable phase coefficient does not affect the fault location results. Consequently, the peak value appears at the middle of the line.
As is shown in Figure 9a,b, because the higher the fault resistance is, the lower the mutations of measured currents are, the peak value drops as the fault resistance increases. For a LL fault and LLG fault with the same fault resistance, the mutation of LL fault is larger than that of LLG fault so the peak value is higher in Figure 9c than that in Figure 9d. In addition, the shapes of waveforms in Figure 9 are similar. In terms of energy production, the fault occurrence at a specific location generates electromagnetic energy, whatever the fault types and resistances are, and the proposed method is to find the maximal energy point. Therefore, fault types and resistances do not affect the method.
Suppose an SLG fault with fault resistance of 0 Ω occurs at different points of each line and the faults are simulated at 2.5%, 50% and 97.5% of each line, the results of fault location are given in Table 2. The results of fault location are closer to the middle of the line due to the contributes of VPC. The fault line is selected accurately no matter where the fault location is. However, if a fault occurs at branch nodes, the fault location results have errors (as is shown in Table 2) since the results should be at the branch nodes. Therefore, the fault line repair should include the terminals of the line.
4.3. Different Wavelet Functions and Sampling Frequencies
Theoretically, the results in Table 2 could be the same in each column. The main errors of fault location are caused by filtering technology. The selection of wavelet functions and sampling frequencies affect the wavelet-based filtering technology. In this section, the results of fault location are simulated and compared in different cases.
The results of fault location based on four wavelet functions are compared by combining Table 2 and Table 3. The properties of these four wavelet functions are in Table A2 in Appendix B.
The results of fault line selections are accurately based on different wavelet functions and it enhances the applicability of this method. The mean variances of results of the fault locations are calculated and displayed in these tables. The results of fault locations occurring at the middle of different lines are the most stable, while the results have greater changes for the faults occurring near the branch nodes. The fault location results change the most for fault occurring at 2.5% of length of the line, because there are twelve 2.5%-faults occuring near the branch nodes, while there are only five 97.5%-faults occuring near the branch nodes.
The results of fault locations based on different frequencies are listed in Table 2 and Table 4 (100 kHz). The theoretical values of fault locations change from 2.5%, 50% and 97.5% to 8%, 50% and 92% by using VPC, therefore the results of fault locations are closer to the theoretical values with the increase of sampling frequencies. However, the mean variance of results is the lowest as the frequency is 125 kHz. Therefore, it is not necessary to utilize high sampling frequency to locate the fault line.
4.4. Comparison With Tavelling-Wave-Based Method
The travelling-wave-based method has been applied into the fault location in multi-terminal HVDC systems [11,13,14,15]. The fault location can be located by using at least two observers. Therefore, the fault location results can be calculated and obtained for n (n − 1)/2 (n is the number of the observers) times. Furthermore, the correct fault location and the fault line can be eventually analysed by using the different fault location results. In reference [10], the fault line protection strategy uses redundant criteria to select and isolate the fault line.
In this subsection, the fault location is calculated for 36 times by using any two of the nine observers in Figure 1 based on the travelling-wave-based method. Then, the correct fault line is selected due to the most frequent results of the 36 results of fault line selection.
The detailed fault line selection process is introduced as follows.
Firstly, the complex continuous wavelet transform are applied for analysing the nine 1-mode currents that are measured by the nine observers in Figure 1. The length of scales of the complex gaussian wavelets is 64. The modulus of wavelet coefficients at scale 32 of 1-mode currents are shown in Figure 10. The wavelet modulus maximum is marked on the line with red circles and its corresponding time is the arrival moment of initial travelling wave.
Secondly, the fault location is calculated by using (26), is the distance between calculated fault location and observer Oi, is the distance between observer Oi and Oj, is the velocity of travelling wave of the cable, and and are the detected arrival times for observers Oi and Oj, respectively.
Thirdly, the results of fault line selection are shown in Table 5. The results show that the fault location occurs at the line, including at the terminals of the line. The symbol ‘×’ represents the fault location result is out of the length of the line due to the wrong detection of the initial travelling wave. The detected initial travelling wave can be easily affected by the other reflections waves because there are many terminals in DC distribution network. As is shown in Table 5, a quarter of the results of calculations show that the fault line is L5, so L5 is regarded as the fault line.
Finally, the fault line is calculated by using the fewest obvers in Table 1. The results are shown in the yellow part in Table 5. Three fifths of the results of the calculation show that the fault line is still L5, so it is the final selection result.
Suppose an SLG fault with fault resistance of 0 Ω occurs at different points of each line and the faults are simulated at 2.5%, 50% and 97.5% of each line, the results of fault line selection by using travelling-wave-based method are given in Table 6. When the fault occurs near the terminals, the initial travelling wave will be affected severely by the reflections, so there are many errors of fault line selection at 97.5% of each line. This indicates that the proposed method has advantages over the travelling-wave-based method by comparing Table 2 and Table 6.
5. Conclusions
This paper proposes a fault line selection method for a DC distribution network. The theoretical justification indicates that the fault line can be selected accurately using the VPC with multiple observers. The case studies show that the fault types and fault resistances do not affect the results of the method. Moreover, different wavelet functions do not affect the accuracy of results of fault line selection, which enhances the applicability of the method. The sampling frequency of the proposed method is much lower, but the accuracy of the proposed method is much more than that of the travelling-wave-based method. In addition, the proper sampling frequency contributes to the stability of the results of fault line selection for the proposed method.
The future research work is as follows: the blind area near the branches needs to be decreased further; the sampling frequency of the method needs to be optimized for maximizing the stability of the method. Further, this method can be applied to many other complex distributions.
Author Contributions
Conceptualization, X.Z. (Xipeng Zhang); Data Curation, W.H.; Formal Analysis, X.Z. (Xipeng Zhang); Funding Acquisition, N.T.; Investigation, X.Z. (Xipeng Zhang); Methodology, X.Z. (Xipeng Zhang); Resources, N.T., C.F. and X.Z. (Xiaodong Zheng); Software, P.W.; Supervision, P.W.; Validation, C.F., X.Z. (Xiaodong Zheng) and W.H.; Writing—Original Draft, X.Z. (Xipeng Zhang); Writing—Review & Editing, X.Z. (Xipeng Zhang).
Funding
This research was funded by THE NATIONAL NATURAL SCIENCE FOUNDATION OF CHINA, grant number 51407115 and 51377104.
Conflicts of Interest
The authors declare no conflict of interest.
Appendix A
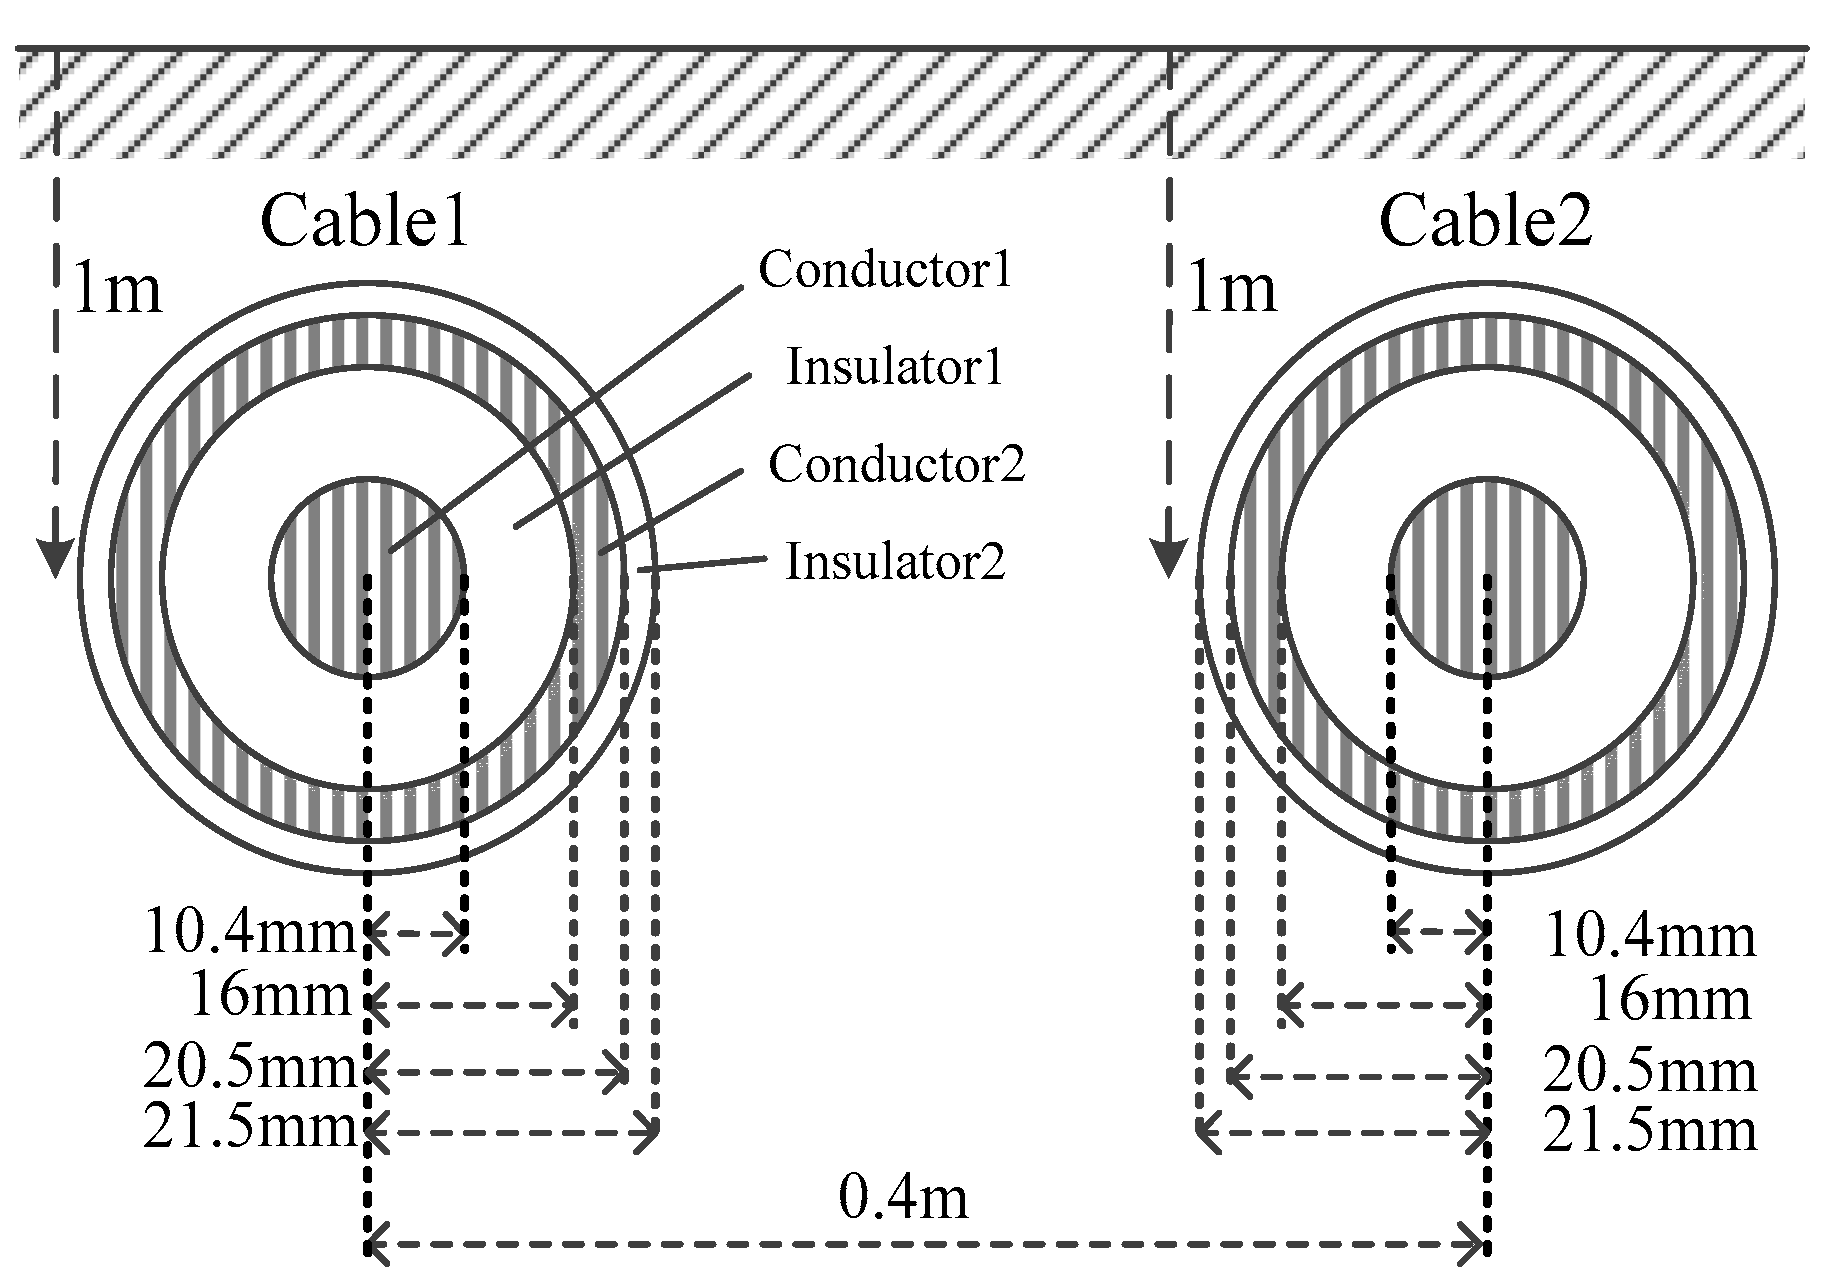
The structure of the cable is shown in Figure A1 and the electrical properties are shown in Table A1.
Figure A1.
Geometric parameters of dc cable.

Table A1.
Electrical properties for cable.
| Para. | Resistivity /(ohm × m) | Relative Permeability | Relative Permittivity | |
|---|---|---|---|---|
| Layout | ||||
| Conductor1 | 2.82 × 10⁻⁸ | 1.00 | ||
| Insulator1 | 1.00 | 4.10 | ||
| Conductor2 | 1.86 × 10⁻⁸ | 1.00 | ||
| Insulator2 | 1.00 | 2.30 | ||
| Ground | 100.00 | 1.00 | ||
Appendix B
Table A2.
Properties of different wavelet functions.
| Wavelet. | Db4 | Coif4 | Rbio2.8 | Dmey | |
|---|---|---|---|---|---|
| Property | |||||
| Orthogonal | yes | yes | no | yes | |
| Biorthogonal | yes | yes | yes | yes | |
| Symmetry | far from | near from | |||
| Compact support | yes | yes | yes | yes | |
| Orthogonal | yes | yes | no | ||
References
- Huang, W. An Impedance Protection Scheme for Feeders of Active Distribution Networks. IEEE Trans. Power Deliv. 2014, 29, 1591–1602. [Google Scholar] [CrossRef]
- Ji, Y. Overall control scheme for VSC-based medium-voltage DC power distribution networks. IET Gener. Transm. Distrib. 2018, 12, 1438–1445. [Google Scholar] [CrossRef]
- Shamsi, P.; Fahimi, B. Stability Assessment of a DC Distribution Network in a Hybrid Micro-Grid Application. IEEE Trans. Smart Grid 2014, 5, 2527–2534. [Google Scholar] [CrossRef]
- Beerten, J.; Cole, S.; Belmans, R. Modeling of Multi-Terminal VSC HVDC Systems with Distributed DC Voltage Control. IEEE Trans. Power Syst. 2014, 29, 34–42. [Google Scholar] [CrossRef]
- Zhang, S.; Lin, S.; He, Z.; Lee, W. Ground fault location in radial distribution networks involving distributed voltage measurement. IET Gener. Transm. Distrib. 2018, 12, 987–996. [Google Scholar] [CrossRef]
- Majidi, M.; Arabali, A.; Etezadi-Amoli, M. Fault Location in Distribution Networks by Compressive Sensing. IEEE Trans. Power Deliv. 2015, 30, 1761–1769. [Google Scholar] [CrossRef]
- Shafiullah, M.; Abido, M.A.; Al-Hamouz, Z. Wavelet-based extreme learning machine for distribution grid fault location. IET Gener. Transm. Distrib. 2017, 11, 4256–4263. [Google Scholar] [CrossRef]
- Monadi, M.; Koch-Ciobotaru, C.; Luna, A.; Ignacio Candela, J.; Rodriguez, P. Multi-terminal medium voltage DC grids fault location and isolation. IET Gener. Transm. Distrib. 2016, 10, 3517–3528. [Google Scholar] [CrossRef] [Green Version]
- Jin, Y.; Fletcher, J.E.; O’Reilly, J. Multiterminal DC Wind Farm Collection Grid Internal Fault Analysis and Protection Design. IEEE Trans. Power Deliv. 2010, 25, 2308–2318. [Google Scholar] [CrossRef]
- De Kerf, K.; Srivastava, K.; Reza, M.; Bekaert, D.; Cole, S.; Van Hertem, D.; Belmans, R. Wavelet-based protection strategy for DC faults in multi-terminal VSC HVDC systems. IET Gener. Transm. Distrib. 2011, 5, 496–503. [Google Scholar] [CrossRef]
- Lianxiang, T.; Boon-Teck, O. Locating and Isolating DC Faults in Multi-Terminal DC Systems. IEEE Trans. Power Deliv. 2007, 22, 1877–1884. [Google Scholar] [CrossRef]
- Jin, Y.; Fletcher, J.E.; O’Reilly, J. Short-Circuit and Ground Fault Analyses and Location in VSC-Based DC Network Cables. IEEE Trans. Ind. Electron. 2012, 59, 3827–3837. [Google Scholar] [CrossRef] [Green Version]
- Azizi, S.; Sanaye-Pasand, M.; Abedini, M.; Hassani, A. A Traveling-Wave-Based Methodology for Wide-Area Fault Location in Multiterminal DC Systems. IEEE Trans. Power Deliv. 2014, 29, 2552–2560. [Google Scholar] [CrossRef]
- Nanayakkara, O.M.K.K.; Rajapakse, A.D.; Wachal, R. Traveling-Wave-Based Line Fault Location in Star-Connected Multiterminal HVDC Systems. IEEE Trans. Power Deliv. 2012, 27, 2286–2294. [Google Scholar] [CrossRef]
- Nanayakkara, O.M.K.K.; Rajapakse, A.D.; Wachal, R. Location of DC Line Faults in Conventional HVDC Systems With Segments of Cables and Overhead Lines Using Terminal Measurements. IEEE Trans. Power Deliv. 2012, 27, 279–288. [Google Scholar] [CrossRef]
- Zheng-you, H.; Kai, L.; Xiao-peng, L.; Sheng, L.; Jian-wei, Y.; Rui-kun, M. Natural Frequency-Based Line Fault Location in HVDC Lines. IEEE Trans. Power Deliv. 2014, 29, 851–859. [Google Scholar] [CrossRef]
- Jiale, S.; Shuping, G.; Guobing, S.; Zaibin, J.; Xiaoning, K. A Novel Fault-Location Method for HVDC Transmission Lines. IEEE Trans. Power Deliv. 2010, 25, 1203–1209. [Google Scholar] [CrossRef]
- Liang, Y.; Wang, G.; Li, H. Time-Domain Fault-Location Method on HVDC Transmission Lines Under Unsynchronized Two-End Measurement and Uncertain Line Parameters. IEEE Trans. Power Deliv. 2015, 30, 1031–1038. [Google Scholar] [CrossRef]
- Fink, M. Time reversal of ultrasonic fields. I. Basic principles. IEEE Trans. Ultrason. Ferroelectr. Freq. Control 1992, 39, 555–566. [Google Scholar] [CrossRef] [PubMed]
- Rachidi, F. On the Location of Lightning Discharges Using Time Reversal of Electromagnetic Fields. IEEE Trans. Electromagn. Compat. 2014, 56, 149–158. [Google Scholar]
- Razzaghi, R. An Efficient Method Based on the Electromagnetic Time Reversal to Locate Faults in Power Networks. IEEE Trans. Power Deliv. 2013, 28, 1663–1673. [Google Scholar] [CrossRef] [Green Version]
- Razzaghi, R.; Lugrin, G.; Rachidi, F.; Paolone, M. Assessment of the Influence of Losses on the Performance of the Electromagnetic Time Reversal Fault Location Method. IEEE Trans. Power Deliv. 2017, 32, 2303–2312. [Google Scholar] [CrossRef] [Green Version]
- Codino, A.; Wang, Z.; Razzaghi, R.; Paolone, M.; Rachidi, F. An Alternative Method for Locating Faults in Transmission Line Networks Based on Time Reversal. IEEE Trans. Electromagn. Compat. 2017, 59, 1601–1612. [Google Scholar] [CrossRef]
- Zhang, X.; Tai, N.; Wang, Y.; Liu, J. EMTR-based fault location for DC line in VSC-MTDC system using high-frequency currents. IET Gener. Transm. Distrib. 2017, 11, 2499–2507. [Google Scholar] [CrossRef]
- Dong, X.; Kong, W.; Cui, T. Fault Classification and Faulted-Phase Selection Based on the Initial Current Traveling Wave. IEEE Trans. Power Deliv. 2009, 24, 552–559. [Google Scholar] [CrossRef]
- Hong, Y.; Chang-Chian, P. Detection and correction of distorted current transformer current using wavelet transform and artificial intelligence. IET Gener. Transm. Distrib. 2008, 2, 566–575. [Google Scholar] [CrossRef]
Figure 1.
Single line diagram for DC distribution network.
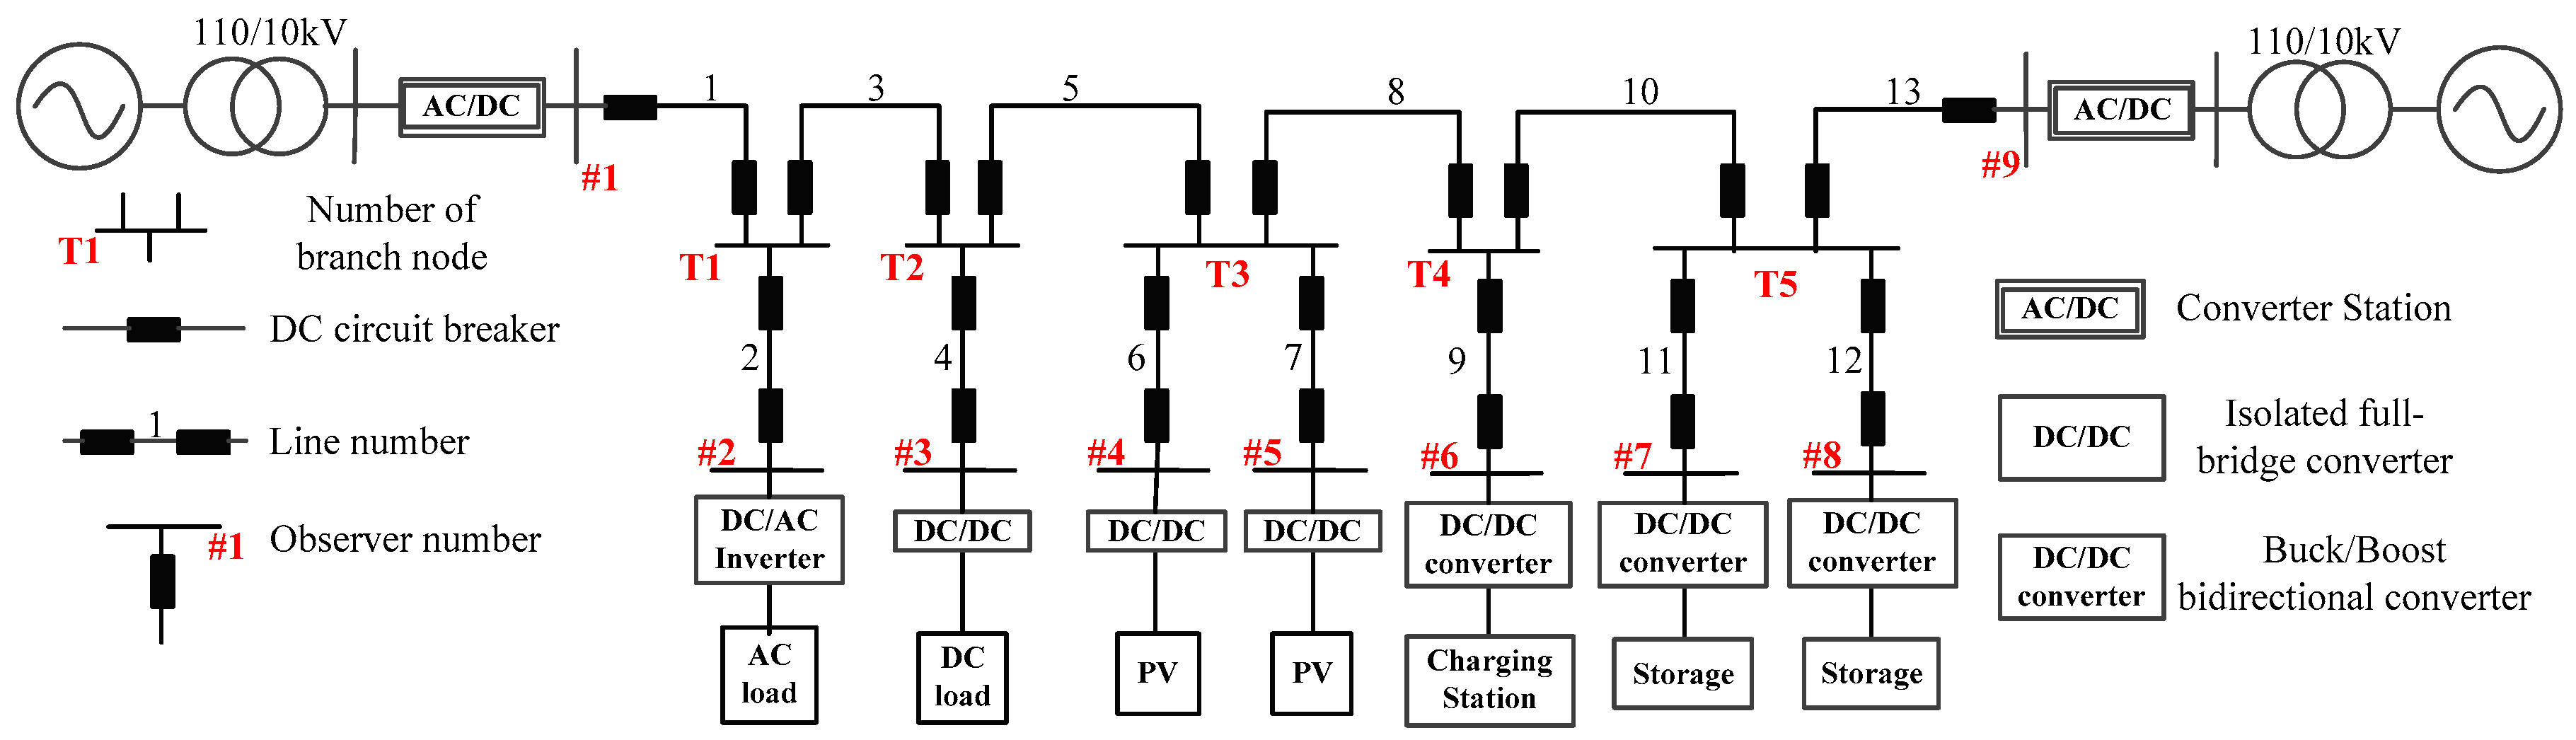
Figure 2.
Justification for fault location that uses time reversal theory with two internal observers: (a) the additional network after fault occurrence; (b) calculate the current of assumed fault along the lossless mirror line.
Figure 2.
Justification for fault location that uses time reversal theory with two internal observers: (a) the additional network after fault occurrence; (b) calculate the current of assumed fault along the lossless mirror line.

Figure 3.
Additional network after fault occurrence with two external observers: (a) the connection of fault and health line is between the two observers; (b) the fault line connects to the terminals of the health line.
Figure 3.
Additional network after fault occurrence with two external observers: (a) the connection of fault and health line is between the two observers; (b) the fault line connects to the terminals of the health line.
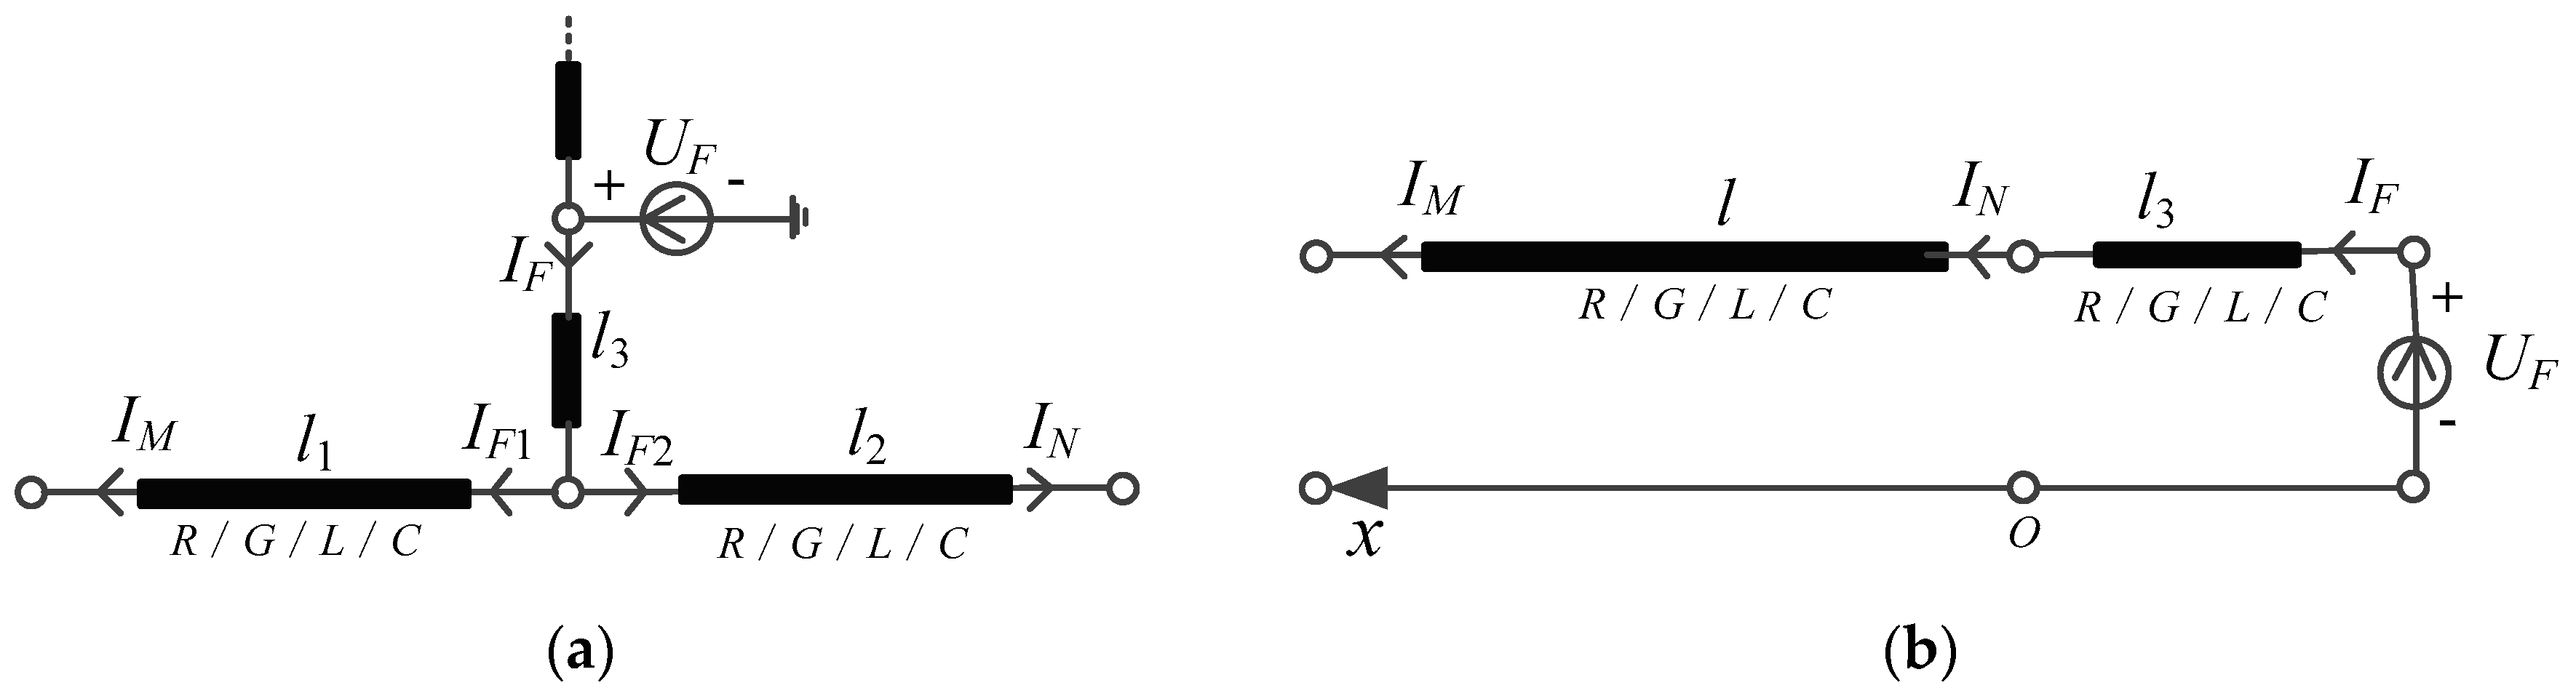
Figure 4.
Fault location with multiple observers: (a) the maximal branch node; (b) the other branch node.
Figure 4.
Fault location with multiple observers: (a) the maximal branch node; (b) the other branch node.
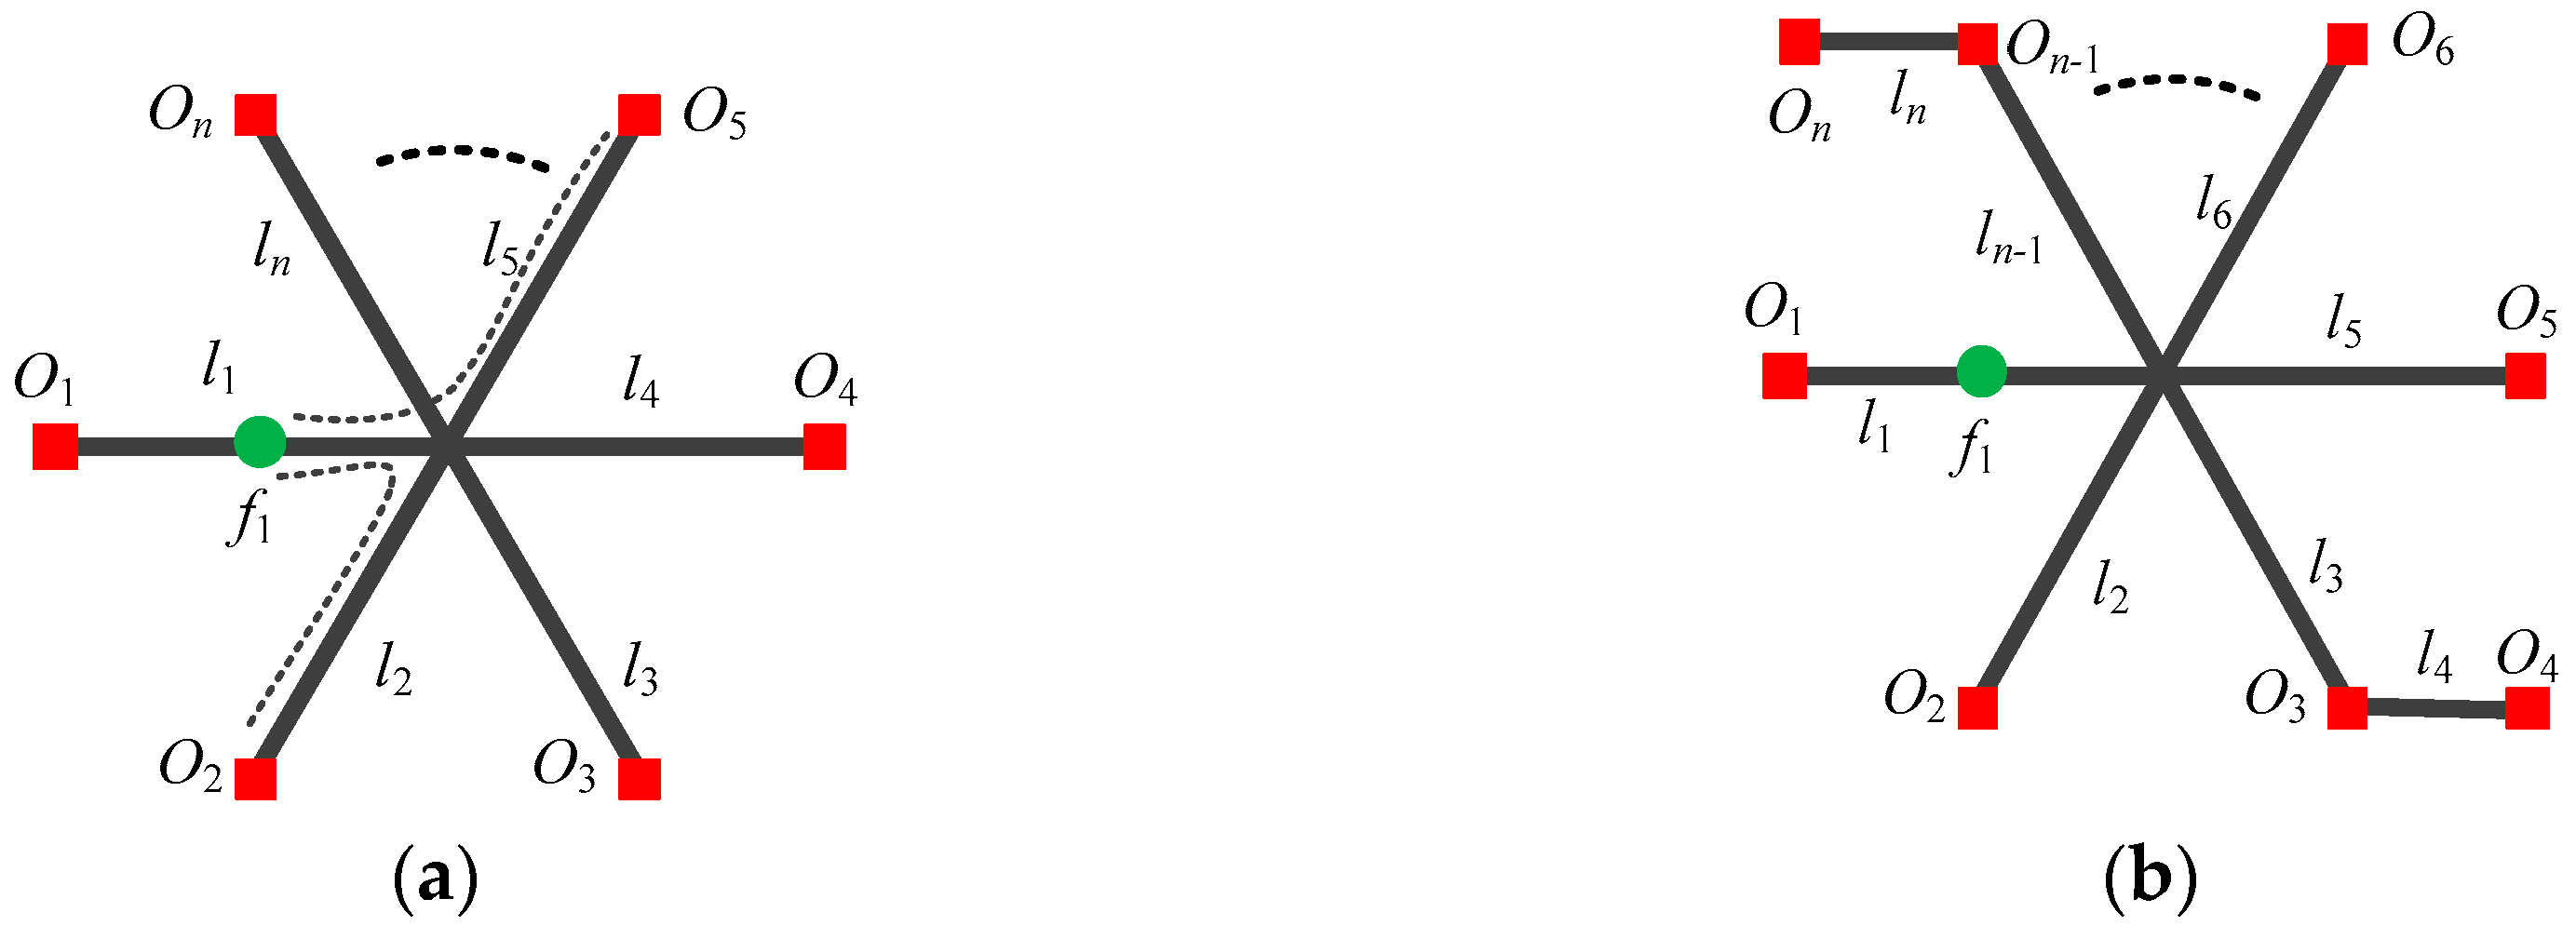
Figure 5.
Phase coefficient versus to length of line.

Figure 6.
Introduction of wavelet decomposition: (a)Schematic diagram of one-dimensional wavelet decomposition; (b). wavelet decomposition for 1-mode current that measured by observer 1.
Figure 6.
Introduction of wavelet decomposition: (a)Schematic diagram of one-dimensional wavelet decomposition; (b). wavelet decomposition for 1-mode current that measured by observer 1.

Figure 7.
Fault line selection with fewer observers.

Figure 8.
Results of fault line selection for different observers: (a) using all observers; (b) using observer 2–6.
Figure 8.
Results of fault line selection for different observers: (a) using all observers; (b) using observer 2–6.
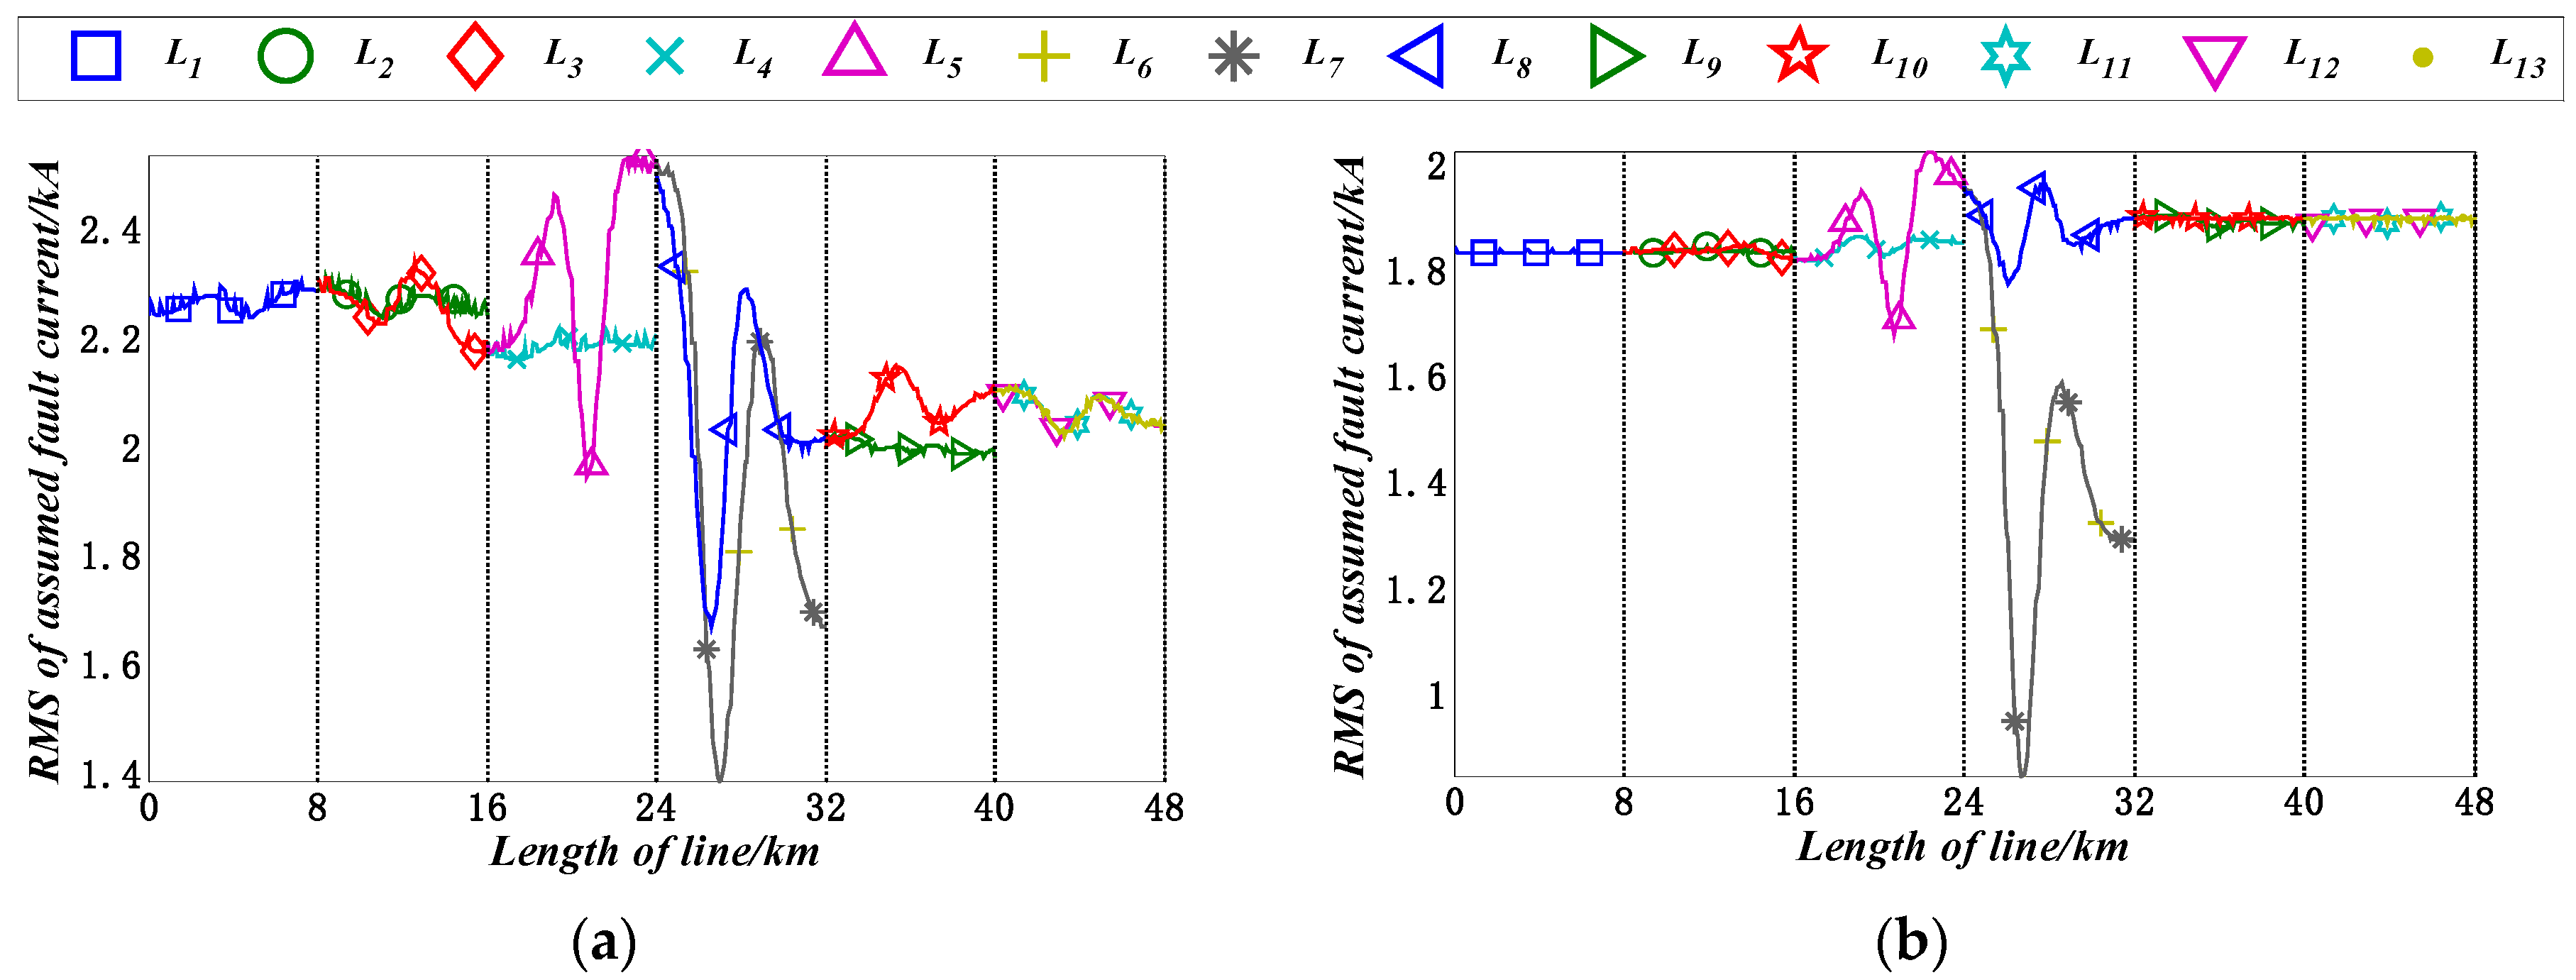
Figure 9.
Results of fault line selection for different fault types and resistances: (a) SLG fault with resistance of 0 Ω; (b) SLG fault with resistance of 100 Ω; (c) LL fault with resistance of 30 Ω; (d) LLG fault with resistance of 30 Ω.
Figure 9.
Results of fault line selection for different fault types and resistances: (a) SLG fault with resistance of 0 Ω; (b) SLG fault with resistance of 100 Ω; (c) LL fault with resistance of 30 Ω; (d) LLG fault with resistance of 30 Ω.
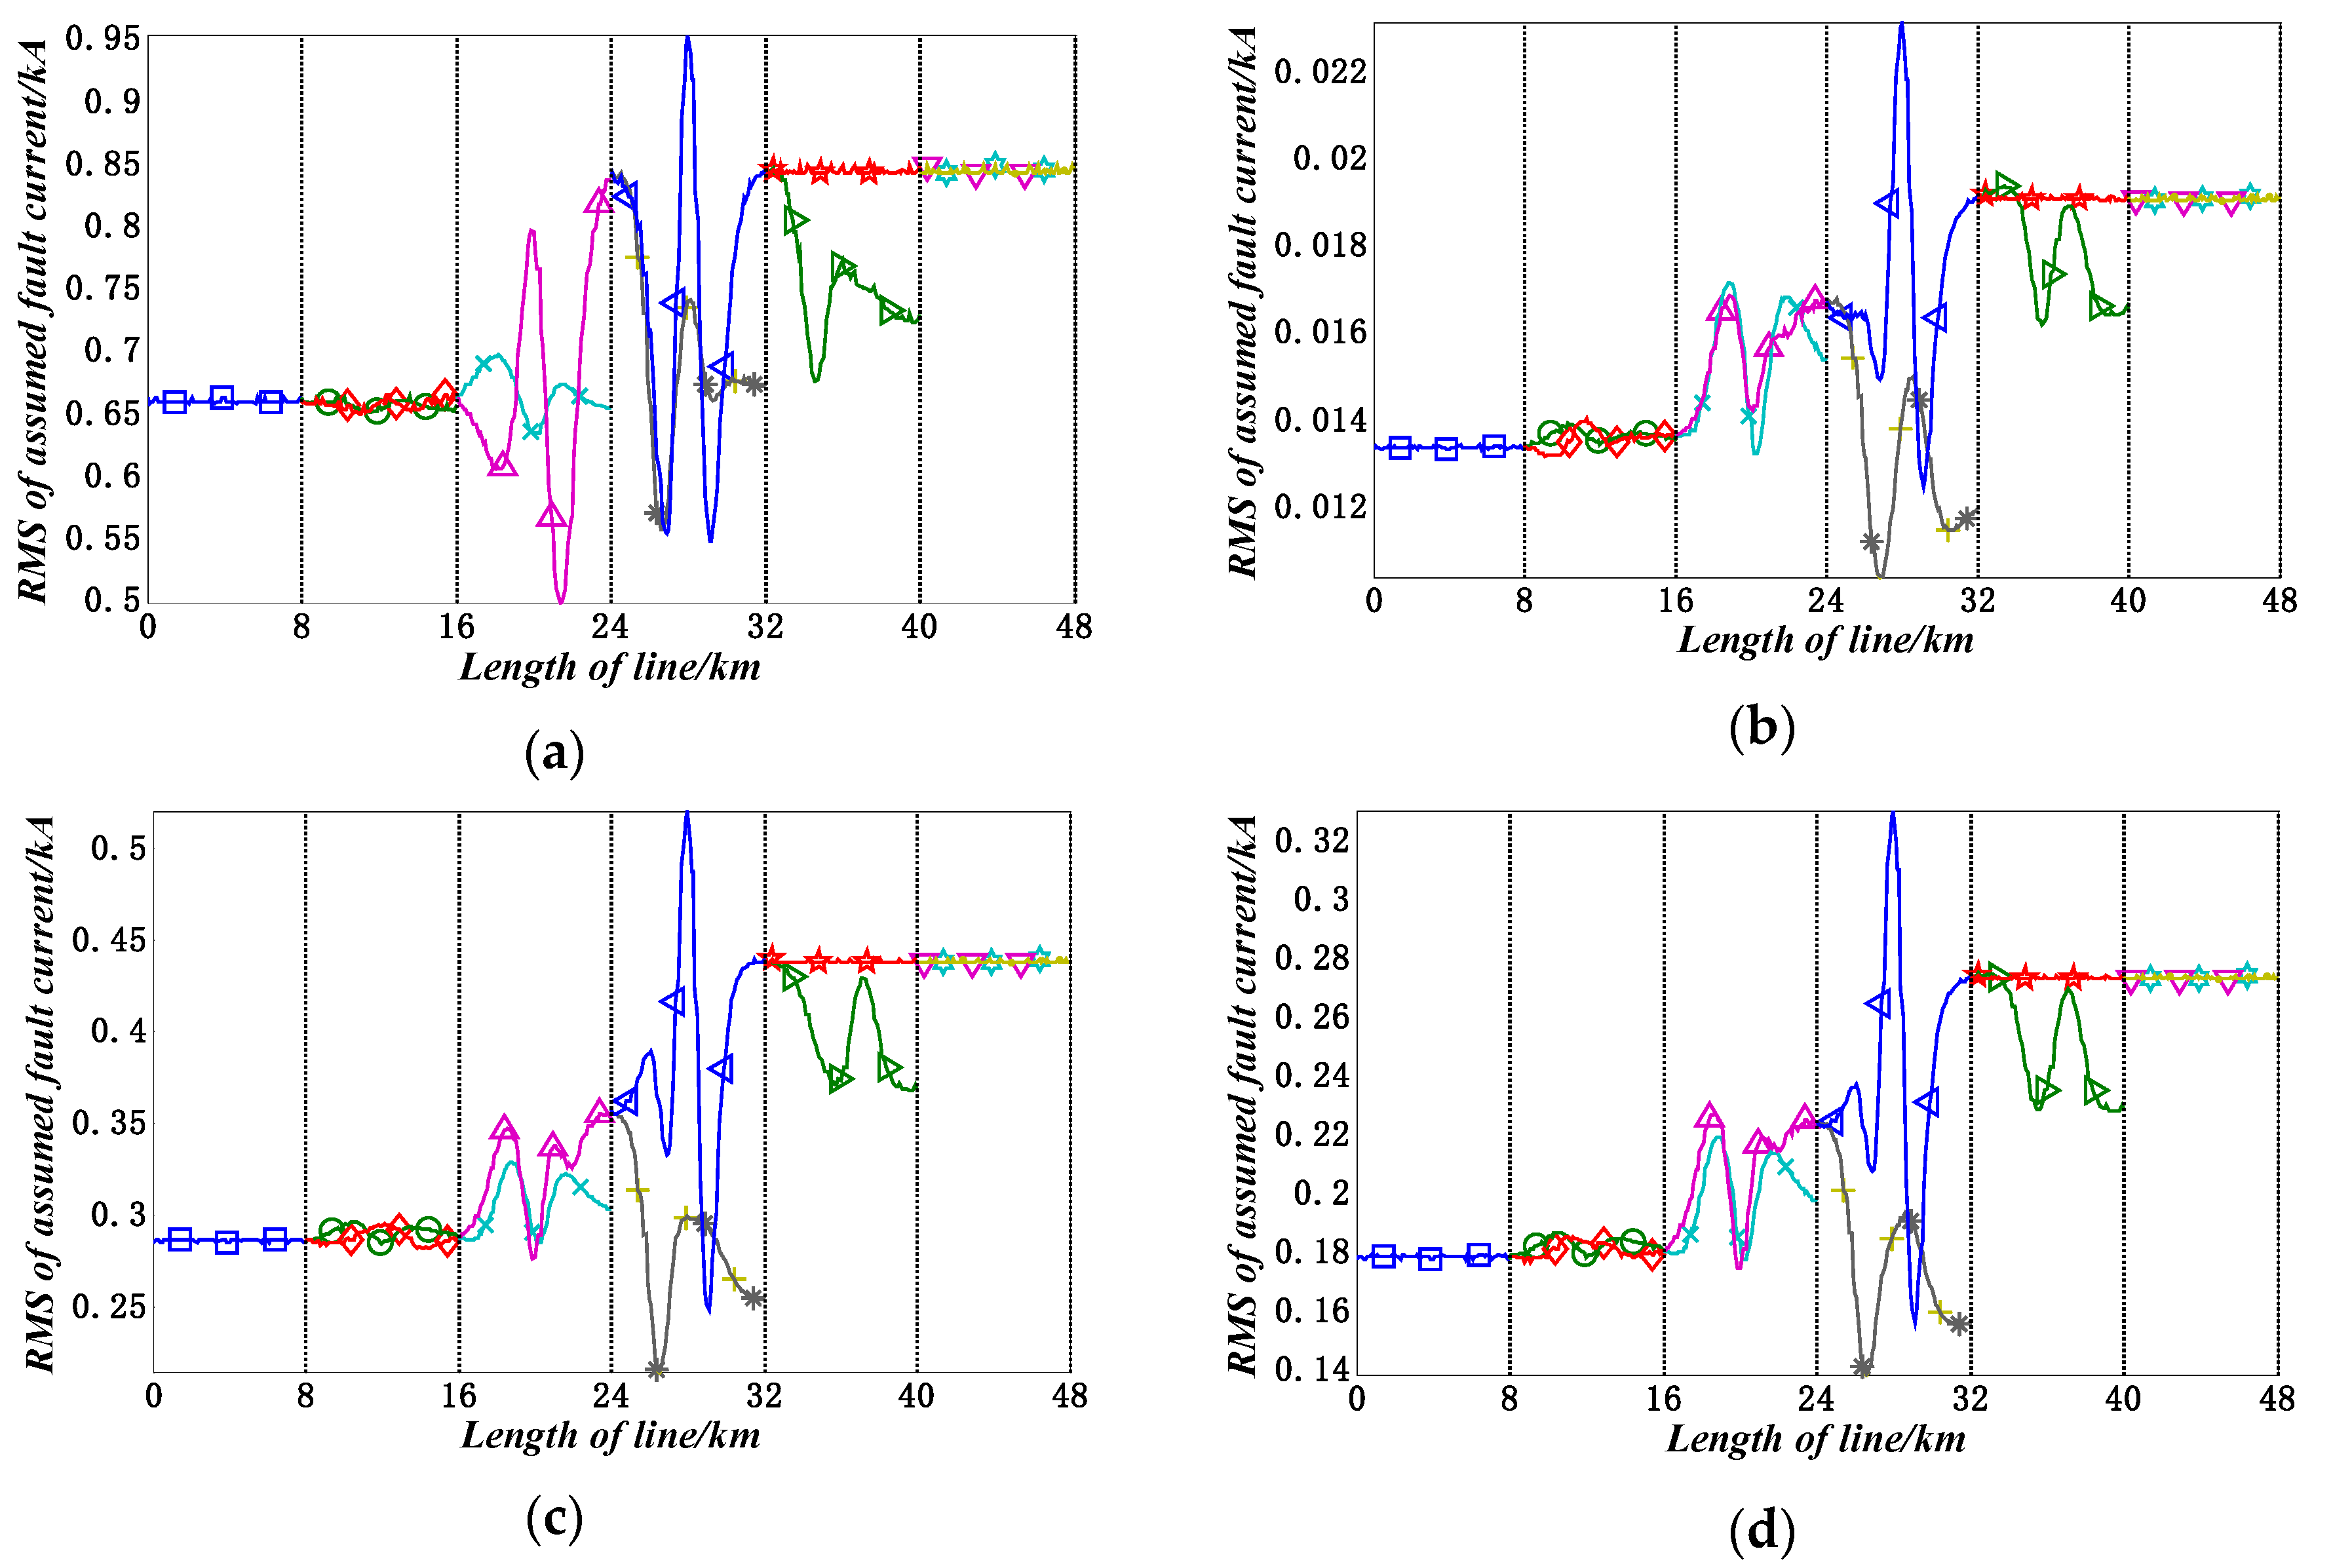
Figure 10.
Modulus of wavelet coefficients of 1-mode currents that are measured by the nine observers.
Figure 10.
Modulus of wavelet coefficients of 1-mode currents that are measured by the nine observers.

Table 1.
Fewest observers for selecting fault line.
| Faulted Line | Observers | Faulted Line | Observers | Faulted Line | Observers |
|---|---|---|---|---|---|
| L1 | 1 2 3 | L6 | 3 4 5 6 | L11 | 6 7 8 9 |
| L2 | 1 2 3 | L7 | 3 4 5 6 | L12 | 6 7 8 |
| L3 | 1 2 3 4 | L8 | 3 4 5 6 7 | L13 | 6 7 8 9 |
| L4 | 2 3 4 | L9 | 4 6 7 | ||
| L5 | 2 3 4 5 6 | L10 | 4 6 7 8 9 |
Table 2.
Results of different fault locations for different fault lines.
| Fault Location/% | 2.50 | 50.00 | 97.50 | Branch Node | |
|---|---|---|---|---|---|
| Faulted Line | |||||
| L1 | 21.25 | 47.50 | 92.50 | 97.50 (T1) | |
| L2 | 6.25 | 51.25 | 78.75 | ||
| L3 | 10.00 | 50.00 | 85.00 | ||
| L4 | 6.25 | 47.50 | 77.50 | 5.00 (T2) | |
| L5 | 13.75 | 50.00 | 86.25 | ||
| L6 | 6.25 | 50.00 | 76.25 | ||
| L7 | 6.25 | 51.25 | 76.25 | ||
| L8 | 16.25 | 50.00 | 90.00 | 1.25 (T3) | |
| L9 | 6.25 | 48.75 | 77.50 | 1.25 (T4) | |
| L10 | 13.75 | 50.00 | 86.25 | 95.00 (T5) | |
| L11 | 76.25 | 51.25 | 76.25 | ||
| L12 | 76.25 | 51.25 | 76.25 | ||
| L13 | 6.25 | 51.25 | 78.75 | ||
| Mean-variance | 25.26 | 1.35 | 5.83 | ||
Table 3.
Results of different fault location for different fault lines based on different wavelet functions.
Table 3.
Results of different fault location for different fault lines based on different wavelet functions.
| Wavelet Function | Db4 | Coif4 | Rbio2.8 | ||||||||||
|---|---|---|---|---|---|---|---|---|---|---|---|---|---|
| Fault Location/% | 2.50 | 50.00 | 97.50 | Branch Node | 2.50 | 50.00 | 97.50 | Branch Node | 2.50 | 50.00 | 97.50 | Branch Node | |
| Faulted Line | |||||||||||||
| L1 | 21.25 | 47.50 | 92.50 | 97.50 (T1) | 21.25 | 47.50 | 92.50 | 21.25 | 47.50 | 92.50 | 97.50 (T1) | ||
| L2 | 6.25 | 51.25 | 78.75 | 6.25 | 51.25 | 78.75 | 6.25 | 51.25 | 78.75 | ||||
| L3 | 21.25 | 50.00 | 76.25 | 37.50 | 50.00 | 61.25 | 1.25 (T1) | 37.50 | 50.00 | 61.25 | |||
| L4 | 6.25 | 47.50 | 78.75 | 5.00 (T2) | 6.25 | 47.50 | 77.50 | 30.00 (T2) | 6.25 | 63.75 | 78.75 | 5.00 (T2) | |
| L5 | 21.25 | 50.00 | 76.25 | 37.50 | 50.00 | 90.00 | 6.25 | 50.00 | 90.00 | ||||
| L6 | 6.25 | 50.00 | 76.25 | 1.25 (T3) | 6.25 | 50.00 | 76.25 | 6.25 | 51.25 | 76.25 | 1.25 (T3) | ||
| L7 | 6.25 | 51.25 | 76.25 | 6.25 | 51.25 | 76.25 | 6.25 | 51.25 | 76.25 | ||||
| L8 | 23.75 | 50.00 | 78.75 | 13.75 | 50.00 | 92.50 | 13.75 (T3) | 13.75 | 50.00 | 92.50 | |||
| L9 | 6.25 | 47.50 | 78.75 | 5.00 (T4) | 6.25 | 47.50 | 77.50 | 28.75 (T4) | 6.25 | 47.50 | 77.50 | 5.00 (T4) | |
| L10 | 23.75 | 50.00 | 76.25 | 38.75 | 50.00 | 62.50 | 86.25 (T5) | 38.75 | 50.00 | 23.75 | |||
| L11 | 40.00 | 51.25 | 76.25 | 1.25 (T5) | 76.25 | 51.25 | 76.25 | 76.25 | 51.25 | 76.25 | 1.25 (T5) | ||
| L12 | 40.00 | 51.25 | 76.25 | 76.25 | 51.25 | 76.25 | 76.25 | 51.25 | 76.25 | ||||
| L13 | 6.25 | 51.25 | 78.75 | 6.25 | 51.25 | 78.75 | 6.25 | 51.25 | 78.75 | ||||
| Mean-variance | 12.56 | 1.48 | 4.39 | 25.80 | 1.48 | 9.57 | 26.10 | 3.99 | 17.58 | ||||
Table 4.
Results of different fault location for different fault lines based on different sampling frequencies.
Table 4.
Results of different fault location for different fault lines based on different sampling frequencies.
| Wavelet Function | Db4 | Coif4 | Rbio2.8 | ||||||||||
|---|---|---|---|---|---|---|---|---|---|---|---|---|---|
| Fault Location/% | 2.50 | 50.00 | 97.50 | Branch Node | 2.50 | 50.00 | 97.50 | Branch Node | 2.50 | 50.00 | 97.50 | Branch Node | |
| Faulted Line | |||||||||||||
| L1 | 15.00 | 51.25 | 88.75 | 17.50 | 50.00 | 83.75 | 23.750 | 51.250 | 92.500 | 97.50 (T1) | |||
| L2 | 10.00 | 47.50 | 85.00 | 15.00 | 48.75 | 81.25 | 13.750 | 47.500 | 76.250 | ||||
| L3 | 11.25 | 50.00 | 87.50 | 2.50 (T1) | 17.50 | 50.00 | 83.75 | 2.50 (T1) | 5.000 | 48.750 | 85.000 | ||
| L4 | 5.00 | 47.50 | 85.00 | 95.00 (T2) | 13.75 | 48.75 | 78.75 | 40.00 (T2) | 13.750 | 47.500 | 77.500 | 11.25 (T2) | |
| L5 | 11.25 | 50.00 | 87.50 | 15.00 | 50.00 | 83.75 | 13.750 | 50.000 | 85.000 | ||||
| L6 | 10.00 | 47.50 | 85.00 | 15.00 | 48.75 | 80.00 | 13.750 | 46.250 | 75.000 | 1.25 (T3) | |||
| L7 | 10.00 | 48.75 | 85.00 | 15.00 | 48.75 | 80.00 | 13.750 | 46.250 | 75.000 | ||||
| L8 | 15.00 | 50.00 | 73.75 | 5.00 (T3) | 17.50 | 50.00 | 83.75 | 10.00 (T3) | 13.750 | 50.000 | 92.500 | ||
| L9 | 5.00 | 47.50 | 83.75 | 13.75 | 48.75 | 78.75 | 30.00 (T4) | 13.750 | 47.500 | 77.500 | |||
| L10 | 11.25 | 50.00 | 87.50 | 2.50 (T4) | 17.50 | 50.00 | 82.50 | 92.50 (T5) | 16.250 | 51.250 | 90.000 | 10.00 (T4) | |
| L11 | 10.00 | 48.75 | 85.00 | 95.00 (T5) | 16.25 | 48.75 | 80.00 | 6.250 | 45.000 | 72.500 | 1.25 (T5) | ||
| L12 | 10.00 | 48.75 | 85.00 | 16.25 | 48.75 | 80.00 | 6.250 | 45.000 | 71.250 | ||||
| L13 | 10.00 | 47.50 | 85.00 | 15.00 | 48.75 | 80.00 | 6.250 | 46.250 | 75.000 | ||||
| Mean-variance | 2.94 | 1.30 | 3.66 | 1.40 | 0.63 | 1.98 | 5.200 | 2.188 | 7.610 | ||||
Table 5.
Results of fault line selection by using any two observers.
| Oj | O2 | O3 | O4 | O5 | O6 | O7 | O8 | O9 | |
|---|---|---|---|---|---|---|---|---|---|
| Oi | |||||||||
| O1 | L1 | L4 | L5 | L5 | L5 | L3 | L3 | L3 | |
| O2 | L4 | L5 | L5 | L5 | L3 | L3 | L3 | ||
| O3 | L5 | L5 | L5 | L4 | L4 | L4 | |||
| O4 | L6 | L6 | × | × | × | ||||
| O5 | L7 | × | × | × | |||||
| O6 | × | × | × | ||||||
| O7 | L11 | L11 | |||||||
| O8 | L12 | ||||||||
Table 6.
Results of fault line selection for different fault locations at different fault lines.
| Fault Location/% | 2.50 | 50.00 | 97.50 | Branch Node | |
|---|---|---|---|---|---|
| Faulted Line | |||||
| L1 | L1 | L1 | L1 | L1 | |
| L2 | L2 | L2 | L2 | ||
| L3 | L3 | L3 | L3 | ||
| L4 | L4 | L4 | L3 | L4 | |
| L5 | L5 | L5 | L5 | L6 | |
| L6 | L6 | L6 | L8 | ||
| L7 | L7 | L7 | L8 | ||
| L8 | L8 | L8 | L8 | ||
| L9 | L9 | L9 | L10 | L9 | |
| L10 | L10 | L10 | L10 | ||
| L11 | L11 | L11 | L10 | L11 | |
| L12 | L12 | L12 | L10 | ||
| L13 | L13 | L13 | L13 | ||
© 2019 by the authors. Licensee MDPI, Basel, Switzerland. This article is an open access article distributed under the terms and conditions of the Creative Commons Attribution (CC BY) license (http://creativecommons.org/licenses/by/4.0/).
Share and Cite
MDPI and ACS Style
Zhang, X.; Tai, N.; Wu, P.; Zheng, X.; Huang, W. A Fault Line Selection Method for DC Distribution Network Using Multiple Observers. Energies 2019, 12, 1245. https://doi.org/10.3390/en12071245
AMA Style
Zhang X, Tai N, Wu P, Zheng X, Huang W. A Fault Line Selection Method for DC Distribution Network Using Multiple Observers. Energies. 2019; 12(7):1245. https://doi.org/10.3390/en12071245
Chicago/Turabian StyleZhang, Xipeng, Nengling Tai, Pan Wu, Xiaodong Zheng, and Wentao Huang. 2019. "A Fault Line Selection Method for DC Distribution Network Using Multiple Observers" Energies 12, no. 7: 1245. https://doi.org/10.3390/en12071245
Note that from the first issue of 2016, this journal uses article numbers instead of page numbers. See further details here.