Implementation and Analyses of Yaw Based Coordinated Control of Wind Farms
by
 , ,
, ,
Tanvir Ahmad
1,2,* ,
,
Abdul Basit
1,
Muneeb Ahsan
1,
Olivier Coupiac
3,
Nicolas Girard
3,
Behzad Kazemtabrizi
2 and
Peter C. Matthews
2 1
US Pakistan Center for Advanced Studies in Energy, University of Engineering and Technology (UET), Peshawar 25000, Pakistan
2
School of Engineering, Durham University, Durham DH1 3LE, UK
3
Engie Green, 59777 Lille, France
*
Author to whom correspondence should be addressed.
Energies 2019, 12(7), 1266; https://doi.org/10.3390/en12071266
Submission received: 18 February 2019
/
Revised: 27 March 2019
/
Accepted: 29 March 2019
/
Published: 2 April 2019
(This article belongs to the Special Issue State of the Art of Wind Farm Optimization)
Abstract
:This paper presents, with a live field experiment, the potential of increasing wind farm power generation by optimally yawing upstream wind turbine for reducing wake effects as a part of the SmartEOLE project. Two 2MW turbines from the Le Sole de Moulin Vieux (SMV) wind farm are used for this purpose. The upstream turbine (SMV6) is operated with a yaw offset () in a range of ° to 8° for analysing the impact on the downstream turbine (SMV5). Simulations are performed with intelligent control strategies for estimating optimum settings. Simulations show that optimal can increase net production of the two turbines by more than 5%. The impact of on SMV6 is quantified using the data obtained during the experiment. A comparison of the data obtained during the experiment is carried out with data obtained during normal operations in similar wind conditions. This comparison show that an optimum or near-optimum increases net production by more than 5% in wake affected wind conditions, which is in confirmation with the simulated results.
1. Introduction
When turbines are installed together in wind farms, they interact aerodynamically through wake effects or simply wakes. With the conventional greedy control, each turbine maximises its own production as much as possible in the given wind conditions. In such control setup, the upstream turbines ignore the negative wake effects on the downstream turbines. If the downstream turbines’ swept areas are intersected by the wakes produced by the upstream turbines, they will have lesser wind speeds to produce with. This can significantly affect productions of the downstream turbines, depending upon the wind and wake conditions. Therefore, decreasing wake effects in a wind farm can result in increased economic performance.
The limiting impact of wake effects can be mitigated through coordinated control of turbines’ production within the wind farm. A practical demonstration of coordinated control based on coefficient of power through pitch control was presented in [1]. Optimal curtailment of upstream turbines with optimised pitching can increase net production of a given wind farm [1]. Another possible decision variable for coordinated control is the yaw offset (), applied on an upstream turbine. A turbine operates with an °, which means that the turbine blades are oriented normal to the incoming wind direction. This way a turbine can produce the maximum possible but the wake effects on downstream turbines are ignored. Such type of control may not always result in maximum possible net farm production. However, previous research (summarised in Section 2) suggests that optimal settings of can increase net production of a wind farm.
The field experimental setup used in this paper is detailed in Section 3. The methodology developed for this research is presented in Section 4. Simulations are performed using an intelligent farm controller [2] for obtaining optimum yaw settings of the upstream turbines as discussed in Section 4.2. The results are presented and analysed in Section 5. Real time Supervisory Control And Data Acquisition (SCADA) data obtained during normal operations and the experiment, is used for comparative analyses. Data obtained during the experiment is also used to show the impact of on production of the yawed turbine (SMV6). It shall be noted that the term coordinated control and farm control are used interchangeably in this paper. The work in this paper is based on the SMARTEOLE project, which is aimed at developing and implementing novel wind farm control systems with a view to increasing farm production and efficiency.
2. Literature Review
The concept of using a coordinated control within a wind farm with the objective for optimising production has been an active area of research during the past two decades. Coordinated control requires only a change in software with no hardware replacements in the turbines. Computer hardware retrofitting might be required as per processing requirement of the algorithm. The trend in wind energy control systems is active aerodynamic control through farm control [3].
The experiments using the Energy Research Center of the Netherlands (ECN) scaled wind farm in [4] show that the wake skew angle is almost 1.33° for a wind speed range of 3 m/s to 7 m/s. Results show some increase in power production. However, due to scatter and limitation of data, no specific pattern is seen in power production. These results require field validation.
Computational Fluid Dynamics (CFD) simulations of a two turbine setup for an range of (5° to 50°) are shown in [5]. The computing resources used in this study are extensive with 492 computing cores, 1600 GB RAM, 39 TB storage. Even with such high computational resources, each simulation took around 36 hours to be completed. It is concluded that large yaw offsets result in decrease in net production. However, small yaw offsets can possibly increase net production. Large and small yaw offsets are not defined quantitatively. Simulations in [6] demonstrate that the control strategy can increase net production.
A yaw based control system for wind farm power maximisation using predicted wind directions is presented in [7]. It is shown that 1% additional wind power can be extracted as compared to the state of the art. It is suggested that artificial intelligence based techniques shall be used and evaluated for such type of control. The Bayesian Ascent algorithm (a probabilistic optimisation technique based on non-parametric Gaussian Process regression) is used in [8] for wind farm control for maximising net production. It is concluded in [8] that intelligent coordinated control techniques shall be used for active wind farm production maximisation.
Yaw based farm control for production maximisation and fatigue load minimisation in varying wind conditions is discussed in [9]. It is discussed that practical implementation is required for validation of the simulated results to show that benefits of such control algorithms can be actually realised. The statistical meandering wake model in [10] shows a production increase of 6.7% to 7% in Nysted wind farm when averaged over all directions. It is also discussed in [10] that significantly large yaw angles (in the order of 25°) are required for optimisation in some cases.
Benefits of mitigating wake effects for optimal operation of wind farms are discussed in [11]. An implementation of Game Theory is described in [12] to coordinate the operation of a basic three turbine wind farm. Coordinated control has been demonstrated to lift the whole farm production by 25% in comparison to conventional greedy control [12]. A further Game Theoretical approach [13] was implemented using a multi-agent system framework to optimise farm production based on the Jensen wind deficit model. This study [13] demonstrated that a 10% increase in farm production could be achieved under suitable wind conditions through farm-wide turbine coordination.
Studies in [6,14,15,16] used a high-order wind farm model Simulator fOr Wind Farm Applications (SOWFA) and the FLOw Redirection and Induction in Steady-state (FLORIS) engineering wind flow model to simulate coordinated control of a virtual wind farm. These studies concluded that both curtailed and yaw-based adaptive control strategies could be adopted as part of a coordinated farm wide optimised production system. These approaches both involved a controlled curtailment or yaw redirection of the upstream turbines. Distributed control with local optimisation at individual turbines is used for increasing the computational efficiency of the overall process in [17]. Simulations are performed using a modified version of the FLORIS wake model [17]. Simulations in [18] with a 12 turbine case with a separation of 3.5D are performed using SOWFA and FLORIS for analyzing how a steered wake interacts with a downstream wake and with laterally adjacent wakes. The findings in [18] can be used for developing effective wind farm control strategies. The simulated results in [19] indicate that realization of power gains by redirecting wakes requires computational efficiency of the control algorithms.
A Genetic Algorithm (GA) is used to optimise farm production based on the Park model [20]. This heuristic approach provides computational efficiencies to find good solutions to large complex problems at a small cost of not guaranteeing the most optimal solution. Similar heuristic approaches have been used with the offline production optimisation based on the AEOLUS SimWindFarm model [21], demonstrating a potential wake based improvement of up to 7%. The impact of yaw control on farm production considering spacing and layout is analyzed in [22] using six different wind farm layouts. It is concluded that efficiency of all the wind farms is significantly increased using optimised coordinated control. Exploiting the benefits of coordinated control depends upon farm layout and wind characteristics [22,23]. Simulations with optimised layout and yaw based wake control of Princess Amalia Wind Park conclude that an increase of up to 5% is possible in annual energy production [24]. Optimised yaw offsets and large eddy simulation for exploiting benefits of optimised coordinated control in [25] confirm that a significant efficiency gain is possible with optimised wake steering.
Wake steering and the impact on farm production is analyzed with field tests in offshore environment in [26]. Simulations are performed using SOWFA and FLORIS for obtaining the optimised yaw offsets. A spacing of 7 Diameters (D) and 8.5D improvement in net production of the turbines under observation is reported. An increase of up to 29% is observed in the downstream turbine’s power production in the main wake direction. Wake tracking for coordinated control of wind farm based on Lidar data is presented in [27] in offshore conditions. This wake tracking is used for redirecting the wake to an optimised position. Field implementation and analyses of yaw based farm control in onshore conditions are performed in [28,29]. These field experiments [28,29] are performed in test facilities providing useful insights into wake steering in onshore conditions.
The work presented in this paper analyses wake steering and the impact on net production in onshore conditions in a commercially operated wind farm. The optimised yaw offsets are obtained using Particle Swarm Optimisation (PSO) and a modified version of the Jensen model presented in [2]. Real-time SCADA data is collected for analysing the impact of yaw offsets on net production of the turbines. The real time data is also used to analyse the impact of yaw offset on the yawed turbine. A comparison between the normal operations and experimental operations based on actual field data is performed to show the benefits of yaw based coordinated control. At the time of the field experiments (August 2016), there did not appear to be any other publicly reported equivalent commercially conducted field experiments with similar onshore wind farms. The impact on fatigue is not analyzed in this paper and the scope is limited to power production analyses.
3. Experimental Setup
The SMV wind farm layout and experimental setup is depicted in Figure 1. Turbines in the farm are named as SMV1 to SMV7, respectively, from north to south. The farm has Senvion MM82-2050 kW turbines installed [30]. Characteristics of the MM82-2050 kW turbine are given in Table 1. Operational characteristics of the turbines are provided in Figure 2. Rated power of the turbine is 2 MW with a rated wind speed of 12.5 m/s. The terrain is characterised as being rough with fresh grass or vegetation on the ground. There are woods to the south of the wind farm at a distance of 100 m, within 1.5D with trees up to 15 m high. The woods affect the wind characteristics inside the farm and can occasionally create abrupt changes in wind conditions in the farm [31].
The setup used in the field experiment is based on two wind turbines (SMV6 and SMV5) in the wind farm. These are the second and third turbines from south. SMV7 is the turbine to the south and is used as the reference turbine for determining wind direction. Distance between the two turbines (SMV6 and SMV5) used in the experiment is approximately 3.6D. Predominant wind direction in the SMV is south and southwest as shown in Figure 1. Distance between the two turbines and the dominant wind direction are the main reasons for selecting these two turbines for the experiment.
The free-stream wind characteristics (speed and direction) are provided by 80 m tall lattice met masts with ultrasonic anemometers installed at 80 m (same height as the turbines) above ground level. The met masts are located 1 km east of SMV2 and 1.6 km north-east of SMV6.
4. Methodology
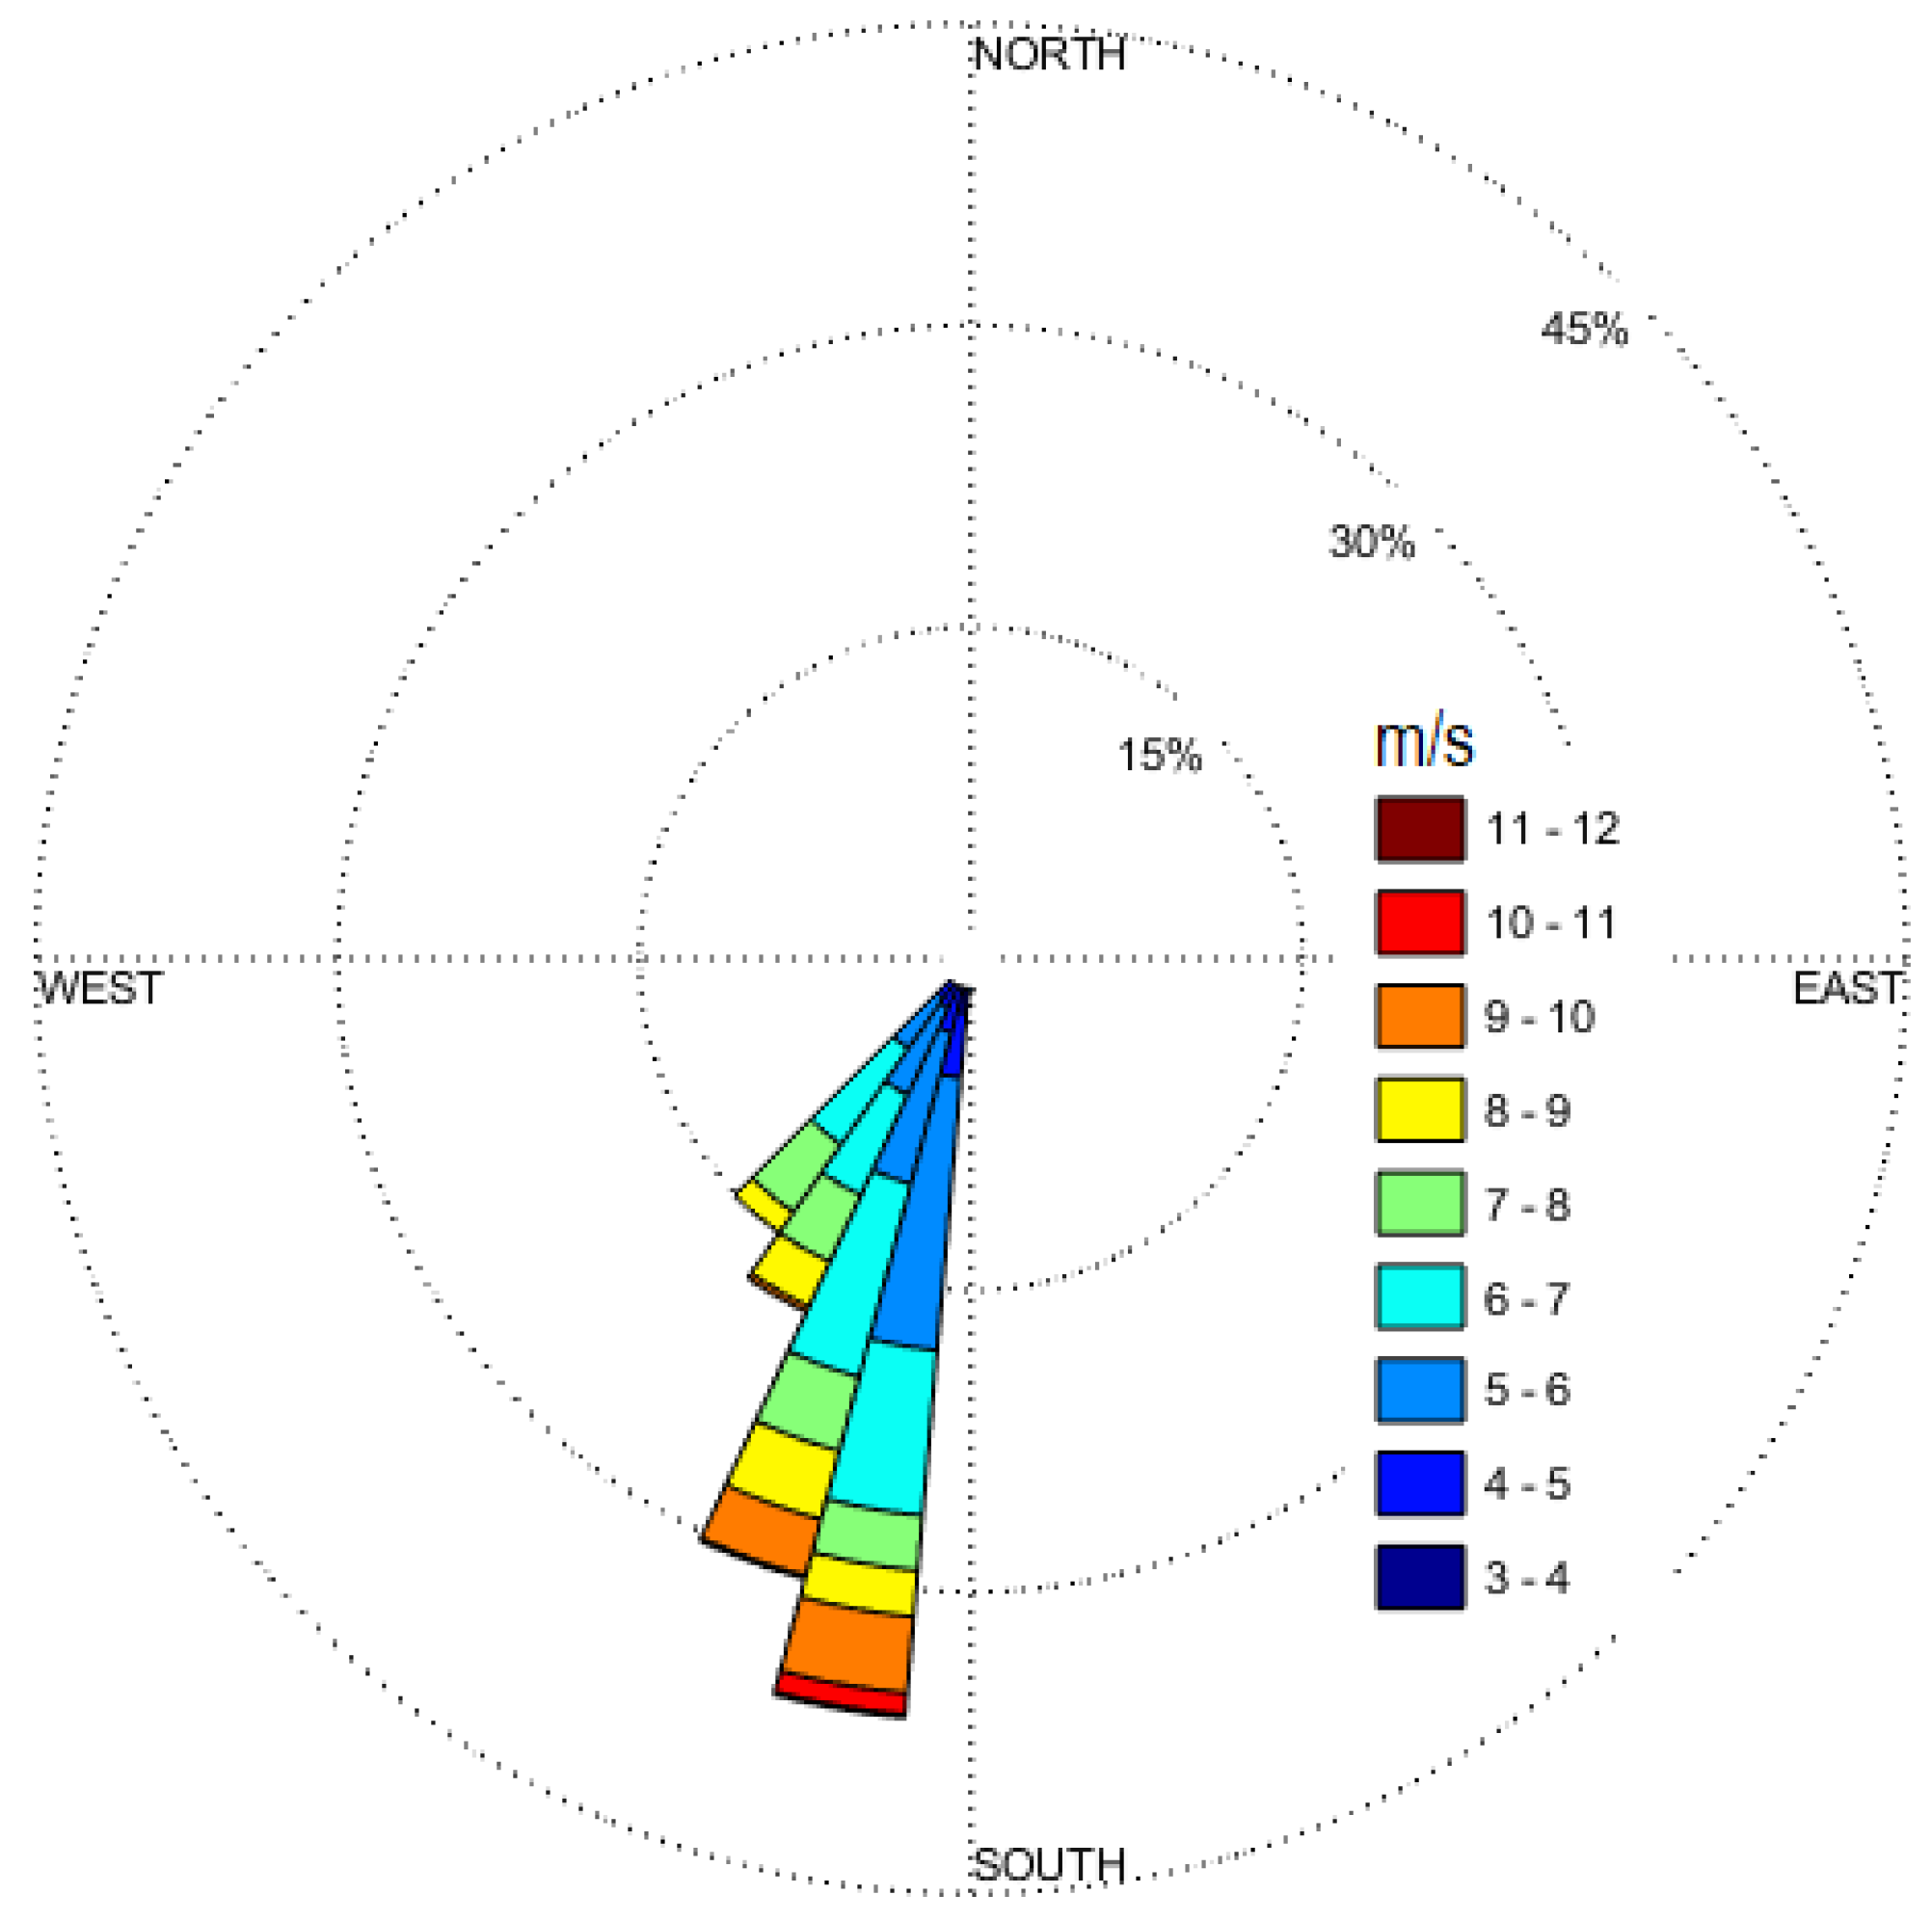
This experiment was performed in August, September 2016. Wind speed in the farm is affected by seasonal variations [31]. The speeds are relatively low at this time of the year as can be observed in Figure 3 and Table 2. The wind direction sector 180°–220° is selected for analyses based on the predominant wind direction and wake effects of SMV6 on SMV5. SMV6 is the upstream yawed turbine as shown in Figure 1. SMV5 is under direct wake effects of SMV6 in the chosen direction sector. As per WindPRO software calculations, wake losses can be as high as 26% annually in this sector in SMV5 production due to wakes produced by SMV6 only.
The optimised for SMV6 is within a range of ° as will be discussed in Section 4.2. However a fixed was applied on SMV6 for wake analyses during the experiment due to the operational constraints. For ten days, SMV6 was operated with a yaw offset of ° (clockwise) with respect to the wind direction, whenever the wind blew from 180°–220°. Subsequently, the yaw offset for SMV6 was set at 8° (anticlockwise) for four weeks, for the selected direction sector. The windrose in Figure 3 shows the actual wind conditions during the experiment, when the yaw offsets were applied on SMV6. The yaw offset range of ° to ° is selected given the operational limitations of the wind turbine.
Another issue is the unintentional yaw offset (yaw error) on the upstream turbine. With the greedy control, is set at zero. However, this is not the case always. Hence, to determine the actual , the difference in nacelle position and wind direction is added to applied manually during the experiment (Section 4). This removes any yaw error in the data set. This also provides a more extended set of yaw offsets beyond the (° to 8°) range.
4.1. Data and Filtering
SCADA data from the SMV wind farm at 10 min interval was collected during the experimental period. More than 650 data points at an interval of 10 min were recorded. Three different filters are applied on this data as follows. It is assumed that wake effects in these bins remain the same:
- Wind speed bin: Wind speed bin is kept at m/s.
- Wind direction bin: Wind direction bin is maintained at °.
- Yaw offset bin: Yaw offset applied on SMV6 is distributed in a bin of °.
Number of valid data points in each direction and speed bin are given in Table 2. In the simulations (Section 4.2), the wind directional resolution is kept at 5°, which corresponds to a bin of °.
The minimum number of acceptable points for analyses, after applying the three levels of filtering, is kept at 5. If the number of points is increased to 10, then very limited bins (only 2) are available for analyses.
4.2. Optimal Yaw Offsets
In order to determine an optimal set of yaw offsets, simulations were performed using yaw based intelligent control strategies. A brief description of the yaw based optimal control strategy is provided in this section. For details, the reader is referred to [2].
PSO is used along with a Turbulence Intensity based Jensen Model (TI-JM) for estimating the optimal yaw offsets [23]. Yaw offsets were initialised within a range of (−15°, 15°) as the implementable yaw offset range was (−12°, 8°) as discussed in Section 4. By adding the yaw error, the range extends beyond this (−12°, 8°).
The wake expansion is determined using the wake decay coefficient of the standard Jensen model. Wake expands linearly behind the wake producing turbines starting with a radius equal to the blade length. Wake expansion is directly proportional to the distance from the wake producing turbine. The standard wake decay coefficient of 0.07 [32], for the type of terrain SMV has, is used in calculations. This standard wake decay coefficient was evaluated using real-time data and was found to be the best fit for the experimental setup as discussed in [1]. The wake skew angle () is determined using Equation (1) [33]. This relationship (Equation (1)) is validated using scaled wind farms and real time data in [34]:
PSO evaluates different for increasing net production of SMV6 and SMV5, selecting an optimum for SMV6. It is assumed that the impact of on SMV6 and SMV5 production within a bin of ° remains the same. The flowchart for estimating the optimised using PSO is given in Figure 4.
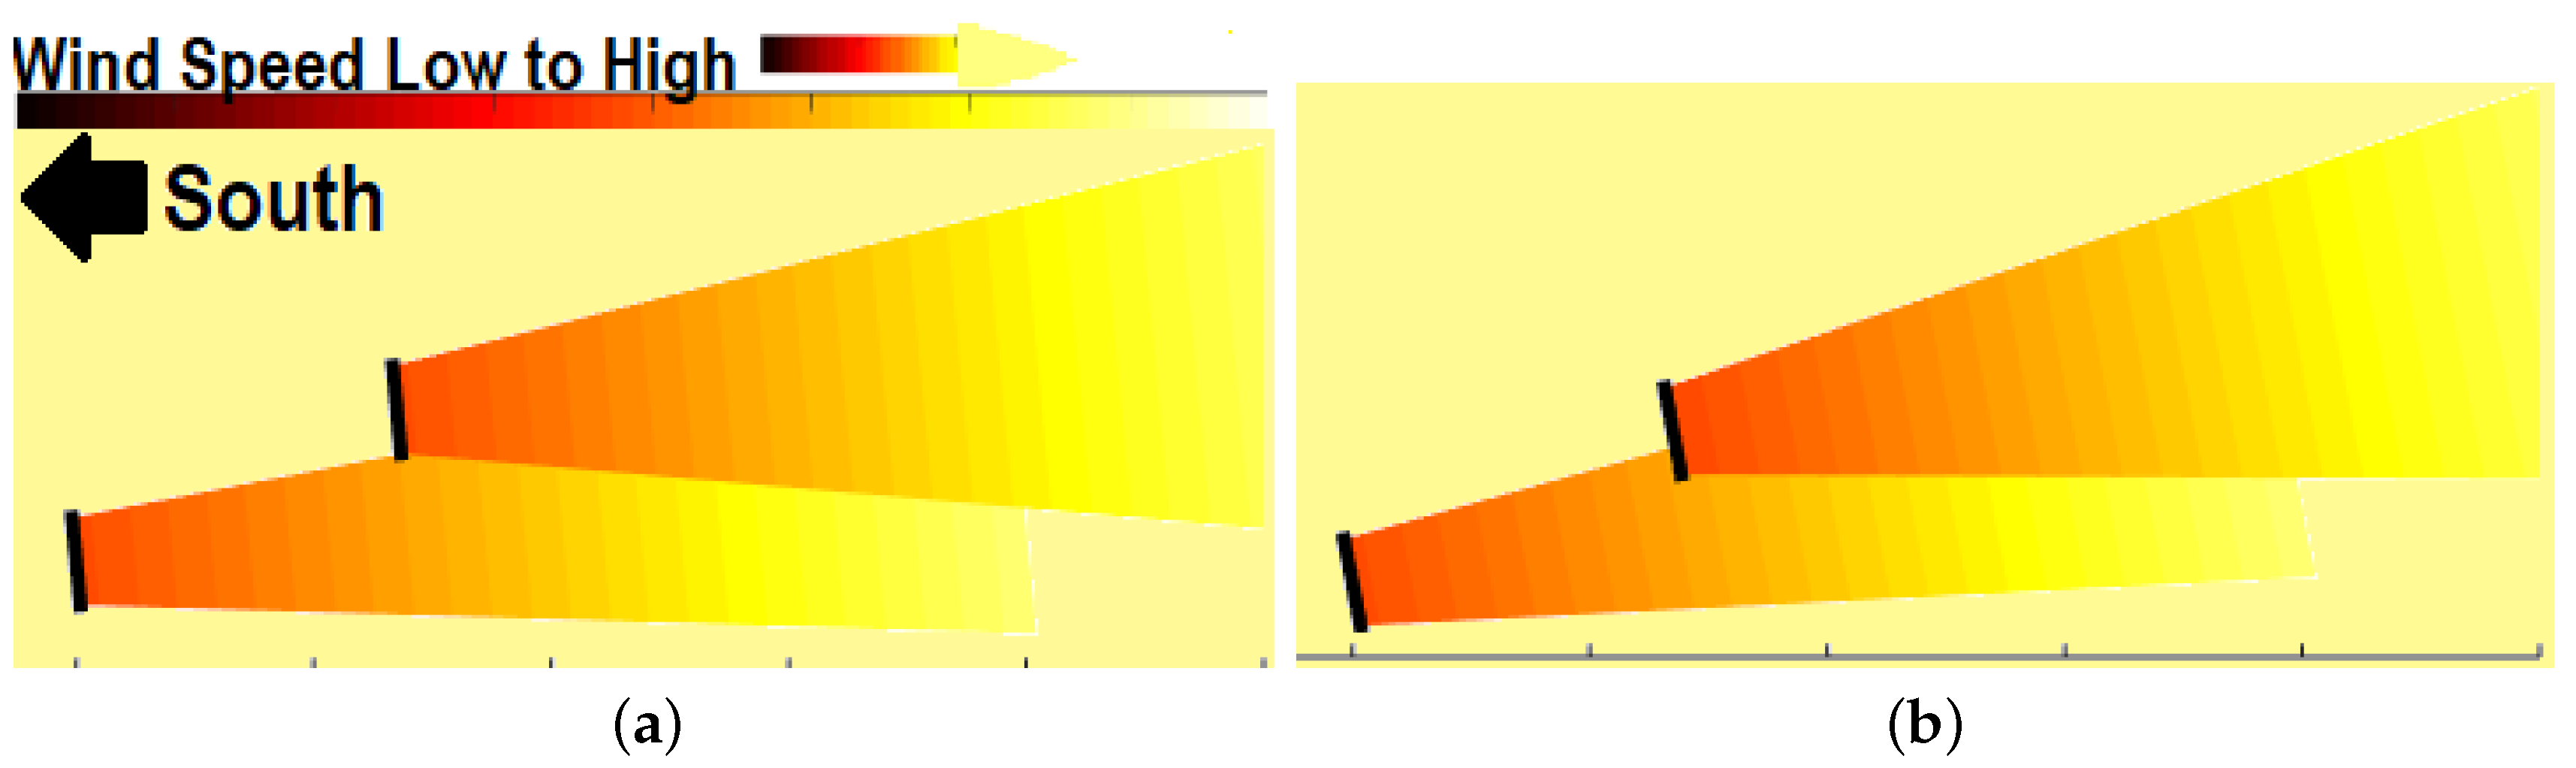
It was observed that SMV6 wake in 180°–185° and 185°–190° direction has a negligible impact on SMV5 production, as depicted in Figure 5. Therefore, the optimum is 0° for SMV6 in these wind directions. This ensures that the net production of SMV6 and SMV5 is always at a maximum. The optimisation problem is a minimising function formulated as Equation (2). The net production with both SMV5 and SMV6 operating greedily with ° and facing free-stream wind (no wake conditions) is denoted by while represents net production when SMV6 is yawed. The aim is to maximise net power production with SMV6 in yawed condition, by minimising the positive difference between maximum possible net power production (in no wake conditions) and actual power production in yawed conditions for a given direction bin. This always makes sure that maximum possible net production is achieved. For example, if there are no wake effects, then the turbines shall operate greedily and the value of becomes zero (the minimum possible). Similarly, in cases when wake effects are present, the value of will be minimum at a point when is maximum. Details of formulation of the objective function can be found in [2]:
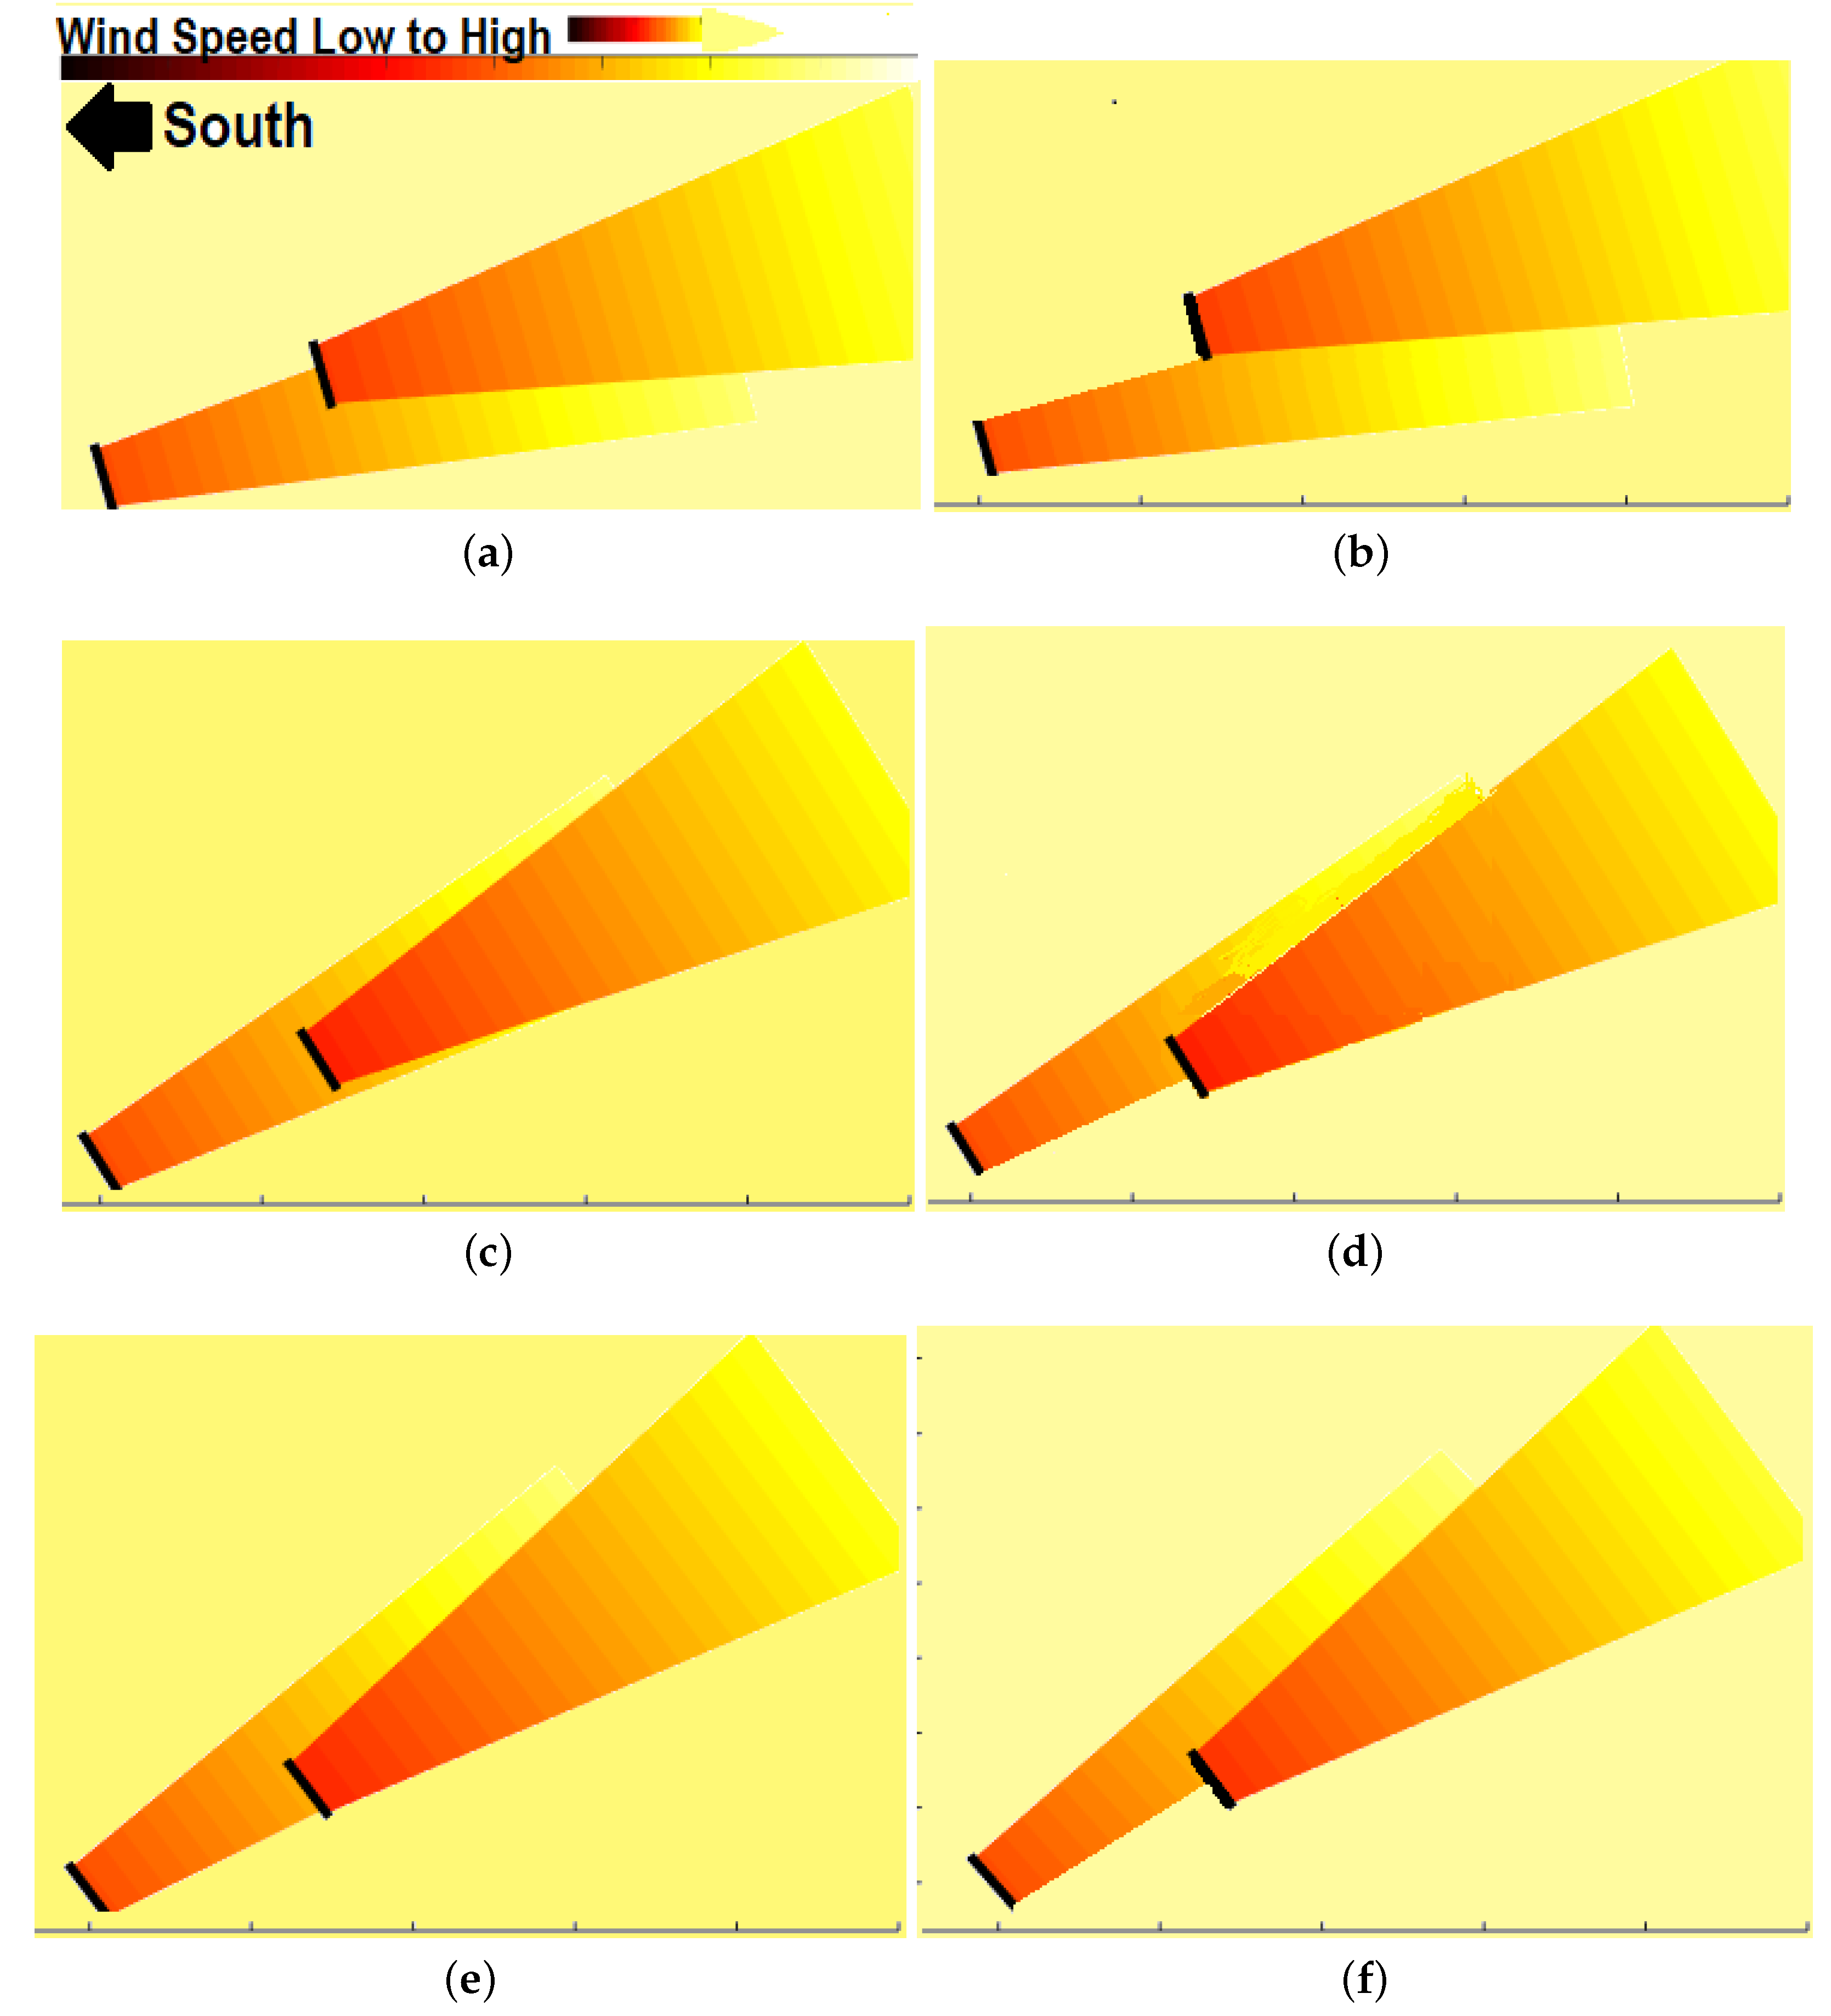
Simulated optimal for 191°–220° along with a percentage increase in net production as compared to greedy control are given in Table 3. An increase of more than 5% is predicted in the simulations in partial wake conditions i.e., 196°–200° and 211°–215°. In full wake conditions, i.e., 206°–210°, a higher is required for skewing the wake away from SMV5. A comparison of the greedy control and optimised control for three different yaw offset bins is depicted in Figure 6. It can be seen in Figure 6 that the optimal given in Table 3, skew the way away from SMV5 swept area, minimising wake effect and increasing net production.
5. Results and Analyses
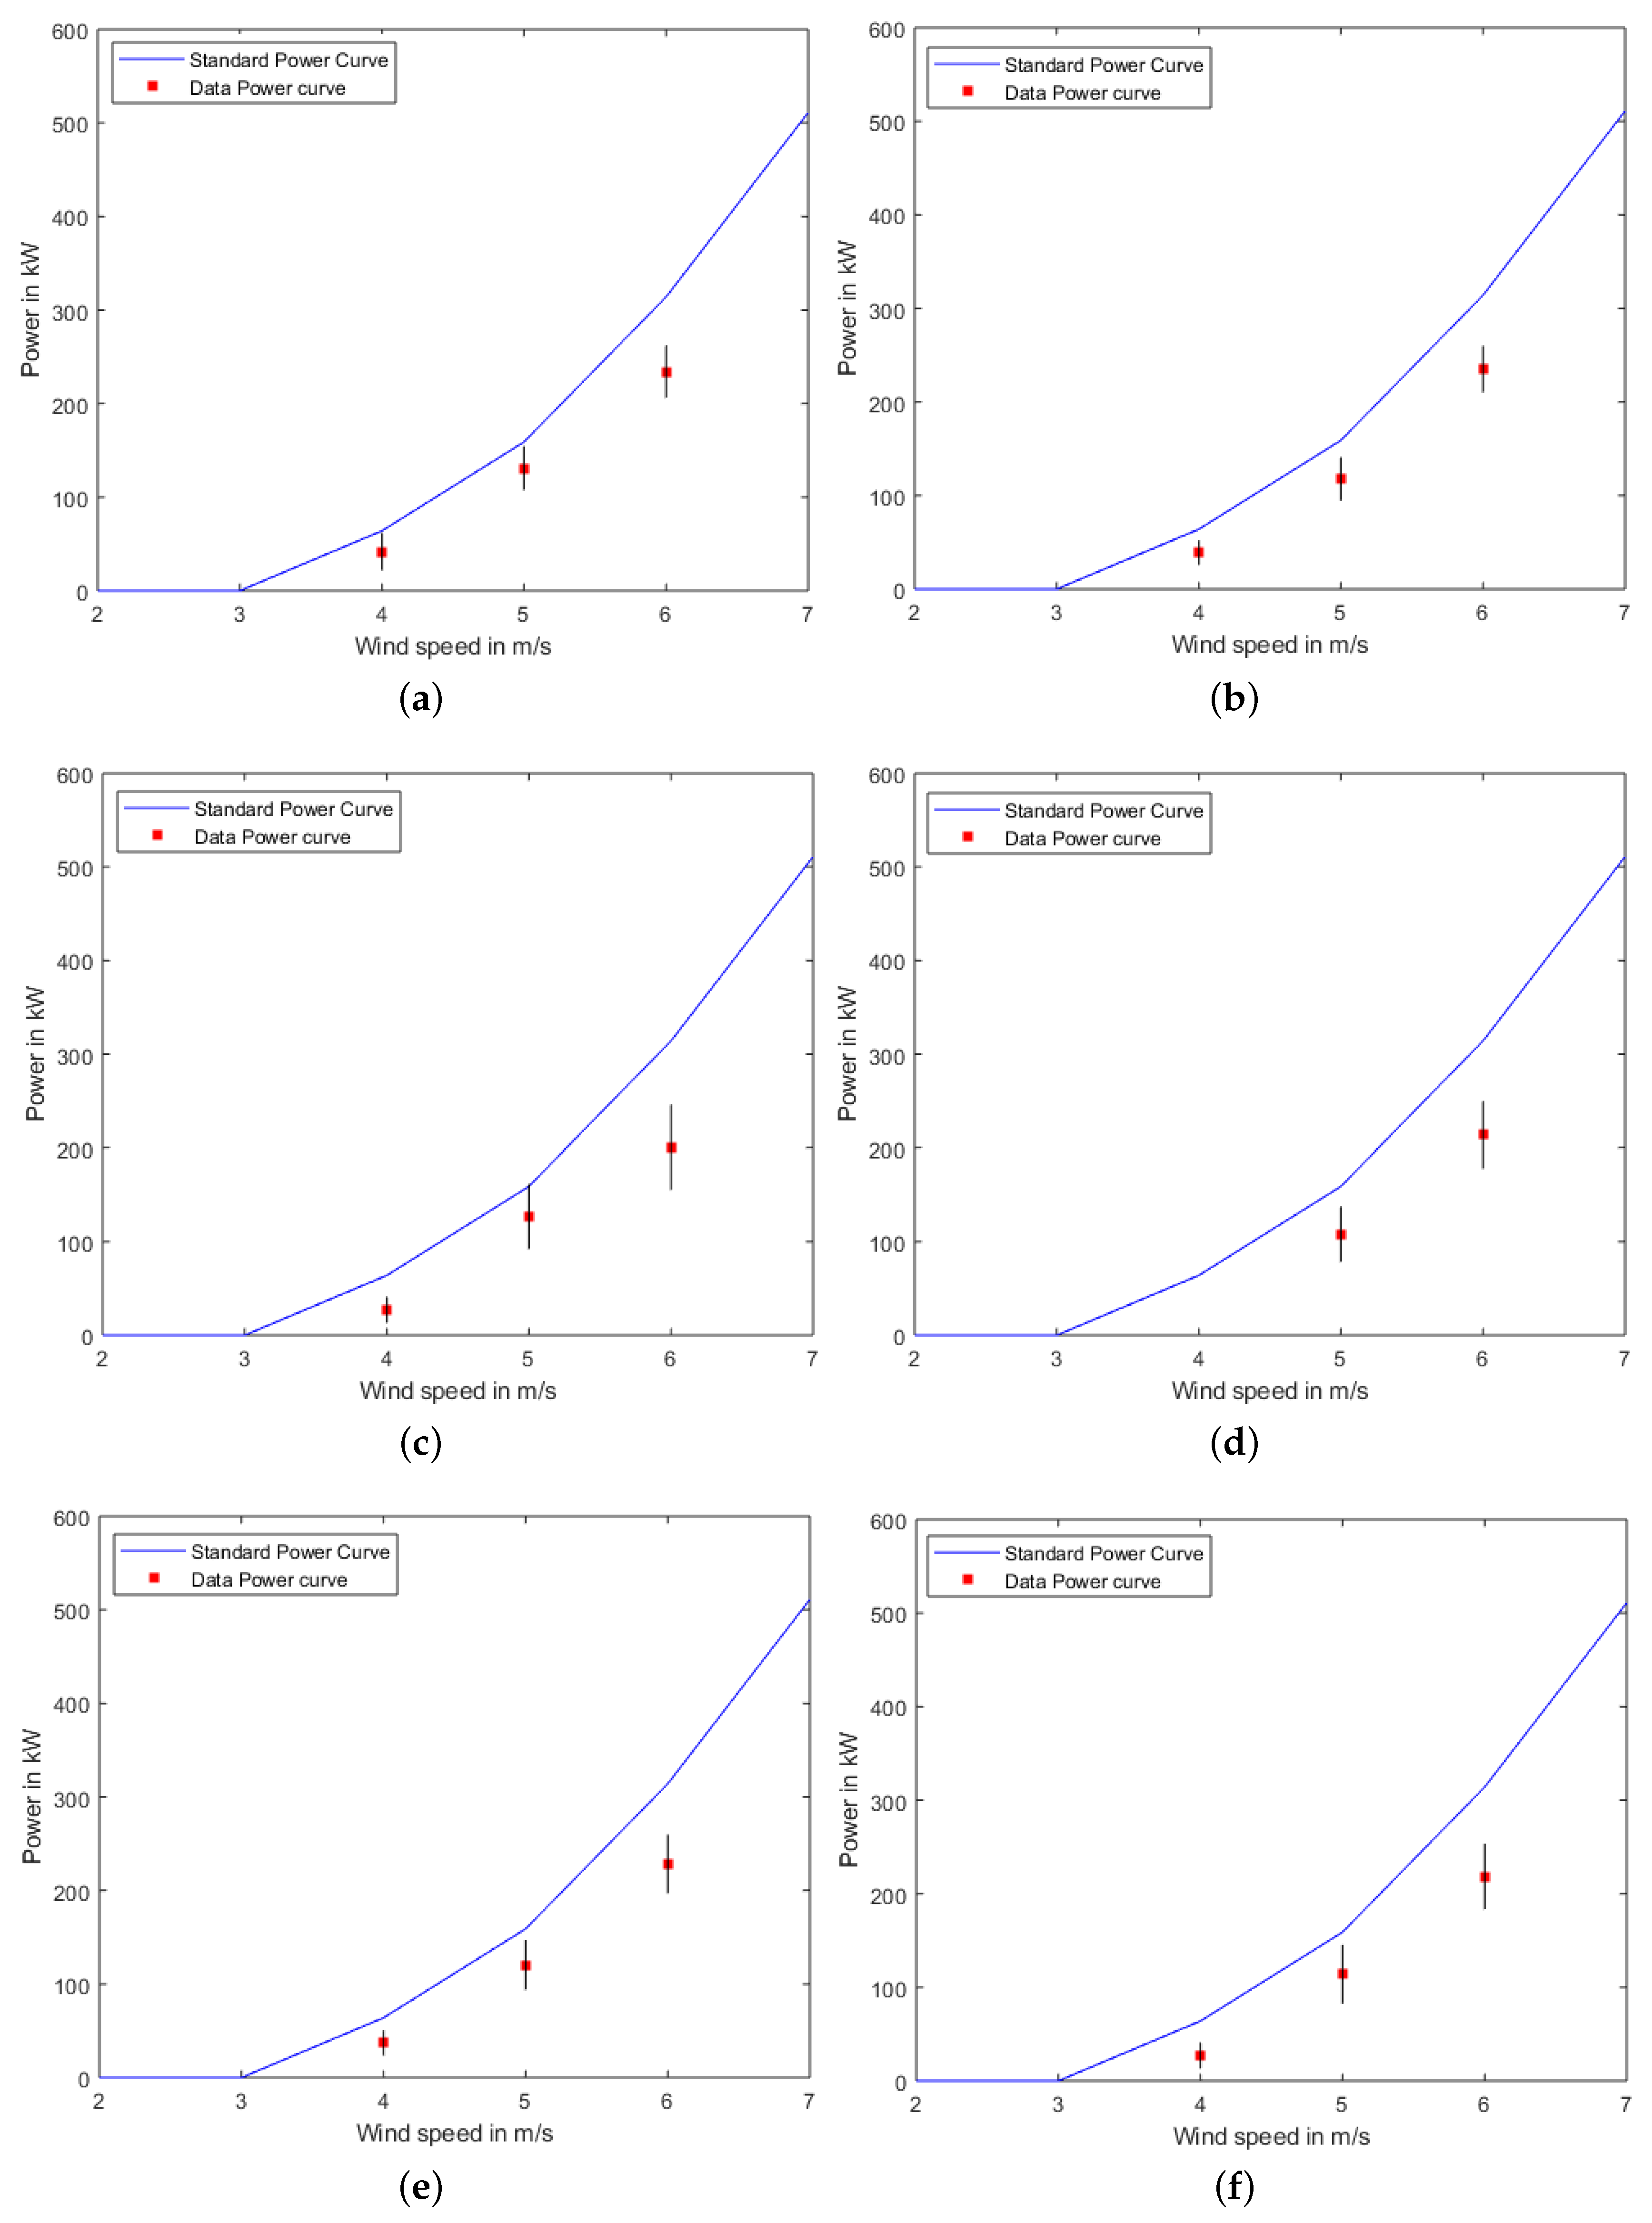
This section presents results and analyses based on field data. The impact of on SMV6 production is presented in Figure 7. For simplicity, the direction of rotation of yaw was neglected e.g., 0° to 5° and 0° to −5° are analysed together for assessing the impact of on SMV6 production.
It was observed that only 4 m/s, 5 m/s and 6 m/s wind speeds in different direction bins have the required number of valid data points as per the criteria devised in Section 4.1. Hence, only these speed bins are analysed. The standard deviations of collected data in different bins are presented in Table 4. The high standard deviation in some of the bins shows scatter of the data and stochastic nature of the wind on site.
5.1. Impact of on SMV6 Production
Power production of a wind turbine can be found using Equation (3) [35]:
where air density is denoted by , r is the rotor radius and v is the wind speed. The impact of on a turbine’s production is quantified using . The exponent of has no physical background and shall be tuned for the best fit using the data [33]. It shall be noted that , therefore yawing in any direction for a given will have the same impact on for a given turbine. For example an ° will have the same impact as ° on .
To quantify the impact of on SMV6 power production, different values of n, within a range of 1 to 10, were evaluated. For presentation purposes, results only for even numbers (2 to 10) are shown in Table 5. The standard power in column 3 of Table 5 is actually the greedy condition (°). The 4th column shows the average power production in yawed conditions for a given bin of yaw offsets (column 1). Subsequent columns (5th to 10th) show the impact of yawing on SMV6 production. In each column, the standard power is multiplied by the corresponding and results are matched with the field results (column 3) for correctly quantifying the impact of on power production using n.
It was observed that, for lower , even can not accurately estimate the impact of on SMV6 production. For of 0° to °, estimates the closest to the actual power production, obtained from field data. However, for a higher (≤15° and ≥15°), estimates the impact of with almost 100% accuracy, as can be seen in Table 5. No visible trend was observed between wind speeds and n.
5.2. Impact of on Net Production
Power productions of SMV6 and SMV5 along with net production during normal operations (greedy control) are shown in Table 6. SCADA data from 2013–2015 is used in obtaining these results. Wind speed is obtained using the power curve and power production instead of nacelle anemometers to get accurate results. Pitch angle was used to obtain the . It was made sure that only that data is used where turbines are operating normally. This table is used for comparing the results obtained during the experiment. Therefore, only those speed and direction bins are shown in Table 6, which have a significant number of data points (at least 5) during the experiment after applying the filtering criteria given in Section 4.1.
SMV6 and SMV5 productions obtained during the experiment are presented in Table 6. The applied on SMV6 along with the direction and speed bin are also presented. It shall be noted again that results are presented only for those bins where a significant number of data points are available for analyses. The light blue shaded and italicized cells represent those instances where net production increase was observed relative to the greedy operations. Cells highlighted light red and bold are the instances where decrease in net production was observed as compared to greedy operations. Results in each of the four direction bins given in Table 6 are discussed as follows.
5.2.1. 180°–190°
It is shown in Figure 5 that SMV5 is under negligible wake effects of SMV6. The optimised for this direction bin is 0°, as the greedy control produces the maximum net production. Yawing will only reduce production of SMV6, which will negatively impact the net production as can be seen in Table 6. Significant data only for 4 m/s and 5 m/s with for this direction bin was available. Comparing the results in Table 6 for this direction bin, it can be observed that, for the given applied on SMV6, net production decreases by almost 12% and 13%, respectively, for 4 m/s and 5 m/s.
5.2.2. 191°–200°
SMV5 is under partial wake effects of SMV6 in the direction bin 191°–200°. As per Table 3, an increase of up to 5.5% is possible with optimised in net production of SMV6 and SMV5. A significantly higher (°) produces an increase of more than 3% in net production of the two experiment turbine at 6 m/s. More than 4% net production increase was observed at 5 m/s and 6 m/s with lower (−5° to −10°). Similarly, net increase was also observed for −10° to −15°. These results are mostly in confirmation with the results obtained with simulations using optimised strategies in Section 4.2.
5.2.3. 201°–210°
SMV5 is under full or near-full wake effects in this wind direction bin. Though SMV5 production was increased in all the cases, net production decrease is observed in most of the cases. Only for an ° at 6 m/s was an increase of around 1% observed. This shows that, for most of the cases, the gain in SMV5 production could not compensate for the loss in SMV6 production. The only case of increase in net production confirms the point that a larger can skew the wake away in full wake conditions significantly from SMV5, producing increase in net production. Lower , however, increases SMV5 production, yet, at the same time, decreases production of SMV6 significantly, resulting in decreased net production.
According to [28], negative applied on the upstream turbine does not cause increases in net power production, whereas a positive does. It means that a positive at SVM6 should cause a large power increase at SVM5, whereas a negative yaw angle of the same magnitude but negative at SVM6 should cause a smaller power increase at SVM5, which can result in net loss. This can be observed in Table 6 in the 201°–210° wind direction bin at 6 m/s, where positive in the range of 5°–10° gives a net gain (blue) while the negative in the range of ° to ° gives a loss (red).
5.2.4. 211°–220°
SMV5 experiences partial wake effects created by SMV6 in this direction bin. It was observed in simulations in [23] that wake produced by SMV6 intersects a greater swept area of SMV5 in this direction bin as compared to the 191°–200°. This can also be seen in Figure 6. Therefore, higher of up to 13° is required to optimally skew the wake away from SMV5 as can be seen in Table 3. It shall be noted that negative increases the wake effects on SMV5 as the wake is moved towards the swept area of SMV5. Therefore, in both the valid speed bins in Table 6, not only is SMV6 production decreased (because of ), but SMV5 production is also decreased as wake effects have increased. This results in net production decrease of up to 20%.
6. Conclusions
This work presented practical implementation of yaw based coordinated control as a part of the SmartEOLE project, using a two-turbine setup. The upstream turbine (SMV6) was operated with fixed (−12°) and 8° in a selected direction sector (180°–220°). The yaw-error was added to the given for calculating the actual applied on SMV6. Wind direction bin of °, wind speed bin of 5 m/s and yaw offset bin of ° was used in analyses. It is assumed that the impact of each bin remains constant on SMV6 and SMV5 production, hence net production.
The optimised were determined using the intelligent control strategies based on particle swarm optimisation and a turbulence intensity based Jensen model. The optimal control strategy predicted an increase of more than 5% in net production with an in the range of ° to 15°. The optimised control strategies suggest that lower is required in partial wake conditions for skewing wake away from downstream turbine(s). In case of full wakes, an up to 15° is required for net production increase.
Data filtering was applied on the SCADA data obtained during the experiment. The data was filtered using wind direction, wind speed and yaw offset bins. This three-level filtering reduces the number of valid data points for significant statistical analyses. The criteria was set to have at least five valid data points after applying the filters.
The impact of on the yawed turbine (SMV6) was quantified evaluating different exponents of in Table 5. It was observed that, for lower (°), an exponent of 10 can relatively better estimate the impact. For higher (°), an exponent of 6 estimates the impact of yaw offset on SMV6 production with almost 100% accuracy.
Analyses of real-time SCADA data obtained during the experiment are presented by comparing it with the results obtained using SCADA data (of two years) based on greedy control. A total of 13 cases were observed with different yaw offsets. Increase in net production was observed in six cases. Some of the cases yield production increase of more than 4% relative to greedy control. Seven cases resulted in decrease in net production. It was observed that, in the case of full or near-full wake effects, lower resulted in decreased net production. This is because SMV5 could not benefit enough (in terms of production gain) from the wake skewed by the yawed SMV6.
Results based on optimised simulations show net gains in the range of 2% to 5.5%. It shall be noted that optimised simulations will not show a decrease in net production. If no increase is possible in net production, then the turbines operate greedily, showing zero gain/loss in net production. The field results show losses of up to 13% in net production, while net gains of up to 4% was observed in favorable conditions. It is assumed that the reason for the inconsistency is that, at lower wind speeds, wakes’ effects are low and there is no significant advantage in yawing the upstream turbine.
It is concluded that yaw based coordinated strategies are beneficial in partial wake conditions. Lower is required for skewing the wake away in such cases, which is overall beneficial for economic performance of the wind farm. In full or near-full wake conditions, higher can redirect the wake away optimally for increasing net production. No visible pattern or relationship was observed between the wind speed and skew angle due to the limited volume of data. In the future, the impact on fatigue loads will be analyzed. Multi-objective coordinated control will be performed for not only increasing the net production but also decreasing fatigue loads on the wind turbines.
Author Contributions
This work is primarily based on the PhD research work of T.A. at Durham University, UK. This PhD work was supervised by P.C.M. and B.K. A.B. and M.A. provided support in drafting the paper at USPCAS-E UET Peshawar, Pakistan. O.C. and N.G. designed the experimental setup and provided field data. The SMV wind farm is owned by Maiä Eolis (now Engie Green).
Funding
The authors would like to thank the French National Project SMARTEOLE (ANR-14-CE05-0034), the Commonwealth Scholarships Commission UK (PKCS-2013-384) and the US Pakistan Center for Advance Studies in Energy (USPCAS-E), University of Engineering and Technology (UET) Peshawar, Pakistan.
Conflicts of Interest
The authors declare no conflict of interest.
Abbreviations
The following abbreviations are used in this manuscript:
| SMV | Le Sole de Moulin Vieux |
| CFD | Computational Fluid Dynamics |
| m/s | meter per second |
| kW | kilo Watt |
| MW | Mega Watt |
| ECN | Energy Research Center of the Netherlands |
| SOWFA | Simulator fOr Wind Farm Applications |
| FLORIS | FLOw Redirection and Induction in Steady-state |
| GA | Genetic Algorithm |
| PSO | Particle Swarm Optimisation |
| SCADA | Supervisory Control And Data Acquisition |
| TI-JM | Turbulence Intensity based Jensen Model |
References
- Ahmad, T.; Coupiac, O.; Pettit, A.; Guignard, S.; Girard, N.; Kazemtabrizi, B.; Matthews, P. Field Implementation and Trial of Coordinated Control of Wind Farms. IEEE Trans. Sustain. Energy 2018, 9, 1169–1176. [Google Scholar] [CrossRef]
- Ahmad, T.; Basit, A.; Anwar, J.; Coupiac, O.; Kazemtabrizi, B.; Matthews, P. Fast Processing Intelligent Wind Farm Controller for Production Maximisation. Energies 2019, 12, 544. Available online: https://www.mdpi.com/1996-1073/12/3/544/htm (accessed on 17 February 2019). [CrossRef]
- Njiri, J.G.; Söffker, D. State-of-the-art in wind turbine control: Trends and challenges. Renew. Sustain. Energy Rev. 2016, 60, 377–393. [Google Scholar] [CrossRef]
- Wagenaar, J.; Machielse, L.; Schepers, J. Controlling wind in ECN’s scaled wind farm. Proc. Eur. Prem. Wind Energy Event 2012, 1, 685–694. [Google Scholar]
- Michael, K.; Lixian, L.; Parveen, R.; Nilabh, S. Wind Farm Wake Loss Analysis and Mitigation Techniques. 2017. Available online: https://pdfs.semanticscholar.org/presentation/14a3/eaccbd0b611a38239f6dcd0dadd9396e8a84.pdf (accessed on 17 February 2019).
- Gebraad, P.; Teeuwisse, F.; Van Wingerden, J.; Fleming, P.A.; Ruben, S.; Marden, J.; Pao, L. Wind plant power optimization through yaw control using a parametric model for wake effects—A CFD simulation study. Wind Energy 2016, 19, 95–114. [Google Scholar] [CrossRef]
- Song, D.; Yang, J.; Fan, X.; Liu, Y.; Liu, A.; Chen, G.; Joo, Y.H. Maximum power extraction for wind turbines through a novel yaw control solution using predicted wind directions. Energy Convers. Manag. 2018, 157, 587–599. [Google Scholar] [CrossRef]
- Park, J.; Law, K.H. A data-driven, cooperative wind farm control to maximize the total power production. Appl. Energy 2016, 165, 151–165. [Google Scholar] [CrossRef]
- Bossanyi, E. Combining induction control and wake steering for wind farm energy and fatigue loads optimisation. J. Phys. Conf. Ser. 2018, 1037, 032011. [Google Scholar] [CrossRef] [Green Version]
- Thøgersen, E.; Tranberg, B.; Herp, J.; Greiner, M. Statistical meandering wake model and its application to yaw-angle optimisation of wind farms. J. Phys. Conf. Ser. 2017, 854, 012017. [Google Scholar] [CrossRef] [Green Version]
- Franke, C.; Kulkarni, K.; Timbus, A.; Poland, J.; Mastellone, S.; Zhang, Y. Optimal Wind Farm Operation. U.S. Patent 15,631,783, 5 October 2017. [Google Scholar]
- Marden, J.R.; Ruben, S.D.; Pao, L.Y. A model-free approach to wind farm control using game theoretic methods. IEEE Trans. Control Syst. Technol. 2013, 21, 1207–1214. [Google Scholar] [CrossRef]
- Marden, J.R.; Ruben, S.D.; Pao, L.Y. Surveying game theoretic approaches for wind farm optimization. In Proceedings of the AIAA Aerospace Sciences Meeting, Nashville, TN, USA, 9–12 January 2012; pp. 1–10. [Google Scholar]
- Annoni, J.; Gebraad, P.M.; Scholbrock, A.K.; Fleming, P.A.; van Wingerden, J.W. Analysis of axial-induction- based wind plant control using an engineering and a high-order wind plant model. Wind Energy 2015, 19, 1135–1150. [Google Scholar] [CrossRef]
- Fleming, P.; Gebraad, P.M.; Lee, S.; van Wingerden, J.W.; Johnson, K.; Churchfield, M.; Michalakes, J.; Spalart, P.; Moriarty, P. Simulation comparison of wake mitigation control strategies for a two-turbine case. Wind Energy 2015, 18, 2135–2143. [Google Scholar] [CrossRef]
- Fleming, P.A.; Gebraad, P.M.; Lee, S.; van Wingerden, J.W.; Johnson, K.; Churchfield, M.; Michalakes, J.; Spalart, P.; Moriarty, P. Evaluating techniques for redirecting turbine wakes using SOWFA. Renew. Energy 2014, 70, 211–218. [Google Scholar] [CrossRef]
- Bay, C.J.; Annoni, J.; Taylor, T.; Pao, L.; Johnson, K. Active power control for wind farms using distributed model predictive control and nearest neighbor communication. In Proceedings of the 2018 Annual American Control Conference (ACC), Milwaukee, WI, USA, 27–29 June 2018; pp. 682–687. [Google Scholar]
- Fleming, P.; Annoni, J.; Churchfield, M.; Martinez-Tossas, L.A.; Gruchalla, K.; Lawson, M.; Moriarty, P. A Simulation Study Demonstrating the Importance of Large-Scale Trailing Vortices in Wake Steering; Technical Report; National Renewable Energy Lab. (NREL): Golden, CO, USA, 2018.
- Annoni, J.; Bay, C.; Taylor, T.; Pao, L.; Fleming, P.; Johnson, K. Efficient optimization of large wind farms for real-time control. In Proceedings of the 2018 Annual American Control Conference (ACC), Milwaukee, WI, USA, 27–29 June 2018; pp. 6200–6205. [Google Scholar]
- González, J.S.; Payán, M.B.; Santos, J.R.; Rodríguez, Á.G.G. Maximizing the overall production of wind farms by setting the individual operating point of wind turbines. Renew. Energy 2015, 80, 219–229. [Google Scholar] [CrossRef]
- Knudsen, T.; Bak, T.; Svenstrup, M. Survey of wind farm control power and fatigue optimization. Wind Energy 2014, 18, 1333–1351. [Google Scholar] [CrossRef]
- Munters, W.; Meyers, J. Optimal dynamic induction and yaw control of wind farms: Effects of turbine spacing and layout. J. Phys. Conf. Ser. 2018, 1037, 032015. [Google Scholar] [CrossRef]
- Ahmad, T. Wind Farm Coordinated Control and Optimisation. Ph.D. Thesis, School of Engineering & Computing Sciences, Durham University, Durham, UK, 2017. Available online: http://etheses.dur.ac.uk/12323/1/Tanvir_Thesis_Final_Submission.pdf (accessed on 17 February 2019).
- Gebraad, P.; Thomas, J.J.; Ning, A.; Fleming, P.; Dykes, K. Maximization of the annual energy production of wind power plants by optimization of layout and yaw-based wake control. Wind Energy 2017, 20, 97–107. [Google Scholar] [CrossRef]
- Munters, W.; Meyers, J. Dynamic strategies for yaw and induction control of wind farms based on large-eddy simulation and optimization. Energies 2018, 11, 177. [Google Scholar] [CrossRef]
- Fleming, P.; Annoni, J.; Shah, J.J.; Wang, L.; Ananthan, S.; Zhang, Z.; Hutchings, K.; Wang, P.; Chen, W.; Chen, L. Field test of wake steering at an offshore wind farm. Wind Energy Sci. 2017, 2, 229–239. [Google Scholar] [CrossRef] [Green Version]
- Raach, S.; Schlipf, D.; Cheng, P.W. Lidar-based wake tracking for closed-loop wind farm control. J. Phys. Conf. Ser. 2016, 753, 052009. [Google Scholar] [CrossRef] [Green Version]
- Fleming, P.; Churchfield, M.; Scholbrock, A.; Clifton, A.; Schreck, S.; Johnson, K.; Wright, A.; Gebraad, P.; Annoni, J.; Naughton, B.; et al. Detailed field test of yaw-based wake steering. J. Phys. Conf. Ser. 2016, 753, 052003. [Google Scholar] [CrossRef] [Green Version]
- Fleming, P.; Annoni, J.; Scholbrock, A.; Quon, E.; Dana, S.; Schreck, S.; Raach, S.; Haizmann, F.; Schlipf, D. Full-scale field test of wake steering. J. Phys. Conf. Ser. 2017, 854, 012013. [Google Scholar] [CrossRef]
- Senvion MM82 [50 Hz/2050 kW] Product Description; Senvion Wind Energy Solutions, Senvion GmbH: Hamburg, Germany, 2018. Available online: www.senvion.com/global/en/wind-energy-solutions/wind-turbines/mm/mm82/ (accessed on 17 February 2019).
- Coupiac, O. Four Vertical Extrapolation Methods. Wind. Int. 2016, 12, 5–8. [Google Scholar]
- Nielsen, P.; Villadsen, J.; Kobberup, J.; Madsen, P.; Jacobsen, T.; Thøgersen, M.L.; Sørensen, M.V.; Sørensen, T.; Svenningsen, L.; Motta, M.; et al. WindPRO 2.7 User Guide, 3rd ed.; EMD International A/S: Aalborg, Denmark, 2010. [Google Scholar]
- Boorsma, K. Power and Loads for Wind Turbines in Yawed Conditions; Technical Report ECN-E-12-047; ECN: Petten, The Netherlands, 2012. [Google Scholar]
- Boorsma, K. Heat and Flux. Analysis of Field Measurements; Technical Report ECN-E–12-048; ECN: Petten, The Netherlands, 2012. [Google Scholar]
- Park, J.; Kwon, S.; Law, K.H. Wind farm power maximization based on a cooperative static game approach. In Proceedings of the SPIE Smart Structures and Materials + Nondestructive Evaluation and Health Monitoring, San Diego, CA, USA, 10–14 March 2013; International Society for Optics and Photonics. 2013; p. 86880R. Available online: https://pdfs.semanticscholar.org/8fa6/c5709a61edd3a54e9a09303086fa93d73e2d.pdf (accessed on 1 April 2019).
Figure 1.
Le Sole de Moulin Vieux (SMV) layout.
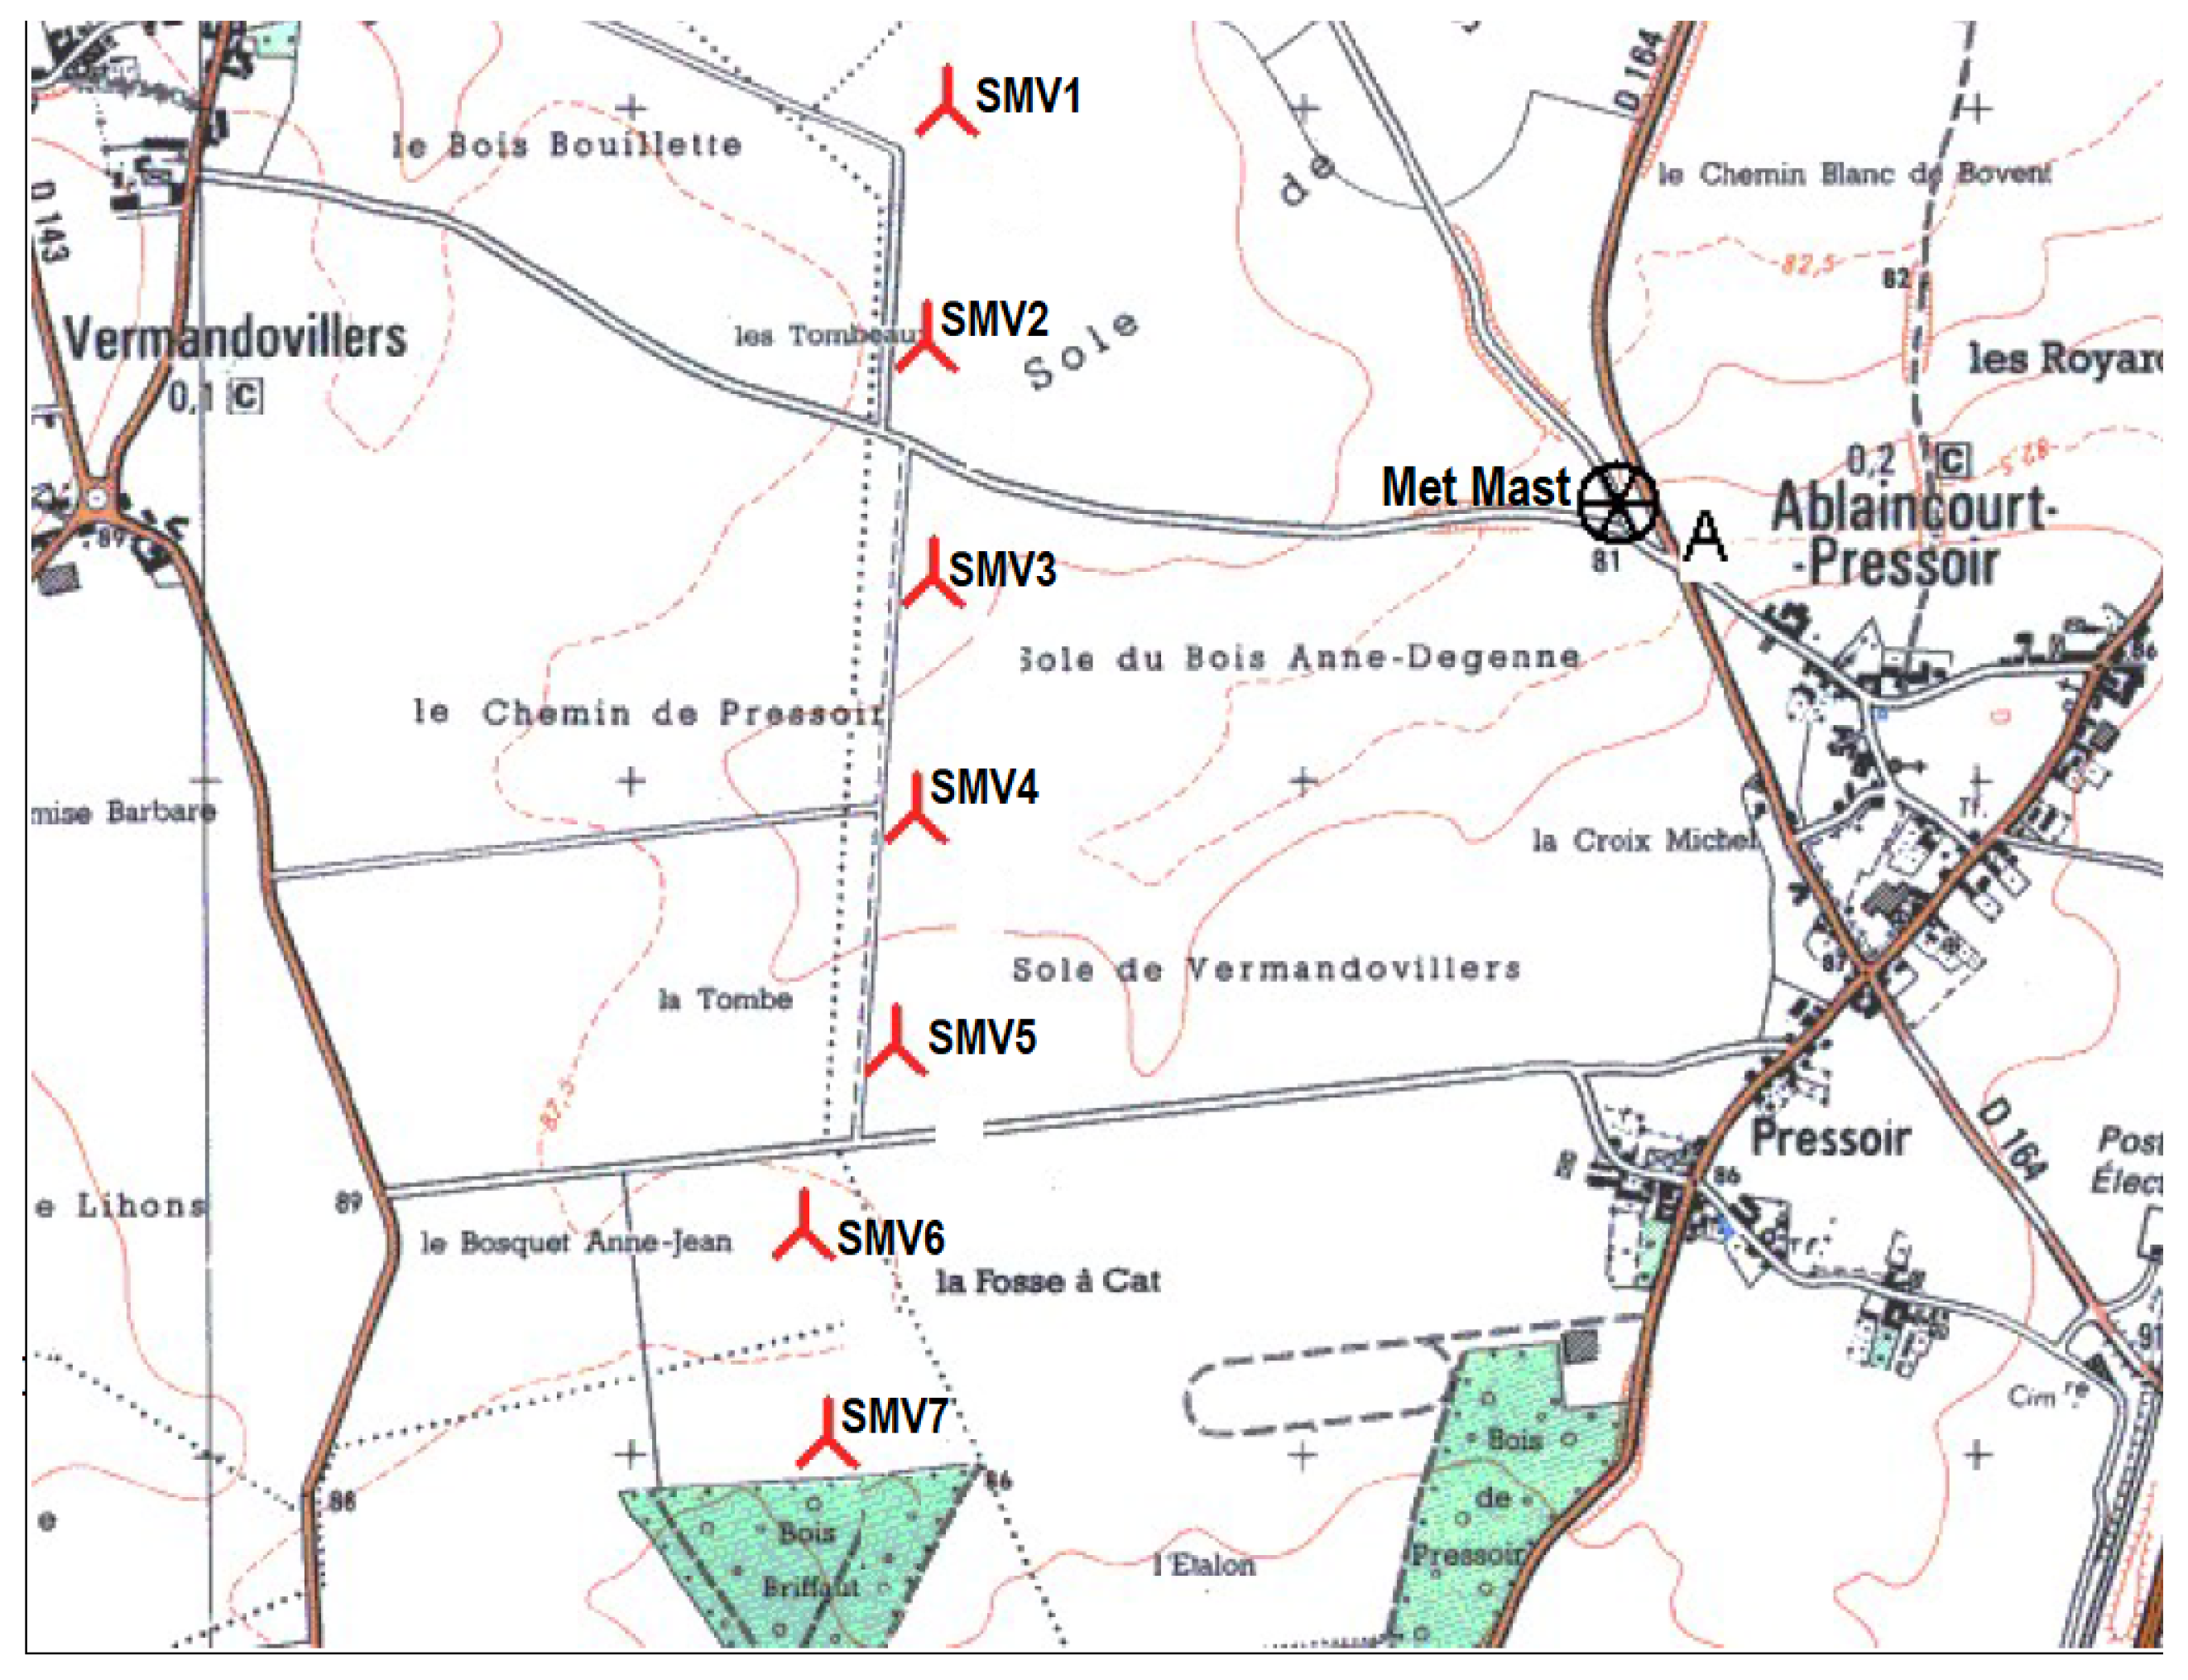
Figure 2.
Senvion MM82-2050 kW turbine operational characteristics.
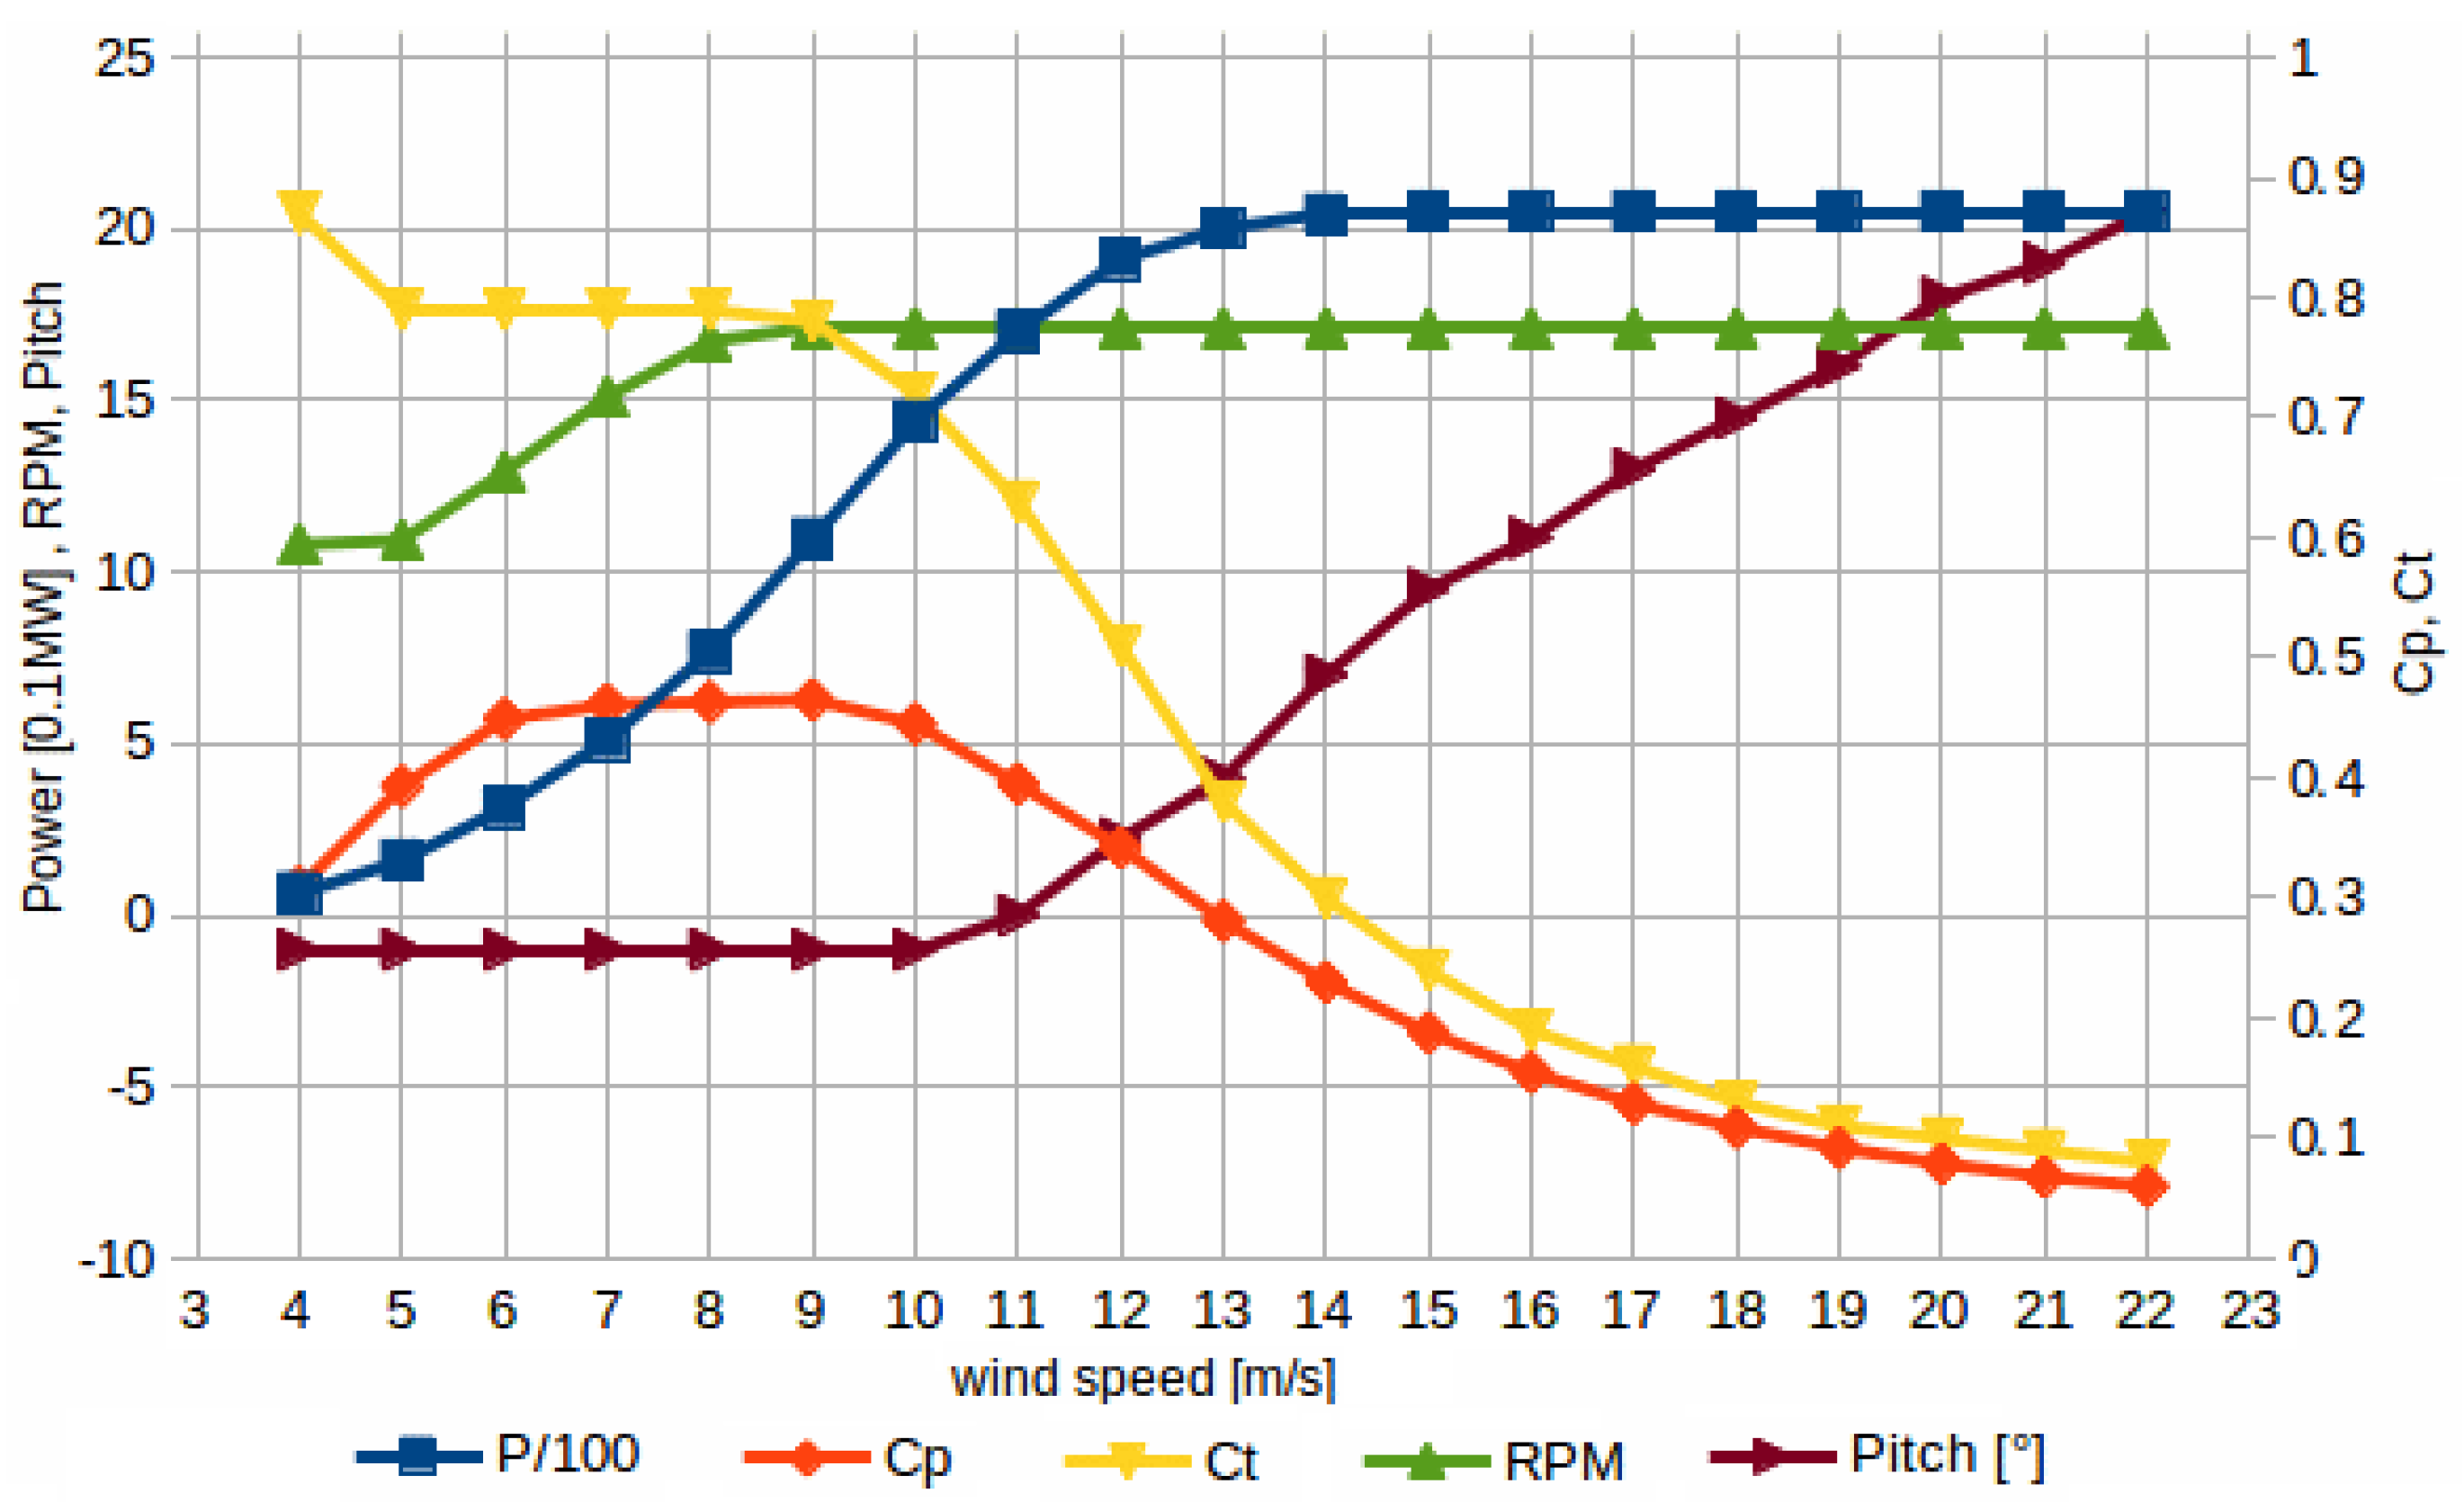
Figure 3.
Wind conditions, when yaw offsets were applied on SMV6. This windrose is based on the wind characteristics as measured by the met mast at 80 m height.
Figure 3.
Wind conditions, when yaw offsets were applied on SMV6. This windrose is based on the wind characteristics as measured by the met mast at 80 m height.

Figure 4.
PSO flowchart for estimating optimised .
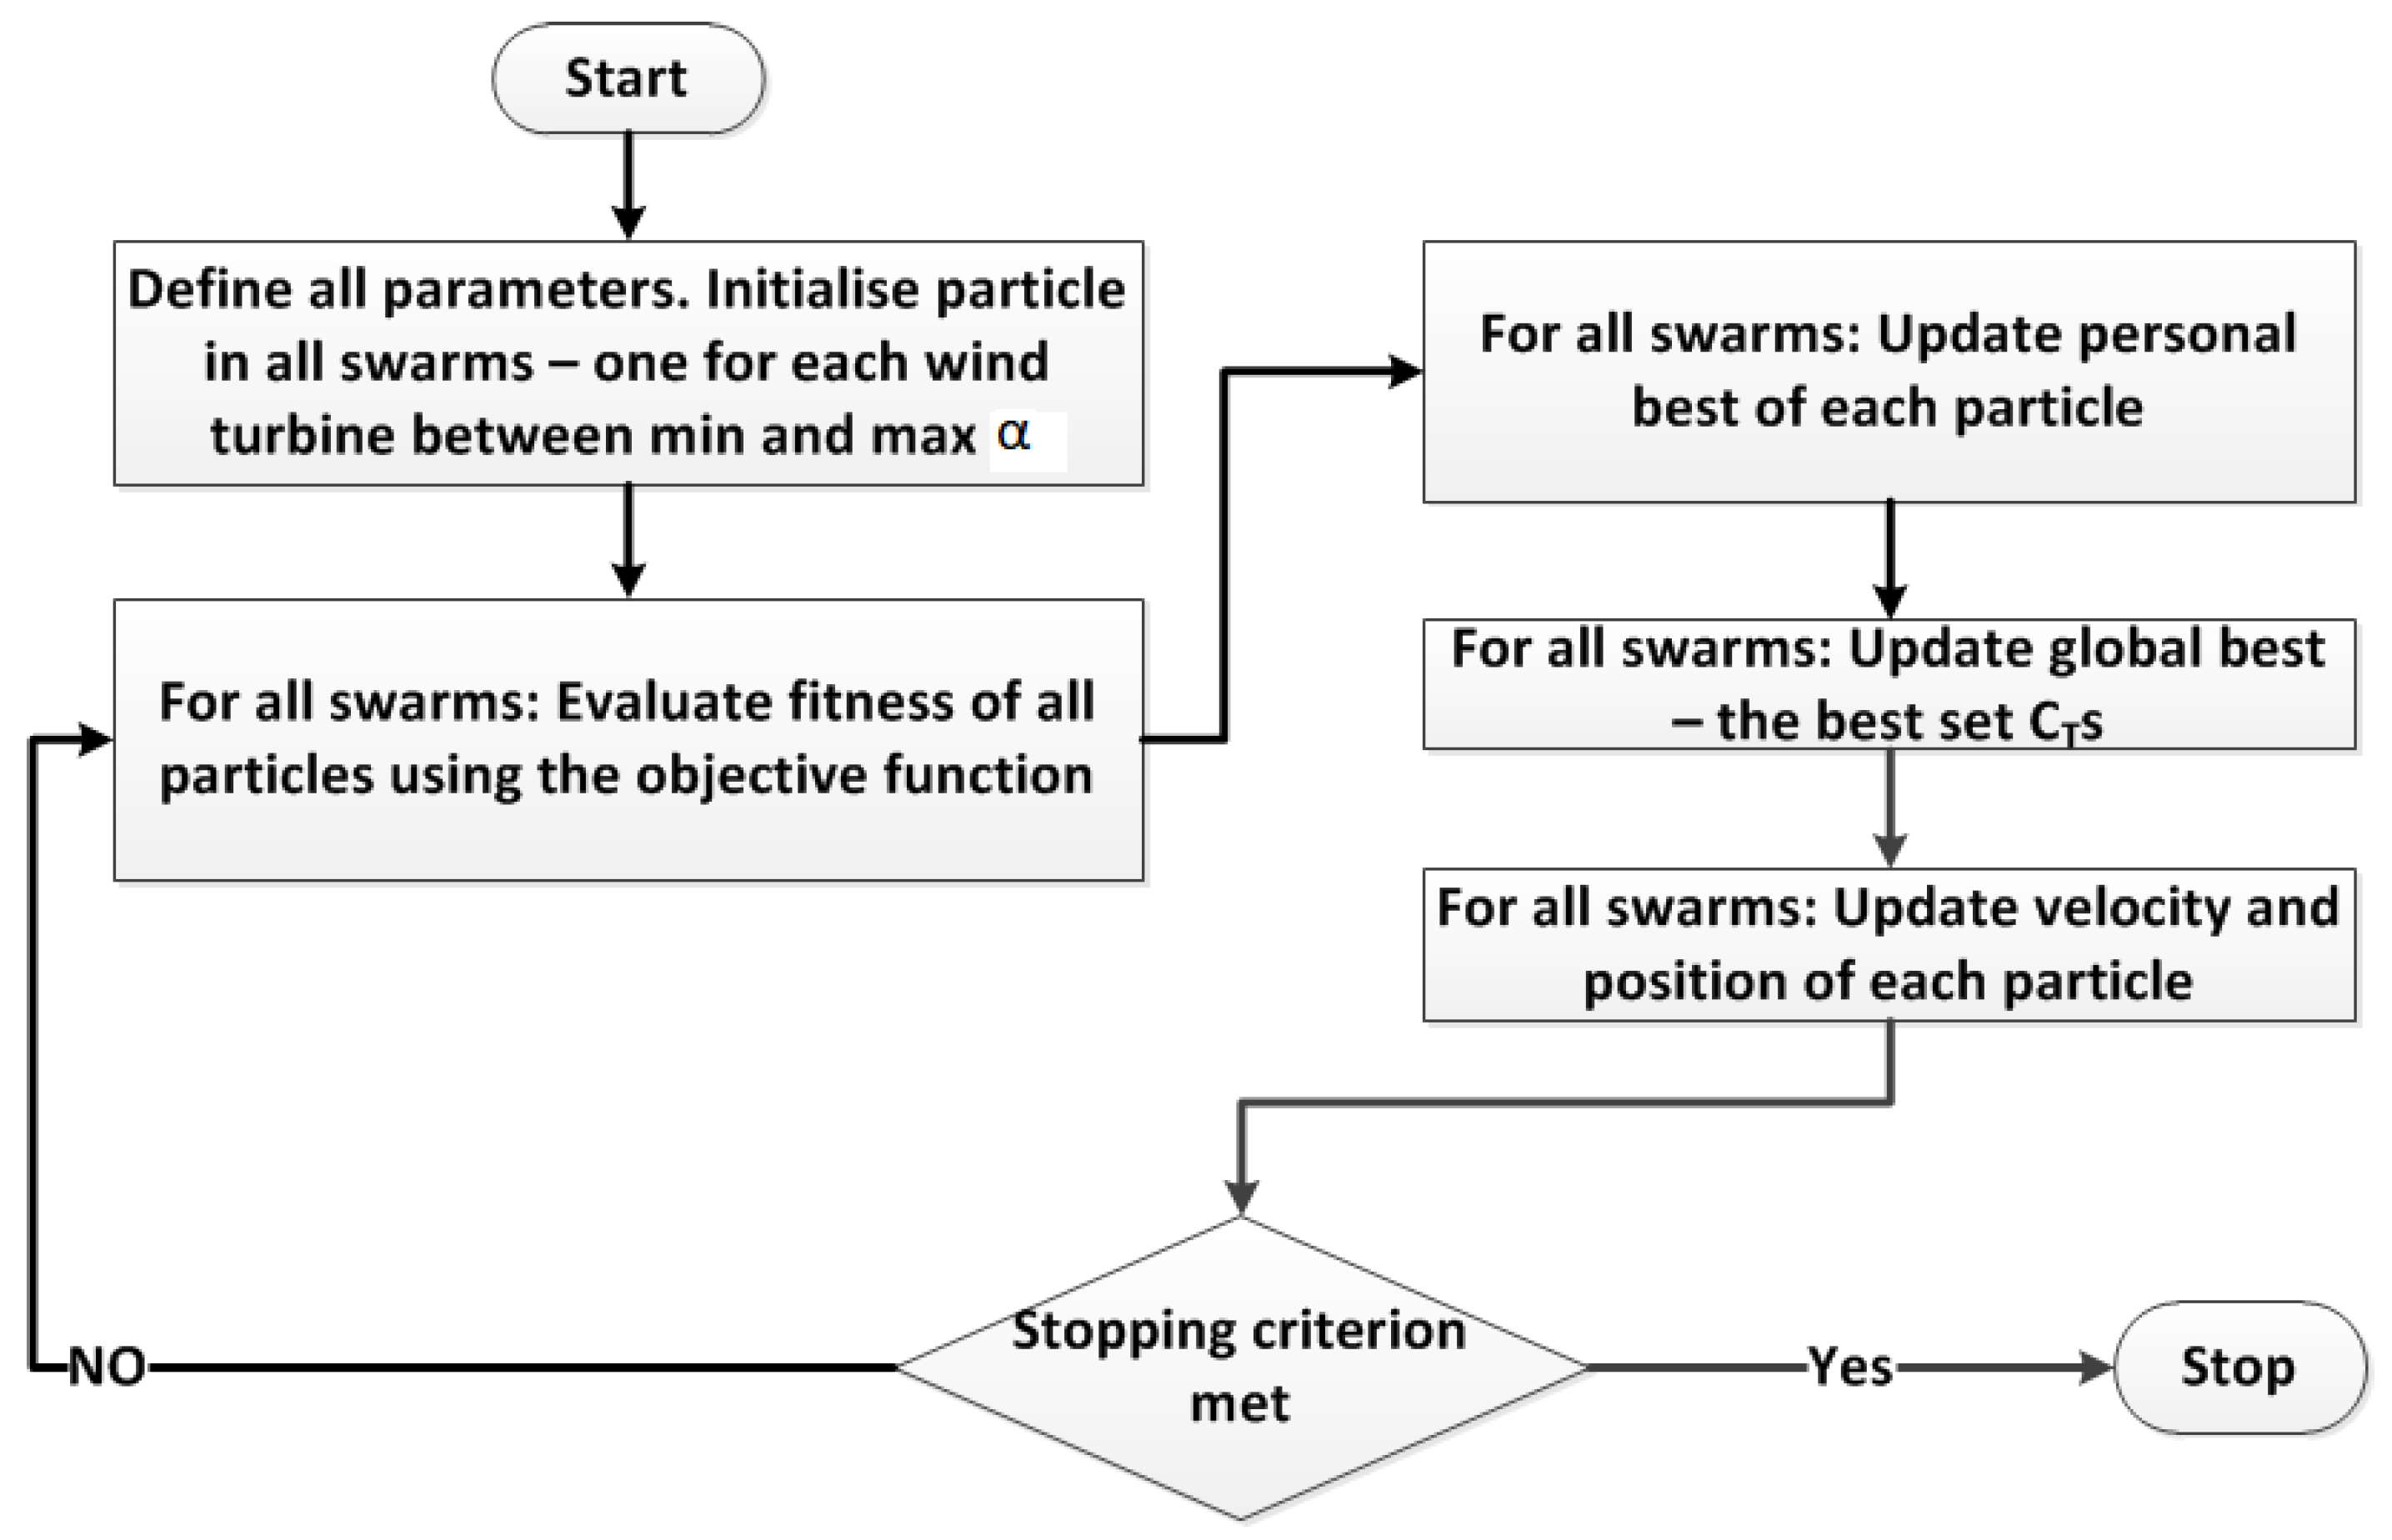
Figure 5.
Wake effects of SMV6 on SMV5 in (a) 180°–185°; (b) 186°–190°.

Figure 6.
Simulated comparison of greedy and optimised control strategies in partial and full wake conditions (a) 196°–200° Greedy; (b) 196°–200° Optimised; (c) 206°–210° Greedy; (d) 206°–210° Optimised; (e) 211°–215° Greedy; (f) 211°–215° Optimised.
Figure 6.
Simulated comparison of greedy and optimised control strategies in partial and full wake conditions (a) 196°–200° Greedy; (b) 196°–200° Optimised; (c) 206°–210° Greedy; (d) 206°–210° Optimised; (e) 211°–215° Greedy; (f) 211°–215° Optimised.

Figure 7.
SMV6 production in yawed conditions with standard deviations (a) ; (b) 5° to 10° and ° to °; (c) 10 to 15 and ° to °; (d) or ; (e) 5° to 15° and ° to °; (f) 10° to 20° and ° to °.
Figure 7.
SMV6 production in yawed conditions with standard deviations (a) ; (b) 5° to 10° and ° to °; (c) 10 to 15 and ° to °; (d) or ; (e) 5° to 15° and ° to °; (f) 10° to 20° and ° to °.


Table 1.
Senvion MM82-2050 kW turbine characteristics.
| Characteristic | Value |
|---|---|
| Rated output (kW) | 2050 |
| Rotor diameter (m) | 82 |
| Hub height (m) | 80 |
| Max | 0.465 |
| Rated wind speed (m/s) | 12.5 |
| Cut-in wind speed (m/s) | 3.5 |
| Cut-off wind speed (m/s) | 25 |
Table 2.
Number of valid SCADA data points in different direction and speed bins as measured by met mast at 80 m height and wind turbines, at a 10 min interval (before filtering).
Table 2.
Number of valid SCADA data points in different direction and speed bins as measured by met mast at 80 m height and wind turbines, at a 10 min interval (before filtering).
| Wind Speed m/s | 180°–190° | 191°–200° | 201°–210° | 211°–220° |
|---|---|---|---|---|
| 4 | 81 | 86 | 12 | 12 |
| 5 | 8 | 6 | 25 | 57 |
| 6 | 1 | 7 | 62 | 82 |
| 7 | 4 | 5 | 47 | 33 |
| 8 | 3 | 2 | 23 | 14 |
| 9 | 1 | 1 | 22 | 20 |
| 10 | 1 | 2 | 8 | 18 |
| 11 | 0 | 4 | 0 | 3 |
| 12 | 0 | 0 | 0 | 0 |
| ≥13 | 0 | 4 | 0 | 0 |
Table 3.
Optimum and % estimated simulated increase in production as compared to the greedy control.
Table 3.
Optimum and % estimated simulated increase in production as compared to the greedy control.
| Wind Speed | 190°–195° | 196°–200° | 201°–205° | 206°–210° | 211°–215° | 216°–220° | ||||||
|---|---|---|---|---|---|---|---|---|---|---|---|---|
| ° | % Increase | ° | % Increase | ° | % Increase | ° | % Increase | ° | % Increase | ° | % Increase | |
| 5 | −6 | 2.1 | −7 | 5 | −8 | 1.5 | 10 | 2.3 | 6 | 5.5 | 10 | 2.1 |
| 6 | −6 | 2.7 | −8 | 5 | −9 | 2.4 | 10 | 2 | 7 | 5.3 | 11 | 3.3 |
| 7 | −6 | 3.7 | −8 | 5.2 | −10 | 2.1 | 15 | 2.5 | 7 | 5.4 | 13 | 3 |
| 8 | −6 | 3.4 | −8 | 5.2 | −10 | 1 | 15 | 3.1 | 11 | 5.4 | 13 | 2.9 |
| 9 | −6 | 3.7 | −8 | 5.1 | −10 | 1 | 15 | 3.2 | 11 | 4.3 | 12 | 3.1 |
| 10 | −6 | 3.5 | −9 | 5.1 | −10 | 2.3 | 15 | 3.3 | 11 | 5.4 | 12 | 2.5 |
| 11 | −8 | 4 | −9 | 5.5 | −10 | 3.6 | 15 | 4.5 | 11 | 5.4 | 12 | 3.6 |
| 12 | −8 | 4 | −9 | 5.5 | −10 | 3.7 | 15 | 4 | 12 | 5.3 | 12 | 3.8 |
Table 4.
Standard deviations (in kW) of SMV6 SCADA data in different speed bins with yaw offsets during the experiment.
Table 4.
Standard deviations (in kW) of SMV6 SCADA data in different speed bins with yaw offsets during the experiment.
| Wind Speed m/s | 4 | 5 | 6 | |
|---|---|---|---|---|
| Yaw-Angles° | Standard Deviation in kW | |||
| 20.1 | 23.3 | 28.0 | ||
| 5° to 10° and ° to ° | 13.2 | 23.1 | 24.8 | |
| 10° to 15° and ° to ° | - | 34.8 | - | |
| or | - | 29.6 | 35.9 | |
| 5° to 15° and ° to ° | 13.5 | 26.5 | 31.4 | |
| 10° to 20° and ° to ° | - | 31.5 | 35.2 | |
Table 5.
Quantifying impact of yaw offset on SMV6 power production using Equation (3).
Table 5.
Quantifying impact of yaw offset on SMV6 power production using Equation (3).
| Yaw Offset° Applied on SMV6 | Wind Speed m/s | Standard Power kW | Field Data Power kW | |||||
|---|---|---|---|---|---|---|---|---|
| 4 | 64 | 42 | 64 | 63 | 63 | 62 | 62 | |
| 5 | 159 | 131 | 158 | 156 | 155 | 154 | 153 | |
| 6 | 314 | 234 | 312 | 309 | 307 | 305 | 302 | |
| 5° to 10° or ° to ° | 4 | 64 | 39 | 62 | 60 | 58 | 57 | 55 |
| 5 | 159 | 118 | 154 | 150 | 145 | 141 | 136 | |
| 6 | 314 | 235 | 305 | 295 | 286 | 278 | 269 | |
| 10° to 15° or ° to ° | 5 | 159 | 127 | 148 | 138 | 129 | 120 | 112 |
| ° or ° | 5 | 159 | 108 | 140 | 124 | 109 | 97 | 85 |
| 6 | 314 | 214 | 277 | 245 | 216 | 191 | 169 |
Table 6.
Comparison of power productions(kW) of SMV6 and SMV5 obtained with SCADA data during the experiment with greedy control. Light blue shaded and italicized cells: Increase in net production. Light red shaded and bold: Decrease in net production.
Table 6.
Comparison of power productions(kW) of SMV6 and SMV5 obtained with SCADA data during the experiment with greedy control. Light blue shaded and italicized cells: Increase in net production. Light red shaded and bold: Decrease in net production.
| Yaw Offset () | Wind Speed m/s | 180°–190° | 191°–200° | 201°–210° | 211°–220° | ||||||||
|---|---|---|---|---|---|---|---|---|---|---|---|---|---|
| SMV6 | SMV5 | Net | SMV6 | SMV5 | Net | SMV6 | SMV5 | Net | SMV6 | SMV5 | Net | ||
| 0° (Greedy control) | 4 | 62 | 51 | 113 | |||||||||
| 5 | 158 | 140 | 298 | 163 | 128 | 291 | 155 | 119 | 274 | 155 | 132 | 287 | |
| 6 | 321 | 297 | 618 | 320 | 262 | 582 | 317 | 237 | 554 | ||||
| ° to ° | 4 | - | - | - | - | - | 62 | 50 | 112 | - | - | - | |
| 5 | 118 | 145 | 263 | 127 | 174 | 301 | 125 | 140 | 265 | 108 | 125 | 233 | |
| 6 | 235 | 300 | 535 | 260 | 340 | 600 | 260 | 270 | 530 | - | - | - | |
| 5° to 10° | 6 | - | - | - | - | - | - | 235 | 321 | 556 | - | - | - |
| −10° to −15° | 5 | - | - | - | 127 | 176 | 303 | - | - | - | - | - | - |
| ≤−15° | 5 | - | - | - | - | - | - | - | - | - | 108 | 122 | 230 |
| 6 | - | - | - | 314 | 287 | 601 | - | - | - | - | - | - | |
| 15°+ | 6 | - | - | - | - | - | - | 214 | 348 | 562 | - | - | - |
© 2019 by the authors. Licensee MDPI, Basel, Switzerland. This article is an open access article distributed under the terms and conditions of the Creative Commons Attribution (CC BY) license (http://creativecommons.org/licenses/by/4.0/).
Share and Cite
MDPI and ACS Style
Ahmad, T.; Basit, A.; Ahsan, M.; Coupiac, O.; Girard, N.; Kazemtabrizi, B.; Matthews, P.C. Implementation and Analyses of Yaw Based Coordinated Control of Wind Farms. Energies 2019, 12, 1266. https://doi.org/10.3390/en12071266
AMA Style
Ahmad T, Basit A, Ahsan M, Coupiac O, Girard N, Kazemtabrizi B, Matthews PC. Implementation and Analyses of Yaw Based Coordinated Control of Wind Farms. Energies. 2019; 12(7):1266. https://doi.org/10.3390/en12071266
Chicago/Turabian StyleAhmad, Tanvir, Abdul Basit, Muneeb Ahsan, Olivier Coupiac, Nicolas Girard, Behzad Kazemtabrizi, and Peter C. Matthews. 2019. "Implementation and Analyses of Yaw Based Coordinated Control of Wind Farms" Energies 12, no. 7: 1266. https://doi.org/10.3390/en12071266
Note that from the first issue of 2016, this journal uses article numbers instead of page numbers. See further details here.