Design of Permanent-Magnet Linear Generators with Constant-Torque-Angle Control for Wave Power


Division of Electricity, Uppsala University, SE-751 21 Uppsala, Sweden
Energies 2019, 12(7), 1312; https://doi.org/10.3390/en12071312
Submission received: 28 February 2019
/
Revised: 20 March 2019
/
Accepted: 1 April 2019
/
Published: 5 April 2019
(This article belongs to the Special Issue Permanent Magnet Synchronous Machines)
Abstract
:This paper presents a simulation method for direct-drive permanent-magnet linear generators designed for wave power. Analytical derivations of power and maximum damping force are performed based on Faraday’s law of induction and circuit equations for constant-torque-angle control. Knowledge of the machine reactance or the load angle is not needed. An aim of the simulation method is to simplify comparison of the maximum damping force, losses, and cost between different generator designs at an early design stage. A parameter study in MATLAB based on the derived equations is performed and the effect of changing different generator parameters is studied. The analytical calculations are verified with finite element method (FEM) simulations and experiments. An important conclusion is that the copper losses and the maximum damping force are mainly dependent on the rated current density and end winding length. The copper losses are inherently large in a slow-moving machine so special consideration should be taken to decrease the end winding length. It is concluded that the design of the generator becomes a trade-off between material cost versus high efficiency and high maximum damping force.
Keywords:
coils; design tools; energy efficiency; linear generator; power control; stator; wave power1. Introduction
Wave power has been studied for many years but there are still only a few realized commercial projects [1]. Many different types of wave energy converters exist and one of the most common is a point absorber. Alternative power take-off systems exist but a linear direct-drive permanent-magnet (PM) generator is a common solution and has previously been studied by different research teams, such as in [2,3,4,5]. At Uppsala University, a concept with a point-absorbing buoy and a direct-drive PM generator has been studied for 15 years [4]. Linear PM generators most commonly have magnets made of rare-earth metals [6], but generators with ferrite magnets have also been studied [7] and tested experimentally [8]. Advantages with PM generators are that you do not need to magnetize the rotor externally, through the magnetizing current in the stator or by directly magnetizing the rotor and therefore do not have any copper losses associated with the rotor. A disadvantage is that the magnetization is fixed and cannot be controlled. In this paper, the design of the moving part, commonly called translator, is not considered and it is only represented by a magnetic flux density amplitude in the generator airgap.
Different generations of linear generators for wave power have been built by Uppsala University and a generator that has been designed, installed and tested is used as a reference design in this work [9,10]. There are a limited number of pervious papers on linear generator design optimization and design choices. A comparison of different design aspects was presented in 2006 [4] for the same generator concept as in this study. That study was performed with FEM simulations for diode rectification and therefore focused on different aspects than this study. A design optimization including a cost estimation of a slotless tubular linear generator with longitudinal flux can be found in [11]. Reference [12] presented an optimization study of a generator design for no-load operation but did not motivate how different design choices depend on each other. In [13], the performance of linear PM generators with different pole pitch is compared. In [14], constant-torque-angle (CTA) control is implemented for a wave energy converter with a rotating 248-pole generator. To the author’s knowledge, no previous study has been performed on how to optimize the generator design for CTA control including a thorough investigation on how different parameters affect the performance.
CTA control is a common choice for generators, and it is commonly implemented with PI-controllers and dq-transformation. CTA control has previously been implemented in wave energy converters. In [14] it is shown how CTA control can be implemented with PI regulators for a wave energy converter with rotating generator. In [15], a control system for an active rectifier with CTA control for a linear generator is simulated and verified experimentally. In [16], a different control system with active control of a PM linear generator is presented.
Designing a generator is a task with many degrees of freedom and is therefore very complex and normally time-consuming. For a complete generator design, a full-physics simulation is always needed, usually performed by solving Maxwell’s equations in a two-dimensional finite element method (FEM) simulation and taking important three-dimensional effects into account, as presented in [17]. However, to understand how different parameters affect each other a simpler approach may be used, as in this paper, where combining Faraday’s law of induction and CTA control simplifies equations and makes it possible to draw some interesting conclusions regarding linear generator design without computationally heavy simulations. The main simplification in this comparative study is that no saturation is taken into account. This will especially influence results at high loading and lead to an overestimation of the maximum damping force. However, the approximation of the damping force can be used to compare different generator designs.
The aim is of this study is, first, to present a fast computational method for comparing generator designs, where the generator design is adapted for a certain control strategy and, second, to gain increased understanding of how different design parameters influence the generator performance and to compare different generator designs. The evaluation is mainly performed based on three aspects; efficiency, maximum damping force, and relative material cost. Analytical derivations on generator performance and losses during CTA control, are presented. The equations have been implemented in MATLAB and the simulation method is verified through FEM simulations and experiments. A parameter study on linear generator design is performed and different generator designs are compared from different aspects.
2. Linear Generators
PM direct-drive linear generators for wave power commonly consist of a stator with steel and conductors and a PM covered translator directly connected to the point absorber. A large generator is needed due to the low speed. How large it needs to be is an economical trade-off between generator size and cost and on if the energy in the large, less common waves is worthwhile to capture. A linear generator operates at continuously varying speed as the generator changes direction twice per wave period. In addition, the speed will vary with the wave climate. When comparing different generator designs, a fixed speed is commonly used but variable speed operation needs to be considered.
One of the main differences between a conventional rotating generator and a direct-drive linear generator for wave power is that the stator height and translator height of the linear generator depends on the wave climate at the particular site, whereas the diameter of a rotating generator usually is a free design parameter. The translator is usually longer than the stator but depending on the wave height, the translator might for short periods of time partly leave the stator giving a partial stator-translator overlap [8]. The free stroke length of the translator, which is a function of the length difference between the translator and the stator, should be adapted to the wave climate at the particular site.
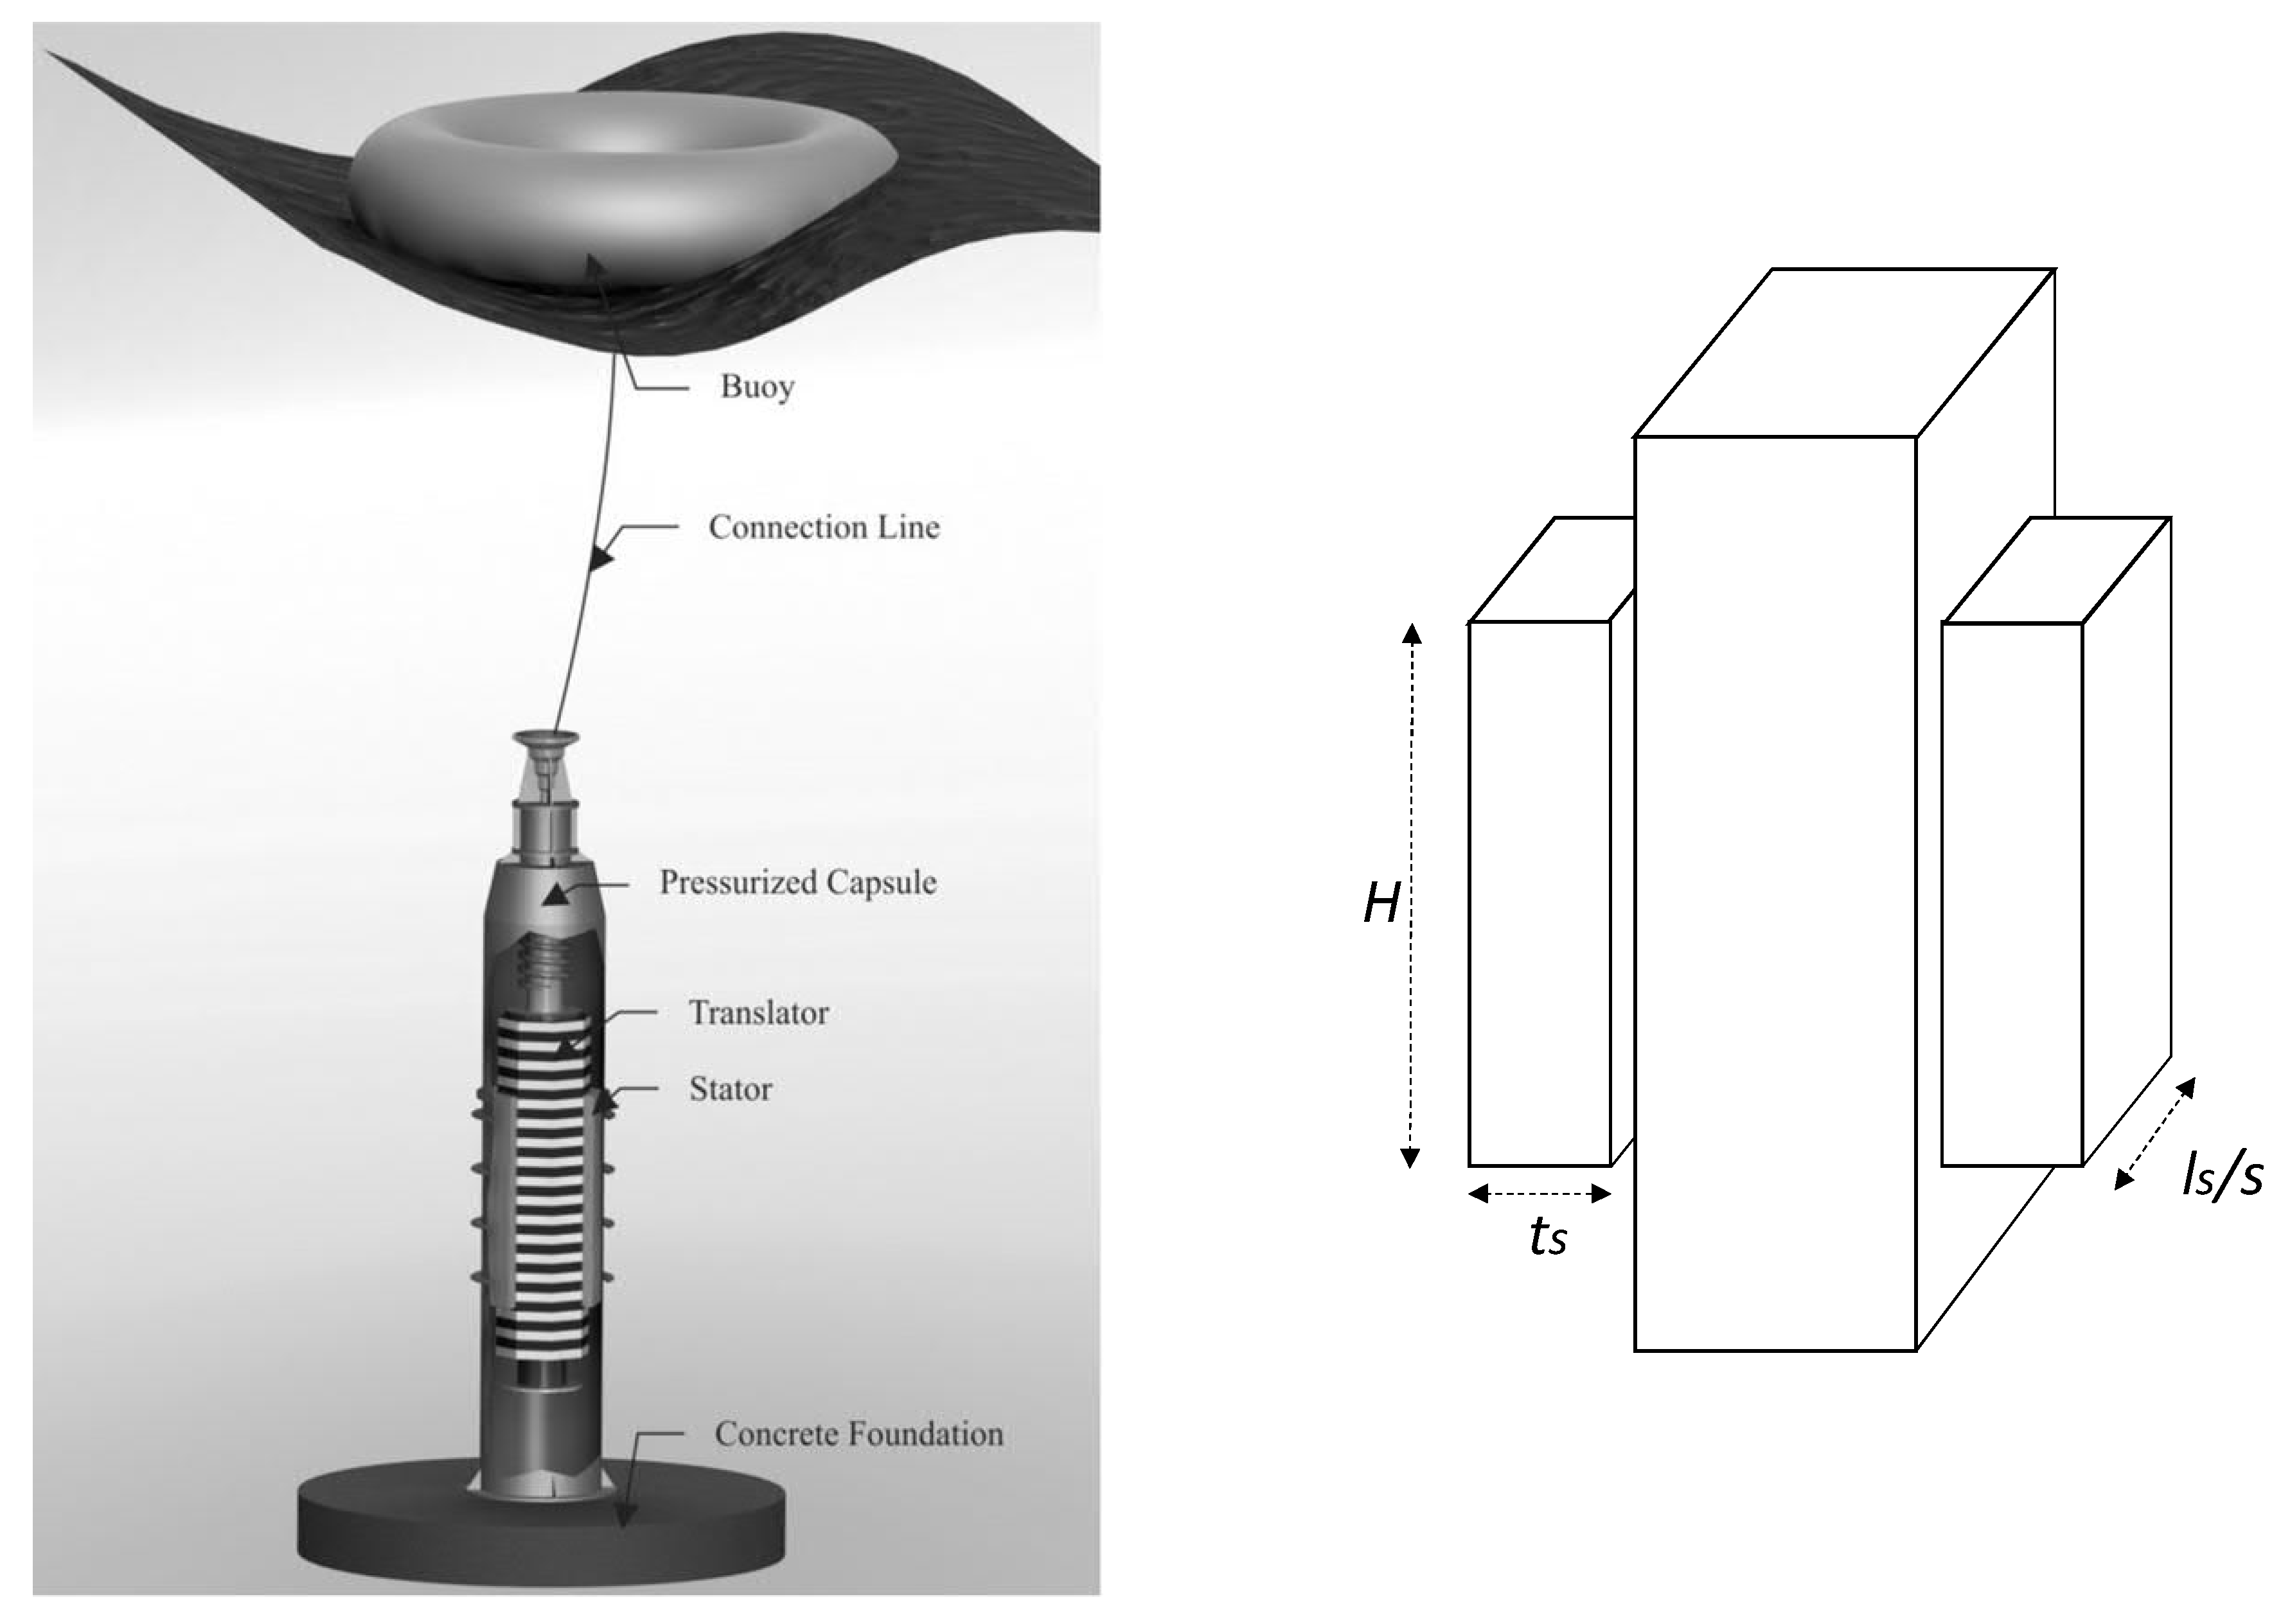
A sketch of the wave energy converter concept investigated at Uppsala University is shown in Figure 1 [18], together with an example geometry of a linear generator with geometrical parameters for the stator defined.
The electromagnetic force in tangential direction in the airgap of the generator is in wave power usually referred to as the damping force. In certain hydrodynamic control strategies for wave energy converters, a high damping force is crucial.
Constant-Torque-Angle Control
There are several different ways to control a wave generator to obtain maximum power absorption from the waves. Most operational strategies involve controlling the damping force of the generator. This can electrically be done in different ways and the generator can either be connected to a passive or an active rectifier [19]. For an active rectifier the generator can be boosted with reactive power when necessary. This decreases the voltage drop in the generator since the angle between the electromotive force (emf) and the current is decreased. In this paper, CTA control is implemented since it decreases copper losses in the generator [20] which usually are quite large in a direct-drive linear generator for wave power. With constant-torque-angle control, a complete phase angle compensation is achieved and the load angle in the machine, , equals the phase angle, . In the dq-frame, the CTA control is equivalent to zero d-axis current. The CTA control is implemented by dq-transformation and implementation of a control system with several PI-controllers, see for instance [14,15]. In [15] experimental verification of a CTA-based control system for a linear machine is presented. The control system uses two PI regulators per phase for the pulse-width modulation-controlled rectifier and a linear encoder gives the position and the phase.
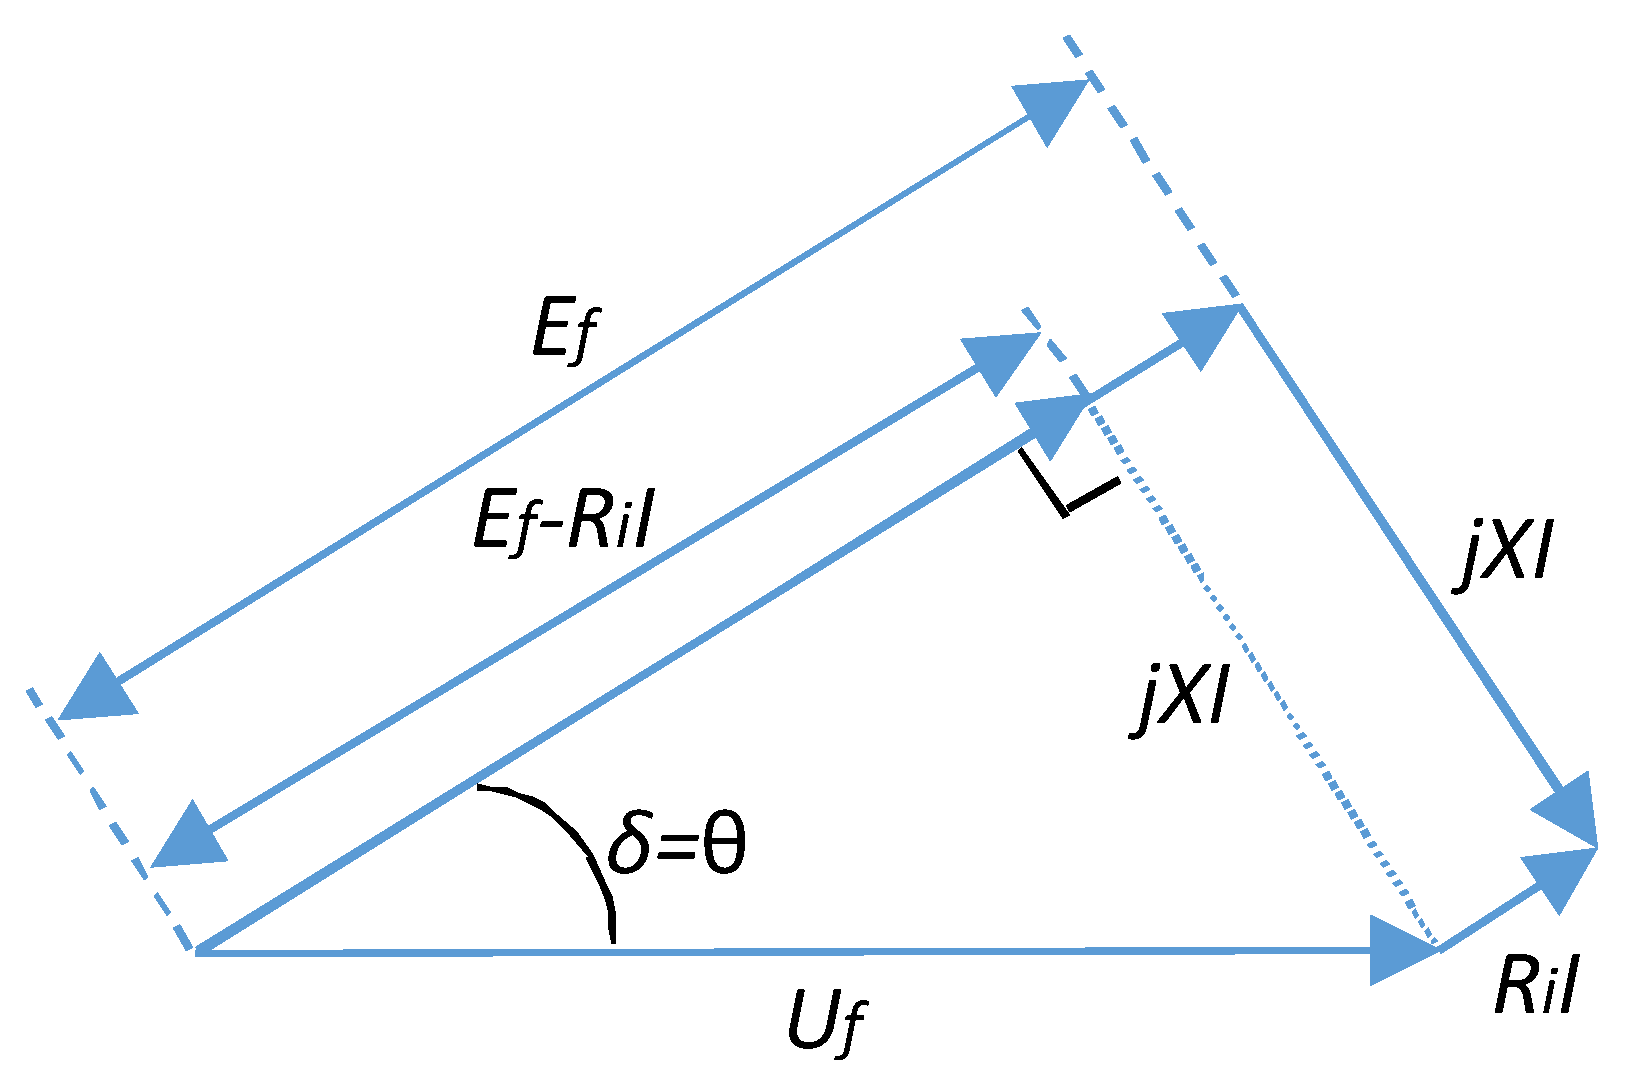
The phasor diagram for the phase equivalent for a non-salient synchronous generator with CTA control can be seen in Figure 2 where X is the machine reactance. The output phase voltage, , for a non-salient synchronous generator then becomes
where is the emf per phase, is the inner resistance and I is the current. The output power per phase, when the generator is run with CTA control, i.e., if becomes
where the first part is the generator power, and the second part constitutes the resistive losses, . Please note that and I above are amplitudes and not phasors as for the CTA control the angle between them is zero. For a generator with surface-mounted magnets, i.e., a non-salient machine, the CTA control is very similar to the Maximum Torque per Ampere (MTPA) control [20]. As the name of the latter indicates, the CTA control will give lower current for a certain torque/force and therefore minimize the copper losses. However, at high loading, when the stator steel becomes saturated, the CTA control will differ a little from the maximum torque (or force) per ampere control [21].
By assuming CTA control, calculations for output power and damping force can be simplified, as will be shown in Section 4. In addition, knowledge of the reactance of the generator or the load angle is not needed to analyze the operation of the generator. This is a nice feature since the reactance is more difficult to estimate for a generator than the resistance.
3. Generator Modelling
In this section, the different equations and simplifications used in the analytical derivations in Section 4 and in the simulations in Section 5, are motivated and introduced.
3.1. Induced Voltage and Current
Faraday’s law of induction can be used to derive the induced voltage in a generator. The derivation results in the following formula, sometimes referred to as the “Generator equation”, here adapted to a linear generator
where B is the amplitude of the magnetic flux density in the airgap, is the total stator length (equivalent to the axial length of a rotating generator), see Figure 1, p is the number of poles on the stator, v is the generator speed, and the number of effective turns per pole and phase, , is
where is the winding factor, q is the number of slots per pole and phase, is the number of conductors per slot and c is the number of parallel current paths per phase.
The pole pitch for a linear generator is
where H is the stator height. The translator is long enough to always be covered by the stator, i.e., there is no partial stator-translator overlap. The number of poles, p, here refers to the number of electric poles on the stator, as the translator is longer than the stator. Figure 3 shows a cross-section of approximately 3.5 pole pitches of a generator with and .
For a three-phase machine the slot pitch is . If the copper takes up 1/3 of the slot pitch and the rectangular conductor is twice the size in the radial direction as in the tangential, the area of the conductor, , becomes
For a current density of given in the current, I is
The total conductor length per phase in the generator, , is
where is the length of the end windings per half-turn. The copper losses per phase are
where is the inner resistance of the generator per phase and is the resistivity of copper at room temperature. The resistivity is strongly temperature dependent which will not be considered here. However, a large generator, with relatively low current density which is placed in sea water is not expected to reach very high temperatures.
3.2. Iron Losses and Efficiency
The iron losses consist mainly of eddy current losses, hysteresis losses and excess losses and depend on the magnetic flux density and frequency of the magnetic field in the stator steel as well as the stator steel volume [22]. To determine the stator steel volume, the thickness of steel, , in the radial direction (magnetic flux direction) must be known. Here, the stator yoke is assumed to have the length of the pole pitch divided by 4. The tooth length is dependent of the number of conductors per slot, , multiplied by the size of each conductor, and multiplied by 1.33 compensating for the fill factor in the radial direction. The tooth width is here set to half the slot pitch, so to get the average thickness of steel,, the tooth length is multiplied with 0.5.
The stator steel volume, , can then be calculated by multiplying the three dimensions of the assumed cubical stator and using the average thickness.
The iron losses can be calculated assuming typical steel used in generators of type M270-50A, with losses of 2.7 W/kg for a magnetic flux density of 1.5 T (www.cogent-power.com, retrieved 19 September 2018). An average magnetic flux density of 1.5 T in the whole stator is assumed. The density is 7600 kg/m. A frequency dependency for iron losses of has been extrapolated from results for low frequencies in [22]. In addition, the iron losses are multiplied with a loss correction factor of 1.5 when extrapolating from 50 Hz, as motivated in [22]. The iron losses then become
The electromagnetic efficiency, , of the generator is
It should be noted that usually is much smaller than . Here, mechanical losses are omitted as they are difficult to estimate and should be equal in different compared designs.
3.3. Cost Comparison
Generator cost is difficult to estimate as it depends on many different variables. Here, a simplified approach is used to calculate a relative cost for comparing different designs. The translator height is here assumed to vary with changing stator height, with the free stroke length kept constant at 1.998 m. Therefore, the variation of translator cost will both be dependent on and on (). The number of poles and number of conductors per slot will also slightly alter the magnet weight needed, but that effect is omitted here. For a design with ferrite magnets the magnet cost and weight is not so crucial, whereas it has a large impact on expensive magnets made of NdFeB. The translator body in a generator with low electrical frequency can be made of solid steel. The total generator cost is presented as a relative cost, normalized against the original design, see Section 5.1. Here, a conductor (copper) cost per kg three times higher than the cost per kg for stator steel is used as well as a translator cost of half of the stator cost for the original design. The density of copper is 8960 kg/m and the density of stator steel is 7600 kg/m. The relative cost is then calculated as
where is a normalization constant relating the generator cost to the original generator cost and is a normalization constant relating the translator cost to the cost of the stator for the original design.
4. Analytical Calculations
To find the output power of a generator where the induced voltage and current are known, the machine reactance or load angle is usually required. This complicates generator modelling and to get the exact value of the reactance a complete FEM simulation is required. Therefore, comparing many different generator designs becomes very time-demanding. In this section, the advantage of using CTA control is presented and expressions of the output power and the maximum damping force, independent of reactance and load angle, are derived.
4.1. Output Power for CTA Control
For CTA control the generator power per phase can be derived, according to (2)–(5) and (7) as
This expression shows that the output power from a generator run with CTA control can be found from only knowing the winding parameters and geometrical parameters of the generator and that the phase angle, load angle, or reactance can be unknown. This simplifies generator design and make design comparisons much more time-efficient.
For an operation scheme where q, c and are fixed design choices, B is a fixed value expected to be reached from the magnetic circuit and the rated speed v is fixed for a certain site, the expression can be simplified to
This expression shows which design parameters that can be varied to compare different generator designs and their output power. In the parameter study, in Section 6, the current density, the number of cables per slot and the geometrical variables , H and are varied.
4.2. Copper Loss Fraction
The relation between the copper losses and the power in the generator is a measure of the efficiency of the generator (if only copper losses are considered). It becomes
If the end windings are assumed related to the total stator length so that , the expression becomes
By assuming , the relation between copper losses and power mainly depends on the rated current density, which often is a design setting. A direct-drive slow-moving linear generator has inherently a large amount of copper losses and this derivation shows that it is not possible to optimize the design to decrease them. However, care should be taken to decrease the variable , i.e., the end winding length, as much as possible, since this is the part of the conductor which does not contribute to induced voltage. Please note that these relationships only are valid during CTA control. Other control strategies will not compensate for the voltage drop in the generator as efficiently and therefore the current will be higher for the same amount of power and the copper losses will constitute a larger part of the power.
If the end windings are supposed independent of the stator length and instead are assumed to be constant with a varying the result is different. For correct modelling, the length of the end windings should depend on the conductor area since the size of the conductors will determine the end winding length as well as the coil pitch length.
4.3. Maximum Damping Force
From the power equation for CTA control, (2), it can be found that the maximum output power from the generator per phase, is
The maximum output power is reached when the output power from the generator equals the power lost as copper losses, i.e., this is not a beneficial operating mode for the generator. The maximum power should be held below the maximum value to ensure stable operation of the generator. For the CTA control the maximum damping force for the three-phase generator, reached for the maximum output power, can be approximated as
or given as a per unit value based on the rated damping force as
which is an interesting result showing that increasing the efficiency and increasing the maximum damping force goes hand in hand, see also (17). This has to do with the fact that half the maximum damping force comes from copper losses and half becomes output power. The iron losses, which also contribute with damping force, are omitted here.
The calculations of the maximum damping force are approximations and does not take saturation into account, which could be expected at this operational mode. However, the values can be used for comparison between different design choices. The maximum damping force implies quite high current density and potentially high temperature. If the force is only required for short periods of time, this might be acceptable. Otherwise, the limiting factor for the maximum damping force for a CTA controlled PM generator is more likely thermal than the size of the inherent maximum damping force.
5. Simulation Method
5.1. The Original Generator Design
For the parameter study in this paper a given generator design is used as a starting point. The chosen generator has been designed, built, and tested offshore. Its main parameters are summarized in Table 1 and the generator and wave energy converter is further presented in [9,10]. The generator has surface-mounted magnets on the translator. The stator has circular conductors and is wound with multi-strand cables with a copper area of 25 mm. The generator has a surprisingly large inner resistance which affects the performance as discussed above. This is due to long end windings but probably also caused by connections of windings. Experimental results on output power for different wave climates for the original generator connected to a resistive load, are found in [23].
5.2. MATLAB Simulation Method
Simulations based on the formulas derived in Section 3 and Section 4, have been performed by using MATLAB. CTA control has been used for all simulations. The MATLAB simulation method used here can be used to compare different design choices to each other. However, it cannot substitute full-physics simulations with FEM. The original generator (see Section 5.1) has been used as a starting point for the simulations and to verify the simulation method.
In the design study, some design parameters have been kept fixed such as the magnetic flux density in the airgap, which is kept fixed at 0.75 T for all loading conditions. The generator design speed is 0.7 m/s. The number of slots per pole and phase, q, is a fixed design choice, usually between 1 and 3 for slow machines and preferably a fraction for a PM synchronous generator to decrease cogging. Here it is kept fixed at . The winding factor, , expected to be between 0.9 and 1 is kept at 1 for simplicity. The number of parallel current paths, c, is 1. Rectangular conductors, with twice the side length in the radial direction is considered instead of circular conductors, as in the original generator. A stacking factor of 1 is used for simplicity.
In the simulations it is assumed that the stator is always completely filled with translator, i.e., partial stator-translator overlap is not considered. The free stroke length is kept fixed at 1.998 m and the translator height for the original design is increased to 3.198 m, to ensure full stator-translator overlaps at all times. The translator height is set at m, and varies with changing H. The number of poles in the original design is 30 which is the number of electrical poles on a 1.2 m long stator with a pole pitch of 40 mm. However, in reality the translator is longer than the stator and has more poles than 30. In the parameter study, the number of poles, pole pitch, number of conductors per slot, stator length, stator height, and current density are varied. The inherent speed difference in a linear generator for wave power, is not considered in the comparative study, so simulations are performed at rated speed. However, additional simulations for an annual speed cycle is also performed to find the average efficiency.
The original generator was connected to a resistive load during experiments, which implies a power factor of 1. When the generator is run at the same speed and with the same current, the output power for the CTA control is 17.7 kW and with a resistive load 17.1 kW, i.e., the power output is higher with CTA control. To find the power for the resistive load, the inner inductance of 20 mH from Table 1 was used. If the CTA control is used on the same generator to get the power 17.1 kW, the copper losses decrease to of the losses for the same output power and resistive load.
The original generator has a surprisingly large inner resistance which affects the performance as discussed above. This is mainly caused by long end windings but probably also caused by connections of windings. By assuming that somewhat shorter end windings and more optimized connections can be used, the inner resistance can be decreased. Therefore, a slightly smaller inner resistance is used as a starting point for the parameter study here. The end windings are set to a fixed length of 0.8 m which might seem long but includes end windings of all four sides, which gives an inner resistance for the original generator with shortened end windings of 0.48 . The rated output power of the generator is then increased from 17.7 kW to 18.4 kW for CTA control. In the derivations it was convenient to let the end windings be a function of . However, in the parameter study the end windings are kept at the fixed value of 0.8 m for all cases.
5.3. Verification with FEM Simulations
The original generator design has been used as a basis for the MATLAB simulations. With a magnetic flux density in the airgap of 0.75 T in the simulations, all the parameters reached in the simulations match the original generator design parameters of Table 1 apart from the inductance, which is not included in the simulations.
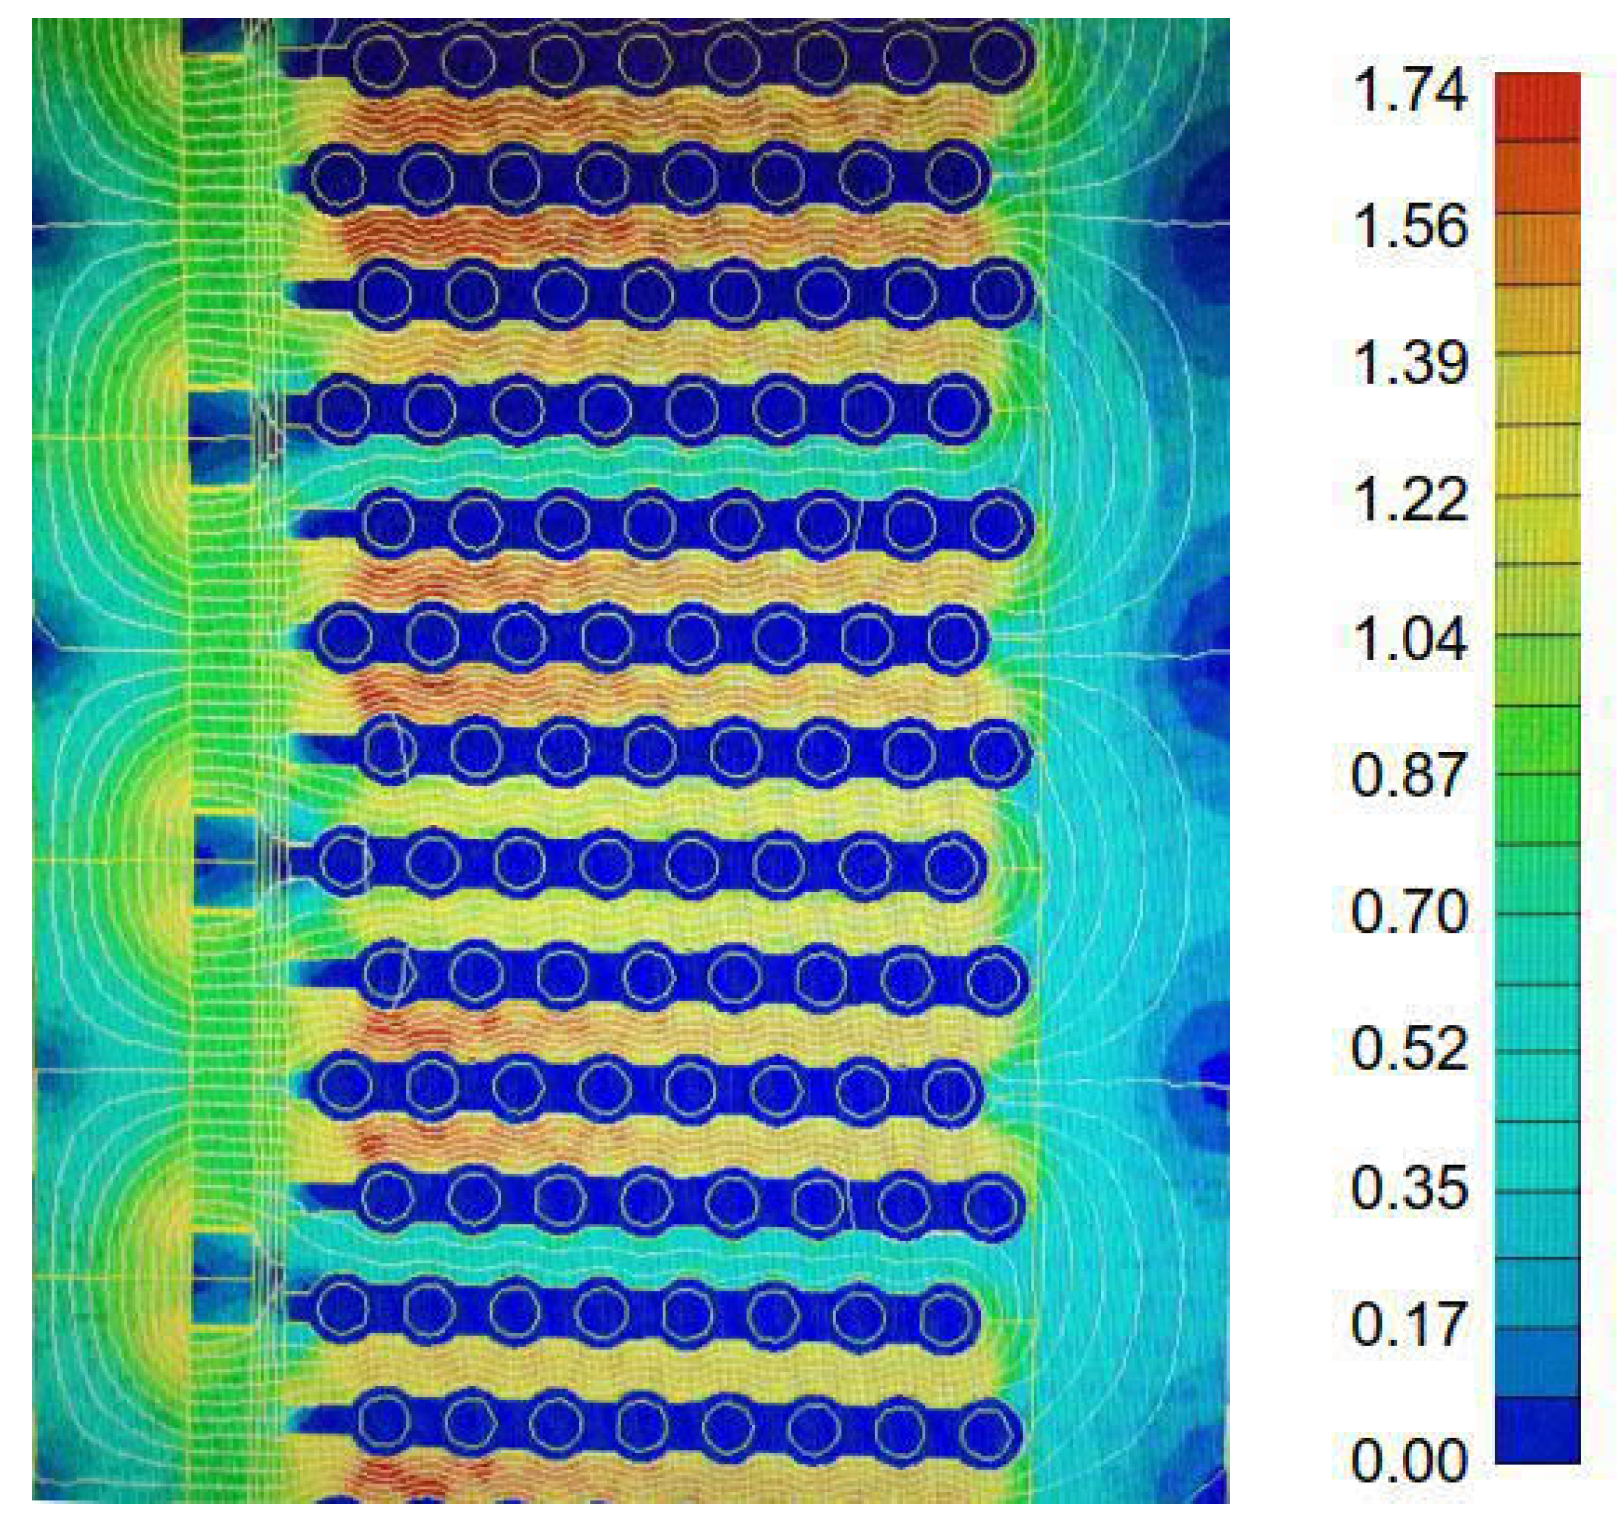
A simulation tool based on field equations coupled with circuit equations and solved with FEM has also been used for verification. The simulation method is further explained and has been experimentally verified for a rotating generator in [17]. A FEM simulation was performed for the original generator design. All geometrical parameters from Table 1 was inserted in the FEM program. The end winding length was adjusted to reach the inner resistance of 0.64 . The generator was run at rated speed and rated current density when connected to a resistive load. The rated voltage and power was achieved for the given generator dimensions. However, a slightly higher magnetic flux density amplitude in the airgap of 0.92 T was needed to achieve the rated voltage. In the MATLAB calculations the magnetic flux density was 0.75 T. Some simplifications in the MATLAB model are that the winding factor is set to 1, the stacking factor is set to 1, and that no saturation is taken account for. If the winding factor of 0.91 (for a q of 5/4) and a stacking factor of 0.96, is taken into account, the magnetic flux density in the calculations corresponds to 0.86 T, which is still slightly lower than the FEM simulations. This is a reasonable result as no leakage flux is included in the MATLAB simulations. To compensate for this, a higher magnetic flux density can be achieved by adding more PM material. The FEM simulations verified that no parts in the generator were saturated as the maximum magnetic flux density was 1.74 T and occurred in the stator teeth. Therefore, the MATLAB simulations have been verified against FEM simulations and gives acceptable results at least for a starting point for design work. However, FEM simulations are needed to account for all effects when designing a generator. The geometry and the magnetic flux density for the original generator from FEM simulations can be seen in Figure 3.
The main limitation with the presented simulation method is not including saturation in the calculations of the maximum damping force. Therefore, the maximum torque, from FEM simulations of a similar but larger generator as the one used here [24], of 200 kNm (3.1 p.u.) has been compared to circuit equation-based calculations of the maximum torque giving 219 kNm. The difference is so it can be assumed that the maximum damping force calculations presented here also are over-estimated with roughly , which gives an acceptable estimation.
5.4. Experimental Verification
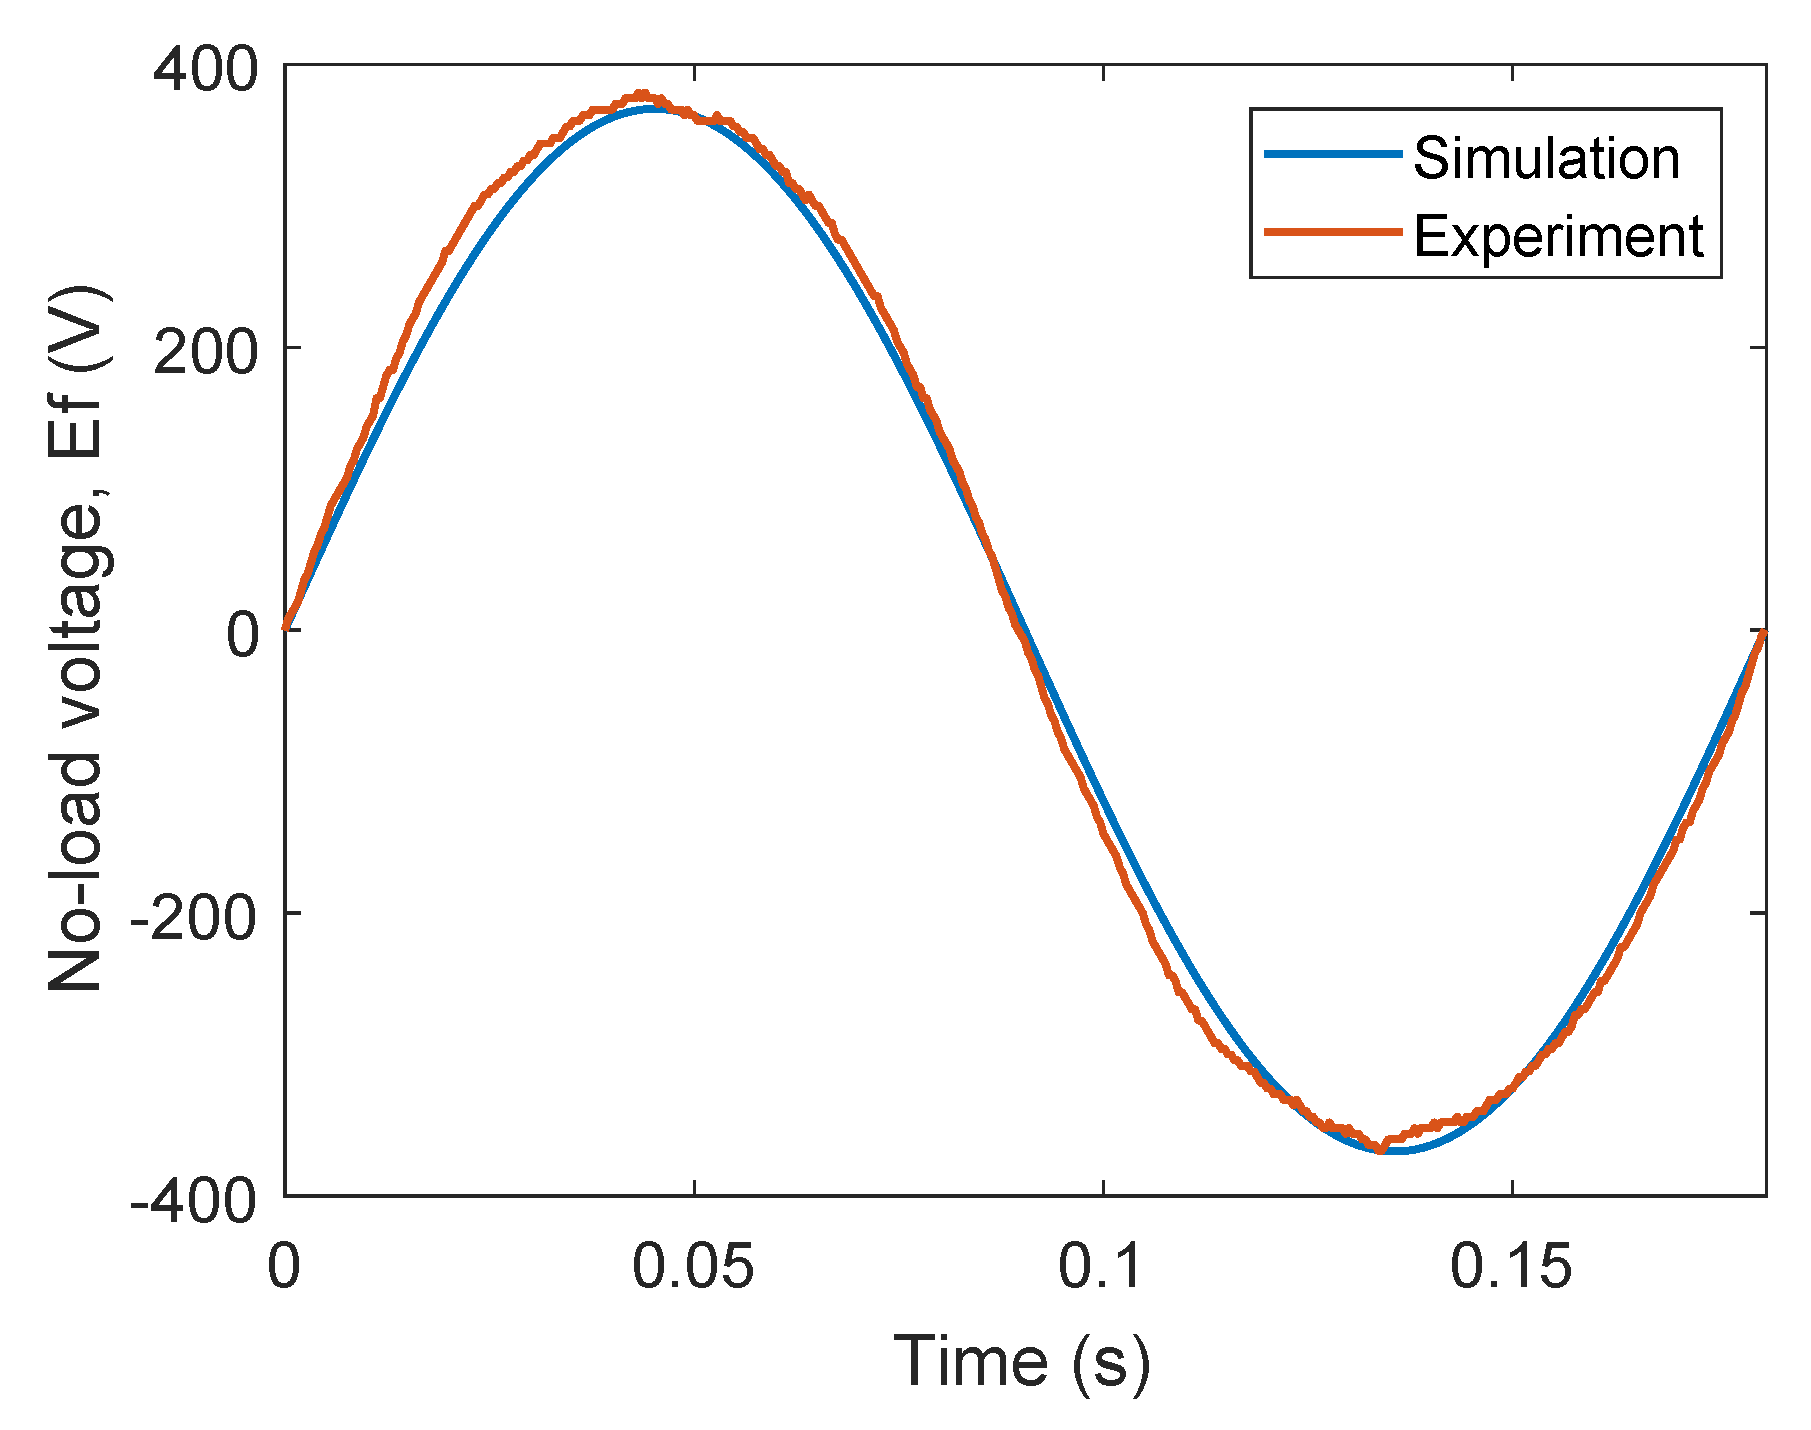
To verify the simulation method, the induced voltage at no load has been compared to measurements. The experiment was performed on a multi-pole, low speed rotating generator designed for a wind turbine and presented in [25]. The tested generator is similar to the tested linear generators studied here as it has a large diameter (so for one pole pitch it is close to linear), a low speed in the airgap and a relatively large number of conductors per slot, , of six. No changes in the simulations were needed to simulate the no-load voltage for a rotating generator instead of a linear generator. The magnetic flux density in the airgap was measured on the prototype and fitted very well with FEM simulations with an amplitude of the fundamental of 0.93 T [25]. The experimental generator is rated at 225 kW at 33 rpm corresponding to an electrical frequency of 9.9 Hz and an airgap speed of 3.5 m/s. It has a stator length of 0.884 m, a diameter of 2.054 m, 3.75 turns per pole and phase and 36 poles consisting of surface-mounted NdFeB-magnets. The stacking factor was measured in the prototype to 0.954 and the winding factor is calculated to 0.915. In the experiment, the rotational speed of the generator was lower than the rated speed. It was run with an electrical frequency of 5.5 Hz corresponding to a speed in the airgap of 2.0 m/s, which is closer to the operating frequency and speed of the linear generator. An oscilloscope (Tektronix TDS2014) and a high voltage probe (Tektronix P5120) were used to measure the voltage. The simulation was run with the properties of the experimental generator and gives a result as the rms value of the voltage at the given speed. The voltage has then been plotted as a sinusoidal signal with the simulated frequency.
The induced phase voltage at no load from the measurement and from the simulation are compared in Figure 4. The shapes of the curves are slightly different, which shows a limitation with the simulations, as only the fundamental of the voltage is considered. However, for a multi-pole machine with a fractional number of slots per pole and pitch, the harmonics are normally low and it can be seen that the results from experiment and simulation are quite similar. The experimental verification further validates the use of the method as a design comparison tool.
5.5. Variable Speed Operation
Waves are an inherently variable source of energy. To evaluate a generator design and to compare generators to each other, the generators should be run at variable speed and load, i.e., the annual energy absorption from the waves should be evaluated. Therefore, the average efficiency has been evaluated for different generator designs using wave data for a year.
Wave data was taken from Site 1 in Figure 3 in [26] presenting annual data of hours per year of a certain wave climate, i.e., as a function of energy period and significant wave height. The generator speed is assumed to vary sinusoidally with the wave frequency and the translator is assumed long enough for all waves. The energy flux in the waves is a function of the energy period and the significant wave height squared. The power into the generator is assumed directly proportional to the power from the waves, where the efficiency of the buoy absorption and the buoy size is adjusted to fit the rated power of the generator for an energy period of 5.5 s and a significant wave height of 1.925 m, which is one of the wave climates that contributes with the most energy during one year for this particular site.
6. Parameter Study
A parameter study has been performed and the effect of a few different parameters on the generator performance has been evaluated. All designs are based on the original generator design, see Section 5.1, with decreased end winding length at a fixed value of 0.8 m and a rated power of 18.4 kW. A comparison has been made based on efficiency, maximum damping force, and relative cost. In the wave power generator presented in [9], the number of conductors per slot, is 8, whereas for large synchronous generators is usually 2. Therefore, the influence of different values for on the generator design, has been studied. In addition, the other parameters affecting the power from Equation (16) are varied, i.e., the generator height, number of poles, pole pitch, and current density. For all changed parameters, the stator length, is adjusted to reach a rated power of 18.4 kW.
In Table 2, the effect of varying different parameters for six different generators with the same rated power is shown. Two generators with different and but the same power level is compared in Table 2, Case 1 and 3, showing that increasing the stator length gives a much higher cost. Case 2 represents a case where has been halved but the increase in stator length and cost are not as extreme as in Case 3 due to fewer poles.
The rated efficiency and the annual average efficiency, , for a specific site are also compared for the six generators in Table 2. The average efficiency was found from the method described in Section 5.5 . It can be seen that the average efficiency for all cases are much lower than the rated efficiency. However, when comparing the generators, it is seen that the generator with the highest rated efficiency has the highest average efficiency, so the rated efficiency seems to be an acceptable parameter for comparing the generators. For the original generator design, Case 1, the mean output power is 3.89 kW for the particular site considered.
Figure 5 shows the effect of varying and simultaneously to achieve the same output power of 18.4 kW. It can be seen that the cost and required total stator length, is decreased with increasing number of cables per slot. However, the maximum damping force is also decreasing with increasing number of cables per slot. The efficiency appears constant but is actually slowly decreasing with increasing number of cables. It is shown that only using one cable per slot is probably unrealistic both from a space and cost perspective.
Figure 6 shows how changing the stator height affects the generator. Changing the stator height will also change the translator height so it has a quite large effect on the generator volume and therefore on the relative cost. In the left figure the pole pitch is fixed so the number of poles is adjusted to the stator height. In the right figure the number of poles is kept constant at 30 so the pole pitch is adjusted to the new stator height. It can be seen that varying the pole pitch has a larger effect on the generator. A minimum value can be seen for the relative cost at a stator height of about 1.5 m giving a pole pitch of 50 mm.
Figure 7 shows the effect of changing the number of poles and therefore also the pole pitch since the stator height is fixed. The relative cost has a clear minimum for about 18 poles. However, the efficiency has decreased quite a lot for this case, so it is not recommended to minimize the relative cost in this case. A minimum is also present if studying the ratio of maximum damping force to relative cost, which is a common design parameter to choose for optimization. None of the changes studied so far has any significant impact on the efficiency as was also shown in the analytical derivations. Figure 8 shows the effect of changing the rated current density and adjusting the stator length to reach the same rated power. As previously discussed, the efficiency decreases almost linearly with increased rated current density. The maximum damping force and cost decreases even faster with increasing current density. From this figure, it can be seen that the design is a trade-off between decreasing the cost and increasing both the efficiency and the maximum damping force. Case 5 in Table 2 shows an example with increased rated current density comparable to the original design, giving lower cost but much lower efficiency and lower maximum damping force. Case 6 in Table 2 shows a generator with increased stator height and fewer poles. It has a relative cost comparable to the original design, Case 1, but the efficiency and maximum damping force are lower. From Table 2 it can be concluded that Case 1, i.e., the original design with slightly shorter end windings, is a quite good design with a high efficiency, a large maximum damping force and a low cost compared to most of the other cases.
In this study, design aspects have been compared for operation at rated speed. This is not the case for a linear generator where the speed is continuously changing. Apart from comparing different parameters as in this study, a study for a proposed design must be tested at different speed and loading situations. Figure 9 shows the maximum damping force and efficiency for varying speed as an example of variable speed operation for the original generator design. How the efficiency changes with varying speed depends on how the generator is controlled and in this example the generator is run with the damping force increasing linearly with increasing speed. The copper losses constitute 87% of the total losses in the original design for rated speed of 0.7 m/s and clearly dominate the losses in all studied designs. However, at very low speed the iron losses will dominate, and the efficiency therefore drops fast, as seen in Figure 9.
7. Discussion
The results in this study have shown the effect different variables have on performance of the generator, which is valuable for generator design. For a complete design work the generator behavior should be analyzed for variable speed and for the specific wave climate expected as well as for specific requirements on damping force. Partial stator-translator overlap was not considered here and geometrical constraints on for instance the stator length, have not been considered.
The comparison shows that the original design performs quite well. However, this design with eight conductors per slot has quite deep slots which might increase leakage flux and give somewhat lower magnetic induction for the conductors in the bottom of the slot. These issues should be studied in a FEM simulation as the MATLAB calculations omit all such effects.
As the generator is operated with CTA control, the voltage needs to be boosted by the electrical system. This places demand on the electrical system and its rating. The rated current varies a lot between the different generators presented in Table 2. In this study, thermal issues have not been considered. To reach the theoretical maximum damping force, a high current is needed, and the associated high copper losses will temporarily heat the generator. Therefore, this type of operation should be time limited for a passively cooled generator or carefully controlled by a cooling system. The maximum force will also be affected by saturation which has been omitted here for simplification.
The MATLAB simulations gave the same results as the original generator design when a magnetic flux density in the airgap of 0.86 T was used and the stacking factor and winding factor was taken into account. The magnetic flux density required in the FEM simulations was 0.92 T. This is an acceptable result since no saturation or leakage flux in the stator are taken into account in the simplified MATLAB simulations. The experimental verification showed only a small voltage difference between the simulation and measurement. However, as only the fundamental of the voltage signal is considered in the model, the method is only suitable for generators expected to have a quite sinusoidal induced voltage.
The average efficiencies are lower than the rated efficiencies, but they follow the rated efficiencies when comparing the generators, i.e., the generator that has the highest rated efficiency also has the highest average efficiency. This means that the rated efficiency is an acceptable parameter to use when comparing designs, even though variable speed operation also must be considered. The efficiency for the design with the higher rated current density decreases the most when operated at variable speed. This gives one more indication of that the rated current density is one of the most important design parameters.
8. Conclusions
A novel simulation method for design comparison of direct-drive linear generators run with CTA control has been presented. The simulation method enables generator designers to quickly evaluate many different design parameters before deciding on a design to further investigate through more time-demanding FEM simulations. A tool such as this is especially useful in the field of linear generator design for wave power as no consensus exists on how to optimize these machines. It can be concluded that the CTA control simplifies the analytical expressions so the efficiency, maximum damping force, and relative cost for the generator can be analyzed without knowledge of the reactance or load angle. The simulation method has been verified against FEM simulations and experiments. The maximum damping force is over-estimated since saturation is neglected, for one example roughly which is still acceptable for design comparison. The fast simulation method can be used for design evaluation and comparison but cannot replace full-physics simulations of generators during design.
An expression of the copper loss to output power quotient has been derived. It shows that for CTA control the quotient is only dependent on airgap magnetic flux density, translator speed, current density, and the quotient between end winding length and stator length. A slow-moving direct-drive synchronous generator has inherently high copper losses and it was shown difficult to make design choices to decrease these substantially. Only decreasing the current density or shortening the end windings can decrease the copper losses. The amount of copper losses also affects the achievable maximum damping force. Therefore, special consideration should be taken to design and production technology to decrease the end winding length as much as possible. A low rated current density gives a large generator. The generator design is therefore a trade-off between cost versus high efficiency and high maximum damping force. It can be concluded that the desired maximum damping force should be considered early in the design stage of the generator.
The parameter study showed that the original generator design, used as a basis in the simulation, represents a quite good design for a PM linear generator for wave power. It can be concluded that a design with a minimized relative cost can be found. However, the low cost might be chosen at the expense of efficiency and damping force. The pole pitch and the rated current density were shown to affect the studied parameters quite a lot, so care should be taken to optimize those parameters when designing a generator. The results indicate that rated speed is acceptable when comparing the efficiency for different generator designs. It will not represent the average efficiency but it can be used for comparison.
As future work it is suggested to include the magnetic circuit in the simulations, preferably as a reluctance circuit. Generator designs with different magnet materials such as ferrite magnets and rare-earth metal-based magnets could be compared. In addition, a more advanced economical model coupled to the annual energy output could be included in the simulations.
Funding
This research was supported by the Swedish Energy Agency grant number 42243-1, Carl Trygger Foundation grant number 15:152 and STandUP for Energy.
Acknowledgments
The author gratefully acknowledges the contribution of Arne Wolfbrandt and Urban Lundin for developing the FEM simulation tool.
Conflicts of Interest
The author declares no conflict of interest. The founding sponsors had no role in the design of the study; in the collection, analyses, or interpretation of data; in the writing of the manuscript, and in the decision to publish the results.
Abbreviations
The following abbreviations are used in this manuscript:
| CTA | Constant-torque-angle |
| EMF | Electromotive force |
| FEM | Finite element method |
| PI | Proportional Integral |
| PM | Permanent-magnet |
References
- Ozkop, E.; Altas, I.H. Control, power and electrical components in wave energy conversion systems: A review of the technologies. Renew. Sustain. Energy Rev. 2017, 67, 106–115. [Google Scholar]
- Polinder, H.; Damen, M.E.C.; Gardner, F. Linear PM Generator system for wave energy conversion in the AWS. IEEE Trans. Energy Convers. 2004, 5, 583–589. [Google Scholar] [CrossRef]
- Hodgins, N.; Keysan, O.; McDonald, A.S.; Mueller, M.A. Design and Testing of a Linear Generator for Wave-Energy Applications. IEEE Trans. Ind. Electron. 2012, 59, 2094–2103. [Google Scholar] [CrossRef]
- Danielsson, O.; Eriksson, M.; Leijon, M. Study of a longitudinal flux permanent magnet linear generator for wave energy converters. Int. J. Energy Res. 2006, 30, 1130–1145. [Google Scholar] [CrossRef]
- Piscopo, V.; Benassai, G.; Morte, R.D.; Scamardella, A. Cost-Based Design and Selection of Point Absorber Devices for the Mediterranean Sea. Energies 2018, 11, 946. [Google Scholar] [CrossRef]
- Faiz, J.; Nematsaberi, A. Linear permanent magnet generator concepts for direct-drive wave Energy converters: A comprehensive review. In Proceedings of the 12th IEEE Conference on Industrial Electronics and Applications (ICIEA), Siem Reap, Cambodia, 18–20 June 2017; pp. 618–623. [Google Scholar]
- Leijon, J.; Sjölund, J.; Ekergård, B.; Boström, C.; Eriksson, S.; Temiz, I.; Leijon, M. Study of an Altered Magnetic Circuit of a Permanent Magnet Linear Generator for Wave Power. Energies 2018, 11, 84. [Google Scholar] [CrossRef]
- Frost, A.E.; Ulvgård, L.; Sjökvist, L.; Eriksson, S.; Leijon, M. Partial Stator Overlap in a Linear Generator for Wave Power: An Experimental Study. J. Mar. Sci. Eng. 2017, 5, 53. [Google Scholar] [CrossRef]
- Strömstedt, E.; Savin, A.; Heino, H.; Antbrams, K.; Haikonen, K.; Götschl, T. Project WESA (Wave Energy for a Sustainable Archipelago)—A Single Heaving Buoy Wave Energy Converter Operating and Surviving Ice Interaction in the Baltic Sea. In Proceedings of the 10th European Wave and Tidal Conference (EWTEC), Aalborg, Denmark, 2–5 September 2013. [Google Scholar]
- Lejerskog, E.; Strömstedt, E.; Savin, A.; Boström, C.; Leijon, M. Study of the operation characteristics of a point absorbing direct driven permanent magnet linear generator deployed in the Baltic Sea. IET Renew. Power Gener. 2016, 10, 1204–1210. [Google Scholar] [CrossRef]
- Parel, T.S.; Rotaru, M.D.; Sykulski, J.K.; Hearn, G.E. Optimisation of a tubular linear machine with permanent magnets for wave energy extraction. COMPEL Int. J. Comput. Math. Electr. Electron. Eng. 2011, 30, 1056–1068. [Google Scholar] [CrossRef]
- Rao, K.R.; Sunderan, T.; Adiris, M.R. Performance and design optimization of two model based wave energy permanent magnet linear generators. Renew. Energy 2017, 101, 196–203. [Google Scholar] [CrossRef]
- Shibaike, A.; Sanada, M.; Morimoto, S. Suitable Configuration of Permanent Magnet Linear Synchronous Generator for Wave Power Generation. In Proceedings of the 2007 Power Conversion Conference, Nagoya, Japan, 2–5 April 2007; pp. 210–215. [Google Scholar]
- Ngu, S.S.; Dorrell, D.G.; Cossar, C. Design and Operation of Very Slow Speed Generators for a Bristol Cylinder Sea Wave Generating Device. IEEE Trans. Ind. Appl. 2014, 50, 2749–2759. [Google Scholar] [CrossRef] [Green Version]
- Cancelliere, P.; Marignetti, F.; Colli, V.D.; Stefano, R.D.; Scarano, M. A tubular generator for marine energy direct drive applications. In Proceedings of the IEEE International Conference on Electric Machines and Drives, San Antonio, TX, USA, 15–18 May 2005; pp. 1473–1478. [Google Scholar]
- Wu, F.; Zhang, X.P.; Ju, P.; Sterling, M.J.H. Optimal Control for AWS-Based Wave Energy Conversion System. IEEE Trans. Power Syst. 2009, 24, 1747–1755. [Google Scholar]
- Eriksson, S.; Solum, A.; Bernhoff, H.; Leijon, M. Simulations and experiments on a 12 kW direct driven PM synchronous generator for wind power. Renew. Energy 2008, 33, 674–681. [Google Scholar] [CrossRef]
- Lejerskog, E.; Leijon, M. Detailed Study of Closed Stator Slots for a Direct-Driven Synchronous Permanent Magnet Linear Wave Energy Converter. Machines 2014, 2, 73–86. [Google Scholar] [CrossRef] [Green Version]
- Ekström, R.; Ekergård, B.; Leijon, M. Electrical damping of linear generators for wave energy converters—A review. Renew. Sustain. Energy Rev. 2014, 42, 116–128. [Google Scholar] [CrossRef]
- Purwadi, A.; Hutahaean, R.; Rizqiawan, A.; Heryana, N.; Heryanto, N.A.; Hindersah, H. Comparison of maximum torque per Ampere and Constant Torque Angle control for 30 kW Interior Interior Permanent Magnet Synchronous Motor. In Proceedings of the Joint International Conference on Electric Vehicular Technology and Industrial, Mechanical, Electrical and Chemical Engineering, Surakarta, Indonesia, 4–5 November 2015; pp. 253–257. [Google Scholar]
- Polinder, H.; Slootweg, J.G.; Hoeijmakers, M.J.; Compter, J.C. Modeling of a linear PM Machine including magnetic saturation and end effects: Maximum force-to-current ratio. IEEE Trans. Ind. Appl. 2003, 39, 1681–1688. [Google Scholar] [CrossRef]
- Bülow, F.; Eriksson, S.; Bernhoff, H. No-load core loss prediction of PM generator at low electrical frequency. Renew. Energy 2012, 43, 389–392. [Google Scholar] [CrossRef]
- Savin, A.; Temiz, I.; Strömstedt, E.; Leijon, M. Statistical analysis of power output from a single heaving buoy WEC for different sea states. Mar. Syst. Ocean Technol. 2018, 13, 103–110. [Google Scholar] [CrossRef]
- Eriksson, S.; Bernhoff, H. Rotor design for PM generators reflecting the unstable neodymium price. In Proceedings of the 2012 XXth International Conference on Electrical Machines, Marseille, France, 2–5 September 2012; Volume 33, pp. 1419–1423. [Google Scholar]
- Eriksson, S.; Bernhoff, H.; Leijon, M. A 225 kW Direct Driven PM Generator Adapted to a Vertical Axis Wind Turbine. Adv. Power Electron. 2011, 2011, 239061. [Google Scholar] [CrossRef]
- Waters, R.; Engström, J.; Isberg, J.; Leijon, M. Wave climate off the Swedish west coast. Renew. Energy 2009, 34, 1600–1606. [Google Scholar] [CrossRef]
Figure 1.
Left: Sketch of the wave energy converter concept from [18] licenced under CC BY 3.0 https://creativecommons.org/licenses/by/3.0. Right: Sketch of linear generator geometry. The figure shows two out of four sides of the generator stator and the geometrical parameters of the stator. The translator is in the middle and moves up and down. H denotes stator height, the total stator length, the stator thickness and s the number of stator sides.

Figure 2.
Phasor diagram for a non-salient synchronous generator with CTA control.

Figure 3.
Field plot of the generator based on the original design from a FEM simulation, showing magnetic flux density in Tesla.
Figure 3.
Field plot of the generator based on the original design from a FEM simulation, showing magnetic flux density in Tesla.

Figure 4.
Comparison of results from the simulation method and from experiments. Data from experiments are reused from [25] licenced under CC BY 3.0 https://creativecommons.org/licenses/by/3.0/.
Figure 4.
Comparison of results from the simulation method and from experiments. Data from experiments are reused from [25] licenced under CC BY 3.0 https://creativecommons.org/licenses/by/3.0/.

Figure 5.
Stator length, maximum damping force in per unit, efficiency and relative cost for the original generator design with varied number of conductors per slot, and an adjusted stator length, to achieve an output power of 18.4 kW.
Figure 5.
Stator length, maximum damping force in per unit, efficiency and relative cost for the original generator design with varied number of conductors per slot, and an adjusted stator length, to achieve an output power of 18.4 kW.

Figure 6.
Stator length, maximum damping force in per unit, efficiency and relative cost for the original generator design with varied stator height, H and an adjusted stator length, to achieve an output power of 18.4 kW. Left figure: The pole pitch is fixed. Right figure: The number of poles is fixed, so the pole pitch varies.

Figure 7.
Stator length, maximum damping force in per unit, efficiency and relative cost for the original generator design with varied number of poles, p and an adjusted stator length, to achieve an output power of 18.4 kW.
Figure 7.
Stator length, maximum damping force in per unit, efficiency and relative cost for the original generator design with varied number of poles, p and an adjusted stator length, to achieve an output power of 18.4 kW.

Figure 8.
Stator length, maximum damping force in per unit, efficiency and relative cost for the original generator design with different values of the rated current density, and an adjusted stator length, to achieve an output power of 18.4 kW.
Figure 8.
Stator length, maximum damping force in per unit, efficiency and relative cost for the original generator design with different values of the rated current density, and an adjusted stator length, to achieve an output power of 18.4 kW.

Figure 9.
Maximum damping force and efficiency for different speeds for the original generator design operated with CTA control. The efficiency is here shown for a generator run with the damping force increasing linearly with increasing speed.
Figure 9.
Maximum damping force and efficiency for different speeds for the original generator design operated with CTA control. The efficiency is here shown for a generator run with the damping force increasing linearly with increasing speed.


| Parameter | Value |
|---|---|
| Speed (m/s) | 0.70 |
| Stator height, H (m) | 1.2 |
| Translator height (m) | 2.1 |
| Free stroke length (m) | 2.0 |
| Number of sides, s | 4 |
| Stator side length (m) | 0.4 |
| Total stator length, (m) | 1.6 |
| Pole pitch, (mm) | 40 |
| Conductors per slot, | 8 |
| Electrical frequency, (Hz) | 8.8 |
| Current density, (A/mm) | 1.52 |
| Inner resistance, () | 0.64 |
| Inner inductance (mH) | 20 |
| Output power, (kW) | 17.1 |
| Voltage L-L (V) | 257 |
| Current, I (A) | 38.4 |
| Number of phases | 3 |
| Load | Resistive |
Table 2.
Comparison of six different generators.
| Case | 1 | 2 | 3 | 4 | 5 | 6 |
|---|---|---|---|---|---|---|
| Varied parameters | ||||||
| (m) | 1.60 | 2.32 | 3.14 | 1.70 | 1.92 | 1.07 |
| (m) | 8 | 4 | 4 | 4 | 2 | 6 |
| H (m) | 1.2 | 1.2 | 1.2 | 1.2 | 1.2 | 1.47 |
| p | 30 | 22 | 30 | 16 | 16 | 22 |
| (A/mm) | 1.52 | 1.52 | 1.52 | 1.52 | 3 | 1.52 |
| Resulting parameters | ||||||
| (kW) | 18.4 | 18.4 | 18.4 | 18.4 | 18.4 | 18.4 |
| (V) | 178 | 95 | 175 | 50 | 29 | 65 |
| I (A) | 38.4 | 71.5 | 38.4 | 135 | 267 | 107 |
| 88.4 | 89.7 | 89.8 | 89.2 | 80.3 | 87.3 | |
| 78.6 | 80.9 | 81.4 | 79.9 | 66.5 | 76.7 | |
| Rel. cost | 1 | 1.20 | 1.34 | 1.09 | 0.90 | 1.00 |
| (p.u.) | 4.8 | 5.4 | 5.8 | 4.9 | 2.6 | 4.2 |
© 2019 by the author. Licensee MDPI, Basel, Switzerland. This article is an open access article distributed under the terms and conditions of the Creative Commons Attribution (CC BY) license (http://creativecommons.org/licenses/by/4.0/).
Share and Cite
MDPI and ACS Style
Eriksson, S. Design of Permanent-Magnet Linear Generators with Constant-Torque-Angle Control for Wave Power. Energies 2019, 12, 1312. https://doi.org/10.3390/en12071312
AMA Style
Eriksson S. Design of Permanent-Magnet Linear Generators with Constant-Torque-Angle Control for Wave Power. Energies. 2019; 12(7):1312. https://doi.org/10.3390/en12071312
Chicago/Turabian StyleEriksson, Sandra. 2019. "Design of Permanent-Magnet Linear Generators with Constant-Torque-Angle Control for Wave Power" Energies 12, no. 7: 1312. https://doi.org/10.3390/en12071312
Note that from the first issue of 2016, this journal uses article numbers instead of page numbers. See further details here.